INSTITUTE OF MARINE SCIENCES MARINE GEOLOGY SECTION ...
28
NATIONAL RESEARCH COUNCIL OF ITALY INSTITUTE OF MARINE SCIENCES MARINE GEOLOGY SECTION (BOLOGNA) ITALIAN NATIONAL ANTARCTIC PROJECT JOINT RESEARCH PROJECT ”BOUVET TRIPLE JUNCTION” Coordinated by E.Bonatti GEOPHYSICAL AND GEOLOGICAL STUDIES IN THE BOUVET TRIPLE JUNCTION REPORT ON THE MORPHOBATHYMETRIC, GEOPHYSICAL, DREDGING AND OCEANOGRAPHICAL INVESTIGATIONS DURING CRUISE BVT96 ABOARD R/V GELENDZHIK Bortoluzzi G., Brunelli D., Carrara G., Fabretti P., Penitenti D., Terenzoni M. Ligi M. 1 Bertozzi F. 2 Peyve A., Skolotnev S., Turko N. 3 Gilod D. 4 Shirokozhukhov B. and CGGA team 5 Nikanorenkov D. and NIPIO team 6 Sushchevskaya N. 7 1 ISMAR-CNR, Bologna 2 PNRA-ENEA, Bologna 3 Geological Inst. Acad.Sciences, Moscow 4 Moscow State University 5 CGGA 6 NIPIO 7 VIG ISMAR Bologna INTERIM TECHNICAL REPORT Bologna, 1996
Transcript of INSTITUTE OF MARINE SCIENCES MARINE GEOLOGY SECTION ...
NATIONAL RESEARCH COUNCIL OF ITALYINSTITUTE OF MARINE SCIENCES
MARINE GEOLOGY SECTION (BOLOGNA)
ITALIAN NATIONAL ANTARCTIC PROJECT
JOINT RESEARCH PROJECT ”BOUVET TRIPLE JUNCTION”Coordinated by E.Bonatti
GEOPHYSICAL AND GEOLOGICAL STUDIES INTHE BOUVET TRIPLE JUNCTION
REPORT ON THE MORPHOBATHYMETRIC, GEOPHYSICAL,DREDGING AND OCEANOGRAPHICAL
INVESTIGATIONS DURING CRUISEBVT96 ABOARD R/V GELENDZHIK
Bortoluzzi G., Brunelli D., Carrara G.,Fabretti P., Penitenti D., Terenzoni M.
Ligi M. 1
Bertozzi F. 2
Peyve A., Skolotnev S., Turko N. 3
Gilod D. 4
Shirokozhukhov B. and CGGA team 5
Nikanorenkov D. and NIPIO team 6
Sushchevskaya N. 7
1 ISMAR-CNR, Bologna2 PNRA-ENEA, Bologna
3 Geological Inst. Acad.Sciences, Moscow4 Moscow State University
5 CGGA6 NIPIO
7 VIG
ISMAR Bologna INTERIM TECHNICAL REPORT
Bologna, 1996

Many of the designations used by the manufacturers and sellers to promote their products areclaimed as trademarks. Where those designation appear in the Report and ISMAR-CNR wasaware of a trademark claim the designations have been printed in all caps. In addition, we havereported some of them in the Production Notes below in this page and in the ACRONYM tablethereinafter. Nothing in this document is meant to imply any endorsement or recommendation,positive or negative, concerning any systems or programs mentioned herein. The data presentedhereafter is the property of CNR and of the Joint Research Program. Unauthorized use of the datawould be considered unfair. Many of the systems and programs used to generate data are ‘free’because either they are either public domain or the licences are roughly equivalent to the GNUPublic License. Some programs are either commercial or have more restrictive licenses and mayrequire payment. Where known, programs and systems that are not ‘free’ are acknowledged.
ISMAR-CNR Cataloging-In-Publication data: ISMAR Bologna INTERIM TECHNICAL RE-PORTReport on the morphobathymetric, geophysical, oceanographic, coring and dredging investigationsduring cruise BVT96 aboard R/V Gelendzhik. by Bortoluzzi G.
Includes bibliographical reference and index.1. tectonics 2. stratigraphy 3. paleoseismology 4. oceanography
Abstract - A summary of methodologies, technical details and ship-board results of the BVT96with R/V Gelendzhikis presented. Sommario - Vengono presentati le metodologie e l’insieme deirisultati ottenuti durante la campagna BVT96 di rilievi batimetrici, geologici e geoficisi nella zonadi giunzione tripla di Bouvet, Atlantico Meridionale. E’ stata utilizzata la nave da ricerca R/VGelendzhikdel CGGA.
Reproduced by ISMAR-CNR from camera-ready proofs supplied by the authors.Published in the WWW at marmara.bo.ismar.cnr.it and doc.bo.ismar.cnr.it. Available in theHTML and PDF formats. Available also in other formats, upon request.Hereafter a link to verbatim copy of this document (LATEX).
Copyright © 1996-2005 by ISMAR-CNR - Via Gobetti 101 40129 Bologna, Italy.Production Notes - The document was edited with standard text editors, typeset with L.Lamport’s LATEX,
translated to PostScript with dvips and printed with an A4 laser printer. The full production was done
on a Linux box with GNU-GPL software. Converted to HTML by N.Drakos’s LATEX2HTML and to PDF
by Alladin Ghostscripts’s ps2pdf. Most of the maps included were produced by Wessel and Smith’s GMT
package. Some drawings were produced by xfig (www.xfig.org). Non PostScript images were converted
by John Bradley’s xv or other public-domain packages, among them convert.
ACRONYMS
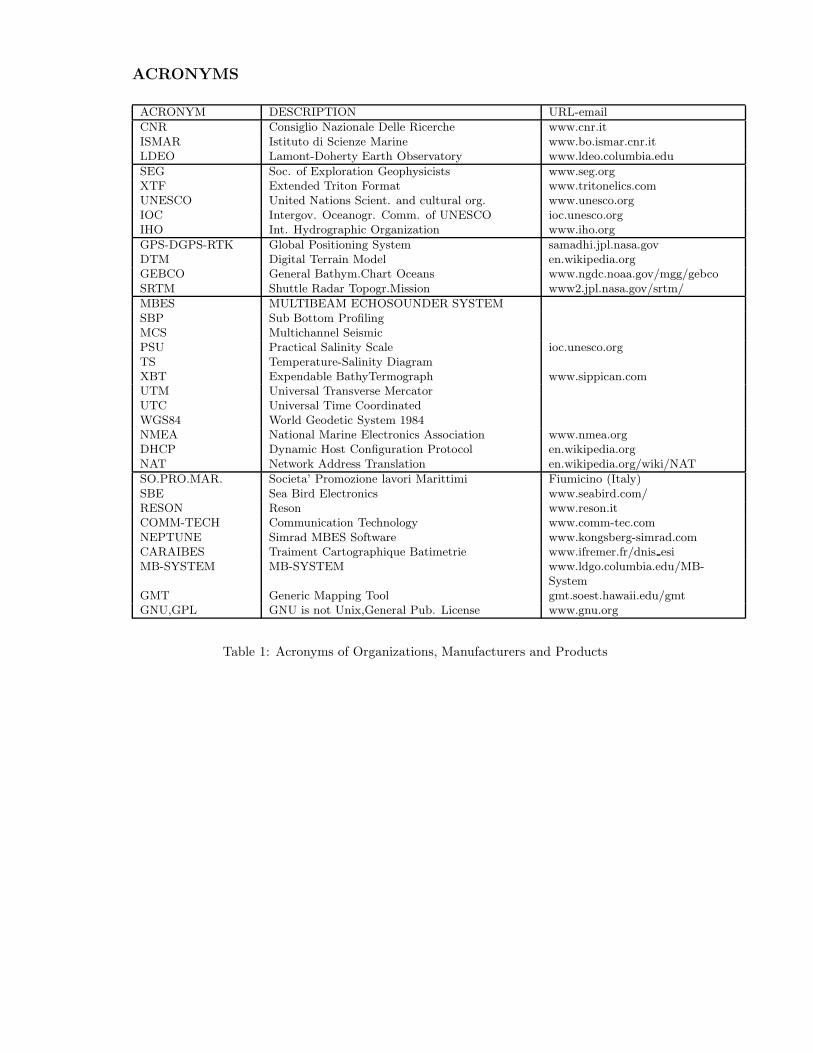
ACRONYM DESCRIPTION URL-email
CNR Consiglio Nazionale Delle Ricerche www.cnr.itISMAR Istituto di Scienze Marine www.bo.ismar.cnr.itLDEO Lamont-Doherty Earth Observatory www.ldeo.columbia.edu
SEG Soc. of Exploration Geophysicists www.seg.orgXTF Extended Triton Format www.tritonelics.comUNESCO United Nations Scient. and cultural org. www.unesco.orgIOC Intergov. Oceanogr. Comm. of UNESCO ioc.unesco.orgIHO Int. Hydrographic Organization www.iho.org
GPS-DGPS-RTK Global Positioning System samadhi.jpl.nasa.govDTM Digital Terrain Model en.wikipedia.orgGEBCO General Bathym.Chart Oceans www.ngdc.noaa.gov/mgg/gebcoSRTM Shuttle Radar Topogr.Mission www2.jpl.nasa.gov/srtm/
MBES MULTIBEAM ECHOSOUNDER SYSTEMSBP Sub Bottom ProfilingMCS Multichannel SeismicPSU Practical Salinity Scale ioc.unesco.orgTS Temperature-Salinity DiagramXBT Expendable BathyTermograph www.sippican.comUTM Universal Transverse MercatorUTC Universal Time CoordinatedWGS84 World Geodetic System 1984NMEA National Marine Electronics Association www.nmea.orgDHCP Dynamic Host Configuration Protocol en.wikipedia.orgNAT Network Address Translation en.wikipedia.org/wiki/NAT
SO.PRO.MAR. Societa’ Promozione lavori Marittimi Fiumicino (Italy)SBE Sea Bird Electronics www.seabird.com/RESON Reson www.reson.itCOMM-TECH Communication Technology www.comm-tec.comNEPTUNE Simrad MBES Software www.kongsberg-simrad.comCARAIBES Traiment Cartographique Batimetrie www.ifremer.fr/dnis esiMB-SYSTEM MB-SYSTEM www.ldgo.columbia.edu/MB-
SystemGMT Generic Mapping Tool gmt.soest.hawaii.edu/gmtGNU,GPL GNU is not Unix,General Pub. License www.gnu.org
Table 1: Acronyms of Organizations, Manufacturers and Products

HOW TO READ THIS REPORT
After a brief and schematic presentation of the cruise in section 2, Section 1gives the introductoryand background information, includingsome technological and scientific issues of the organizationand execution of tasks Section 3 provides the technical aspects thatwere involved in the data acqui-sition and processing. Sections 4 and 5 discuss the initial results, the on-going data processing andusage, and give concluding remarks. Section 6 in the Appendix summarizes the cruise operations.
ACKNOWLEDGMENTS
The project was funded by Italian National Antarctic Project within a Joint Research Programbetween CNR and GIN of Moscow.
This work was done under heavy or very heavy weather conditions, with a particularly difficultand dangerous navigation within icebergs. Ship’s and scientific party’s collaborative availabilityand instrument reliability were the key factors for the success of the expedition. We (the ItalianTeam) are particularly indebted to Captain Yuriy Shikera and bridge officers and crew of R/VGelendzhikfor the extra work required.
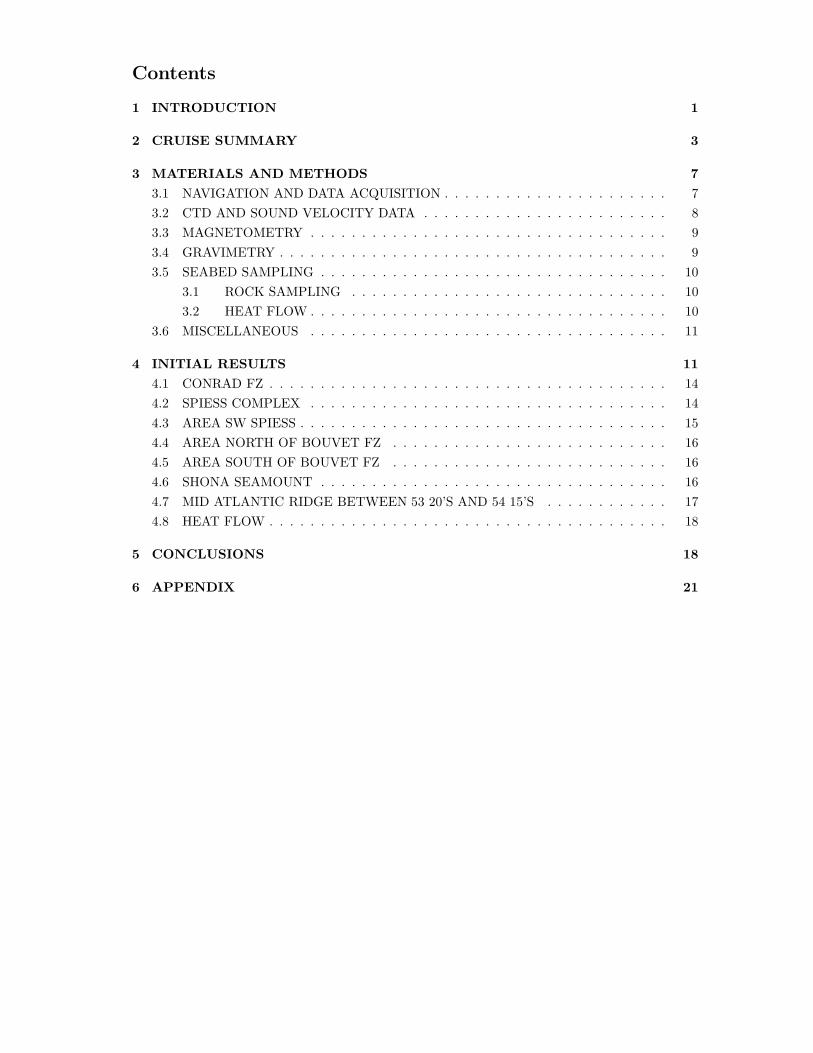
Contents
1 INTRODUCTION 1
2 CRUISE SUMMARY 3
3 MATERIALS AND METHODS 7
3.1 NAVIGATION AND DATA ACQUISITION . . . . . . . . . . . . . . . . . . . . . . 7
3.2 CTD AND SOUND VELOCITY DATA . . . . . . . . . . . . . . . . . . . . . . . . 8
3.3 MAGNETOMETRY . . . . . . . . . . . . . . . . . . . . . . . . . . . . . . . . . . . 9
3.4 GRAVIMETRY . . . . . . . . . . . . . . . . . . . . . . . . . . . . . . . . . . . . . . 9
3.5 SEABED SAMPLING . . . . . . . . . . . . . . . . . . . . . . . . . . . . . . . . . . 10
3.1 ROCK SAMPLING . . . . . . . . . . . . . . . . . . . . . . . . . . . . . . . 10
3.2 HEAT FLOW . . . . . . . . . . . . . . . . . . . . . . . . . . . . . . . . . . . 10
3.6 MISCELLANEOUS . . . . . . . . . . . . . . . . . . . . . . . . . . . . . . . . . . . 11
4 INITIAL RESULTS 11
4.1 CONRAD FZ . . . . . . . . . . . . . . . . . . . . . . . . . . . . . . . . . . . . . . . 14
4.2 SPIESS COMPLEX . . . . . . . . . . . . . . . . . . . . . . . . . . . . . . . . . . . 14
4.3 AREA SW SPIESS . . . . . . . . . . . . . . . . . . . . . . . . . . . . . . . . . . . . 15
4.4 AREA NORTH OF BOUVET FZ . . . . . . . . . . . . . . . . . . . . . . . . . . . 16
4.5 AREA SOUTH OF BOUVET FZ . . . . . . . . . . . . . . . . . . . . . . . . . . . 16
4.6 SHONA SEAMOUNT . . . . . . . . . . . . . . . . . . . . . . . . . . . . . . . . . . 16
4.7 MID ATLANTIC RIDGE BETWEEN 53 20’S AND 54 15’S . . . . . . . . . . . . 17
4.8 HEAT FLOW . . . . . . . . . . . . . . . . . . . . . . . . . . . . . . . . . . . . . . . 18
5 CONCLUSIONS 18
6 APPENDIX 21

List of Figures
1 Geographical setting of the study area. Topographic and bathymetric data bySandwell and Smith [Sandwell and Smith(2001)]. . . . . . . . . . . . . . . . . . . . 1
2 Geographical setting of the study area. Topographic and bathymetric data bySandwell and Smith [Sandwell and Smith(2001)]. . . . . . . . . . . . . . . . . . . . 3
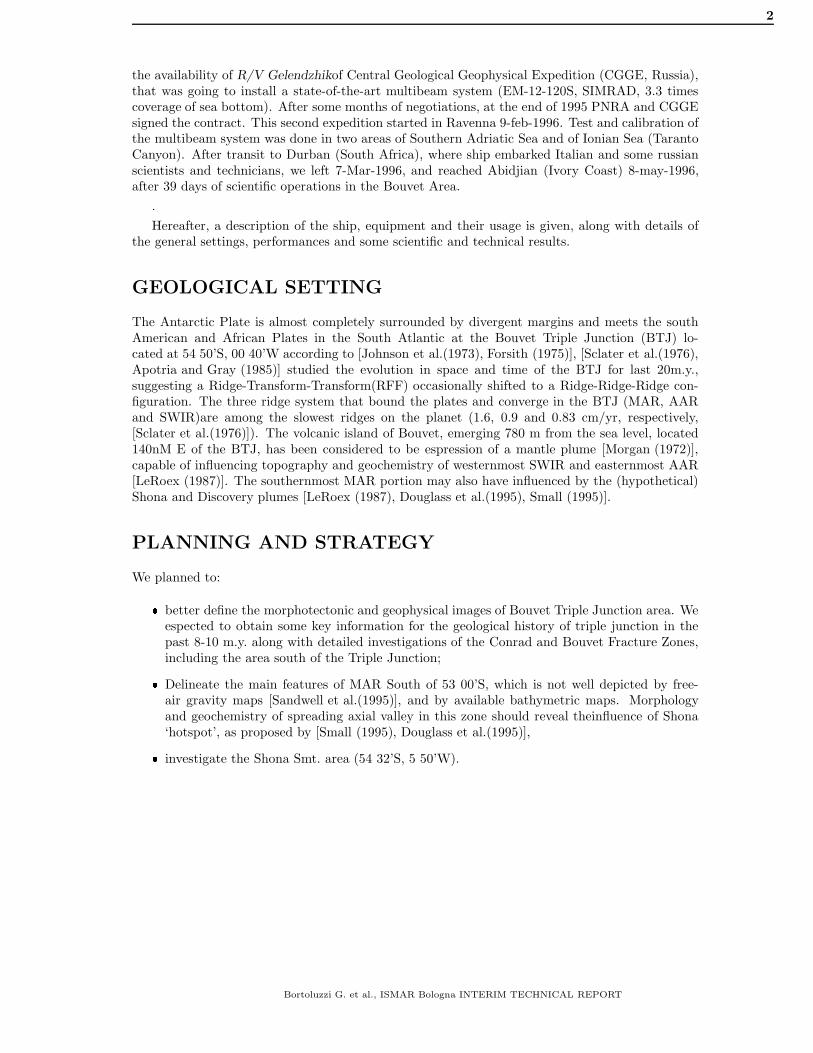
3 General ship track during Cruise BVT96, including transits from Durban and toAbidjian. . . . . . . . . . . . . . . . . . . . . . . . . . . . . . . . . . . . . . . . . . 4
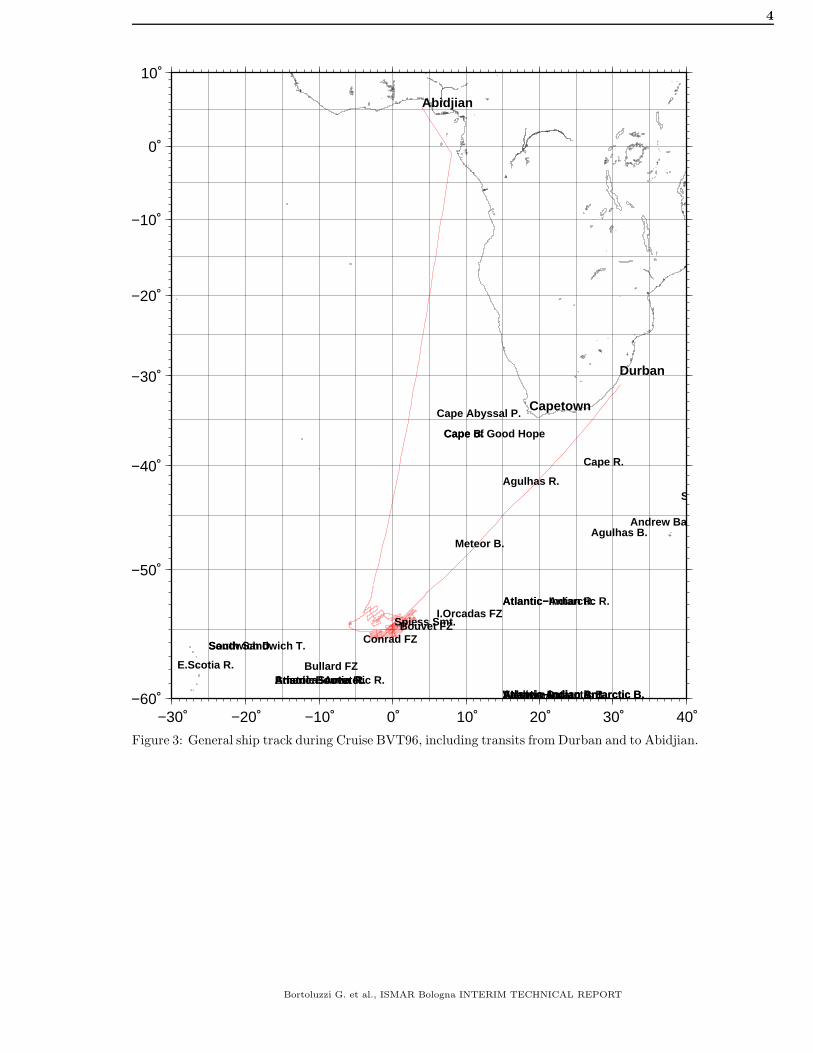
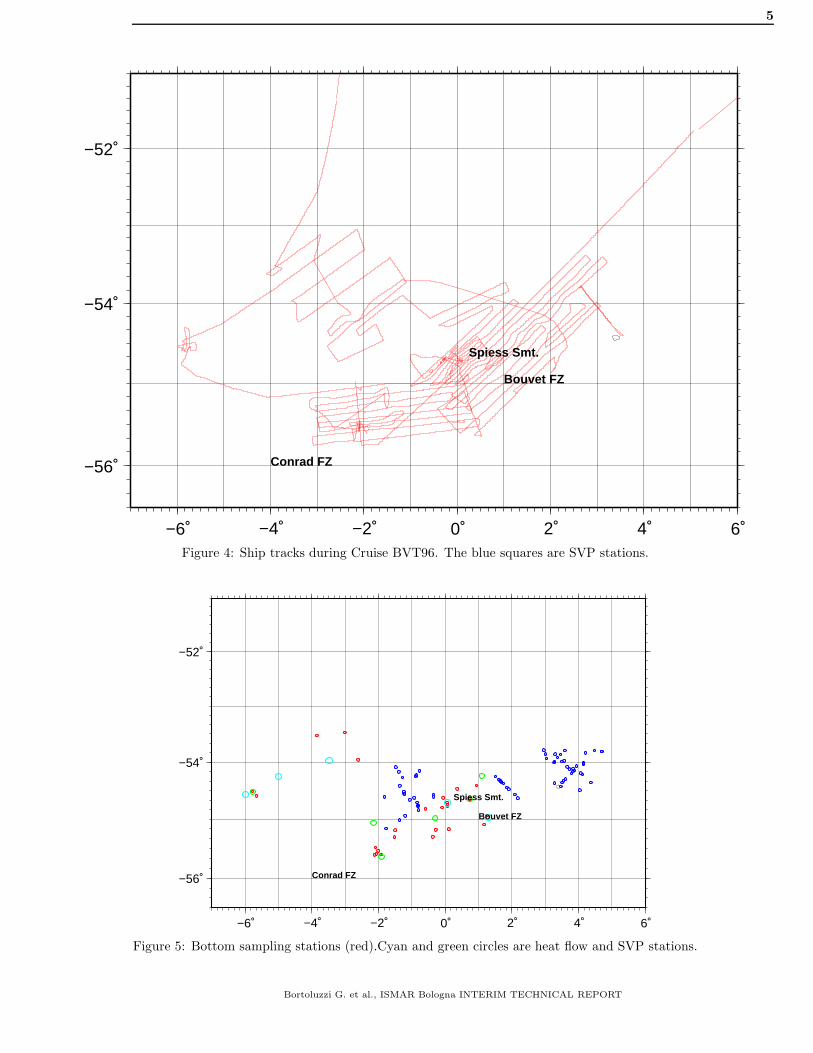
4 Ship tracks during Cruise BVT96. The blue squares are SVP stations. . . . . . . . 5
5 Bottom sampling stations (red).Cyan and green circles are heat flow and SVP stations. 5
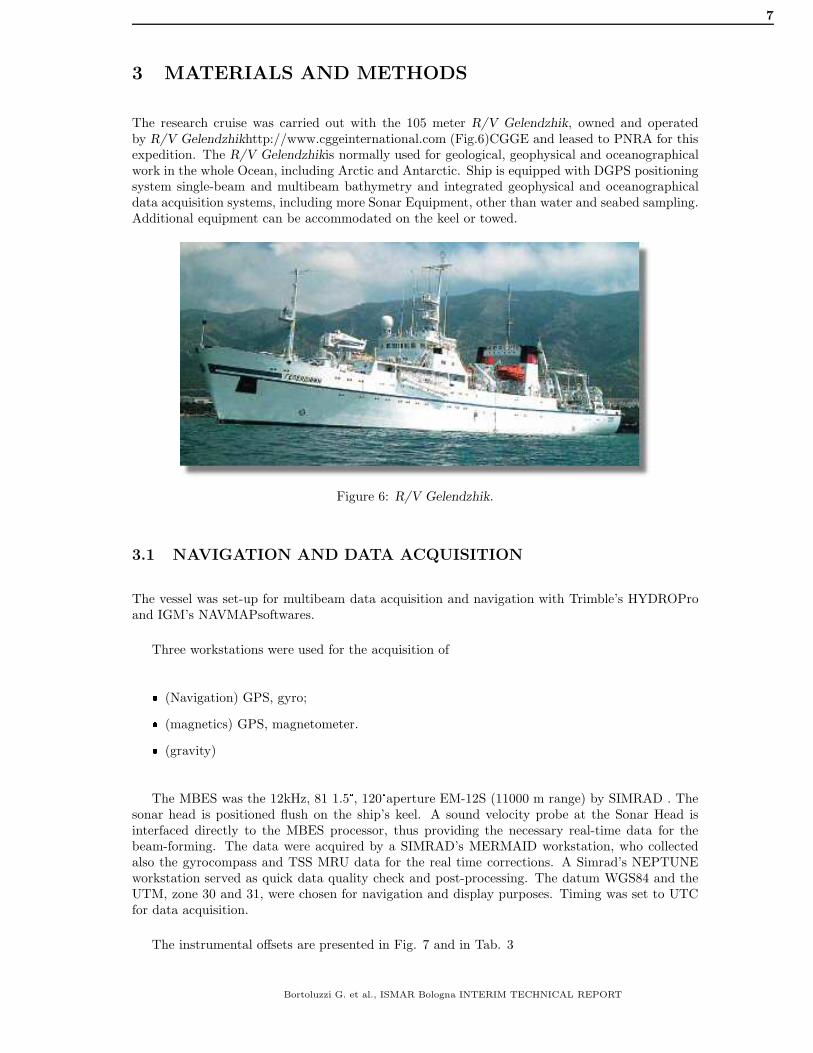
6 R/V Gelendzhik. . . . . . . . . . . . . . . . . . . . . . . . . . . . . . . . . . . . . . 7
7 Cruise BVT96. Instrumental Offsets on R/V Gelendzhik. . . . . . . . . . . . . . . 8
8 SV profiles. . . . . . . . . . . . . . . . . . . . . . . . . . . . . . . . . . . . . . . . . 9
9 The Spiess Seamount bathymetry. . . . . . . . . . . . . . . . . . . . . . . . . . . . 15
10 The Shona Seamount bathymetry. . . . . . . . . . . . . . . . . . . . . . . . . . . . 17
11 Compilation of bathymetric data from Cruises S18 (R/V A.N.Strakhov) and G96(R/V Gelendzhik). . . . . . . . . . . . . . . . . . . . . . . . . . . . . . . . . . . . . 19
List of Tables
1 Acronyms of Organizations, Manufacturers and Products . . . . . . . . . . . . . . i
2 Scientific and technical parties . . . . . . . . . . . . . . . . . . . . . . . . . . . . . 6
3 Instrumental Offsets on R/V Gelendzhik. The GPS antenna (primary positioningsystem) is located on point DGPS. . . . . . . . . . . . . . . . . . . . . . . . . . . . 8
4 SVP Station position. . . . . . . . . . . . . . . . . . . . . . . . . . . . . . . . . . . 8
5 Gravimeter calibration. . . . . . . . . . . . . . . . . . . . . . . . . . . . . . . . . . 10
6 Heat flow Station position. . . . . . . . . . . . . . . . . . . . . . . . . . . . . . . . 11
7 Sample positions. . . . . . . . . . . . . . . . . . . . . . . . . . . . . . . . . . . . . . 13
8 Heat flow data results.Station HF-04 (Spiess Caldera) had no penetration. Heat flowvalues calculated using near bottom water temperature gradient (λwb) and effectivethermal conductivity (λeff w. . . . . . . . . . . . . . . . . . . . . . . . . . . . . . . 18

1
1 INTRODUCTION
In the South Atlantic (Fig.1) the Antarctica, South America and Africa Plates meet at the BouvetTriple Junction (Fig.2), a key place for the understanding of structure and composition of oceanridges. In the framework of Italian and Russian cooperative project with the main goal of depictingthe structural, morphological and compositional elements of accretionary plate boundaries in theregion, a first PNRA expedition in the area with R/V Strakhov in 1994 [?] was performed. Theareas West of the Bouvet I. and around the Triple Junction were investigated, including the terminalportion of the axial valley of Mid Atlantic Ridge (MAR) south of 54 15’S. Other than multibeam,multichannel and single channel reflection seismic, gravimetric and magnetometric investigations,several stations were occupied and sampled in the two areas. Our survey time was over when wewere just in the proximity of the Bouvet Triple junction, leaving open several questions regardingits structural expression, that is broadly depicted by the intersection of MAR with the Conrad andBouvet fracture zones.
−30˚ −20˚ −10˚ 0˚ 10˚ 20˚ 30˚ 40˚
−60˚
−50˚
−40˚
−30˚
−30˚ −20˚ −10˚ 0˚ 10˚ 20˚ 30˚ 40˚
−60˚
−50˚
−40˚
−30˚
Andrew Bain FZ
Bouvet FZ
Bullard FZ
Conrad FZ
Discovery II FZ
DuToit FZ
Eric Simpson FZ
I.Orcadas FZ
Simpson FZ
S.Orkney FZS.Sandwich FZ
Vinogradov FZ
Agulhas Ridge
Cape of Good Hope
Cape Abyssal P.
Meteor Smnt.
BTJ
MAR
AAR
SWIR
Antarctic Plate
American Plate
African Plate
Tristan da Cunha
Bouvet I.
Durban
Capetown
Figure 1: Geographical setting of the study area. Topographic and bathymetric data by Sandwelland Smith [Sandwell and Smith(2001)].
A second cruise was proposed to PNRA by IGM and planned in the area, focusing on swath-bathymetry investigations, magnetometry, gravimetry and sampling. We took the opportunity of
Bortoluzzi G. et al., ISMAR Bologna INTERIM TECHNICAL REPORT
2
the availability of R/V Gelendzhikof Central Geological Geophysical Expedition (CGGE, Russia),that was going to install a state-of-the-art multibeam system (EM-12-120S, SIMRAD, 3.3 timescoverage of sea bottom). After some months of negotiations, at the end of 1995 PNRA and CGGEsigned the contract. This second expedition started in Ravenna 9-feb-1996. Test and calibration ofthe multibeam system was done in two areas of Southern Adriatic Sea and of Ionian Sea (TarantoCanyon). After transit to Durban (South Africa), where ship embarked Italian and some russianscientists and technicians, we left 7-Mar-1996, and reached Abidjian (Ivory Coast) 8-may-1996,after 39 days of scientific operations in the Bouvet Area.
.
Hereafter, a description of the ship, equipment and their usage is given, along with details ofthe general settings, performances and some scientific and technical results.
GEOLOGICAL SETTING
The Antarctic Plate is almost completely surrounded by divergent margins and meets the southAmerican and African Plates in the South Atlantic at the Bouvet Triple Junction (BTJ) lo-cated at 54 50’S, 00 40’W according to [Johnson et al.(1973), Forsith (1975)], [Sclater et al.(1976),Apotria and Gray (1985)] studied the evolution in space and time of the BTJ for last 20m.y.,suggesting a Ridge-Transform-Transform(RFF) occasionally shifted to a Ridge-Ridge-Ridge con-figuration. The three ridge system that bound the plates and converge in the BTJ (MAR, AARand SWIR)are among the slowest ridges on the planet (1.6, 0.9 and 0.83 cm/yr, respectively,[Sclater et al.(1976)]). The volcanic island of Bouvet, emerging 780 m from the sea level, located140nM E of the BTJ, has been considered to be espression of a mantle plume [Morgan (1972)],capable of influencing topography and geochemistry of westernmost SWIR and easternmost AAR[LeRoex (1987)]. The southernmost MAR portion may also have influenced by the (hypothetical)Shona and Discovery plumes [LeRoex (1987), Douglass et al.(1995), Small (1995)].
PLANNING AND STRATEGY
We planned to:� better define the morphotectonic and geophysical images of Bouvet Triple Junction area. Weespected to obtain some key information for the geological history of triple junction in thepast 8-10 m.y. along with detailed investigations of the Conrad and Bouvet Fracture Zones,including the area south of the Triple Junction;� Delineate the main features of MAR South of 53 00’S, which is not well depicted by free-air gravity maps [Sandwell et al.(1995)], and by available bathymetric maps. Morphologyand geochemistry of spreading axial valley in this zone should reveal theinfluence of Shona‘hotspot’, as proposed by [Small (1995), Douglass et al.(1995)],� investigate the Shona Smt. area (54 32’S, 5 50’W).
Bortoluzzi G. et al., ISMAR Bologna INTERIM TECHNICAL REPORT

3
−10˚ 0˚ 10˚−60˚
−50˚
−10˚ 0˚ 10˚−60˚
−50˚
Bouvet FZ
Bullard FZ
Conrad FZ
Bouvet I.Shona Smt. Spiess Smt. BTJ
MAR
AAR
SWIR
Antarctic Plate
American Plate
African Plate
Figure 2: Geographical setting of the study area. Topographic and bathymetric data by Sandwelland Smith [Sandwell and Smith(2001)].
2 CRUISE SUMMARY
SHIP: R/V GelendzhikSTART: 1996-03-05 PORT: DurbanEND: 1996-05-10 PORT: AbidjianSEA/OCEAN: Atlantic OceanLIMITS: NORTH -50:00.0 SOUTH -58.00 WEST: 25:30.0 EAST: 30:00OBJECTIVE: Geology and evolution of the Bouvet Triple Junction.COORDINATING BODIES: ISMAR-Bologna BOLOGNA (ITALY)CHIEF OF EXPEDITION: Giovanni Bortoluzzi (ISMAR-CNR)CONTACT: [email protected]: SWATH BATHYMETRY, MAGNETICS, SEABED SAMPLINGWORK DONE: 5600NM MULTIBEAM, MAGNETICS, GRAVITY26 DREDGES, 5 HEAT FLOW, 5 SVP
LOCALIZATION:
Bortoluzzi G. et al., ISMAR Bologna INTERIM TECHNICAL REPORT
4
−30˚ −20˚ −10˚ 0˚ 10˚ 20˚ 30˚ 40˚−60˚
−50˚
−40˚
−30˚
−20˚
−10˚
0˚
10˚
Agulhas B.
Agulhas R.
America−Antarctic R.
Andrew Bain FZ
Atlantic Antarctic B.
Atlantic−Antarctic R.
Atlantic−Indian Antarctic B. Atlantic−Indian B.
Atlantic−Indian R.
Atlantic Scotia R.
Bouvet FZ
Bristol−Bouvet R. Bullard FZ
Cape Abyssal P.
Cape B. Cape of Good Hope
Cape R.
Conrad FZ
E.Scotia R.
I.Orcadas FZ
Meteor B.
Sandwich D.
Simpson FZ
South Sandwich T.
Southwest Indian R.
Spiess Smt.
Valdivia D. Western Indian Antarctic B.
Abidjian
Durban
Capetown
Figure 3: General ship track during Cruise BVT96, including transits from Durban and to Abidjian.
Bortoluzzi G. et al., ISMAR Bologna INTERIM TECHNICAL REPORT
5
−6˚ −4˚ −2˚ 0˚ 2˚ 4˚ 6˚
−56˚
−54˚
−52˚
Bouvet FZ
Conrad FZ
I.Orcadas FZ
Spiess Smt.
Figure 4: Ship tracks during Cruise BVT96. The blue squares are SVP stations.
−6˚ −4˚ −2˚ 0˚ 2˚ 4˚ 6˚
−56˚
−54˚
−52˚
Bouvet FZ
Conrad FZ
I.Orcadas FZ
Spiess Smt.
Figure 5: Bottom sampling stations (red).Cyan and green circles are heat flow and SVP stations.
Bortoluzzi G. et al., ISMAR Bologna INTERIM TECHNICAL REPORT

6
SCIENTIFIC AND TECHNICAL PARTIES
PARTICIPANTS EXPERTISE ORGANIZATION tel & email & www
Giovanni Bortoluzzi Chief of Expedition IGM [email protected] Carrara Scientist IGM [email protected] Fabretti Scientist IGMDaniela Penitenti Technician IGMDaniele Brunelli Scientist IGMTerenzoni Michele Student IGMBertozzi Fabio ENEA
Peyve Aleksandr Scientist GINSkolotnev Sergey Scientist GINTurko Nataliya Scientist GIN
Gilod Dolores Scientist MSU
Shirokozhukhov Boris Party Chief CGGEAOvcharov Aleksandr Scientist CGGEALygin Petr Scientist CGGEAKoshman Aleksey Scientist CGGEAPavlov Andrey Scientist CGGEAZuev Oleg Scientist CGGEAGubenkov Vladimir Scientist CGGEAKhrenov Sergey Scientist CGGEATsyganenkov Vitaliy Scientist CGGEAYubko Valeriy Scientist CGGEAShanin Andrey Technician CGGEAKishko Petr Technician CGGEAIsachenko Sergey Technician CGGEA
Nikanorenkov Boris Scientist NIPIOZlotnikov Leonid Scientist NIPIOSkorkin Vasiliy Scientist NIPIOVragov Vladislav Scientist NIPIOArtemenko Vitaliy Scientist NIPIORudnev Aleksandr Scientist NIPIOZinin Robert Scientist NIPIOMaraev Sergey Scientist NIPIOAmelin Vladimir Scientist NIPIOGuselnikov Andrey Scientist NIPIO
Sushchevskaya Nadezhda Scientist VIG
Table 2: Scientific and technical parties
Bortoluzzi G. et al., ISMAR Bologna INTERIM TECHNICAL REPORT
7
3 MATERIALS AND METHODS
The research cruise was carried out with the 105 meter R/V Gelendzhik, owned and operatedby R/V Gelendzhikhttp://www.cggeinternational.com (Fig.6)CGGE and leased to PNRA for thisexpedition. The R/V Gelendzhikis normally used for geological, geophysical and oceanographicalwork in the whole Ocean, including Arctic and Antarctic. Ship is equipped with DGPS positioningsystem single-beam and multibeam bathymetry and integrated geophysical and oceanographicaldata acquisition systems, including more Sonar Equipment, other than water and seabed sampling.Additional equipment can be accommodated on the keel or towed.
Figure 6: R/V Gelendzhik.
3.1 NAVIGATION AND DATA ACQUISITION
The vessel was set-up for multibeam data acquisition and navigation with Trimble’s HYDROProand IGM’s NAVMAPsoftwares.
Three workstations were used for the acquisition of� (Navigation) GPS, gyro;� (magnetics) GPS, magnetometer.� (gravity)
The MBES was the 12kHz, 81 1.5°, 120°aperture EM-12S (11000 m range) by SIMRAD . Thesonar head is positioned flush on the ship’s keel. A sound velocity probe at the Sonar Head isinterfaced directly to the MBES processor, thus providing the necessary real-time data for thebeam-forming. The data were acquired by a SIMRAD’s MERMAID workstation, who collectedalso the gyrocompass and TSS MRU data for the real time corrections. A Simrad’s NEPTUNEworkstation served as quick data quality check and post-processing. The datum WGS84 and theUTM, zone 30 and 31, were chosen for navigation and display purposes. Timing was set to UTCfor data acquisition.
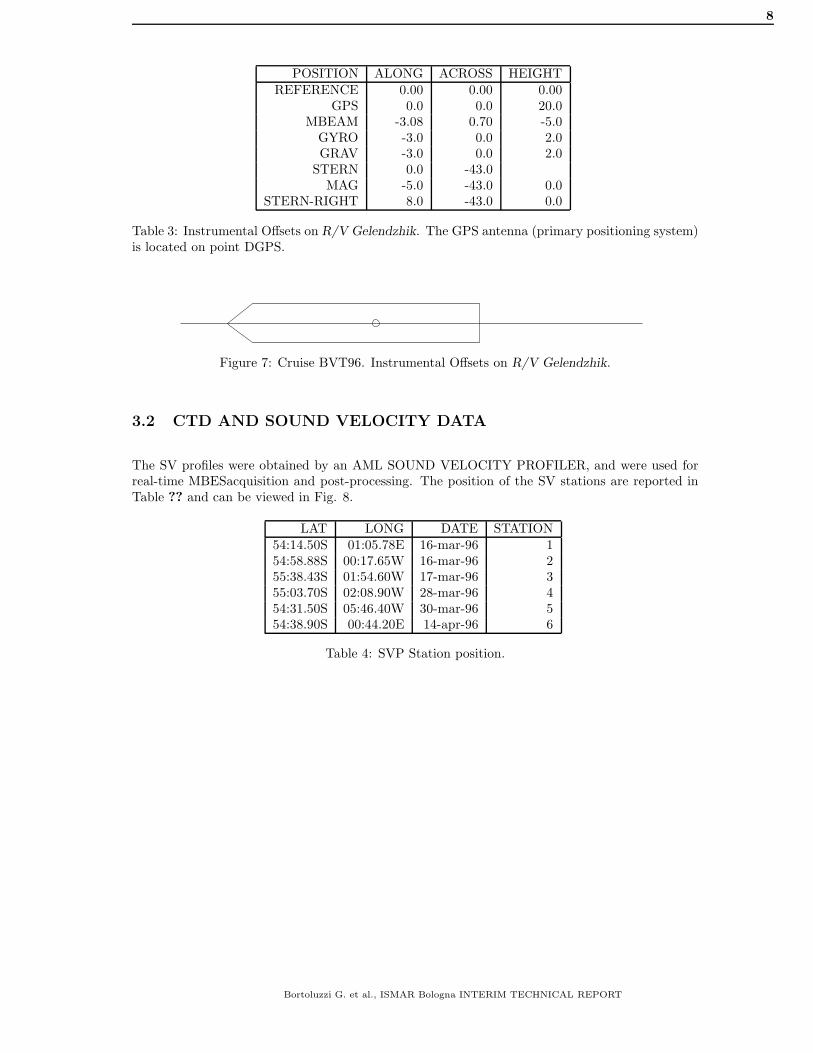
The instrumental offsets are presented in Fig. 7 and in Tab. 3
Bortoluzzi G. et al., ISMAR Bologna INTERIM TECHNICAL REPORT
8
POSITION ALONG ACROSS HEIGHTREFERENCE 0.00 0.00 0.00
GPS 0.0 0.0 20.0MBEAM -3.08 0.70 -5.0
GYRO -3.0 0.0 2.0GRAV -3.0 0.0 2.0
STERN 0.0 -43.0MAG -5.0 -43.0 0.0
STERN-RIGHT 8.0 -43.0 0.0
Table 3: Instrumental Offsets on R/V Gelendzhik. The GPS antenna (primary positioning system)is located on point DGPS.
Figure 7: Cruise BVT96. Instrumental Offsets on R/V Gelendzhik.
3.2 CTD AND SOUND VELOCITY DATA
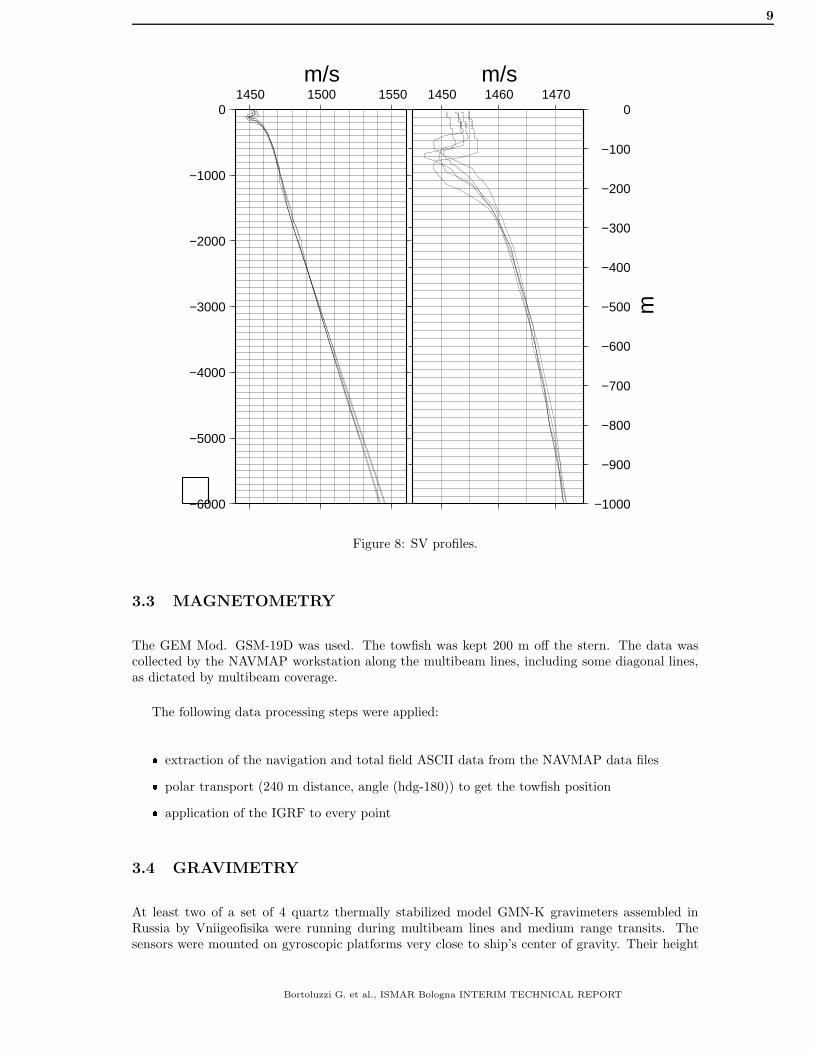
The SV profiles were obtained by an AML SOUND VELOCITY PROFILER, and were used forreal-time MBESacquisition and post-processing. The position of the SV stations are reported inTable ?? and can be viewed in Fig. 8.
LAT LONG DATE STATION54:14.50S 01:05.78E 16-mar-96 154:58.88S 00:17.65W 16-mar-96 255:38.43S 01:54.60W 17-mar-96 355:03.70S 02:08.90W 28-mar-96 454:31.50S 05:46.40W 30-mar-96 554:38.90S 00:44.20E 14-apr-96 6
Table 4: SVP Station position.
Bortoluzzi G. et al., ISMAR Bologna INTERIM TECHNICAL REPORT
9
−6000
−5000
−4000
−3000
−2000
−1000
01450 1500 1550
m/s
−1000
−900
−800
−700
−600
−500
−400
−300
−200
−100
0
m
1450 1460 1470m/s
Figure 8: SV profiles.
3.3 MAGNETOMETRY
The GEM Mod. GSM-19D was used. The towfish was kept 200 m off the stern. The data wascollected by the NAVMAP workstation along the multibeam lines, including some diagonal lines,as dictated by multibeam coverage.
The following data processing steps were applied:� extraction of the navigation and total field ASCII data from the NAVMAP data files� polar transport (240 m distance, angle (hdg-180)) to get the towfish position� application of the IGRF to every point
3.4 GRAVIMETRY
At least two of a set of 4 quartz thermally stabilized model GMN-K gravimeters assembled inRussia by Vniigeofisika were running during multibeam lines and medium range transits. Thesensors were mounted on gyroscopic platforms very close to ship’s center of gravity. Their height
Bortoluzzi G. et al., ISMAR Bologna INTERIM TECHNICAL REPORT

10
above sea level was measured to be 0.7 m. The instruments had a resolution of 0.04 mGal, andwere equipped with a circuitry to reduce noise due to high waves. In the ports of Durban andAbidjian (see Tab.5) the instruments were calibrated on known reference points with a portablegravimeter Lacoste and Romberg Mod.G-327.
DATE SITE REFERENCE SHIP1996-03-07 Durban 979348.66 +/- 0.02 979352.321996-05-09 Abidjian
Table 5: Gravimeter calibration.
Since the pattern of planned profiles was predominantly E-W, some N-S connecting lines wererun for control. In addition, ship went to the Island of Bouvet crossing 1994 line pattern andrepeating a 1994 station in anchor.
3.5 SEABED SAMPLING
3.1 ROCK SAMPLING
The sea bottom samples were collected with dredges served by a 14mm diameter cable. The samplelocations are shown in Figg.5 and locations are presented in Tab.??.
After dredge recovery, samples underwent several analytical steps. Among them:
a description and measure(dimensions, raw composition and shape),
b basalt glass recovery,
c cutting,
d microscope description (phenocrystal composition, groundmass, texture analysis),
e sub-sampling and
f thin sections on selected subsamples.
3.2 HEAT FLOW
The core sampling and geothermal research were carried out with system GRUNT, designed andassembled at the Thermal Exploration Laboratory (NIPIOkeangeofisika), Gelendzhik, Russia. Thesea-going part (KADR-1M) incorporates: a) a corer that ensures the recovery of undisturbed sed-iments, b) a self-recording thermogradiometer (ACTM-1), b) deepwater camera and bathometerfor nearbottom water sampling. The shipboard module consists of a programmable control andrecording unit ensuring: programming of self recording instruments, readout, visualization, pro-cessing, and storage of measurements results. An Automated geotechnical module (NGM-1) wasalso available for engineer-physical parameter measurements on the cores. Heat flow data wereobtained by the separate measurement of the geothermal gradient (γ, K/m) in sediments,and bot-tom sediment conductivity (λ, (W/m2K). After penetrating the sediments, system was held inposition for a minimum time of 15 minutes to reach equilibrium. As a result of the self-recording
Bortoluzzi G. et al., ISMAR Bologna INTERIM TECHNICAL REPORT

11
geothermal gradient measurements (γ) and value of the thermal conductivity (λ), the heat flowdensity is calculated as q = −γλ (mW/m2).
The Station positions are shown in Tab.6 and in Fig.5.
LAT LONG DEPTH STATION DATE-54:34.1 -05:59.0 1860 HF-01 1996-03-30-54:15.1 -05:00.1 2640 HF-02 1996-03-31-53:58.7 -03:28.8 2157 HF-03 1996-04-01-54:43.0 00:04.0 811 HF-04 1996-04-12-54:58.5 01:18.0 3270 HF-05 1996-04-17
Table 6: Heat flow Station position.
3.6 MISCELLANEOUS
The datum was set to WGS84 and the UTM, zone 31 was chosen for navigation and display, anddata acquisition. The time zone was set to the UTC for the instrumental data acquisition.
The positioning maps and bathymetric images were produced with GMT [Wessel and Smith (1995)].
4 INITIAL RESULTS
We arrived in the operation area 15-mar-1996, and realized soon that our workplan should havebeen reorganized. 17-Mar we met the first of a long series of icebergs. This was a very badsurprise, since during previous expedition we had only one detection, at the end of survey. Some ofthe icebergs had so small relief to be undetectable by radar, expecially during rough seas (almost70-80% of cruise). The decision was taken to reduce speed during night to a maximum of 5 Kn.
After having investigated part of the Conrad F.Z. and SW part of BTJ, we decided to go tothe Shona Smt., since we were contrasting a very strong storm from NW and were forced to driftstraight there. After having obtained bathymetric maps, rock samples and one Heat Flow onthe top, we moved toward MAR with the aim to trace the axial valley and have some detailedbathymetric maps for dredging. We crossed MAR on 3 transects with good magnetic, bathymetricand gravimetric data. Between Shona Smt. and MAR we had a second Heat Flow Station, withthe recovery of a very interesting core.
When we reached our 1994 survey area we did two additional lines west of it. Finally, we went tonorthern area of Bouvet F.Z. where we started a NE-SW survey. On Spiess Smt. we interrupted thelong offset lines, starting a more detailed survey on the shallower part of the seamount. During thisperiod we occupied several dredging stations, partly originally planned while other were decidedupon the results of swath-bathymetry data processing.
Toward the end of the cruise, on the southern area of Bouvet F.Z. we had very rough weather,with a severe storm that stopped all the operations for 3 days. During this stand by the shipdrifted North for more than 120 miles and we decided to go to survey on MAR. We performedadditional multibeam and magnetics lines, and occupied three dredging stations on the rift valley.On 23-apr-1996 ship left the operation area, with heading to Abidjian. Additional magnetometricand multibeam data were collected during transit.
Bortoluzzi G. et al., ISMAR Bologna INTERIM TECHNICAL REPORT

12
A total of 5600 Nm of Multibeam and Magnetic lines were run. A total of 26 dredging stationswere occupied, 22 of them recovered samples, one was lost. Glasses were collected in 18 dredges.In all dredges but ones in the areas of neo-volcanic activity glacial erratics were present, reachingup to 30-50% of materials.
From geophysical lines we obtained detailed morphobathymetric and magnetic images of thearea. Gravity data +have to be reduced after calibration, and we believe to be able to make goodanalysis of high frequency anomalies.
Three types of basalt associations were recovered :
1 fresh, highly vesicular aphyric and Cpx-Ol-Pl-phyric basalts,
2 sligthly altered Cpx-Ol-Pl phyric and aphyric basalts, covered by Fe-Mn crust (3 to 20 mm),
3 hydrothermally altered (with chlorite, calcite, quartz, sulphides, etc.) sometimes tectonizedaphyric basalts.
Heat flow data (4 stations) ranged from 50 to 300 mW/m2.
Initial results are presented for the different study areas, in order to address the importance ofthe preliminary findings and processing sequence of the data acquired.
The sample descriptions can be found in Tab.7.
Bortoluzzi G. et al., ISMAR Bologna INTERIM TECHNICAL REPORT

13
ID MONITORING SITE DESCRIPTION COMMENTSG9623 NE slope of high S of W end of
Bouvet F.Z.Fe-Mn crust 2 cm; little glassybasalt
NULL
G9622 S slope of high S of W end ofBouvet F.Z.
basalt with 0;5 cm Fe-Mn crust NULL
G9621 S wall of the E-W basin; 30 milesS of Spiess ridge
fresh and different alteration ratebasalts; thick Fe-Mn crust
NULL
G9620 N wall of the E-W basin; 30 milesS of Spiess ridge
pillow fragments with thick Fe-Mn crust; fresh vesicular basalts;interesting big vitrobasalt sam-ple; sandstone in situ; erratics
NULL
G9619 little high SW of Spiess ridge basaltic breccia; including glass;with thick Fe-Mn crust; up to 2cm; small basaltic samples
NULL
G9618 S slope little high; E of Spiessridge
basalts and fresh glasses withthin Fe-Mn coating
NULL
G9617 E-W deep slope NE of Spiessridge
pillow fragments with fresh glass;tectonized basalts; different de-grees of hydrotermal alteration;Fe-Mn patina; sulphides
NULL
G9616 S slope of high NE of Spiess ridge pillow fragments basalts withthick Fe-Mn crust; high vesicu-lar fresh basalts with thin Fe-Mnpatina
NULL
G9615 top of little high; N of Spiess;place of highest magneticanomaly
fresh pillow fragments; high flu-idal cord lavas with thin glassycrust; fresh glasses; thin Fe-Mncoating
we decide to pass trough calderaduring dredge; so the endingdepth is bigger then the startingdepth
G9613 S slope of caldera pillow fragments and flow lavaswith glassy crust; fresh glass; 1mm max Fe-Mn coating
NULL
G9614 N slope of high SW of Spiessridge
big pillow fragments; basalticbreccia; lavas with thin glassycrust; lightly altered
NULL
G9612 S slope of caldera fresh high vesicular basalt; flowlavas with Pahoe-hoe structures;big amount of fresh glass
NULL
G9611 NW wall inside caldera of Spiessridge
pillow basalt with thin Fe-Mncrust; vesicular basalts; glassycrusts; Fe-hydroxide alteration
NULL
G9610 N slope of high SW of Spiessridge
olivine basalt 85% vesicular lavas 10%; one big sam-ple (50 kg) of olivine tholeite
G9609 N slope of high; SE of Shonaseamount
basalts 60% 30
G9608 NE slope; top of Shona seamount basalts 60% glacial erratics 10%G9607 SW wall of the oblique basin;
(Axial valley)lost lost
G9606 NW wall of the oblique basin;(Axial valley)
empty empty
G9605 high inside corner; S slope one sample of basaltic breccia NULLG9603 high inside corner; W top empty emptyG9604 high inside corner; N slope of W
topperidotites 30% calcarenites 30%
G9601 high inside corner; S slope nearnodal basin
empty empty
G9602 high inside corner; S slope basalts 80% gabbro 5%G9624 M.A.R. fresh pillow basalt sectors; with
glassy crust; no erratics; no Fe-Mn crust; abundant fresh glasses
NULL
G9625 M.A.R. 1 pillow fragment; little basaltswith glass; thin Fe-Mn patina
NULL
G9626 M.A.R. One big very fresh lava burr;Cpx-Ol-Pl porphyric; with thick
NULL
Bortoluzzi G. et al., ISMAR Bologna INTERIM TECHNICAL REPORT

14
4.1 CONRAD FZ
We begun the survey from the E intersection of South America-Antarctic Ridge (SAAR) withConrad F.Z. to 3W. Other than the planned E-W lines, additional survey time was necessary inorder to obtain the full coverage of the high inside corner (minimum depth 600 m). Morpho-bathymetry and geophysics (magnetometry) revealed the presence of a ridge segment of SAARchanging its direction from N-S to SW-NE (Fig. 3), in good agreement with recent Sandwell’sfree-air gravity maps. The S portion of ridge axis has a deep axial valley (mean depth 4000 m,1.5 km width) that becomes wider and deeper at transform fault - ridge axis intersection. Thecentral magnetic anomaly of ridge axis (Chron 1n, 0.78 m.y, [Cande and Kent (1992)] time scale)is 15 km wide, and the resulting half spreading rate is 0.95 cm/yr. The SW-NE segment is 4000 mdeep and 5 km wide; its morphotectonic features suggests the presence of shear stresses. Dredgingwas performed on high inside corner. We occupied 3 stations (2, 5, 4) recovering peridotites, gab-bros, gabbro-dolerites, Cpx-Ol-Pl phyric and aphyric basalts covered by Fe-Mn crust, and glacialerratics.
4.2 SPIESS COMPLEX
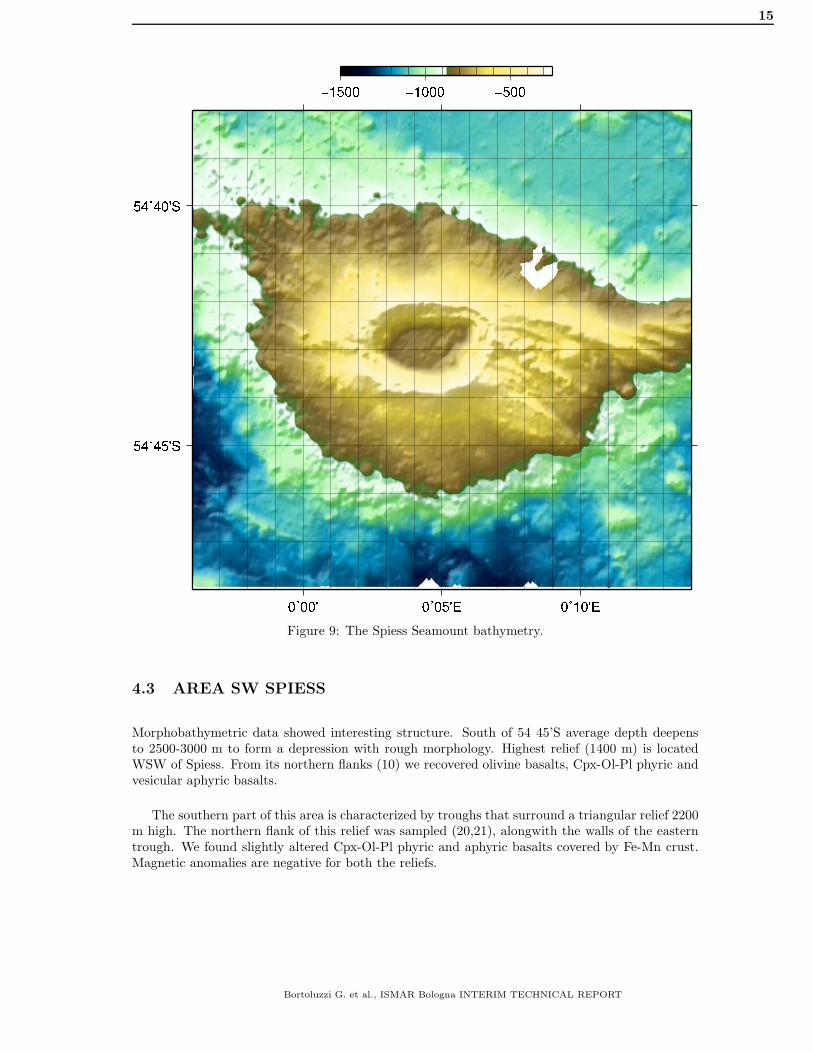
The Spiess complex has an elliptical shape elongated in NW-SE direction. It is articulated in acentral volcanic apparatus rising from 1200 m to 340 m and two main lateral reliefs. We did adetailed multibeam survey on the top, and morphological data revealed the existence of an ellipticcaldera 2.8 x 2 Nm, 450 mt deep; the bottom is rough and some smaller cones appear. Magneticdata evidence an intense positive magnetic anomaly with a NW-SE trend. NW of the top we foundthe highest positive anomaly of the area (> 2500 nT).
We occupied 6 stations (11,12,13,14,15,16): (a) around the main top and to the NW we recov-ered fresh vesicular aphyric and Cpx-Ol-Pl phyric basalts, with traces of post-eruptive oxidation,and (b) on the lateral reliefs we recovered Cpx-Ol-Pl phyric and aphyric basalts covered by Fe-Mncrusts fragments. We tried an heat-flow station (HF04) in the caldera, and recovered fresh glassybasalts from the corer. Figure 9 shows the investigated area.
Bortoluzzi G. et al., ISMAR Bologna INTERIM TECHNICAL REPORT
15
Figure 9: The Spiess Seamount bathymetry.
4.3 AREA SW SPIESS
Morphobathymetric data showed interesting structure. South of 54 45’S average depth deepensto 2500-3000 m to form a depression with rough morphology. Highest relief (1400 m) is locatedWSW of Spiess. From its northern flanks (10) we recovered olivine basalts, Cpx-Ol-Pl phyric andvesicular aphyric basalts.
The southern part of this area is characterized by troughs that surround a triangular relief 2200m high. The northern flank of this relief was sampled (20,21), alongwith the walls of the easterntrough. We found slightly altered Cpx-Ol-Pl phyric and aphyric basalts covered by Fe-Mn crust.Magnetic anomalies are negative for both the reliefs.
Bortoluzzi G. et al., ISMAR Bologna INTERIM TECHNICAL REPORT
16
4.4 AREA NORTH OF BOUVET FZ
A very rough morphology with main features oriented E-W was evidenced. We dredged two reliefsE of Spiess. In the Northern one (17) we sampled hydrothermally altered basalts with chlorite,calcite, quartz, sulphides, some of them tectonized. The station on southernmost relief (18) revealedthe presence of slightly altered Cpx-Ol-Pl phyric and aphyric basalts covered by Fe-Mn crusts. Acomplex magnetic anomaly pattern is probably due to strong tectonics.
4.5 AREA SOUTH OF BOUVET FZ
A broad depression area is located S of the western tip of Bouvet F.Z., whose northern slopeis formed by an EW topographic high, with a negative magnetic anomaly centered on the top.The western slope of the depression is characterized by an arcuated relief. Sampling of the twostructures (22, 23) recovered slightly altered Cpx-Ol-Pl phyric and aphyric basalts covered by Fe-Mn crust. We also did an Heat Flow station (HF05) at a depth of 3270 m and the associated corerecovered sandy clay intercaled with diatomitic sediments.
4.6 SHONA SEAMOUNT
We did a high resolution bathymetric survey of the seamount, that rise from 3100 m to 950 m atthe top. The complex is formed by a central cone and by two smaller edifices to the south. Thewesternmost edifice has the shape of a collapsed caldera. On the eastern flank of the volcano asmall cone 200 m high was found.
Two dredges (8, 9) were collected on the southern slope of main cone and on the northern scarpof southern cone. We recovered altered mostly aphyric basalts and dolerites with chlorite, andrather fresh vesicular Ol-Cpx-Pl phyric basalts. An Heat Flow (HF01) station was performed ina flat area south of the main cone. From Shona seamount we moved NE toward MAR. AnotherHeat Flow station (HF02) was done at a depth of 2640 m, slightly NE of Shona. The gravitycore recovered diatomitic layers interbedded with levels of volcanoclastic sediments. Gravity andmagnetic data in the transect to the MAR revealed a very interesting pattern of high frequencyanomalies.
Figure 10 shows the investigated area.
Bortoluzzi G. et al., ISMAR Bologna INTERIM TECHNICAL REPORT

17
−6˚00' −5˚50' −5˚40' −5˚30'
−54˚40'
−54˚30'
−54˚20'
−6˚00' −5˚30'
−54˚30'
−3000
−2500
−2000
−1500
−1000
Figure 10: The Shona Seamount bathymetry.
4.7 MID ATLANTIC RIDGE BETWEEN 53 20’S AND 54 15’S
Magnetic and multibeam surveys provided the location of ridge axis, that appears to be offset tothe W at latitude 54 00’S and 53 30’S. The resulting full spreading rate (Cande and Kent, 1992time scale) ranges from 2.4 cm/yr to 3.3 cm/yr.
Three stations (24, 25, 26) were sampled in the neovolcanic zone. The southern one recoveredfresh Cpx-Ol-Pl phyric basalts. In the mid one we obtained (Pl)-Ol phyric basalts. In the northern
Bortoluzzi G. et al., ISMAR Bologna INTERIM TECHNICAL REPORT
18
one we collected glomero (Cpx)-Ol-Pl porphyric basalts from a beautiful big fresh lava burr.
4.8 HEAT FLOW
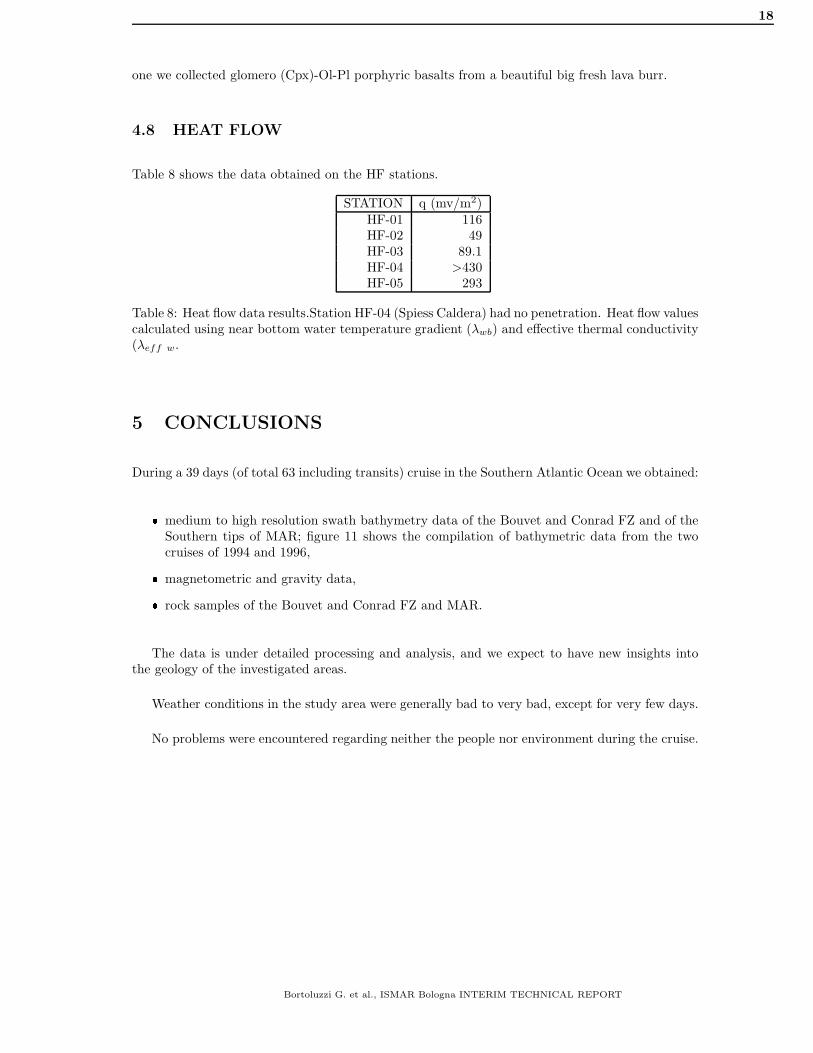
Table 8 shows the data obtained on the HF stations.
STATION q (mv/m2)HF-01 116HF-02 49HF-03 89.1HF-04 >430HF-05 293
Table 8: Heat flow data results.Station HF-04 (Spiess Caldera) had no penetration. Heat flow valuescalculated using near bottom water temperature gradient (λwb) and effective thermal conductivity(λeff w.
5 CONCLUSIONS
During a 39 days (of total 63 including transits) cruise in the Southern Atlantic Ocean we obtained:� medium to high resolution swath bathymetry data of the Bouvet and Conrad FZ and of theSouthern tips of MAR; figure 11 shows the compilation of bathymetric data from the twocruises of 1994 and 1996,� magnetometric and gravity data,� rock samples of the Bouvet and Conrad FZ and MAR.
The data is under detailed processing and analysis, and we expect to have new insights intothe geology of the investigated areas.
Weather conditions in the study area were generally bad to very bad, except for very few days.
No problems were encountered regarding neither the people nor environment during the cruise.
Bortoluzzi G. et al., ISMAR Bologna INTERIM TECHNICAL REPORT

19
Figure 11: Compilation of bathymetric data from Cruises S18 (R/V A.N.Strakhov) and G96 (R/VGelendzhik).
Bortoluzzi G. et al., ISMAR Bologna INTERIM TECHNICAL REPORT

REFERENCES 20
References
[Apotria and Gray (1985)] Apotria T.G and Gray N.H., Absolute motion and evolution of theBouvet Triple Junction, 1985, Nature, 316.
[Brunelli et al.(2003)] D. Brunelli, A. Cipriani, L. Ottolini, A. Peyve, E. Bonatti,Mantle peridotitesfrom the Bouvet Triple Junction Region, South Atlantic, 2003. Terra Nova 15 (3), 194-203.
[Douglass et al.(1995)] Douglass J, Shilling J.G., Kingsley R.H. and Small C,Influence of the Dis-covery and Shona Mantle plumes on the southern Mid Atlantic Ridge: rare earth evidence,1995, Geophys.Res.Letters, 22/21, 2893-2896.
[Cande and Kent (1992)] Cande, S.C., and D.V. Kent, A new geomagnetic polarity time scale forthe Late Cretaceous and Cenozoic, 1992, J. Geophys. Res., 97, 13,917-13,951.
[Caress and Chayes (2004)] Caress, D. and Chayes, D., MB-SYSTEM Release 5, 2005,URL:www.ldgo.columbia.edu/MB-System.
[Forsith (1975)] Forsith D.W., Fault plane solutions and tectonics of the South Atlantic and ScotiaSea, 1975, J.Geophys.Res.,80,1429-1443.
[GEBCO (2003)] IHO-UNESCO, General Bathymetric Chart of the Oceans, Digital Edition,2003,www.ngdc.noaa.gov/mgg/gebco.
[Johnson et al.(1973)] Johnson G.L, Key K.N. and Lowrie A.,Marine Geology in the environs ofBouvet Islans and the South AtlanticTriple Junction, 1973, Mar.Geophys.Res., 2, 23-36.
[LeRoex et al.(1985)] LeRoex A.P., H.J.B.Dick, A.M.Reid, F.A.Frey, A.J.Erlank and S.R.Hart,Petrology and geochemistry of basalts from the American-Antarctic Ridge, Southern Ocean:Implications for the westward influence of the Bouvet Mantle Plume, Contrib. Mineral. Petrol.,90, 367-380, l985.
[LeRoex (1987)] LeRoex, A.P., tristan-da-cunha, south-atlantic - geochemistry and petrogenesis,1987. Journal of Geophysical Research 92: 4881.
[LeRoex (1987)] LeRoex, A. P., Source regions of mid-ocean ridge basalts:evidence for enrichmentprocesses, 1987. In Menzies, M. A., andHawkesworth, C. J. (Eds.), Mantle Metasomatism:London (Academic Press),389-422.
[Ligi et al.(1997)] Ligi M., Bonatti E., Bortoluzzi G., Carrara G., Fabretti P., Penitenti D., GilodD., Peyve A.A., Skolotnev S. and Turko N., Death and trasfiguration of a triple junction inthe South Atlantic, 1997,Science, 276, 243-246.
[Ligi et al.(1999)] Ligi, M., E. Bonatti, G. Bortoluzzi, G. Carrara, P. Fabretti, D. Gilod, A. A.Peyve, S. Skolotnev, and N. Turko, Bouvet Triple Junction in the South Atlantic: Geologyand evolution, 1999. J. Geophys. Res., 104(B12), 29,365-29,386.
[Morgan (1972)] Morgan W.J., Plate motions and deep mantle convection. Geol.Soc.Am. Memoir,1972.
[Sandwell et al.(1995)] Sandwell D.T., Yale M.M, and Smith W.H.F., Gravity anomaly profilesfrom ERS-1, TOPEX and GEOSAT Altimetry,1995, EOS Trans. AGU, 76, Spring Meet.Suppl;S89.
[Small (1995)] Small C. , Observations of ridge-hotspot interactions in the Southern Ocean, 1995,J.Geophys.Res, 100, 17931-17946.
[Sandwell and Smith(2001)] URL: topex.ucsd.edu/marine topo/text/topo.html
[Sclater et al.(1976)] Sclater J.G., Bowin C, Hey R., Hoskins H., Peirce J, Philips L and TapscottC, The Bouvet Triple Junction,1976, J.Geophys.Res., 81, 1857-1869.
Bortoluzzi G. et al., ISMAR Bologna INTERIM TECHNICAL REPORT
21
[Simonov et al.(1996)] Simonov S., Peyve A.A., Kolobov V.Y., Milosonov A.A. and Koviazin S.V.,Magmatic and hydrothermalprocesses in the Bouvet Triple Junction region (South Atlantic),1996, Terra Nova, 8, 415-420.
[Wessel and Smith (1995)] Wessel P. and Smith W.H.F., New version of the Generic MappingToolreleased, EOS Trans. AGU, p.329, 1995, see alsoURL: gmt.soest.hawaii.edu.
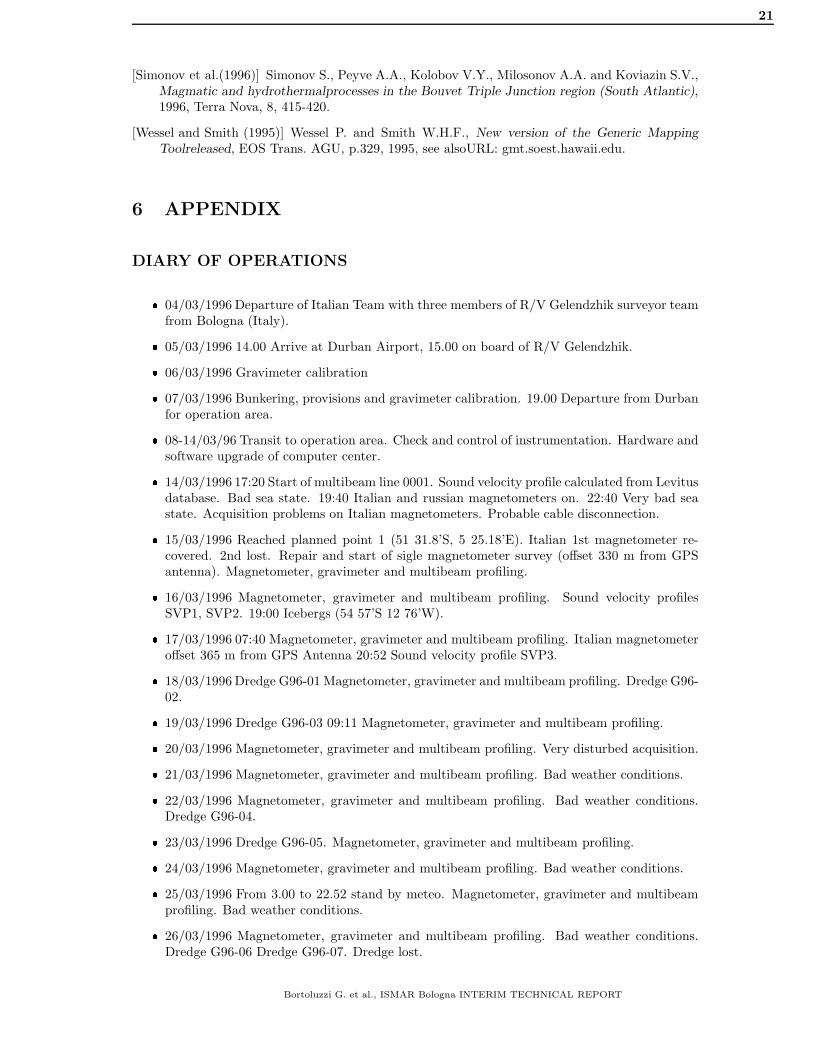
6 APPENDIX
DIARY OF OPERATIONS� 04/03/1996 Departure of Italian Team with three members of R/V Gelendzhik surveyor teamfrom Bologna (Italy).� 05/03/1996 14.00 Arrive at Durban Airport, 15.00 on board of R/V Gelendzhik.� 06/03/1996 Gravimeter calibration� 07/03/1996 Bunkering, provisions and gravimeter calibration. 19.00 Departure from Durbanfor operation area.� 08-14/03/96 Transit to operation area. Check and control of instrumentation. Hardware andsoftware upgrade of computer center.� 14/03/1996 17:20 Start of multibeam line 0001. Sound velocity profile calculated from Levitusdatabase. Bad sea state. 19:40 Italian and russian magnetometers on. 22:40 Very bad seastate. Acquisition problems on Italian magnetometers. Probable cable disconnection.� 15/03/1996 Reached planned point 1 (51 31.8’S, 5 25.18’E). Italian 1st magnetometer re-covered. 2nd lost. Repair and start of sigle magnetometer survey (offset 330 m from GPSantenna). Magnetometer, gravimeter and multibeam profiling.� 16/03/1996 Magnetometer, gravimeter and multibeam profiling. Sound velocity profilesSVP1, SVP2. 19:00 Icebergs (54 57’S 12 76’W).� 17/03/1996 07:40 Magnetometer, gravimeter and multibeam profiling. Italian magnetometeroffset 365 m from GPS Antenna 20:52 Sound velocity profile SVP3.� 18/03/1996 Dredge G96-01 Magnetometer, gravimeter and multibeam profiling. Dredge G96-02.� 19/03/1996 Dredge G96-03 09:11 Magnetometer, gravimeter and multibeam profiling.� 20/03/1996 Magnetometer, gravimeter and multibeam profiling. Very disturbed acquisition.� 21/03/1996 Magnetometer, gravimeter and multibeam profiling. Bad weather conditions.� 22/03/1996 Magnetometer, gravimeter and multibeam profiling. Bad weather conditions.Dredge G96-04.� 23/03/1996 Dredge G96-05. Magnetometer, gravimeter and multibeam profiling.� 24/03/1996 Magnetometer, gravimeter and multibeam profiling. Bad weather conditions.� 25/03/1996 From 3.00 to 22.52 stand by meteo. Magnetometer, gravimeter and multibeamprofiling. Bad weather conditions.� 26/03/1996 Magnetometer, gravimeter and multibeam profiling. Bad weather conditions.Dredge G96-06 Dredge G96-07. Dredge lost.
Bortoluzzi G. et al., ISMAR Bologna INTERIM TECHNICAL REPORT

22� 27/03/1996 Magnetometer, gravimeter and multibeam profiling. Bad weather conditions.� 28/03/1996 Magnetometer, gravimeter and multibeam profiling. Sound velocity profile SVP4.� 29/03/1996 Start of Shona SMT survey. Magnetometer, gravimeter and multibeam profiling.Bad weather conditions.� 30/03/1996 Magnetometer, gravimeter and multibeam profiling. Strong wind. Dredge G96-08. Heat Flow 01. Dredge G96-09. Sound velocity SVP5.� 31/03/1996 Start of MAR survey. Magnetometer, gravimeter and multibeam profiling. Badweather conditions. Heat Flow 02.� 01/04/1996 Start of Spiess survey. Magnetometer, gravimeter and multibeam profiling. Badweather conditions. Heat Flow 03.� 02-03/04/1996 Magnetometer, gravimeter and multibeam profiling. Bad weather conditions.� 04-08/04/1996 Start of Bouvet F.Z. survey. Magnetometer, gravimeter and multibeam pro-filing.� 09/04/1996 Magnetometer, gravimeter and multibeam profiling. Bad weather condition.� 10/04/1996 Magnetometer, gravimeter and multibeam profiling. Bad weather condition 17:18Multibeam Stand by Meteo, 55 11,57’S 0 16,06’W. Italian magnetometer OK.� 11/04/1996 18:21 End of Stand by Meteo. Magnetometer, gravimeter and multibeam profil-ing. Bad weather condition.� 12/04/1996 Magnetometer, gravimeter and multibeam profiling. Dredge G96-10. Heat Flow04.� 13/04/1996 Magnetometer, gravimeter and multibeam profiling. Dredges G96-11, 12, 13, 14,15, 16.� 14/04/1996 Magnetometer, gravimeter and multibeam profiling. Dredges G96-17,18. SoundVelocity station SVP6.� 15 -16/04/1996 Magnetometer, gravimeter and multibeam profiling.� 17/04/1996 Magnetometer, gravimeter and multibeam profiling. Heat Flow 05. DredgesG96-19, 20, 21.� 18/04/1996 Magnetometer, gravimeter and multibeam profiling. Dredges G96-22, 23. 17:33Multibeam Stand by Meteo.� 19/04/1996 Stand by Meteo, sea state 12.� 20/04/1996 18:34 End of Stand by Meteo. Magnetometer, gravimeter and multibeam profil-ing. Bad weather condition.� 21/04/1996 Magnetometer, gravimeter and multibeam profiling. Dredge G96-24.� 22/04/1996 Magnetometer, gravimeter and multibeam profiling. Dredge G96-25, 26.� 23/04/1996 Magnetometer, gravimeter and multibeam profiling. Big iceberg detected onradar. 05:47 End of survey (52 33,90’S 3 00’W). 08.30 Transit to Abidjan� 24/04- 01/05/1996 Transit to Abidjan. Magnetometer and multibeam profiling.� 04/05/1996 Bunker Port Gentil.� 08/05/1996 Arrive in Abidjan.� 09/05/1996 Gravimeter calibration.� 10/05/1996 End Cruise.
Bortoluzzi G. et al., ISMAR Bologna INTERIM TECHNICAL REPORT