KFC v. Iowa; Amicus Brief of Institute for Professionals in Taxation

Institute of Ag Professionals
Proceedings of the
2008 Crop Pest Management Shortcourse &
Minnesota Crop Production Retailers Association Trade Show
www.extension.umn.edu/AgProfessionals
Do not reproduce or redistribute without the written consent of author(s).

Effective Utilization of Starter
Fertilizer for Corn in Minnesota
Daniel Kaiser
University of Minnesota
612-624-3482
[email protected]://www.tc.umn.edu/~dekaiser/
Current Guidelines
• Products
– What will give the most benefit
• Early growth
• Yield
– Seed Safe Products
• Major nutrients of concern
– What placements are the most effective
• Product availability
• It is a balancing act between cost and potential
benefits

Utilizing Starter Fertilizer
• Costs
– Price per unit nutrient is higher for liquid
fertilizers
– High rates of nutrients are not economical
compared to dry
– Dry fertilizers can be used
• Dry 2x2 band use to be popular
• No clear guidelines for dry fertilizer as a “pop-up”

Nutrient Usage By Corn
•Rapid uptake of most nutrients after V6
•Uptake follows dry matter accumulation
•Nutrients are still needed early in the
season
Source: How a Corn Plant Develops, ISU

Utilizing Starter Fertilizer• Supplying Nutrients to Plants
– Nitrogen• Proteins, photosynthesis, carbohydrate production
– Phosphorus• Energy, genetic materials (cell division)
– Potassium• Charge balancer, water relations, protein activation
– Sulfur• Protein synthesis, photosynthesis (indirectly)
– Zinc• Protein metabolism, chlorophyll production

Nutrient Availability
• Temperature and pH control many soil
processes
• As soil temperature decreases:
– Soil reactions decrease
– Diffusion decreases
• Roots must have a close supply of nutrients
• As pH increases
– Shifts forms of nutrients in the soil
• More NH3 vs NH4+
• Reduces the solubility of some metals

Utilizing Starter FertilizerPlacement Pros and Cons
• Placement
– 2x2
• Higher fertilizer rates, more equipment needed
– Pop up
• Lower fertilizer rates, less equipment needed
– Near the row (1” or more between the seed)
• Higher rates can be used if placed 1” or more away from the
seed
– Surface banded
• Less equipment needed, immobile nutrients (P & K) may not
get to the roots

Utilizing Starter FertilizerIssues and Concerns
• What to look for with different nutrients:– Nitrogen
• Ionic bonding, Ammonia producing, urea is neutral
– Phosphorus• Covalent bonding, low salt content
– Potassium• Strong ionic bonding, high salt content
– Sulfur• Ionic bonds, high salts
– Zinc• Ionic and covalent bonds

Salt Index: A tool for “pop-up”
application?• Definition
– Measure of the salt concentration that the fertilizer induces in solution
– Compared to sodium nitrate (NaNO3 = SI of 100)
• Nutrients of main concern– Ionic bonding nutrients (increase osmotic potential)
• Nitrogen
• Potassium (chloride)
• Sulfur
• Salt index is a relative measure used to compare formulations– It will not tell you how much to apply or how much you can apply

Source N P2O5 K2O S
Per equal wgt
of materials
per unit of
nutrients
Nitrogen/Sulfur
Anhydrous Ammonia 82% 47.1 0.572
Ammonium Nitrate 34% 104.0 3.059
Ammonium Sulfate 21% 24% 68.3 3.059
Ammonium Thiosulfate 12% 26% 90.4 3.252
Urea 46% 74.4 1.618
UAN (39% am. nitrate & 31% urea) 28% 63.0 2.250
(44% am. nitrate & 35% urea) 32% 71.1 2.221
Phosphorus
APP 10% 34% 20.0 0.455
DAP 18% 46% 29.2 0.456
MAP 11% 52% 26.7 0.405
Phosphoric Acid 54% 1.613**
72% 1.754**
Potassium
Monopotassium phosphate 52% 35% 8.4 0.097
Potassium Chloride 62% 120.1 1.936
Potassium Sulfate 50% 18% 42.6 0.852
Pot. Thiosulfate 25% 17% 68.0 2.720
One unit equals 20lb
**Salt index per 100 lbs H3PO4
--------------------%--------------------
Salt IndexSalt Index of Common Fertilizer Materials
(Partial Salt Indexes)
Compiled by J. Mortvedt

Calculating Salt Index: 7-21-7
**For those who like math**
• List Materials, grade, and weight in the product
in the table
Material % Nutrient lbs/ton N P2O5 K2O
Per unit (20
lb)
In
Formulation
10-34-0 10%N, 34% P 1235
UAN 28% N 57
KCl 62% K 226
Water - 482
Totals 2000
Salt IndexNutrient Units
Setting up the table

Calculating Salt Index: 7-21-7
Material % Nutrient lbs/ton N P2O5 K2O
Per unit (20
lb)
In
Formulation
10-34-0 10%N, 34% P 1235 6.2 21.0 -
UAN 28% N 57 0.8 - -
KCl 62% K 226 - - 7.0
Water - 482 - - -
Totals 2000
Nutrient Units Salt Index
Determining the nutrient units
Multiply Nutrient concentration x weight and divide that number by 20
Remember: each nutrient unit = 20 lbs so divide by 20
Example KCL: [ ( 0.62 x 226 ) / 20 = 7.0

Calculating Salt Index: 7-21-7
Determining the salt index in formulation
Obtain the partial salt index (Table in Slide 10)
In formulation: Add nutrient units and multiply by the partial salt index
Add the salt index from each individual component
Example 10-34-0: [ ( 6.2 + 21.0 ) * 0.455 = 12.4
Material % Nutrient lbs/ton N P2O5 K2O
Per unit (20
lb)
In
Formulation
10-34-0 10%N, 34% P 1235 6.2 21.0 - 0.455 12.4
UAN 28% N 57 0.8 - - 2.250 1.8
KCl 62% K 226 - - 7.0 1.936 13.6
Water - 482 - - - -
Totals 2000 27.8
Nutrient Units Salt Index
Salt index

Material % Nutrient lbs/ton N P2O5 K2O
Per unit (20
lb)
In
Formulation
Amm. 82% N 146 6.0 - - ** -
Phos acid 54% P 666 - 18.0 - 1.613 10.7
Pot.PHOS 22% K, 22% P 546 - 6.0 6.0 0.097 1.2
Water - 642 - - - -
Totals 2000 11.9
** Ammoniation of phosphoric acid to a 1-3-0 ratio forms a mixture of MAP and DAP
Nutrient Units Salt Index
Calculating Salt Index: 6-24-6
Determining the salt index in formulation
Salt index is much lower than 7-21-7
Why: Potassium phosphate in the formulation has a much lower partial
salt index and contributes little to the total salt index
Salt index

Product
Formulation Salt Index
Salt Index per Plant
Nutrient (20lb)
2-20-20 7.2 0.17
3-18-18 8.5 0.22
6-24-6 11.5 0.32
6-30-30 13.8 0.30
9-18-9 16.7 0.48
10-34-0 20.0 0.45 Use seed placement with caution
7-21-7 27.8 0.79
4-10-10 27.5 1.18
28% UAN 63.0 2.25
These grade use potassium
phosphate as a K source
Not recommended for seed
placement
Salt Index of Common Fertilizer Formulations
For Those Who Don’t!!

Seed Safe Starter Study
Evaluate the impact of three fluid fertilizers
applied at two rates and placed near the seed
at planting on corn emergence, early growth,
P uptake, and yield
Year County pH P K SOM Texture
----%----
2004 Sibley 6.6 63 215 4.3 SCL
2004 Benton 6.5 133 68 1.0 LFS
2005 Renville 6.4 24 157 1.5 SCL
2005 Dakota 6.2 24 78 1.4 LFS
2006 Redwood 5.4 15 119 3.9 CL
2006 Benton 6.4 56 112 1.3 LFS
----------ppm----------

Variables Considered• Soil Type
– Loamy fine sand vs. silty clay- and clay loam
• Fertilizer Grade– 4-10-10, 10-34-0, and 3-18-18
• Placement– With seed, dual band above (2004), single band
above, band below the seed (2005 & 2006)
• Fertilizer Rate– 5 and 10 gpa 10-34-0 (6-20-0 lb N-P2O5-K2O ac-1)
– 5 and 10 gpa 4-10-10 (2-5-5 lb N-P2O5-K2O ac-1)
– 3.4 and 6.8 gpa 3-18-18 (1-5-5 lb N-P2O5-K2O ac-1)
Fine Textured Sites• No significant impacts on corn
emergence
– Product
– Rate
– Placement
• Yield trends followed emergence trends
• Moisture was not a limiting factor at these sites

Location Grade Rate Placement GxP GxR PxR GxPxR
Benton 2004 ** ** **
Dakota 2005 ** ** **
Benton 2006 ** **† **treatment effect significantly difference at P <0.05
Statistics†
Effect on corn emergence at
locations with sandy soil texture
Location Grade high low high low high low high low
Benton 2004 10-34-0 81.3 99.2 87.8 107.9 84.2 107.2
4-10-10 110.1 106.5 112.3 106.5 110.8 102.9
3-18-18 100.0 109.4 105.5 102.2 113.7 102.9
Dakota 2005 10-34-0 67.4 92.9 68.8 94.3 68.1 85.1
4-10-10 92.9 105.0 90.1 102.8 92.2 102.1
3-18-18 95.0 106.4 102.1 107.1 90.8 104.1
Benton 2006 10-34-0 91.6 98.5 88.6 93.9 87.0 103.1
4-10-10 96.9 103.8 96.2 100.0 100.0 100.8
3-18-18 104.6 95.4 104.6 100.8 100.8 103.1
----------------------------------------------% of Control------------------------------------------
Placment and Rate
Dual Band Above With Seed Sigle Band Above Below Seed
Rehm, 2008

Effect on corn yield at locations
with sandy soil texture
Location Grade Rate Placement GxP GxR PxR GxPxR
Benton 2004 ** **
Dakota 2005 ** ** **
Benton 2006 ** **† **treatment effect significantly difference at P <0.05
Statistics†
Location Grade high low high low high low high low
Benton 2004 10-34-0 171.9 187.9 183.6 201.6 180.8 187.0
4-10-10 197.0 191.9 180.8 181.6 195.1 187.5
3-18-18 186.0 188.4 189.7 180.1 190.0 177.9
Dakota 2005 10-34-0 154.5 176.3 170.0 190.0 151.4 198.8
4-10-10 192.2 203.2 187.9 208.1 200.8 190.3
3-18-18 188.7 207.2 205.1 202.9 200.5 203.8
Benton 2006 10-34-0 208.4 204.0 195.9 205.0 203.2 199.5
4-10-10 209.2 212.3 216.2 205.9 211.2 219.9
3-18-18 214.5 210.7 219.6 224.0 203.7 203.7
----------------------------------------------bu ac-1
------------------------------------------
Placment and Rate
Dual Band Above With Seed Sigle Band Above Below Seed
Rehm, 2008

Urea in Contact with Seed
• Sandy soils– Highest probability of stand damage
• 2x2 banded urea did not reduce stand or yield– Not shown
N Applied with
Seed
Emerged
PopulationGrain Yield
lb./acre plants/acre bu./acre
0 29,968 181
7.5 21,127 156
15.0 15,246 145
30.0 7,550 96

Recommendations• Limit UAN or other ammonia liberating sources
on sandy textured soils
– No more than 5 gpa 10-43-0 on sandy soils
• That rate still may be too much
• Recommend switching to a low salt fertilizer or a source
higher P and K and lower N
• Higher rates can be used on fine textured soils
– As long as moisture is not limiting
• May need to put a high consideration on
ammonia content relative to salts

What Nutrients Should be
Included?
• Phosphorus
• Nitrogen
• Potassium
• Sulfur
• Zinc

Sulfur in Starter (3 yr Corn Yield)Waseca – Randall and Vetsch
None
Popup
6-2
0-6-
4
20-2
0-6-
4
20-2
0-0-
4
20-2
0-6-
0
Average
2 x 02 x 2
170
175
180
185
190
195
200
205
210
Co
rn Y
ield
(b
u/a
c)
Average
2 x 0
2 x 2

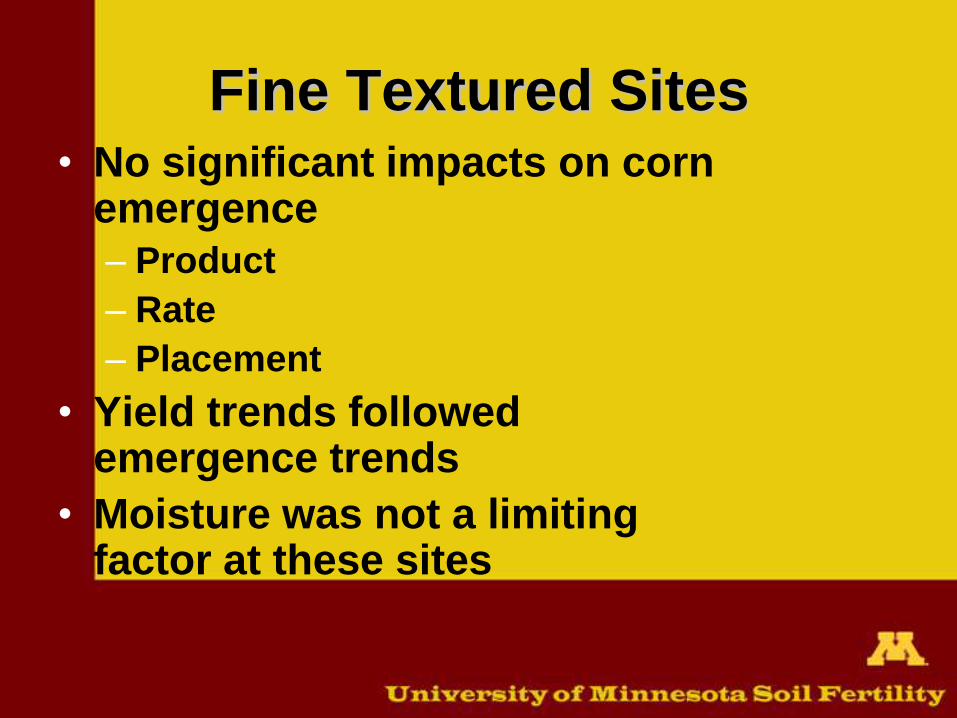
Field Scale Response to S
• Are all soils created equal in their
probability of response to S?
•Replicated strip trials
•120’ x 120’ grid cells
•Sulfur starter
•With nitrogen
•With phosphorus
Kaiser and Lamb, 2008
Field Scale Response to S• Large response in
low SOM
– Sandy soils
– Eroded areas
• In high SOM sites responses likely to other nutrients
– S mineralization is high
• No interaction between N, P, or S
– Sandy soils –response likely due to deficiency of other nutrients
Co
rn Y
ield
In
cre
ase
(%
)
0
2
4
6
8
10
12
Broadcast S
Starter N
Starter N+S
Starter N+P
Starter N+P+S
ClarkfieldNishna CL
34 ppm P
4.3% SOM
Clarks GroveLester L11 ppm P
2.0% SOM
Isanti WestZimmerman FSL
9 ppm P
0.7% SOM
* *
* *

Considerations for S Application
• Most S fertilizer forms are risky for seed
placement
– High salt contents, ammonia forming (ATS)
• Rate
– Rates can be cut for band application
• 10-15 lbs
• Placement
– Place away from the seed

Response to Starter K• No clear starter effect from K
• Responses tied to soil test
• Interactions between other nutrients are unclear
– N and K interaction have been studied
• Banded K more efficient than broadcast K
Starter
None K N NP NK NPK
Co
rn Y
ield
(b
u/a
c)
150
160
170
180
190
200
b
a a a
ab
a
3-18-18 Starter 0-0-30 Starter
Site Control Broadcast Alone + Broadcast Alone + Broadcast
------------------------bu/ac-----------------------
1 161.2b 192.8a 182.0a 183.6a 184.5a 188.7a
2 158.7b 176.3a 176.3a 184.7a 171.2ab 177.5a
3 179.3 177.1 182.7 183.3 172.5 182.7
4 170.5b 210.4a 172.0b 208.9a 175.4b 209.0a
5 169.2c 204.2a 184.1bc 204.9a 184.0bc 194.5ab
6 128.9b 169.5a 146.9ab 162.6a 153.7ab 171.5a
Means 161.3c 188.4a 174.0b 188.0a 173.6b 187.3a
Kaiser and Potter, 2008
Mallarino and Kaiser - ISU, 2005
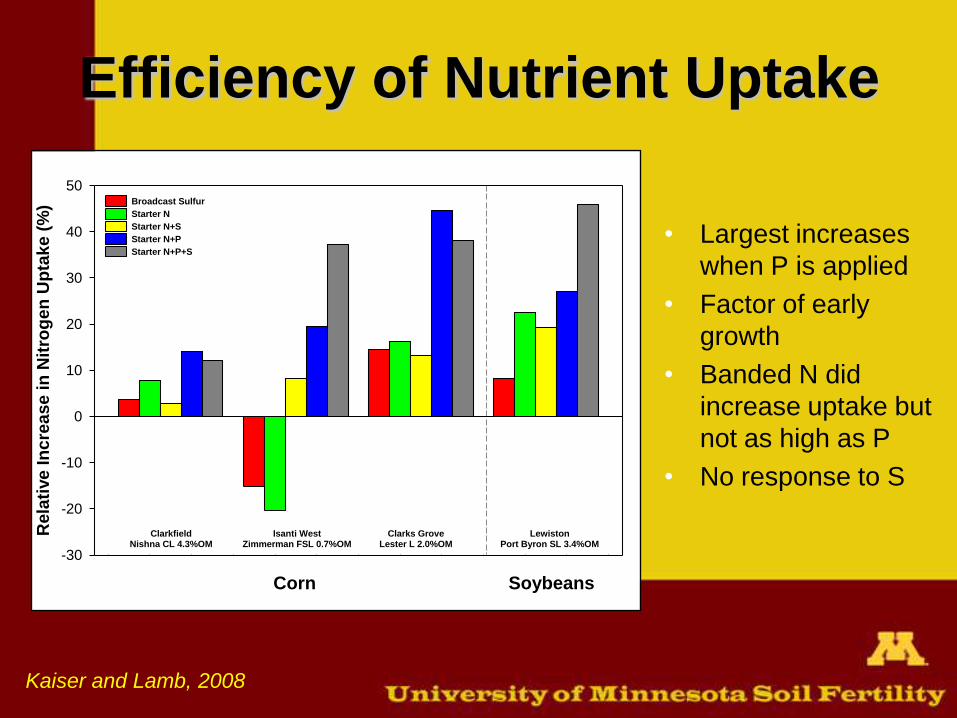
Efficiency of Nutrient Uptake
• Largest increases
when P is applied
• Factor of early
growth
• Banded N did
increase uptake but
not as high as P
• No response to S
Rela
tive In
cre
ase in
Nit
rog
en
Up
take (
%)
-30
-20
-10
0
10
20
30
40
50Broadcast Sulfur
Starter N
Starter N+S
Starter N+P
Starter N+P+S
Corn Soybeans
ClarkfieldNishna CL 4.3%OM
Isanti WestZimmerman FSL 0.7%OM
Clarks GroveLester L 2.0%OM
LewistonPort Byron SL 3.4%OM
Kaiser and Lamb, 2008

Efficiency of Nutrient UptakeR
ela
tive
In
cre
as
e i
n S
ulf
ur
Up
tak
e (
%)
-20
-10
0
10
20
30
40
50
60Broadcast Sulfur
Starter N
Starter N+S
Starter N+P
Starter N+P+S
Corn Soybeans
ClarkfieldNishna CL 4.3%OM
Isanti WestZimmerman FSL 0.7%OM
Clarks GroveLester L 2.0%OM
LewistonPort Byron SL 3.4%OM
Kaiser and Lamb, 2008
• Largest increases
when P is applied
• Factor of early
growth
• Banded S did
increase S uptake
but not as high as
P in starter
• No response to S
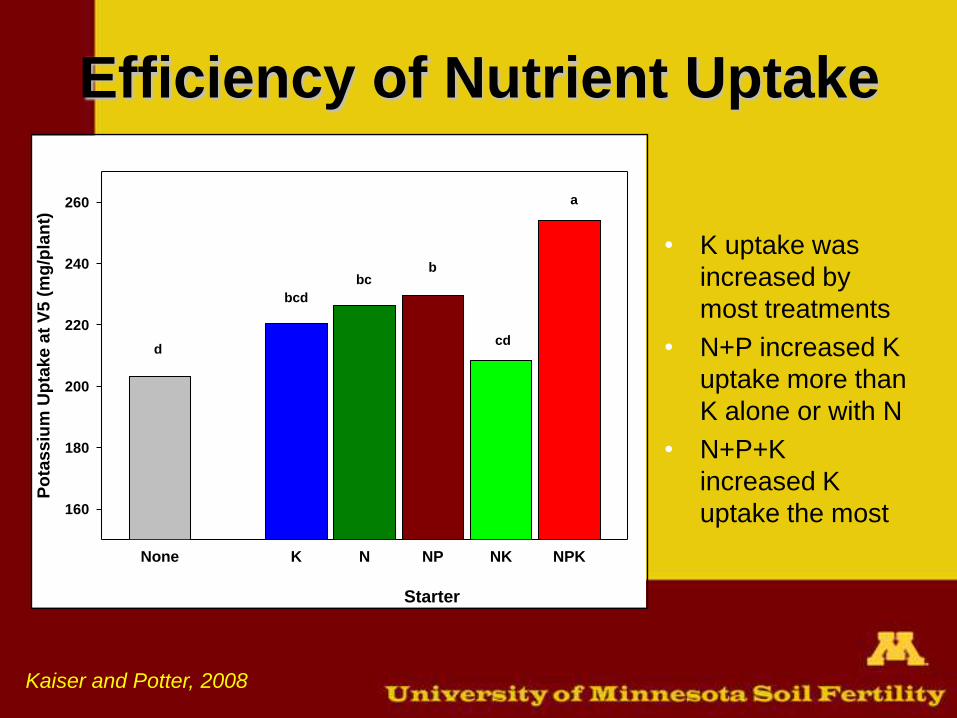
Efficiency of Nutrient Uptake
• K uptake was
increased by
most treatments
• N+P increased K
uptake more than
K alone or with N
• N+P+K
increased K
uptake the most
Kaiser and Potter, 2008
Starter
None K N NP NK NPK
Po
tassiu
m U
pta
ke a
t V
5 (
mg
/pla
nt)
160
180
200
220
240
260
d
bcd
b
cd
bc
a
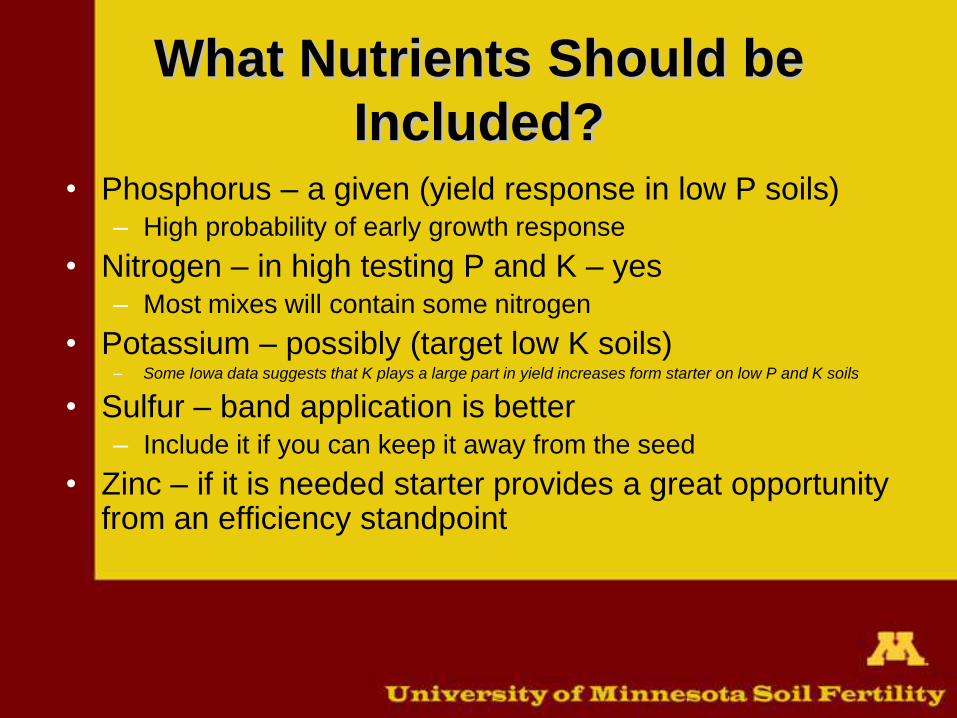
What Nutrients Should be
Included?• Phosphorus – a given (yield response in low P soils)
– High probability of early growth response
• Nitrogen – in high testing P and K – yes– Most mixes will contain some nitrogen
• Potassium – possibly (target low K soils)– Some Iowa data suggests that K plays a large part in yield increases form starter on low P and K soils
• Sulfur – band application is better– Include it if you can keep it away from the seed
• Zinc – if it is needed starter provides a great opportunity from an efficiency standpoint

Starter vs. Broadcast
• What are the economic benefits of either
system?
• How does soil test classification affect
which should be used?
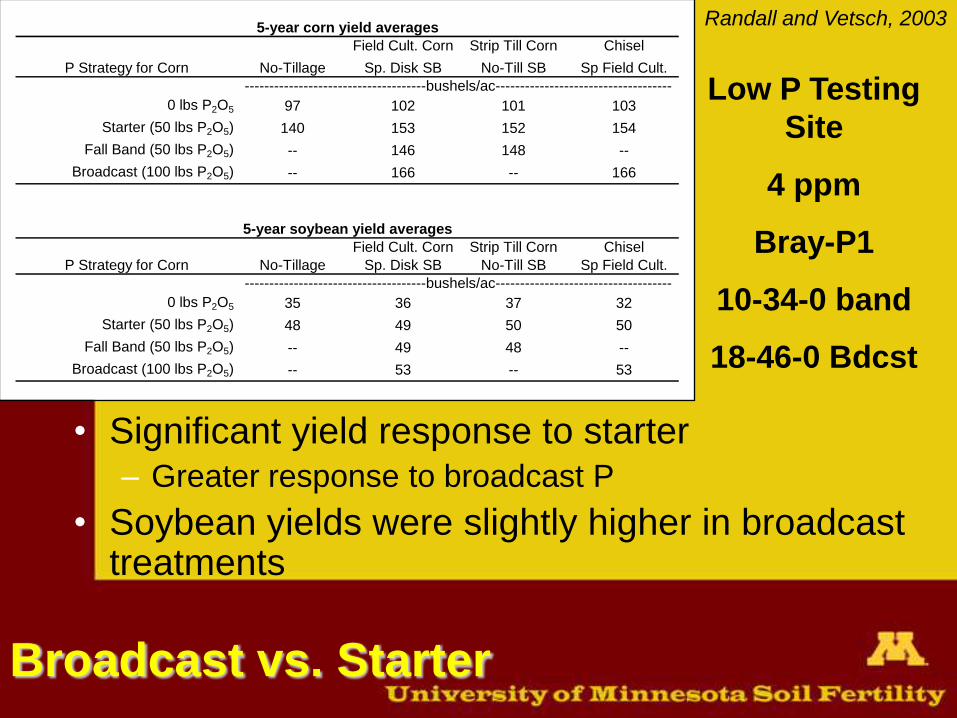
Broadcast vs. Starter
• Significant yield response to starter– Greater response to broadcast P
• Soybean yields were slightly higher in broadcast treatments
Field Cult. Corn Strip Till Corn Chisel
P Strategy for Corn No-Tillage Sp. Disk SB No-Till SB Sp Field Cult.
0 lbs P2O5 97 102 101 103
Starter (50 lbs P2O5) 140 153 152 154
Fall Band (50 lbs P2O5) -- 146 148 --
Broadcast (100 lbs P2O5) -- 166 -- 166
Field Cult. Corn Strip Till Corn Chisel
P Strategy for Corn No-Tillage Sp. Disk SB No-Till SB Sp Field Cult.
0 lbs P2O5 35 36 37 32
Starter (50 lbs P2O5) 48 49 50 50
Fall Band (50 lbs P2O5) -- 49 48 --
Broadcast (100 lbs P2O5) -- 53 -- 53
-------------------------------------bushels/ac------------------------------------
-------------------------------------bushels/ac------------------------------------
5-year soybean yield averages
5-year corn yield averages
Low P Testing
Site
4 ppm
Bray-P1
10-34-0 band
18-46-0 Bdcst
Randall and Vetsch, 2003

Broadcast vs. Starter
• Small corn yield response to starter and broadcast P
• No yield increase from starter or broadcast P in soybean
High P
Testing Site
19 ppm
Bray-P1
Field Cult. Corn Strip Till Corn Chisel
P Strategy for Corn No-Tillage Sp. Disk SB No-Till SB Sp Field Cult.
0 lbs P2O5 156 161 164 165
Starter (40 lbs P2O5) 160 168 168 170
Fall Band (40 lbs P2O5) -- 165 165 --
Broadcast (80 lbs P2O5) -- 176 -- 176
Field Cult. Corn Strip Till Corn Chisel
P Strategy for Corn No-Tillage Sp. Disk SB No-Till SB Sp Field Cult.
0 lbs P2O5 51 54 53 52
Starter (40 lbs P2O5) 52 55 52 55
Fall Band (40 lbs P2O5) -- 54 53 --
Broadcast (80 lbs P2O5) -- 55 -- 55
5-year corn yield averages
-------------------------------------bushels/ac------------------------------------
5-year soybean yield averages
-------------------------------------bushels/ac------------------------------------
Randall and Vetsch, 2003

Broadcast vs. Starter - Economics
Low Testing Field
High Testing Field
$7.20/gal 10-34-0 $1,100/ton 18-46-0
$3.00/bu corn $8.00/bu soybeans
Randall and Vetsch, 2004
Corn SB Corn SB Corn Soybean Total Corn Soybean Total
Starter (50 lbs P2O5) 51 13 51 19 $61.72 $105.60 $167.32 $61.72 $151.20 $212.92
Fall Band (50 lbs P2O5) 44 13 -- -- $40.72 $105.60 $146.32 -- -- --
Broadcast (100 lbs P2O5) 64 17 63 22 $72.43 $133.60 $206.03 $69.43 $172.00 $241.43
Placement and Rate
----------bushels/ac---------- -------------$return/ac------------- -------------$return/ac-------------
Sp. Disk Sp. F. Cult Spring Disk - SB Spring Field Cult. - Both
Yield Response Net Return Per Acre Per Year
F. Cult Chisel Spring Field Cult. - Corn Chisel - Both
Corn SB Corn SB Corn Soybean Total Corn Soybean Total
Starter (40 lbs P2O5) 7 0 5 3 -$52.02 $0.00 -$52.02 -$58.02 $20.00 -$38.02
Fall Band (40 lbs P2O5) 0 0 -- -- -$73.02 $0.00 -$73.02 -- -- --
Broadcast (80 lbs P2O5) 15 0 11 3 -$50.65 $0.00 -$50.65 -$62.65 $24.80 -$37.85
Spring Field Cult. - Both
Placement and Rate
Net Return Per Acre Per YearYield Response
----------bushels/ac---------- -------------$return/ac------------- -------------$return/ac-------------
F. Cult
Sp. Disk
Chisel
Sp. F. Cult
Spring Field Cult. - Corn
Spring Disk - SB
Chisel - Both

Broadcast vs. StarterMallarino & Kaiser - Iowa
• 9 Locations
– 6 locations with similar soil series as SE and SC MN
• Corn-soybean rotations
– 3 rotations at 5 locations and 2 at 1 location
• Removal based broadcast for P and K versus 5
gal/ac 3-18-18 and both applied together
• Treatments applied to corn
– Applied to the same areas each rotation
• Low, medium, and high soil test levels
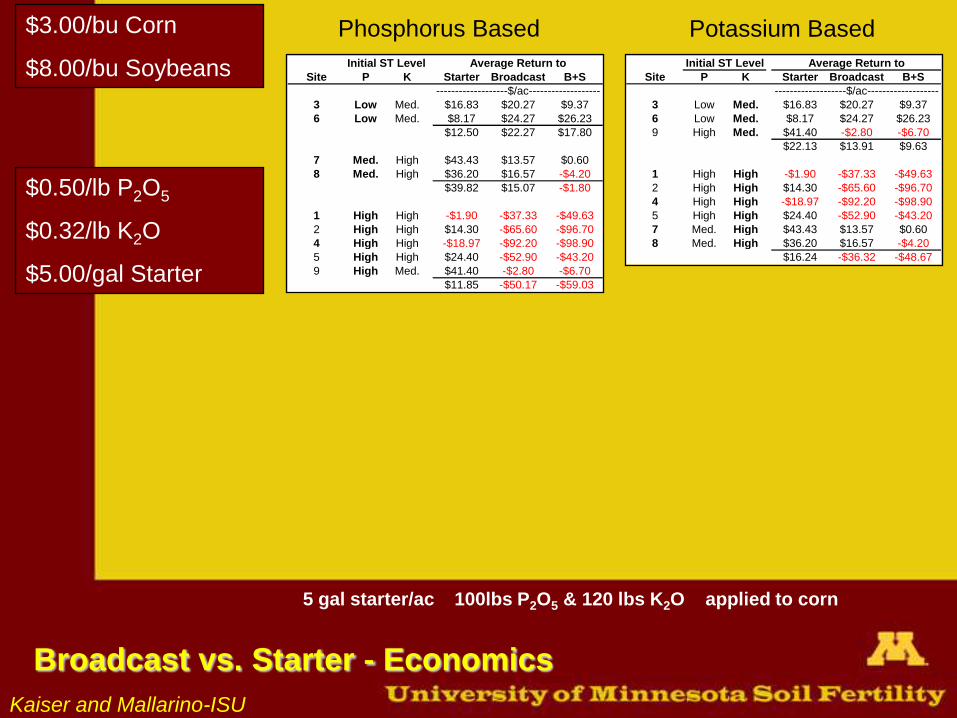
Broadcast vs. Starter - Economics
Phosphorus Based Potassium Based$3.00/bu Corn
$8.00/bu Soybeans
$0.50/lb P2O5
$0.32/lb K2O
$5.00/gal Starter
5 gal starter/ac 100lbs P2O5 & 120 lbs K2O applied to corn
Site P K Starter Broadcast B+S
3 Low Med. $16.83 $20.27 $9.37
6 Low Med. $8.17 $24.27 $26.23
$12.50 $22.27 $17.80
7 Med. High $43.43 $13.57 $0.60
8 Med. High $36.20 $16.57 -$4.20
$39.82 $15.07 -$1.80
1 High High -$1.90 -$37.33 -$49.63
2 High High $14.30 -$65.60 -$96.70
4 High High -$18.97 -$92.20 -$98.90
5 High High $24.40 -$52.90 -$43.20
9 High Med. $41.40 -$2.80 -$6.70
$11.85 -$50.17 -$59.03
-------------------$/ac-------------------
Initial ST Level Average Return to
Site P K Starter Broadcast B+S
3 Low Med. $16.83 $20.27 $9.37
6 Low Med. $8.17 $24.27 $26.23
9 High Med. $41.40 -$2.80 -$6.70
$22.13 $13.91 $9.63
1 High High -$1.90 -$37.33 -$49.63
2 High High $14.30 -$65.60 -$96.70
4 High High -$18.97 -$92.20 -$98.90
5 High High $24.40 -$52.90 -$43.20
7 Med. High $43.43 $13.57 $0.60
8 Med. High $36.20 $16.57 -$4.20
$16.24 -$36.32 -$48.67
-------------------$/ac-------------------
Initial ST Level Average Return to
Kaiser and Mallarino-ISU

Broadcast vs. Starter - Economics
Phosphorus Based Potassium Based$3.00/bu Corn
$8.00/bu Soybeans
$0.50/lb P2O5
$0.32/lb K2O
$5.00/gal Starter
$1.04/lb P2O5
$0.67/lb K2O
$8.00/gal Starter
5 gal starter/ac 100lbs P2O5 & 120 lbs K2O applied to corn
Site P K Starter Broadcast B+S
3 Low Med. $1.83 -$75.73 -$101.63
6 Low Med. -$6.83 -$71.73 -$84.77
-$2.50 -$73.73 -$93.20
7 Med. High $33.43 -$50.43 -$73.40
8 Med. High $21.20 -$79.43 -$115.20
$27.32 -$64.93 -$94.30
1 High High -$16.90 -$133.33 -$160.63
2 High High -$0.70 -$161.60 -$207.70
4 High High -$33.97 -$188.20 -$209.90
5 High High $9.40 -$148.90 -$154.20
9 High Med. $26.40 -$98.80 -$117.70
-$3.15 -$146.17 -$170.03
-------------------$/ac-------------------
Initial ST Level Average Return to
Site P K Starter Broadcast B+S
3 Low Med. $1.83 -$75.73 -$101.63
6 Low Med. -$6.83 -$71.73 -$84.77
9 High Med. $26.40 -$98.80 -$117.70
$7.13 -$82.09 -$101.37
1 High High -$16.90 -$133.33 -$160.63
2 High High -$0.70 -$161.60 -$207.70
4 High High -$33.97 -$188.20 -$209.90
5 High High $9.40 -$148.90 -$154.20
7 Med. High $33.43 -$50.43 -$73.40
8 Med. High $21.20 -$79.43 -$115.20
$2.08 -$126.98 -$153.51
-------------------$/ac-------------------
Initial ST Level Average Return to
Site P K Starter Broadcast B+S
3 Low Med. $16.83 $20.27 $9.37
6 Low Med. $8.17 $24.27 $26.23
$12.50 $22.27 $17.80
7 Med. High $43.43 $13.57 $0.60
8 Med. High $36.20 $16.57 -$4.20
$39.82 $15.07 -$1.80
1 High High -$1.90 -$37.33 -$49.63
2 High High $14.30 -$65.60 -$96.70
4 High High -$18.97 -$92.20 -$98.90
5 High High $24.40 -$52.90 -$43.20
9 High Med. $41.40 -$2.80 -$6.70
$11.85 -$50.17 -$59.03
-------------------$/ac-------------------
Initial ST Level Average Return to
Site P K Starter Broadcast B+S
3 Low Med. $16.83 $20.27 $9.37
6 Low Med. $8.17 $24.27 $26.23
9 High Med. $41.40 -$2.80 -$6.70
$22.13 $13.91 $9.63
1 High High -$1.90 -$37.33 -$49.63
2 High High $14.30 -$65.60 -$96.70
4 High High -$18.97 -$92.20 -$98.90
5 High High $24.40 -$52.90 -$43.20
7 Med. High $43.43 $13.57 $0.60
8 Med. High $36.20 $16.57 -$4.20
$16.24 -$36.32 -$48.67
-------------------$/ac-------------------
Initial ST Level Average Return to
Kaiser and Mallarino-ISU

Thank You
Daniel Kaiser
University of Minnesota
612-624-3482
[email protected]://www.tc.umn.edu/~dekaiser/