INSTITUTE FOR MONETARY AND ECONOMIC STUDIES BANK OF … · Yen carry trades have traditionally been...
29
IMES DISCUSSION PAPER SERIES INSTITUTE FOR MONETARY AND ECONOMIC STUDIES BANK OF JAPAN C.P.O BOX 203 TOKYO 100-8630 JAPAN You can download this and other papers at the IMES Web site: http://www.imes.boj.or.jp Do not reprint or reproduce without permission. The Broad Yen Carry Trade Masazumi Hattori and Hyun Song Shin Discussion Paper No. 2007-E-19
Transcript of INSTITUTE FOR MONETARY AND ECONOMIC STUDIES BANK OF … · Yen carry trades have traditionally been...
IMES DISCUSSION PAPER SERIES
INSTITUTE FOR MONETARY AND ECONOMIC STUDIES
BANK OF JAPAN
C.P.O BOX 203 TOKYO
100-8630 JAPAN
You can download this and other papers at the IMES Web site:
http://www.imes.boj.or.jp
Do not reprint or reproduce without permission.
The Broad Yen Carry Trade
Masazumi Hattori and Hyun Song Shin
Discussion Paper No. 2007-E-19
NOTE: IMES Discussion Paper Series is circulated in
order to stimulate discussion and comments. Views
expressed in Discussion Paper Series are those of
authors and do not necessarily reflect those of
the Bank of Japan or the Institute for Monetary
and Economic Studies.
IMES Discussion Paper Series 2007-E-19 October 2007
The Broad Yen Carry Trade
Masazumi Hattori* and Hyun Song Shin**
Abstract Yen carry trades have traditionally been viewed in narrow terms purely as a foreign exchange transaction. However, evidence from the waxing and waning of balance sheets of foreign banks operating in Japan points to a broader notion of the carry trade. Yen liabilities fund not only pure currency carry trades, but also fund the general increase in balance sheets of hedge funds and financial intermediaries. The difference in overnight rates across countries is a crucial determinant of balance sheet changes. Domestic monetary policy thus has a global dimension. Keywords: Yen carry trade; liquidity; risk appetite; monetary policy JEL classification: F31, G21, G24
* Director and Senior Economist, Deputy Head of Economics Section, Institute for Monetary
and Economic Studies, Bank of Japan (E-mail: [email protected])
** Professor of Economics, Princeton University (E-mail: [email protected]) An earlier version of this paper was presented at the Federal Reserve Bank of Chicago and International Monetary Fund joint conference on "Globalization and Systemic Risk", Chicago, September 27-28, 2007 under its former title, "Yen Liquidity". We are grateful to Richard Herring for his comments as the discussant, and to other participants for their feedback. The views expressed in this paper are those of the authors and do not necessarily represent those of the Bank of Japan.
1. Introduction
A carry trade is constructed by borrowing a low interest rate currency to fund the
purchase of a high interest rate currency - that is, in selling currencies forward that
are at a signi�cant forward premium. The �yen carry trade� in particular has
been a topical subject of debate over the last decade or more given the extended
period of low interest rates in Japan.
Although the carry trade is often portrayed purely as a bet on the foreign ex-
change markets, the signi�cance of the carry trade extends far beyond the narrow
con�nes of the FX market, and arguably extends into all reaches of the global
�nancial system. The key to understanding the wider signi�cance of the carry
trade is to follow the trail of leveraged bets through the �nancial system through
interlocking balance sheets of the �nacial intermediaries involved. Take an exam-
ple. A hedge fund that wishes to take on a larger position in a security obtains
funding from its prime broker (a Wall Street investment bank, say) by pledging
assets in a repurchase agreement (a �repo�). The prime broker, for its part, funds
the loan to the hedge fund by borrowing from another party. But who lends to
the Wall Street bank and at what rate?
If the Wall Street bank borrows in New York, it will pay a rate closely tied
to the short term US Dollar interbank rate. However, if it were to borrow in
Tokyo, and in Japanese Yen, it can borrow at the much lower yen overnight rate.
A bank with global reach can borrow yen through its Tokyo o¢ ce. The Tokyo
o¢ ce of the Wall Street bank then has yen liabilities to Japanese banks, but has
yen assets against its New York head o¢ ce. The lending by the Japan o¢ ce of
the Wall Street bank to its head o¢ ce is captured in its �intero¢ ce� accounts,
and reported to the Bank of Japan. By monitoring the waxing and waning of
the intero¢ ce accounts of foreign banks in Tokyo, we can gain a valuable window
1
on the overall risk appetite and the workings of the global �nancial system.
We �nd that the intero¢ ce accounts of foreign banks in Tokyo reveal some
important lessons. We focus on three in particular.
� Until recently, foreign banks have maintained a net long position in Japaneseassets through its intero¢ ce accounts. However, in the period leading up to
the credit crisis of 2007, yen liabilities of foreign banks surged, leading to an
unprecedented net short position in Japanese assets. We see this surge as
bearing the hallmarks of the yen carry trade, interpreted broadly as above.
These net short positions were sharply unwound in August 2007, coinciding
with the peak of the credit crisis of 2007.
� As found in Adrian and Shin (2007a) for the �uctuations in US primarydealer balance sheets, we �nd that the �uctuations in the size of the net
intero¢ ce accounts is intimately tied to the state of overall risk appetite, as
measured by the VIX index of implied volatility on the broader US stock
market. The periods when foreign banks have large yen liabilities are also
those periods with low readings of the VIX index. This fact gives a clue
as to why major global stock indices have been so closely aligned with the
exchange rates of high yielding currencies vis-à-vis the yen in recent years.
� Finally, we �nd that the di¤erence between the yen overnight rate and asummary measure of overnight rates in developed countries mirrors closely
the overall size of the net intero¢ ce accounts. Yen liabilities are high
when foreign overnight rates are high relative to overnight rates in Japan.
Conversely, when foreign overnight rates are close to Japanese rates, foreign
banks have low yen liabilities. During the period of exceptionally low US
interest rates in 2002 to 2004, foreign banks maintained low yen liabilities,
2
suggesting that they could satisfy their funding needs by borrowing in US
dollars without tapping the yen market.
This last bullet point holds potentially important lessons for monetary policy.
Although monetary policy is conducted primarily with domestic macroeconomic
conditions in mind, there are inevitable global spillovers of monetary policy. In re-
cent years, with the advent of formal in�ation-targeting and moves toward greater
focus on managing market expectations of future central bank actions, attention
has shifted away from short term rates as an important price variable in its own
right. Our preliminary �ndings suggest that short term rates and balance sheet
size may be important in their own right for the conduct of monetary policy.
The outline of our paper is as follows. We begin with a review of the in-
stitutional background of the intero¢ ce accounts of foreign banks in Japan and
chart the shifts in the balance sheet composition of foreign banks over time. We
chart the �uctuations in the intero¢ ce accounts, and highlight the surge in yen
liabilities immediately preceding the 2007 credit crisis. We then investigate how
the �uctuations in the net intero¢ ce accounts relate to risk appetite, as measured
by the VIX index, and how they relate to the di¤erence between foreign overnight
rates and the yen interest rate. We conclude with some tentative observations on
the implications of our �ndings for monetary policy.
2. Institutional Background
Our focus is the chain of balance sheet interconnections that link a global �nancial
intermediary with sources of yen funding. The stylized chain is depicted in �gure
2.1.
A Wall Street bank can tap short-term yen funds through its o¢ ce in Japan
by borrowing in the yen interbank market. Some of these funds will be lent on
3

Wall St BankNY Head Office
Wall St BankJapan Office
JapaneseBanks
Hedge Fund
Interofficeaccounts
JPY interbankmarket
Figure 2.1: Balance Sheet Trail
to its headquarters for further recycling to other users (e.g. hedge funds), or kept
on the bank�s books for its own use (such as funding its own proprietary trading
desk).
Two links in the chain are of particular interest in the context of this paper
- namely, the size of the short term lending and borrowing in the yen interbank
market (the �nal link), and the intero¢ ce accounts (the penultimate link). Al-
though the interbank positions will give some idea of the aggregate yen liabilities,
the intero¢ ce account gives an insight into how much of the yen liabilities are
used to fund activities outside Japan. The tell-tale signs of the �broad yen carry
trade�(if we may coin this term) would be the conjunction of:
� Large yen liabilities in the JPY interbank market
� Large net assets on the intero¢ ce account
This is because when yen funds are channeled for use outside Japan, there is
the conjunction of large yen borrowing and then the on-lending of these yen funds
to entitities outside Japan.
Figure 2.2 illustrates the trail through the balance sheet of the Japan o¢ ce of
the global bank. The left hand panel shows the initial stylized balance sheet of
4

Assets Liabilities
Japanesesecurities
call loans
call money
interofficeassets interoffice
liabilities
Assets Liabilities
Japanesesecurities
call loanscall money
interofficeassets interoffice
liabilities
Figure 2.2: Channeling of yen funds via intero¢ ce account
the Japan o¢ ce. The Japan o¢ ce holds various assets - such as Japanese securties
and loans to Japanese entities (�call loans�) - and funds the asset holding partly
by borrowing locally in the JPY interbank market (�call money�), and partly
by funding from its New York headquarters through the intero¢ ce liabilities.
In the left hand panel, the net intero¢ ce account (intero¢ ce assets � intero¢ ce
liabilities) is negative, meaning that the Wall Street bank holds a net long position
in Japanese assets.
The right hand panel of �gure 2.2 shows the incresed channeling of yen funds
to the New York head o¢ ce via the intero¢ ce account. The Japan o¢ ce borrows
more yen (increases call money), and then lends on the proceeds to the New York
headquarters through increased intero¢ ce assets. In the illustration in the right
hand panel, the net intero¢ ce account becomes positive, re�ecting the larger on-
lending to the New York o¢ ce. Such a position is tantamount to a net short
position in Japanese assets, and can be seen as part of the broad yen carry trade.
5
100
200
300
400
500
600
700Ja
n90
Jan
91
Jan
92
Jan
93
Jan
94
Jan
95
Jan
96
Jan
97
Jan
98
Jan
99
Jan
00
Jan
01
Jan
02
Jan
03
Jan
04
Jan
05
Jan
06
Jan
07
Date
100
billi
on y
en
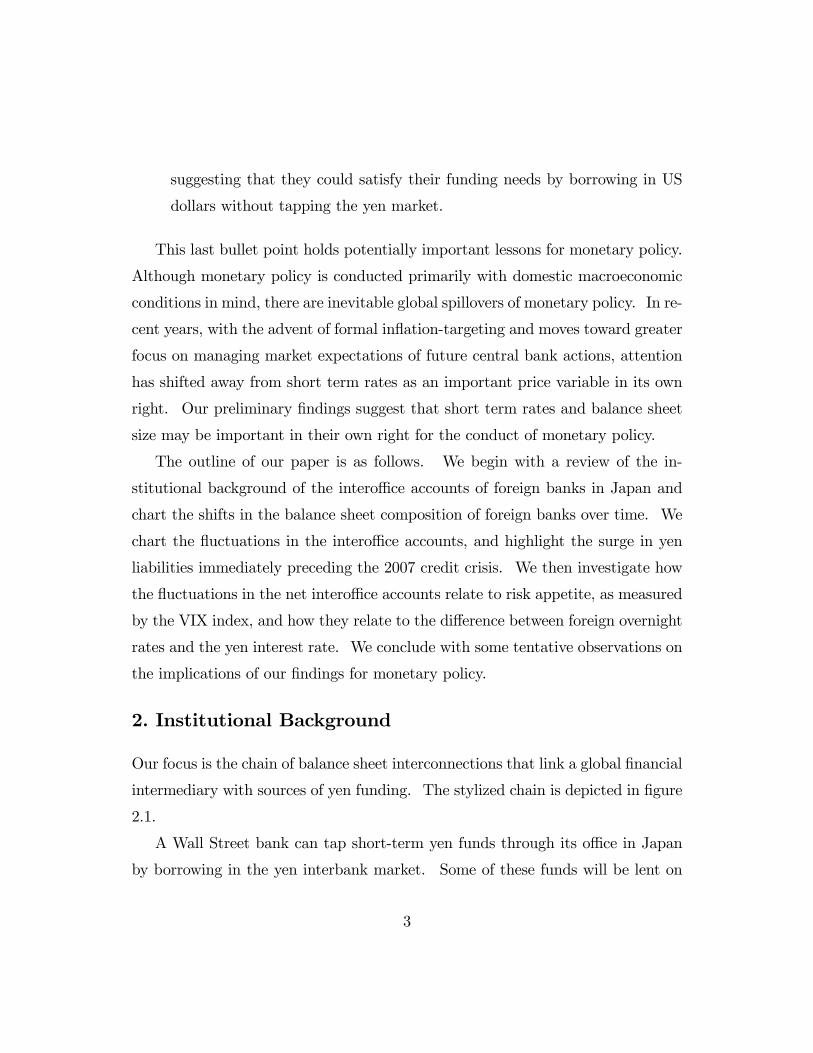
Figure 3.1: Total Assets of Foreign Banks in Japan
As we will see, the net intero¢ ce account has normally been negative, implying
that foreign banks have held net long positions in Japanese assets. However,
in the run-up to the credit crisis of 2007, the channeling of yen funds surged,
making net intero¢ ce accounts positive, until being unwound sharply in August
2007. The implication is that the broad yen carry trade reached a peak in this
most recent period leading up to the credit crisis of 2007.
3. A First Look at the Data
3.1. Total Assets of Foreign Banks in Japan
Before going to our key plots, we �rst plot the total assets of foreign banks in
Japan in �gure 3.1. Total assets of foreign banks increased rapidly in the late
90s, and have stayed high since. The composition of total assets (given in �gure
6
0
20
40
60
80
100
120
140Ja
n90
Jan
91
Jan
92
Jan
93
Jan
94
Jan
95
Jan
96
Jan
97
Jan
98
Jan
99
Jan
00
Jan
01
Jan
02
Jan
03
Jan
04
Jan
05
Jan
06
Jan
07
Date
100
billi
on y
en
Bills BoughtInvestment SecuritiesDue from BanksLoans and Bills DiscountedCall Loans
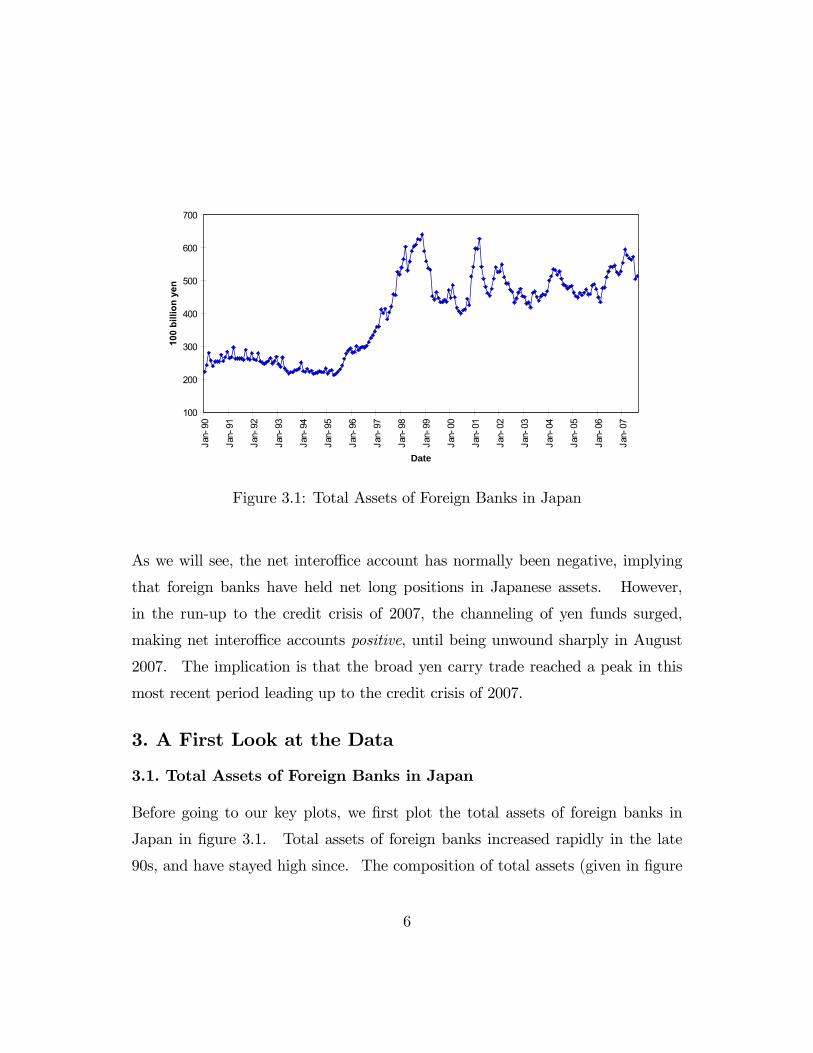
Figure 3.2: Composition of Assets of Foreign Banks in Japan
3.2) gives clues as to the reasons for the increase in the late 90s.
The sharp increase in foreign bank assets in 1997 and 1998 is accounted for
by the increase in �bills bought�. The Japan premium ruling at the time meant
that non-Japanese banks had a considerable pricing advantage over local Japanese
rivals, and managed to exploit this advantage.
Even as the �bills bought�amount falls in 1999 and 2000, the slack is taken
up by holdings of Japanese securities in 2000 and 2001. Lately, the item �due
from banks�has taken up the slack left by falls in other categories. This period
coincides with the period of quantitative easing by the Bank of Japan, and suggests
that even foreign banks had surplus balances at the BOJ.
7
0
5
10
15
20
25
30
35
40
45
50
Jan
90
Jan
91
Jan
92
Jan
93
Jan
94
Jan
95
Jan
96
Jan
97
Jan
98
Jan
99
Jan
00
Jan
01
Jan
02
Jan
03
Jan
04
Jan
05
Jan
06
Jan
07
Date
100
billi
on y
en
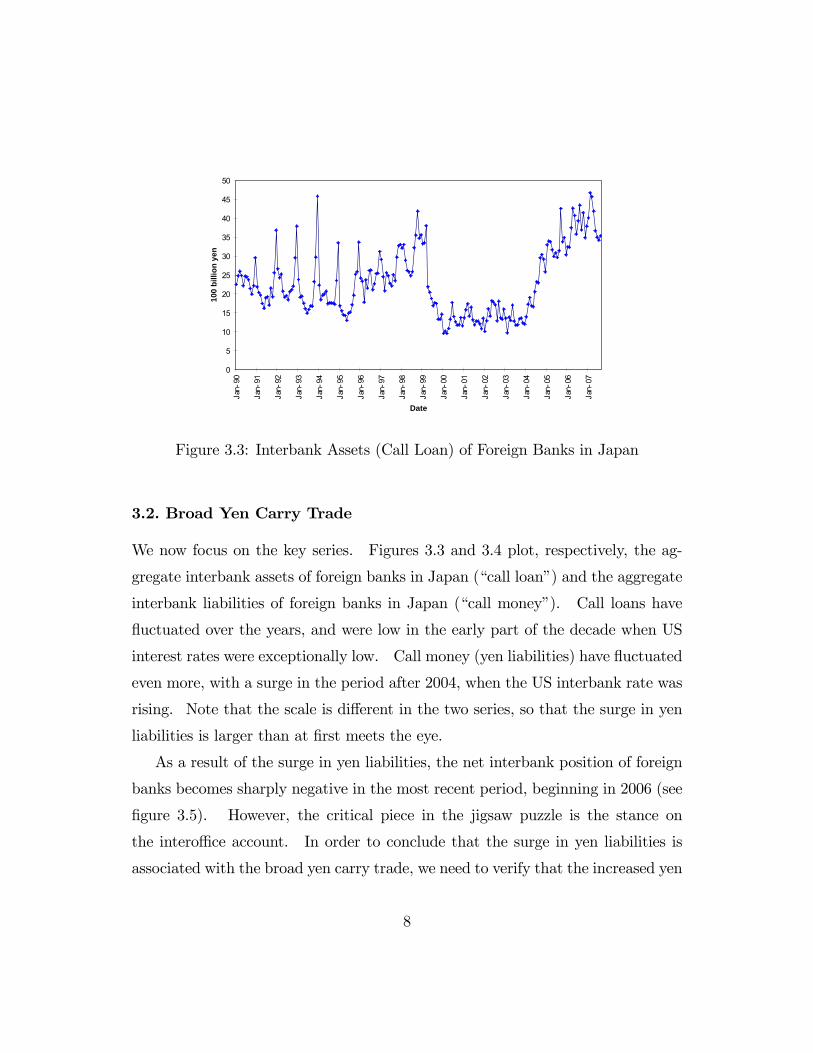
Figure 3.3: Interbank Assets (Call Loan) of Foreign Banks in Japan
3.2. Broad Yen Carry Trade
We now focus on the key series. Figures 3.3 and 3.4 plot, respectively, the ag-
gregate interbank assets of foreign banks in Japan (�call loan�) and the aggregate
interbank liabilities of foreign banks in Japan (�call money�). Call loans have
�uctuated over the years, and were low in the early part of the decade when US
interest rates were exceptionally low. Call money (yen liabilities) have �uctuated
even more, with a surge in the period after 2004, when the US interbank rate was
rising. Note that the scale is di¤erent in the two series, so that the surge in yen
liabilities is larger than at �rst meets the eye.
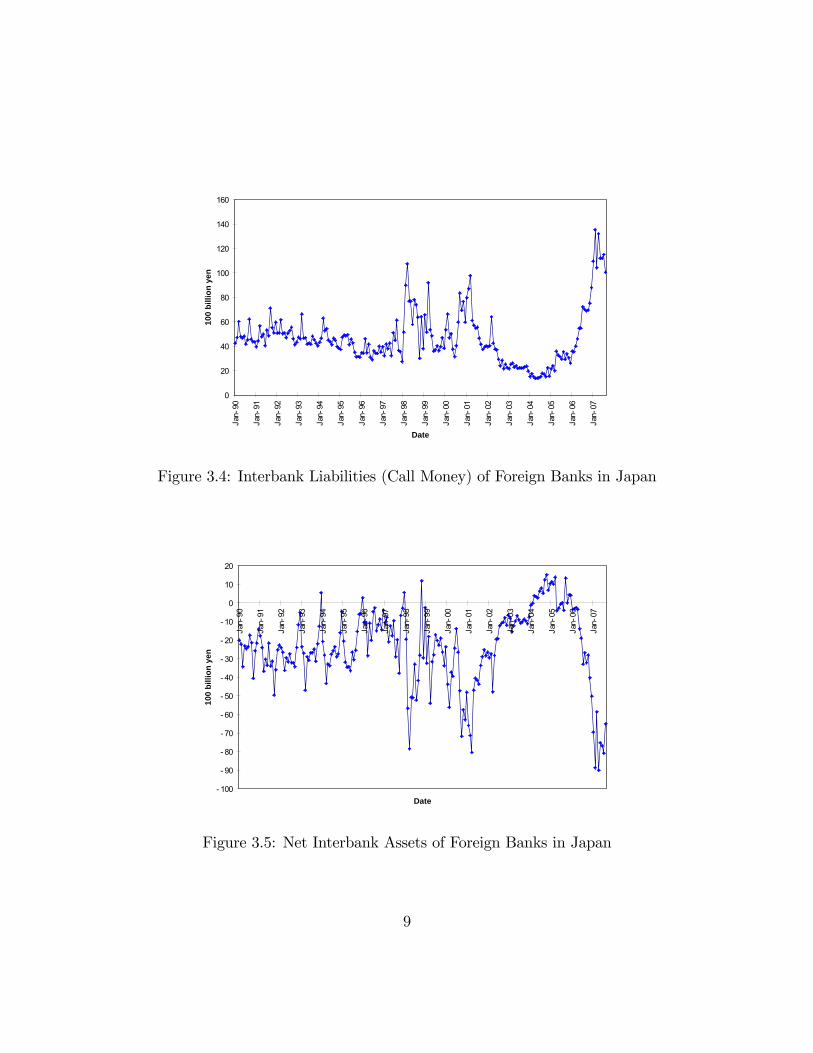
As a result of the surge in yen liabilities, the net interbank position of foreign
banks becomes sharply negative in the most recent period, beginning in 2006 (see
�gure 3.5). However, the critical piece in the jigsaw puzzle is the stance on
the intero¢ ce account. In order to conclude that the surge in yen liabilities is
associated with the broad yen carry trade, we need to verify that the increased yen
8
0
20
40
60
80
100
120
140
160
Jan
90
Jan
91
Jan
92
Jan
93
Jan
94
Jan
95
Jan
96
Jan
97
Jan
98
Jan
99
Jan
00
Jan
01
Jan
02
Jan
03
Jan
04
Jan
05
Jan
06
Jan
07
Date
100
billi
on y
en
Figure 3.4: Interbank Liabilities (Call Money) of Foreign Banks in Japan
100
90
80
70
60
50
40
30
20
10
0
10
20
Jan
90
Jan
91
Jan
92
Jan
93
Jan
94
Jan
95
Jan
96
Jan
97
Jan
98
Jan
99
Jan
00
Jan
01
Jan
02
Jan
03
Jan
04
Jan
05
Jan
06
Jan
07
Date
100
billi
on y
en
Figure 3.5: Net Interbank Assets of Foreign Banks in Japan
9
200
180
160
140
120
100
80
60
40
20
0
20
40
60
80
100
Jan
90
Jan
91
Jan
92
Jan
93
Jan
94
Jan
95
Jan
96
Jan
97
Jan
98
Jan
99
Jan
00
Jan
01
Jan
02
Jan
03
Jan
04
Jan
05
Jan
06
Jan
07
Date
100
billi
on y
en
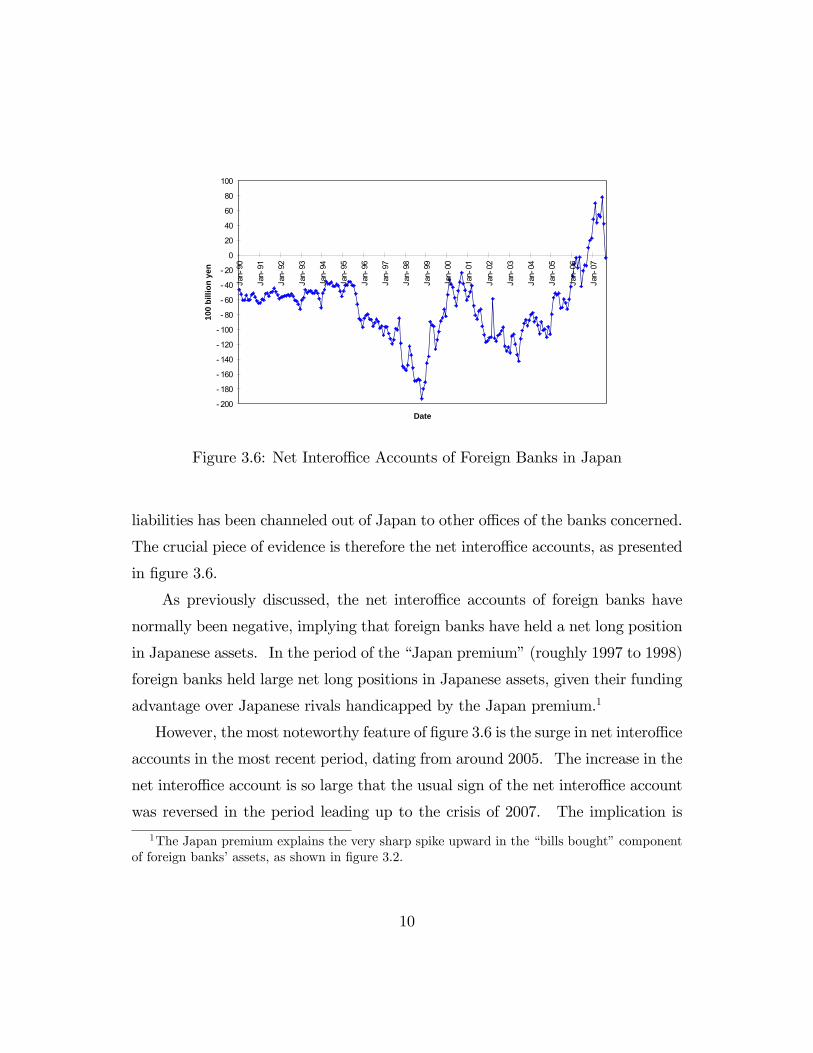
Figure 3.6: Net Intero¢ ce Accounts of Foreign Banks in Japan
liabilities has been channeled out of Japan to other o¢ ces of the banks concerned.
The crucial piece of evidence is therefore the net intero¢ ce accounts, as presented
in �gure 3.6.
As previously discussed, the net intero¢ ce accounts of foreign banks have
normally been negative, implying that foreign banks have held a net long position
in Japanese assets. In the period of the �Japan premium�(roughly 1997 to 1998)
foreign banks held large net long positions in Japanese assets, given their funding
advantage over Japanese rivals handicapped by the Japan premium.1
However, the most noteworthy feature of �gure 3.6 is the surge in net intero¢ ce
accounts in the most recent period, dating from around 2005. The increase in the
net intero¢ ce account is so large that the usual sign of the net intero¢ ce account
was reversed in the period leading up to the crisis of 2007. The implication is
1The Japan premium explains the very sharp spike upward in the �bills bought�componentof foreign banks�assets, as shown in �gure 3.2.
10
60
40
20
0
20
40
60
40 30 20 10 0 10 20 30 40
Monthly change in net call loan
Mon
thly
cha
nge
in n
et in
tero
ffice
acco
unts
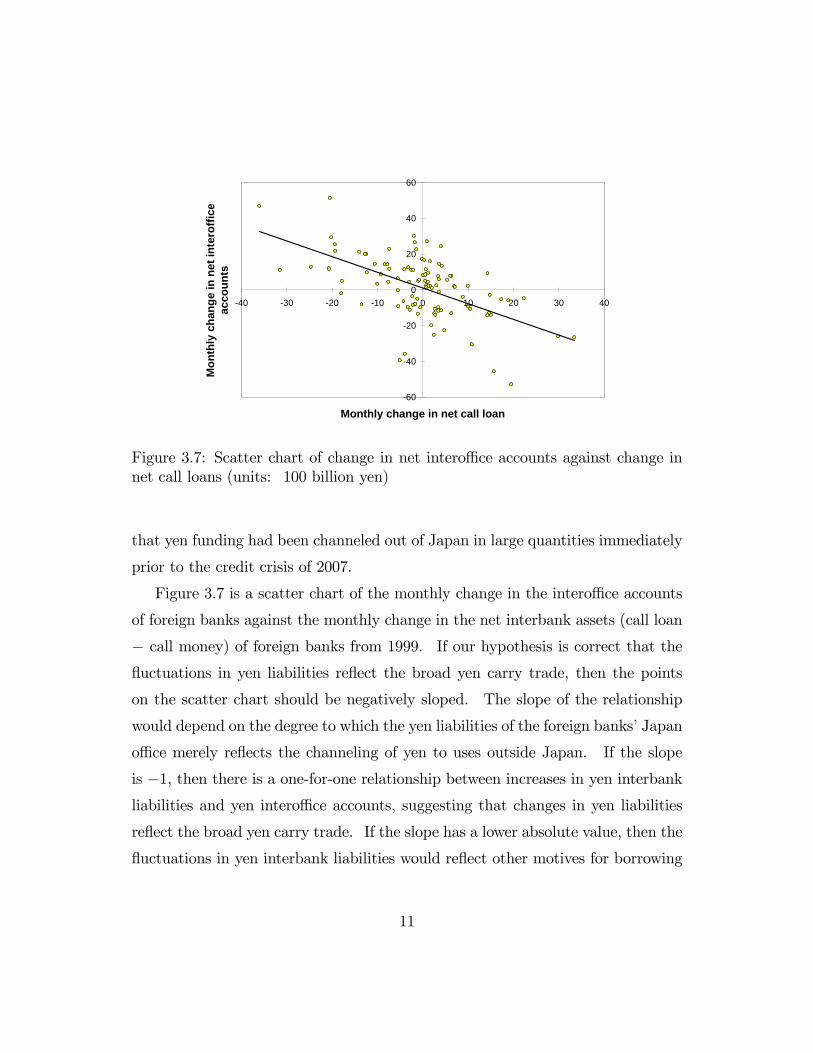
Figure 3.7: Scatter chart of change in net intero¢ ce accounts against change innet call loans (units: 100 billion yen)
that yen funding had been channeled out of Japan in large quantities immediately
prior to the credit crisis of 2007.
Figure 3.7 is a scatter chart of the monthly change in the intero¢ ce accounts
of foreign banks against the monthly change in the net interbank assets (call loan
� call money) of foreign banks from 1999. If our hypothesis is correct that the
�uctuations in yen liabilities re�ect the broad yen carry trade, then the points
on the scatter chart should be negatively sloped. The slope of the relationship
would depend on the degree to which the yen liabilities of the foreign banks�Japan
o¢ ce merely re�ects the channeling of yen to uses outside Japan. If the slope
is �1, then there is a one-for-one relationship between increases in yen interbankliabilities and yen intero¢ ce accounts, suggesting that changes in yen liabilities
re�ect the broad yen carry trade. If the slope has a lower absolute value, then the
�uctuations in yen interbank liabilities would re�ect other motives for borrowing
11
yen (such as funding the purchase of Japanese securities)
In the scatter chart, we see, indeed, that the relationship is strongly negative.
The slope of the OLS regression is �0:89.2 Thus, the slope is reasonably close to
�1, which is consistent with the hypothesis that the Japan o¢ ces of the foreignbanks play the role of channeling yen liquidity out of Japan in the broad yen carry
trade.
The evidence focuses attention on the question of how such yen funding has
been used by the headquarters o¢ ces of the foreign banks. At this point, the trail
becomes murkier, but it would be a reasonable conjecture (to be veri�ed through
other evidence) that the increased yen funding has either been recycled for use by
the customers of the foreign banks in their home markets (e.g. hedge funds), or
have funded the broad yen carry trade on the bank�s own books (e.g. through its
proprietary trading desk).
We have focused on the yen interbank for evidence of the broad carry trade,
but there are other means through which foreign institutions can raise funding
in Japan, such as the issuance of �Samurai bonds�- i.e. yen-denominated bonds
issued by non-residents, especially when the issuer is a foreign bank. A more com-
prehensive study of the carry trade would need to take account of such alternative
funding sources.
4. Carry Trades and Risk Appetite
We now examine the wider implications of the carry trade. Our focus is on the
implications of expansions of balance sheets for the appetite for risk. In a �nancial
system where balance sheets are continuously marked to market, changes in asset
prices show up immediately on the balance sheet, and so have an immediate
impact on the net worth of all constituents of the �nancial system. The reactions
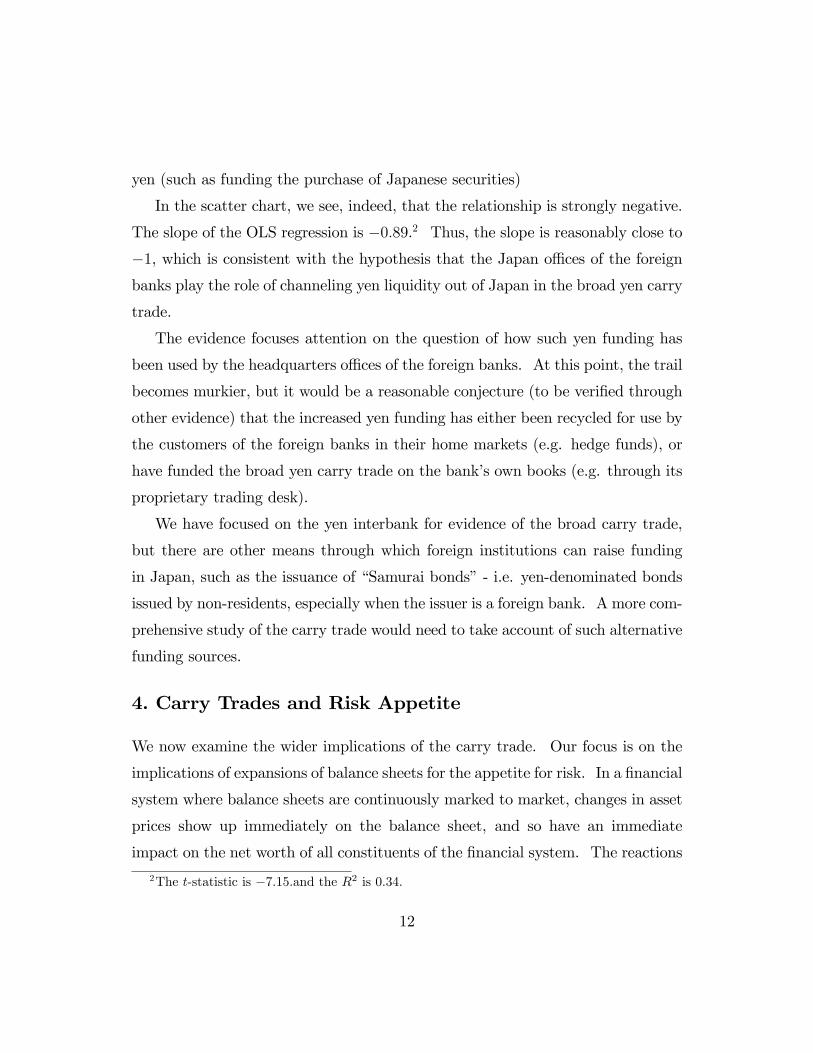
2The t-statistic is �7:15.and the R2 is 0:34.
12
of �nancial intermediaries to such changes in net worth is a critical in�uence on
overall market risk appetite.
If �nancial intermediaries were passive and did not adjust their balance sheets
to changes in net worth, then leverage would fall when total assets rise. Change
in leverage and change in balance sheet size would then be negatively related.
However, as documented by Adrian and Shin (2007a), the evidence points to a
strongly positive relationship between changes in leverage and changes in balance
sheet size. Far from being passive, �nancial intermediaries adjust their balance
sheets actively, and doing so in such a way that leverage is high during booms
and low during busts.
Procyclical leverage can be seen as a consequence of the active management of
balance sheets by �nancial intermediaries who respond to changes in prices and
measured risk. For �nancial intermediaries, their models of risk and economic
capital dictate active management of their overall value at risk (VaR) through
adjustments of their balance sheets. Credit ratings are a key determinant of their
cost of funding, and they will attempt to manage key �nancial ratios so as to hit
their credit rating targets.
From the point of view of each �nancial intermediary, decision rules that result
in procyclical leverage are readily understandable. However, there are aggregate
consequences of such behavior for the �nancial system as a whole that are not
taken into consideration by an individual �nancial intermediary. Such behavior
has aggregate consequences on overall �nancial conditions, risk appetite and the
ampli�cation of �nancial cycles.
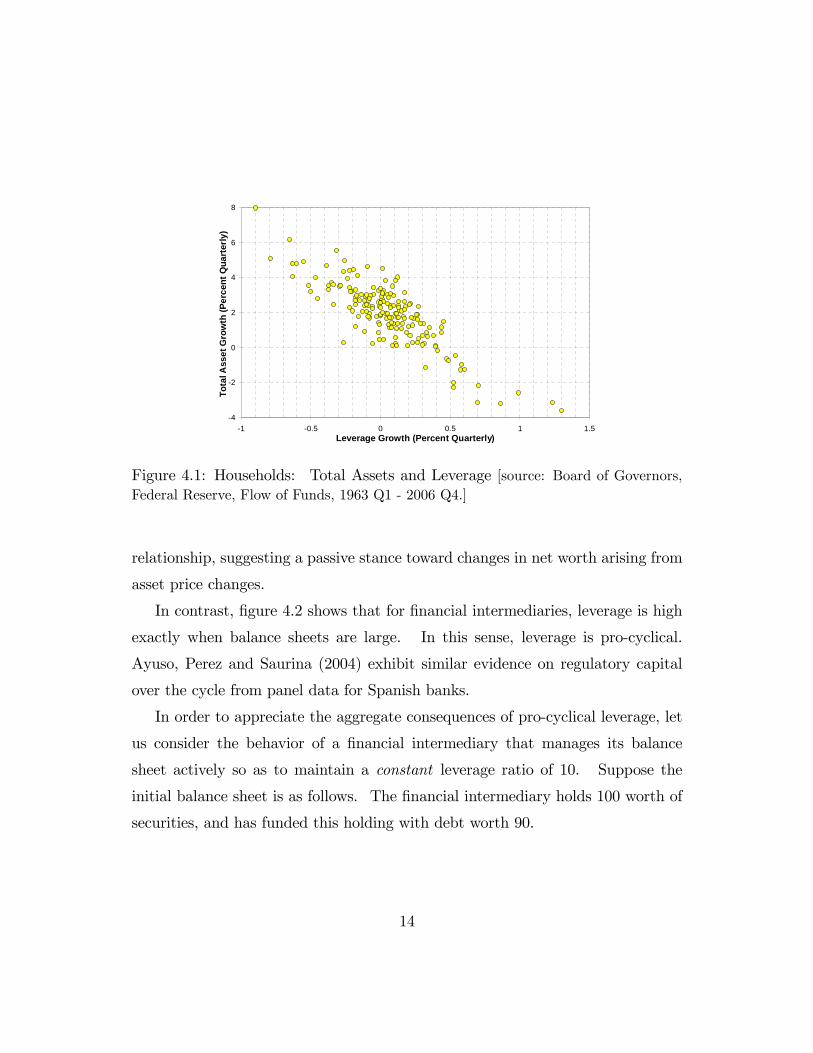
Figures 4.1 and 4.2 are taken from Adrian and Shin (2007a) and plot the
contrasting patterns in the quarterly changes in total assets to quarterly changes
in leverage as given in the Flow of Funds account for the United States. The data
are from 1963 to 2006. For households, scatter chart shows a strongly negative
13
4
2
0
2
4
6
8
1 0.5 0 0.5 1 1.5Leverage Growth (Percent Quarterly)
Tota
l Ass
et G
row
th (P
erce
nt Q
uart
erly
)
Figure 4.1: Households: Total Assets and Leverage [source: Board of Governors,Federal Reserve, Flow of Funds, 1963 Q1 - 2006 Q4.]
relationship, suggesting a passive stance toward changes in net worth arising from
asset price changes.
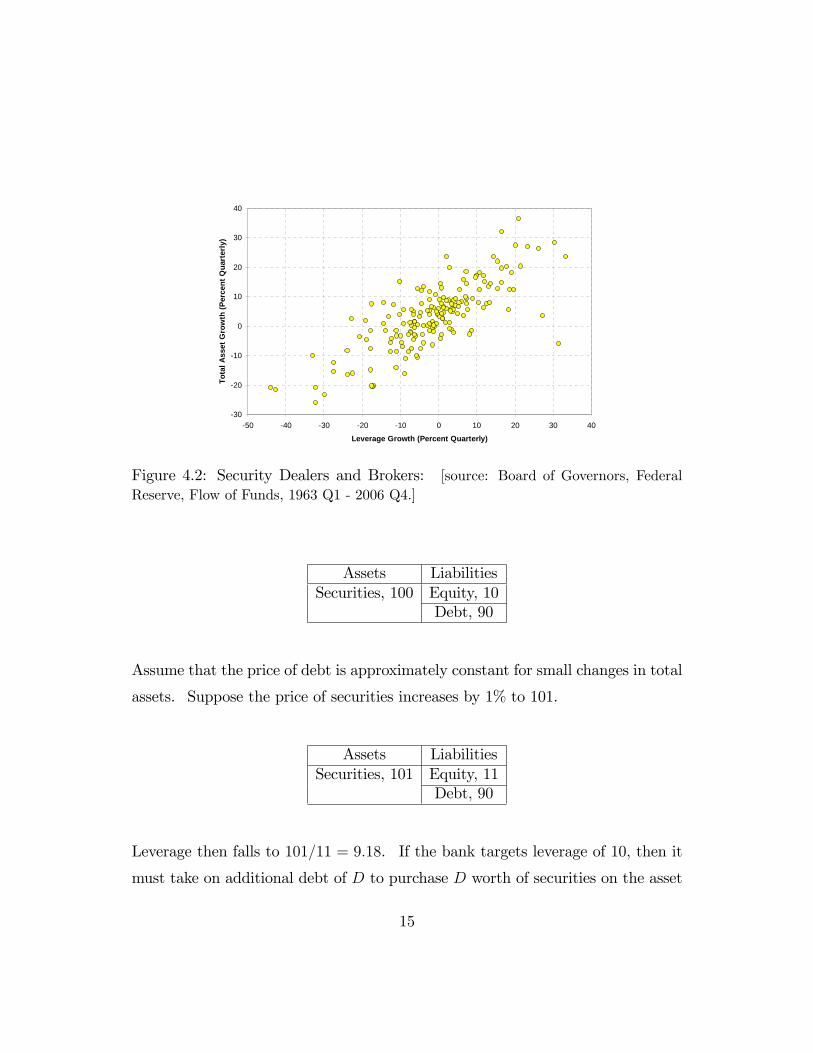
In contrast, �gure 4.2 shows that for �nancial intermediaries, leverage is high
exactly when balance sheets are large. In this sense, leverage is pro-cyclical.
Ayuso, Perez and Saurina (2004) exhibit similar evidence on regulatory capital
over the cycle from panel data for Spanish banks.
In order to appreciate the aggregate consequences of pro-cyclical leverage, let
us consider the behavior of a �nancial intermediary that manages its balance
sheet actively so as to maintain a constant leverage ratio of 10. Suppose the
initial balance sheet is as follows. The �nancial intermediary holds 100 worth of
securities, and has funded this holding with debt worth 90.
14
30
20
10
0
10
20
30
40
50 40 30 20 10 0 10 20 30 40
Leverage Growth (Percent Quarterly)
Tota
l Ass
et G
row
th (P
erce
nt Q
uart
erly
)
Figure 4.2: Security Dealers and Brokers: [source: Board of Governors, FederalReserve, Flow of Funds, 1963 Q1 - 2006 Q4.]
Assets LiabilitiesSecurities, 100 Equity, 10
Debt, 90
Assume that the price of debt is approximately constant for small changes in total
assets. Suppose the price of securities increases by 1% to 101.
Assets LiabilitiesSecurities, 101 Equity, 11
Debt, 90
Leverage then falls to 101=11 = 9:18. If the bank targets leverage of 10, then it
must take on additional debt of D to purchase D worth of securities on the asset
15
side so thatassetsequity
=101 +D
11= 10
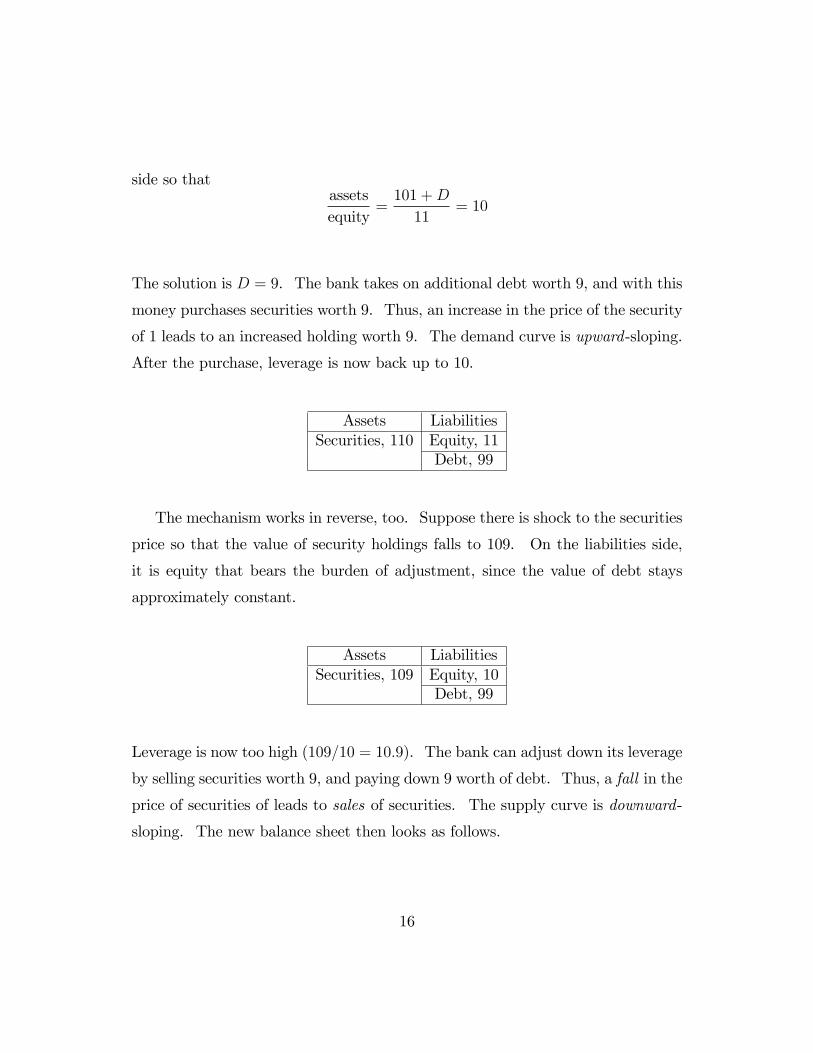
The solution is D = 9. The bank takes on additional debt worth 9, and with this
money purchases securities worth 9. Thus, an increase in the price of the security
of 1 leads to an increased holding worth 9. The demand curve is upward-sloping.
After the purchase, leverage is now back up to 10.
Assets LiabilitiesSecurities, 110 Equity, 11
Debt, 99
The mechanism works in reverse, too. Suppose there is shock to the securities
price so that the value of security holdings falls to 109. On the liabilities side,
it is equity that bears the burden of adjustment, since the value of debt stays
approximately constant.
Assets LiabilitiesSecurities, 109 Equity, 10
Debt, 99
Leverage is now too high (109=10 = 10:9). The bank can adjust down its leverage
by selling securities worth 9, and paying down 9 worth of debt. Thus, a fall in the
price of securities of leads to sales of securities. The supply curve is downward-
sloping. The new balance sheet then looks as follows.
16
Strongerbalance sheets Increase
B/S size
Target leverage
Asset price boom
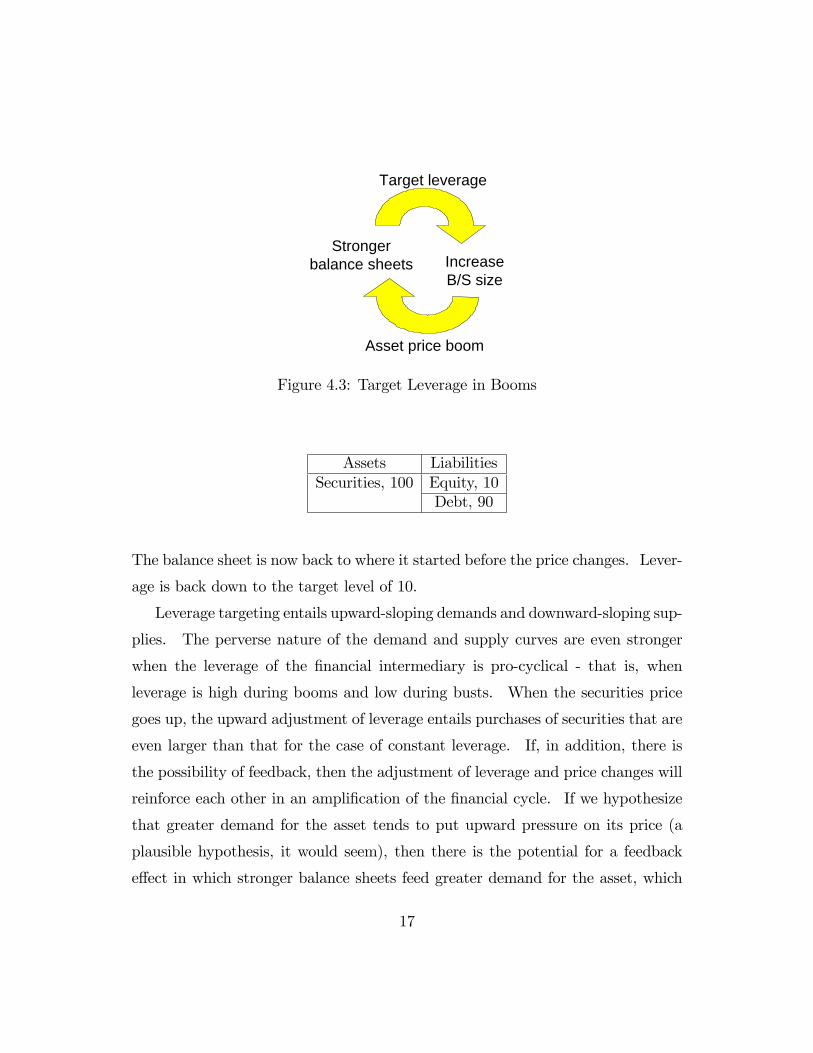
Figure 4.3: Target Leverage in Booms
Assets LiabilitiesSecurities, 100 Equity, 10
Debt, 90
The balance sheet is now back to where it started before the price changes. Lever-
age is back down to the target level of 10.
Leverage targeting entails upward-sloping demands and downward-sloping sup-
plies. The perverse nature of the demand and supply curves are even stronger
when the leverage of the �nancial intermediary is pro-cyclical - that is, when
leverage is high during booms and low during busts. When the securities price
goes up, the upward adjustment of leverage entails purchases of securities that are
even larger than that for the case of constant leverage. If, in addition, there is
the possibility of feedback, then the adjustment of leverage and price changes will
reinforce each other in an ampli�cation of the �nancial cycle. If we hypothesize
that greater demand for the asset tends to put upward pressure on its price (a
plausible hypothesis, it would seem), then there is the potential for a feedback
e¤ect in which stronger balance sheets feed greater demand for the asset, which
17
Weakerbalance sheets Reduce
B/S size
Target leverage
Asset price decline
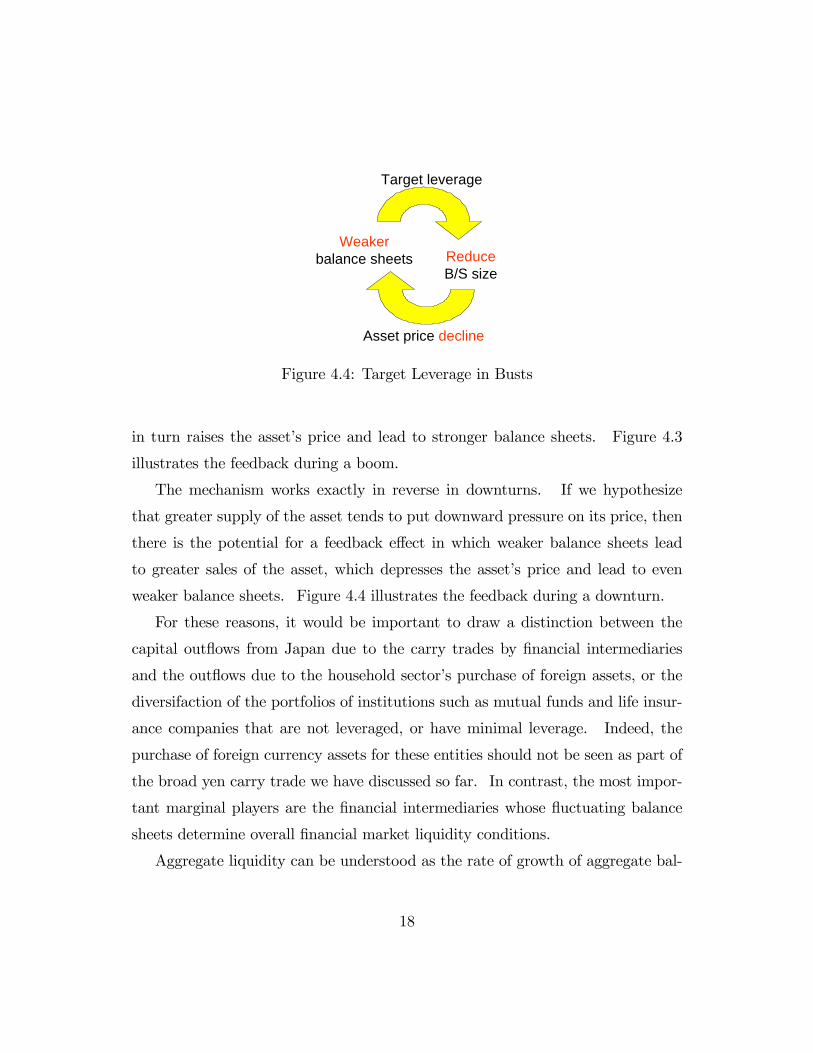
Figure 4.4: Target Leverage in Busts
in turn raises the asset�s price and lead to stronger balance sheets. Figure 4.3
illustrates the feedback during a boom.
The mechanism works exactly in reverse in downturns. If we hypothesize
that greater supply of the asset tends to put downward pressure on its price, then
there is the potential for a feedback e¤ect in which weaker balance sheets lead
to greater sales of the asset, which depresses the asset�s price and lead to even
weaker balance sheets. Figure 4.4 illustrates the feedback during a downturn.
For these reasons, it would be important to draw a distinction between the
capital out�ows from Japan due to the carry trades by �nancial intermediaries
and the out�ows due to the household sector�s purchase of foreign assets, or the
diversifaction of the portfolios of institutions such as mutual funds and life insur-
ance companies that are not leveraged, or have minimal leverage. Indeed, the
purchase of foreign currency assets for these entities should not be seen as part of
the broad yen carry trade we have discussed so far. In contrast, the most impor-
tant marginal players are the �nancial intermediaries whose �uctuating balance
sheets determine overall �nancial market liquidity conditions.
Aggregate liquidity can be understood as the rate of growth of aggregate bal-
18

ance sheets. When �nancial intermediaries�balance sheets are generally strong,
their leverage is too low. The �nancial intermediaries hold surplus capital, and
they will attempt to �nd ways in which they can employ their surplus capital.
In a loose analogy with manufacturing �rms, we may see the �nancial system as
having �surplus capacity�. For such surplus capacity to be utilized, the interme-
diaries must expand their balance sheets. On the liabilities side, they take on
more short-term debt. On the asset side, they search for potential borrowers that
they can lend to. It is in this context that the broad yen carry trade comes into
sharper focus. By allowing intermediaries to expand their balance sheets at lower
cost, the broad carry trade fuels the �nancial boom. Aggregate liquidity is inti-
mately tied to how hard the �nancial intermediaries search for borrowers. In the
sub-prime mortgage market in the United States we have seen that when balance
sheets are expanding fast enough, even borrowers that do not have the means to
repay are granted credit - so intense is the urge to employ surplus capital. The
seeds of the subsequent downturn in the credit cycle are thus sown. Jimenez and
Saurina (2006) show from their study of Spanish banks that the loans granted
during booms have higher default rates than those granted during leaner times.
Adrian and Shin (2007a) have shown that balance sheet changes are closely
related to the overall market risk appetite, as measured by the VIX index of
implied volatility of stocks. In the context of the broad yen carry trade, it would
be reasonable to conjecture that something similar holds, too.
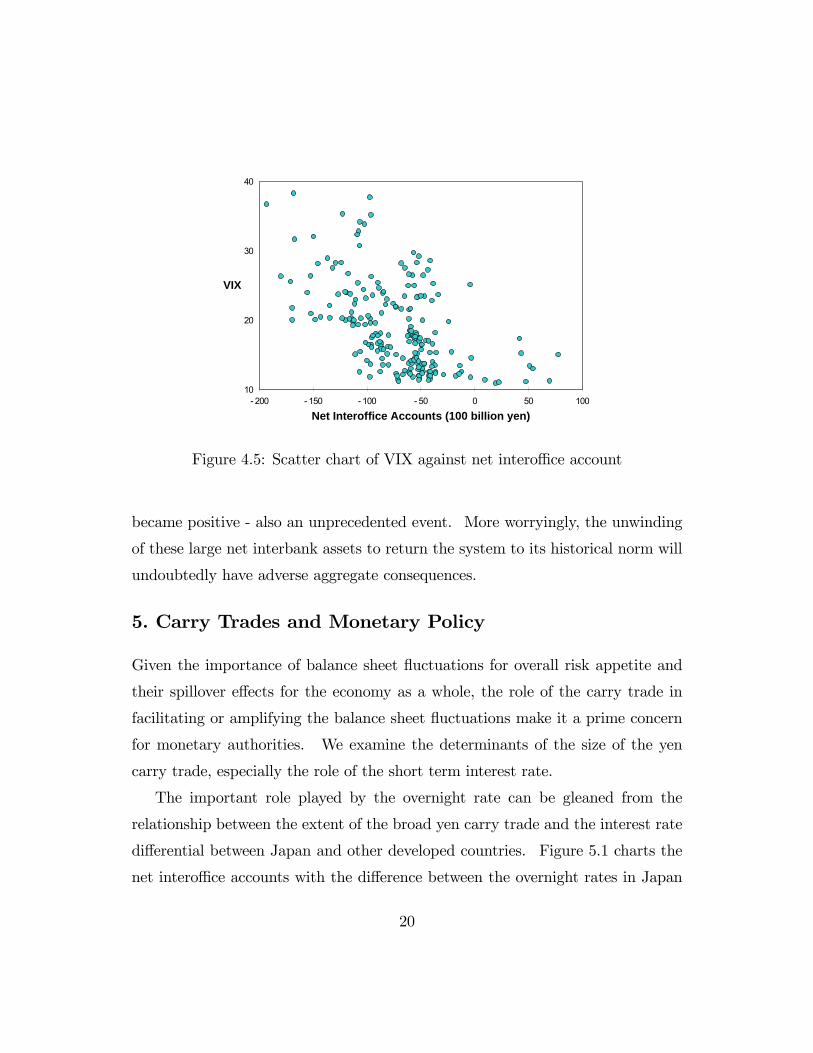
Figure 4.5 is a scatter chart of the VIX index against the net intero¢ ce account
of foreign banks in Japan. There is a striking negative relation, where large net
intero¢ ce accounts are associated with lower implied volatility - i.e. large balance
sheets with greater risk appetite. We know from the period immediately preceding
the 2007 credit crisis that implied volatility had plumbed historical lows. As we
have seen earlier, this was precisely the period when the net intero¢ ce accounts
19
10
20
30
40
200 150 100 50 0 50 100
Net Interoffice Accounts (100 billion yen)
VIX
Figure 4.5: Scatter chart of VIX against net intero¢ ce account
became positive - also an unprecedented event. More worryingly, the unwinding
of these large net interbank assets to return the system to its historical norm will
undoubtedly have adverse aggregate consequences.
5. Carry Trades and Monetary Policy
Given the importance of balance sheet �uctuations for overall risk appetite and
their spillover e¤ects for the economy as a whole, the role of the carry trade in
facilitating or amplifying the balance sheet �uctuations make it a prime concern
for monetary authorities. We examine the determinants of the size of the yen
carry trade, especially the role of the short term interest rate.
The important role played by the overnight rate can be gleaned from the
relationship between the extent of the broad yen carry trade and the interest rate
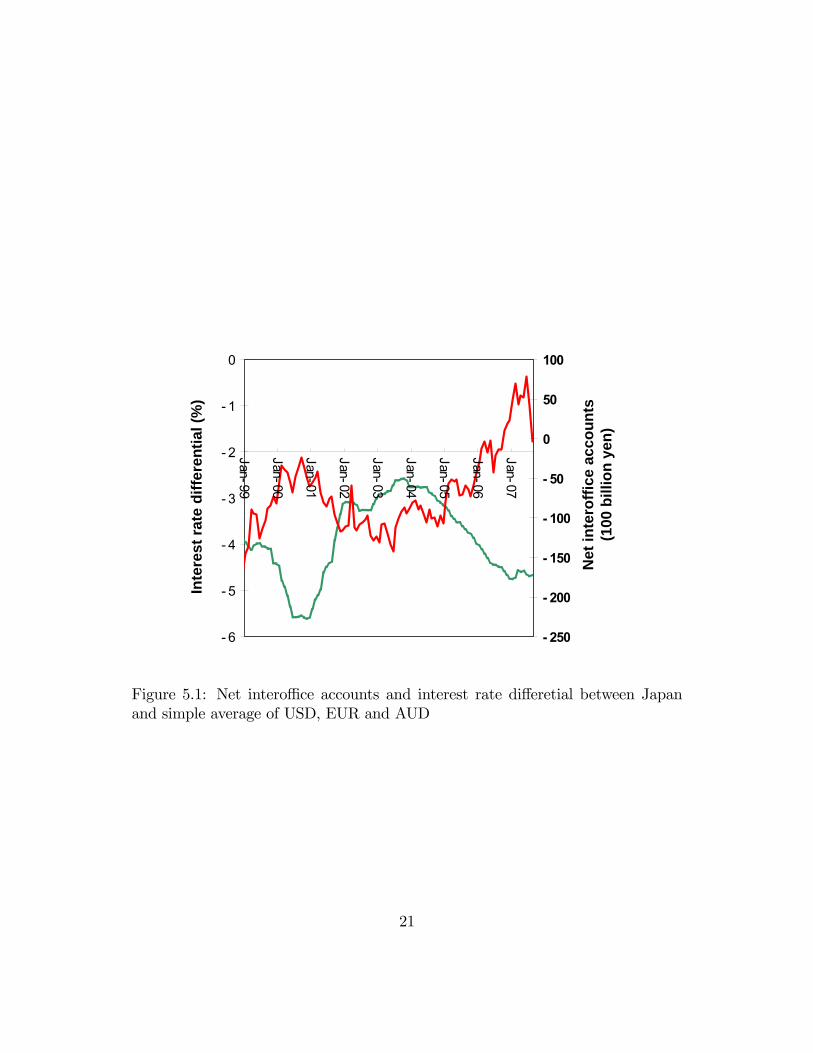
di¤erential between Japan and other developed countries. Figure 5.1 charts the
net intero¢ ce accounts with the di¤erence between the overnight rates in Japan
20
6
5
4
3
2
1
0
Jan99
Jan00
Jan01
Jan02
Jan03
Jan04
Jan05
Jan06
Jan07
Inte
rest
rate
diff
eren
tial (
%)
250
200
150
100
50
0
50
100
Net
inte
roffi
ce a
ccou
nts
(100
bill
ion
yen)
Figure 5.1: Net intero¢ ce accounts and interest rate di¤eretial between Japanand simple average of USD, EUR and AUD
21
99/1
07/8
200
150
100
50
0
50
100
6 5 4 3 2
Interest Rate Differential (%)
Net
Inte
roffi
ce A
ccou
nts
(100
bill
ion
yen)
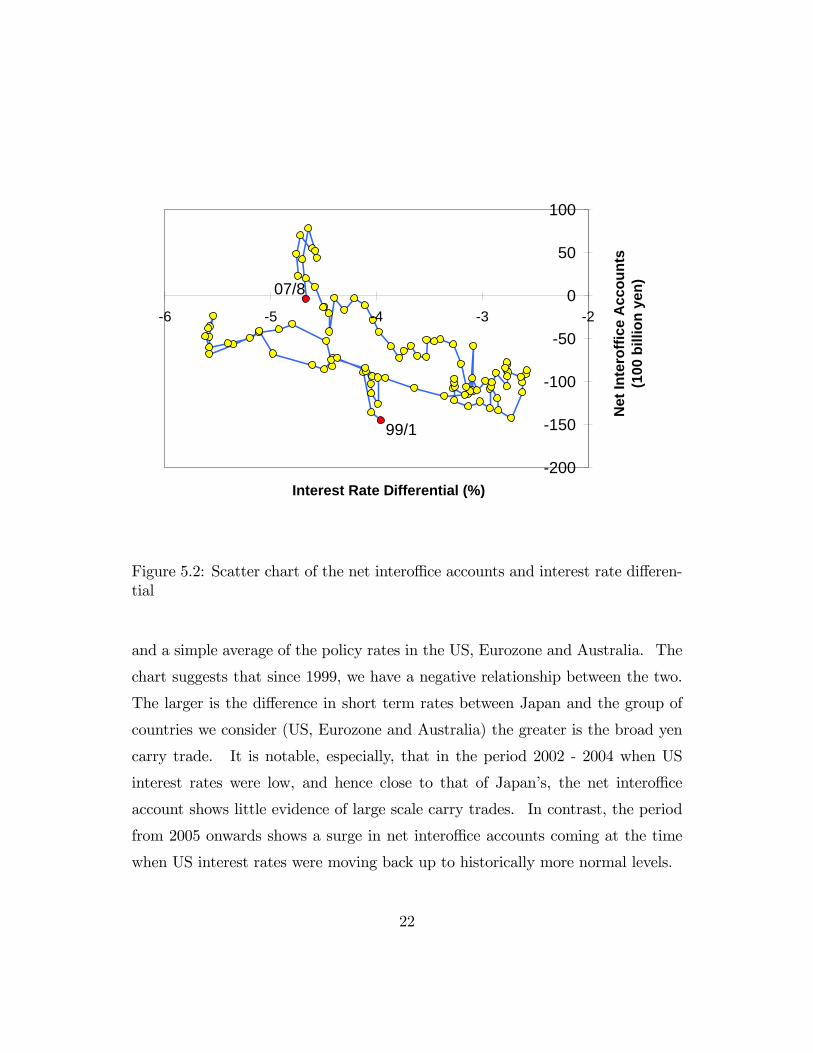
Figure 5.2: Scatter chart of the net intero¢ ce accounts and interest rate di¤eren-tial
and a simple average of the policy rates in the US, Eurozone and Australia. The
chart suggests that since 1999, we have a negative relationship between the two.
The larger is the di¤erence in short term rates between Japan and the group of
countries we consider (US, Eurozone and Australia) the greater is the broad yen
carry trade. It is notable, especially, that in the period 2002 - 2004 when US
interest rates were low, and hence close to that of Japan�s, the net intero¢ ce
account shows little evidence of large scale carry trades. In contrast, the period
from 2005 onwards shows a surge in net intero¢ ce accounts coming at the time
when US interest rates were moving back up to historically more normal levels.
22
The same information can be represented as a timed scatter chart as in �gure
5.2. There is a strongly negative relationship in the two series. The �rst and
last data points (January 1999 and August 2007) are indicated with the red dots.
An OLS regression has a t-statistic of �7:8.The importance of the interest rate di¤erential also �gures in theoretical mod-
els of the carry trade (see Plantin and Shin (2006)). The carry element combined
with a procylical leverage ratio (illustrated in the previous section) serve to in-
crease the spillover e¤ects of one currency speculator�s actions on others, making
speculative trading strategic complements. The carry element turns out to be cru-
cial in this regard. Without the carry element, speculators�actions are strategic
substitutes.
Our empirical �ndings suggest that the overnight rate set by central banks
may have an important role in in�uencing the scale of the carry trade, but more
broadly in determining balance sheet size in the �nancial sector as a whole. Our
results are in line with the results of Adrian and Shin (2007b), who show that
the residuals from a Taylor rule regression is closely (negatively) related to the
growth of �nancial sector balance sheets in the United States. These results
suggest that overnight rates may have some importance in their own right when
conducting monetary policy, not merely as an instrument to signal the central
bank�s intentions of future actions.
Indeed, the trend in recent years, especially with the advent of formal in�ation-
targeting at many central banks around the world, has been to emphasize the role
of the overnight rate only as a means of communicating with the market on future
central bank actions, and thereby managing market expectations. Alan Blinder
(1998, p.70) in his Lionel Robbins lectures states that:
�central banks generally control only the overnight interest rate, an
interest rate that is relevant to virtually no economically interesting
23
transactions. Monetary policy has important macroeconomic e¤ects
only to the extent that it moves �nancial market prices that really mat-
ter - like long-term interest rates, stock market values and exchange
rates.�
Blinder�s comments are echoed by other leading monetary economists - Svens-
son, Woodford, Bernanke and others - who have similarly emphasized the in-
signi�cance of the overnight rate, other than as a means of communicating with
the markets on the future course of monetary policy (see, for instance, Bernanke
(2004a, 2004b)).
However, to the extent that �nancial stability concerns should impinge on
monetary policy, the insigni�cance of the overnight rate may have been somewhat
overdone. On the contrary, short term rates could be conjectured to play an
important role in their own right, since it is the short term rate that determines
the cost of rolling over liabilities.
In addition, although monetary policy is conducted primarily with domestic
macroeconomic conditions in mind, there are undoubted international spillover
e¤ects. The experience of the 2007 credit crisis is a lesson in the importance of
�nancial stability in the conduct of monetary policy.
6. Concluding Remarks
In this paper, we have examined the broader implications of the yen carry trade for
risk appetite and �nancial cycles. Although the yen carry trade has traditionally
been viewed in narrow terms purely as a foreign exchange transaction, we have
argued that they hold broader implications for the workings of the �nancial system
and for monetary policy. The evidence from the waxing and waning of balance
sheets of foreign banks operating in Japan points to a broader notion of the carry
24
trade. Yen liabilities fund not only pure currency carry trades, but also fund
the general increase in balance sheets of hedge funds and �nancial intermediaries.
Finally, we have shown that the di¤erence in overnight rates across countries is a
crucial determinant of balance sheet changes. Therefore, the short term interest
rate may be more important as a gauge of the stance of monetary policy than is
given credit for by many leading monetary economists. Domestic monetary policy
has a global dimension through the workings of the global �nancial system.
References
Adrian, Tobias. and Hyun Song Shin (2007a) �Liquidity and Financial Cycles�
paper presented at the 6th BIS annual conference, June 2007.
http://www.princeton.edu/~hsshin/working.htm
Adrian, Tobias. and Hyun Song Shin (2007b) �Liquidity, Monetary Policy and
Financial Cycles�working paper, Princeton University.
Ayuso, J., D. Perez and J. Saurina �Are Capital Bu¤ers Procyclical? Evidence
from Spanish Panel Data�Journal of Financial Intermediation, 13, 249-264.
Bernanke, B. (2004a) �Central Bank Talk and Monetary Policy�Remarks at the
Japan Society Corporate Luncheon, New York, October 7, 2004
www.federalreserve.gov/boarddocs/speeches/2004/200410072/default.htm
Bernanke, B. (2004b) �The Logic of Monetary Policy�Remarks before the Na-
tional Economists Club, December 2, 2004
www.federalreserve.gov/boarddocs/speeches/2004/20041202/default.htm
Bernanke, B. and A. Blinder (1988) �Credit, Money and Aggregate Demand�
American Economic Review, 78, 435-39.
25
Bernanke, B. and M. Gertler (1989) �Agency Costs, Net Worth, and Business
Fluctuations�American Economic Review, 79, 14 - 31.
Blinder, Alan Central Banking in Theory and Practice, MIT Press, Cambridge,
1998.
Brunnermeier, Markus and Lasse Heje Pedersen (2005) �Market Liquidity and
Funding Liquidity�, working paper, Princeton University and NYU Stern School.
Jimenez, G. and J. Saurina (2006) �Credit Cycles, Credit Risk, and Prudential
Regulation�International Journal of Central Banking, June 2006,
http://www.ijcb.org/journal/ijcb06q2a3.htm
Kashyap, Anil and Jeremy Stein, 2003, �Cyclical Implications of the Basel II Cap-
ital Standard�, University of Chicago, Graduate School of Business and Harvard
University, http://faculty.chicagogsb.edu/anil.kashyap/research/basel-�nal.pdf
Plantin, Guillaume and Hyun Song Shin (2006) �Carry Trades and Speculative
Dynamics�working paper, London Business School and Princeton University.
26