Institute for Mineral and Energy Resources€¦ · Institute for Mineral and Energy Resources South...
15
REV Date Objective Author Recipient Status 01 14 th December 2014 Program 1 summary report Martin Hand Melissa Pang ARENA Project Manager Institute for Mineral and Energy Resources South Australian Centre for Geothermal Energy Research Program 1 Summary Report ARENA Measure: Reservoir quality in sedimentary geothermal resources
Transcript of Institute for Mineral and Energy Resources€¦ · Institute for Mineral and Energy Resources South...

REV Date Objective Author Recipient Status
01 14th December
2014
Program 1
summary report
Martin Hand
Melissa Pang
ARENA
Project
Manager
Institute for Mineral
and Energy Resources
South Australian Centre for
Geothermal Energy Research
Program 1 Summary Report
ARENA Measure: Reservoir quality in sedimentary
geothermal resources

ARENA Measure Program 1 summary report 1
South Australian Centre
for Geothermal Energy
Research
Introduction
The Government-Industry-Academia research collaboration entitled Reservoir Quality in Sedimentary Geothermal Resources is comprised of three programs relating to the “failure analysis” of Hot Sedimentary Aquifer (HSA) geothermal exploration wells Salamander 1, drilled in the Otway Basin, and Celsius 1, drilled in the Cooper-Eromanga Basin. The project aims were to conduct a scientific research-driven analysis of the two geothermal wells – the only ones drilled in HSA reservoirs in Australia, and to evaluate why the achieved fluid flow rates were significantly lower than expected. Two failure analysis Programs were undertaken. The first Program involved evaluating the primary reservoir quality of the two target formations – the Pretty Hill Formation in the Otway Basin, and the Hutton Sandstone in the Cooper-Eromanga Basin. The second Program involved evaluating formation damage that may have been caused during the drilling of the two wells and subsequent production tests. Researchers from the University of Adelaide, CSIRO and the South Australian Museum collaborated to conduct petrology, SEM, TEM, QEMSCAN, cathodoluminescence and seismic attribute analysis. Laboratory experiments simulating secondary mineral growth and fines production under different conditions were conducted. Analysis of results to allow reservoir behaviour to be modelled also occurred. The conclusions reached from Program 1 were that diagenetic factors have made the deep, hot water reservoirs less permeable than hoped, but that the effects are not uniform basin-wide, and that it may be possible to identify more permeable zones using seismic and petrology. Program 2 concluded that formation damage is more likely in hot water settings than hydrocarbon reservoirs under production, but there are ways that this can be mitigated. A summary of Program 1 is described in this document.

ARENA Measure Program 1 summary report 2
South Australian Centre
for Geothermal Energy
Research
Program 1 – Summary Report
Introduction
Achieving economic fluid flow rates from deep geothermal reservoirs is one of the most significant technical challenges confronting the Australian geothermal industry. Geothermal resources hosted within sedimentary basins, also known as Hot Sedimentary Aquifers (HSA) were targeted by developers because unlike fractured granite systems, they were thought to have high natural permeability, so these systems may not require significant reservoir enhancement to achieve economic fluid flows. However, the natural permeability of sedimentary reservoirs can be reduced by diagenesis, where the nature of sediments changes as they are buried. Diagenesis is controlled by parameters including temperature, pressure, mineralogy, and fluid-rock interactions. Drilling activities can also cause damage to the sedimentary rocks in the vicinity of the drill hole, masking the true permeability of the reservoir. Finally, the act of producing hot water from sedimentary reservoirs can also cause formation damage as fine particles migrate under production towards the well. Two geothermal wells have been drilled into HSA plays in Australia: Panax Geothermal Ltd tested their Penola prospect with the 4025 m Salamander-1 well, targeting the Pretty Hill Formation in the Otway Basin (Figure 1), and the Origin Energy Ltd -Geodynamics Ltd JV tested their “Innamincka Shallows” prospect with the 2416 m deep Celsius-1 well, targeting the Hutton Sandstone in the Cooper-Eromanga Basin (Figure 3A). This project entitled Reservoir Quality in Sedimentary Geothermal Resources is a collaborative research effort between research institutions the University of Adelaide, CSIRO, the South Australian Museum, geothermal development companies Geodynamics Ltd and Raya Group Ltd, and is co-funded to the tune of $1.25 million by the Australian Government’s Australian Renewable Energy Agency (ARENA).
The Otway Basin
The Otway Basin is a northwest–southeast striking, divergent margin rift and drift basin. It covers an area of 150,000 km2, 80% of which lies offshore (Geoscience Australia, 2011). It was formed in the Jurassic to late Cretaceous (DMITRE, 2013) as a result of rifting between Antarctica and Australia.
Figure 1 - Location of the Otway Basin and Salamander 1 (source: Geoscience Australia)
Salamander 1

ARENA Measure Program 1 summary report 3
South Australian Centre
for Geothermal Energy
Research
Key Stratigraphic units The oldest unit in the Otway Basin is the Casterton Formation, a succession of interbedded shale, feldspathic sandstone and siltstone characterised by interbedded olivine basalt and volcaniclastics (Morton, 1995). Overlying the Casterton Formation is the Crayfish subgroup which in turn is divided into the Pretty Hill Formation, Laira Formation and Katnook Sandstone (Figure 2). The Pretty Hill Formation, the target formation for Salamander 1 is divided into the Upper and Lower Pretty Hill Formations. The upper formation generally consists of interbedded feldspathic litharenite and carbonaceous siltstone and mudstone. The lower formation is predominantly clean sandstone (Morton, 1995). The inferred environment of deposition is a silty flood plain with crevasse-splay and sheet-flood sandstone interbeds. Localised lakes and swamps occurred on the floodplain. The uppermost limit of the Crayfish group is the Laira Formation, consisting of shale and silty sandstone, which in turn is overlain by the braided, fluvial Katnook Sandstone (DMITRE, 2013). The thick shale, siltstone, coal and sandstone of the Eumeralla Formation was deposited in fluvial to lacustrine environments. It acts as a thermal and hydraulic seal to the underlying geothermal systems present in the Crayfish Group. In the Penola Trough the Pretty Hill Formation is up to 2,000m thick. Temperature ranges from 850C to 1750C. Porosity ranges from 1 to 23 %, with an average measured porosity of 10 %.
Figure 2 - Stratigraphy of the Otway Basin

ARENA Measure Program 1 summary report 4
South Australian Centre
for Geothermal Energy
Research
The Cooper-Eromanga Basin
The Cooper-Eromanga Basin has had 40 years of petroleum, mining and geothermal exploration and development, including drilling 1200 wells, leading to the discovery of 121 gas and 25 oil fields. The wells drilled to date in the Eromanga basin have been on structural plays and approximately 70 % of the oil discovered is in the Hutton Sandstone and sealed by the Birkhead Formation. The Cooper Basin consists of a broad downwarp with two main depocentres – the Poolowanna Trough in the north-west which contains a thick sand-dominated sequence, and the Cooper region where intercalated shale and siltstone units occur. Three major troughs in the Cooper region (Patchawarra, Nappamerri and Tenappera) are separated by structurally high ridges commonly associated with oil and gas fields (Figure 3A). These troughs contain up to 2500 m of Permo-Carboniferous to Triassic sedimentary fill overlain by as much as 1300 m of Jurassic to Tertiary cover. The Nappamerri Trough contains the deepest and thickest Cooper Basin sediments. The giant Moomba gas field lies at the southern end of the Nappamerri Trough (Roberts et al. 1990).
Figure 3: Overview of the Cooper region. A. Location of Celsius-1 and offset wells used in this study. B. Geological summary of the Eromanga Basin and older basins (modified from Watts (1987)). A, C, H, J, and Z represent seismic horizons (from Dillinger et al 2014).
The region is part of a broad area of anomalously high heat flow – the Central Australian Heat Flow Province - which is attributed to basement enriched in radiogenic elements. High heat-producing granites form a significant geothermal play that was targeted for Australia’s first Enhanced Geothermal System (EGS)
ARENA Measure Program 1 summary report 5
South Australian Centre
for Geothermal Energy
Research
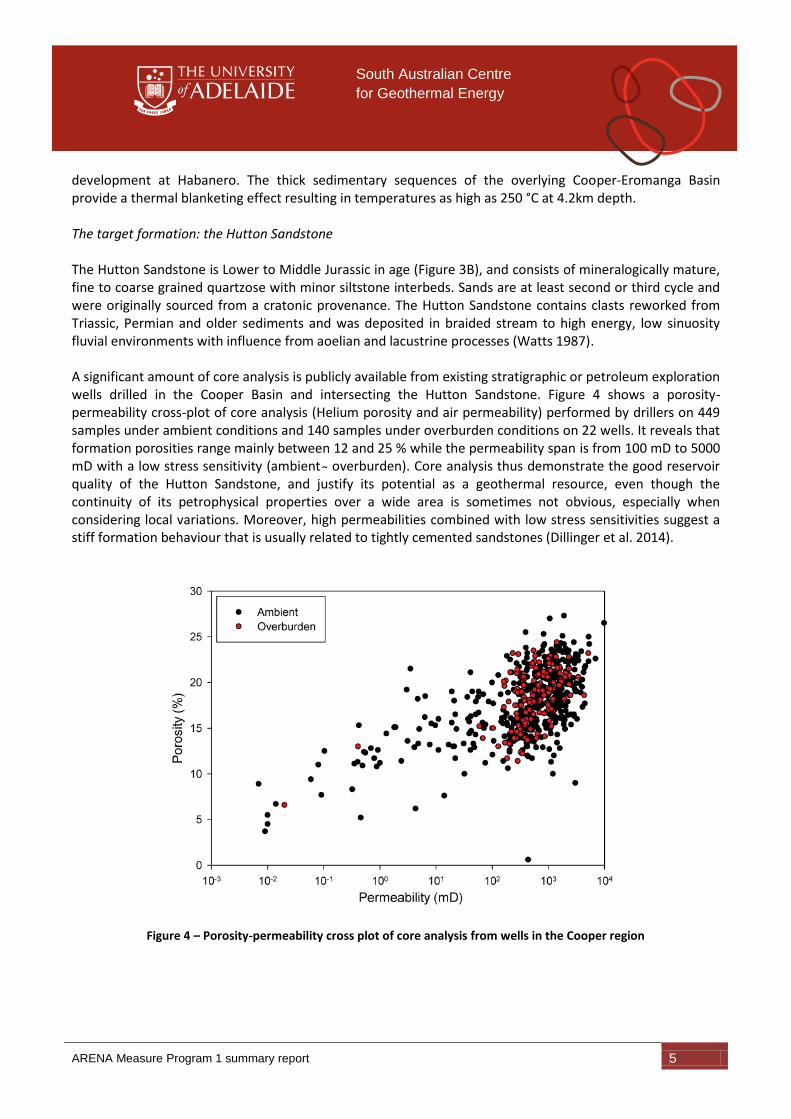
development at Habanero. The thick sedimentary sequences of the overlying Cooper-Eromanga Basin provide a thermal blanketing effect resulting in temperatures as high as 250 °C at 4.2km depth. The target formation: the Hutton Sandstone The Hutton Sandstone is Lower to Middle Jurassic in age (Figure 3B), and consists of mineralogically mature, fine to coarse grained quartzose with minor siltstone interbeds. Sands are at least second or third cycle and were originally sourced from a cratonic provenance. The Hutton Sandstone contains clasts reworked from Triassic, Permian and older sediments and was deposited in braided stream to high energy, low sinuosity fluvial environments with influence from aoelian and lacustrine processes (Watts 1987). A significant amount of core analysis is publicly available from existing stratigraphic or petroleum exploration wells drilled in the Cooper Basin and intersecting the Hutton Sandstone. Figure 4 shows a porosity-permeability cross-plot of core analysis (Helium porosity and air permeability) performed by drillers on 449 samples under ambient conditions and 140 samples under overburden conditions on 22 wells. It reveals that formation porosities range mainly between 12 and 25 % while the permeability span is from m to m with a low stress sensitivity (ambient overburden). ore analysis thus demonstrate the good reservoir quality of the Hutton Sandstone, and justify its potential as a geothermal resource, even though the continuity of its petrophysical properties over a wide area is sometimes not obvious, especially when considering local variations. Moreover, high permeabilities combined with low stress sensitivities suggest a stiff formation behaviour that is usually related to tightly cemented sandstones (Dillinger et al. 2014).
Figure 4 – Porosity-permeability cross plot of core analysis from wells in the Cooper region

ARENA Measure Program 1 summary report 6
South Australian Centre
for Geothermal Energy
Research
Program 1 – HSA reservoir quality in the Otway and Cooper-Eromanga Basins
Neither Salamander-1 nor Celsius-1 produced the anticipated flow rates, raising the question of the primary quality of the reservoir and the impact of the diagenesis on the permeability of the sedimentary formations. The activities undertaken for this Program began with reviews of the overall structural and stratigraphic evolution of the two Basins, specific reviews of the Hutton Sandstone (Cooper-Eromanga) and Pretty Hill Formation (Otway), and then began to focus on analysis of cores and cuttings from Salamander-1 and Celsius-1 plus nearby offset wells. The aim of this analysis was to reconstruct the diagenetic history that affects the primary reservoir quality of each target formation. The final aspect of the program involved comparing the petrological aspects of these samples with seismic attributes in the basins with the aim of using the two datasets to conduct predictive modelling away from well locations to locate porous and permeable zones elsewhere in the basin. The specific program activities were:
1. Thermal reconstruction of the basin history 2. Petrological analysis for rock and matrix mineralogy. Scanning and transmission electron microscopy
(SEM and TEM) analysis plus QEMSCAN and cathodoluminescence for secondary mineral growth and diagenesis processes. In situ experiments to determine factors that affect secondary mineral growth
3. Matching of diagenetic features seen in petrology analysis with seismic attributes to get basin-wide diagenesis predictions from drill data, petrology and seismic
Results Thermal reconstruction of the basin histories - Otway Basin Maximum paleotemperatures and source rock maturity in the Otway Basin were reached immediately prior to a massive, rapid mid-Cretaceous cooling period 95Ma (Duddy & Gleadow 1982). The first major event was mid-Cretaceous cooling (95-100Ma) corresponding with major uplift tectonic activity and the end of Otway Group (Figure 2) volcanism across southern Victoria (Duddy 1983). Evidence suggests the decay of elevated mid-Cretaceous geothermal gradients was complete by 80Ma. The thermal history reconstructions highlight three periods of structuring: mid- Cretaceous, late Eocene-Oligocene and post middle-Miocene (Singleton 1968). Tertiary cooling is generally minor compared with that in the mid Cretaceous. Cooling results from significant erosion associated with folding in the late Cretaceous-Tertiary cover. Figure 5 summarises the uplift that occurred during the mid-Cretaceous.
Figure 5: mid-Cretaceous uplift and erosion extrapolated from mid-Cretaceous paleogeothermal gradients (Duddy, 2002)
ARENA Measure Program 1 summary report 7
South Australian Centre
for Geothermal Energy
Research
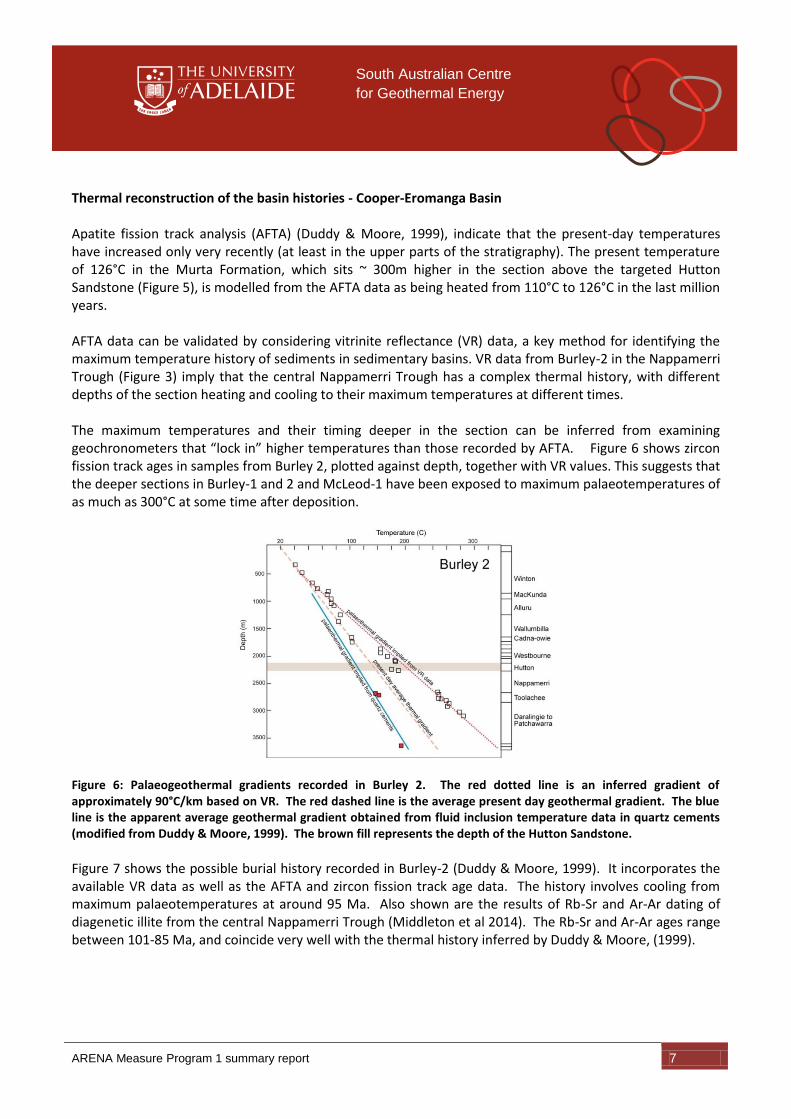
Thermal reconstruction of the basin histories - Cooper-Eromanga Basin Apatite fission track analysis (AFTA) (Duddy & Moore, 1999), indicate that the present-day temperatures have increased only very recently (at least in the upper parts of the stratigraphy). The present temperature of 126°C in the Murta Formation, which sits ~ 300m higher in the section above the targeted Hutton Sandstone (Figure 5), is modelled from the AFTA data as being heated from 110°C to 126°C in the last million years. AFTA data can be validated by considering vitrinite reflectance (VR) data, a key method for identifying the maximum temperature history of sediments in sedimentary basins. VR data from Burley-2 in the Nappamerri Trough (Figure 3) imply that the central Nappamerri Trough has a complex thermal history, with different depths of the section heating and cooling to their maximum temperatures at different times. The maximum temperatures and their timing deeper in the section can be inferred from examining geochronometers that “lock in” higher temperatures than those recorded by AFTA. Figure 6 shows zircon fission track ages in samples from Burley 2, plotted against depth, together with VR values. This suggests that the deeper sections in Burley-1 and 2 and McLeod-1 have been exposed to maximum palaeotemperatures of as much as 300°C at some time after deposition.
Figure 6: Palaeogeothermal gradients recorded in Burley 2. The red dotted line is an inferred gradient of approximately 90°C/km based on VR. The red dashed line is the average present day geothermal gradient. The blue line is the apparent average geothermal gradient obtained from fluid inclusion temperature data in quartz cements (modified from Duddy & Moore, 1999). The brown fill represents the depth of the Hutton Sandstone.
Figure 7 shows the possible burial history recorded in Burley-2 (Duddy & Moore, 1999). It incorporates the available VR data as well as the AFTA and zircon fission track age data. The history involves cooling from maximum palaeotemperatures at around 95 Ma. Also shown are the results of Rb-Sr and Ar-Ar dating of diagenetic illite from the central Nappamerri Trough (Middleton et al 2014). The Rb-Sr and Ar-Ar ages range between 101-85 Ma, and coincide very well with the thermal history inferred by Duddy & Moore, (1999).

ARENA Measure Program 1 summary report 8
South Australian Centre
for Geothermal Energy
Research
Figure 7 - Modelled thermal evolution from Burley 2, which is situated approximately 2km from Celsius 1. The modelling incorporates AFTA, VR and zircon fission track data. Significant heating is modelled to have occurred through the early to mid-Cretaceous culminating in very high geothermal gradients. Rapid cooling in the late Cretaceous and Early Tertiary preceded a possible rapid increase in temperature in the last millions years. The Hutton Sandstone is shown in the brown fill (modified from Duddy & Moore, 1999). Shown in orange are the range of Rb-Sr and Ar –Ar ages obtained from authigenic illite, suggesting that micaeous diagenetic minerals formed close to the thermal maxima.
The Hutton Sandstone in Celsius-1 is presently at P-T conditions below mesogenetic conditions, suggesting a late uplift and cooling from maximum palaeotemperatures. Geotrack (1999) concluded that the Cooper-Eromanga succession started to cool from maximum temperatures between 97 and 75 Ma, later confirmed by Zwingmann et al. (2001). Additionally, diagenetic processes such as the extensive occurrence of kaolinite-derived chlorite (Figure 8A), authigenic mica and titaniferous minerals (Figure 8B) are strong evidences for the past mesogenetic conditions that have affected the formation, and confirm the previous assumptions of a late regional uplift and cooling event (Dillinger et al 2014).
Figure 8: Backscattered electron images showing mesogenetic processes at Celsius-1: A. Diagenetic cements – quartz overgrowths (o), kaolinite booklets (Kln), chlorite flakes (Chl) and fibrous illite (Ill); B. Titanium authigenesis (Rt) (from Dillinger et al 2014).

ARENA Measure Program 1 summary report 9
South Australian Centre
for Geothermal Energy
Research
Petrology - Penola Trough, Otway Basin Thin sections were made using cores taken from the Ladbroke Grove at depths of 2,552 and 2,561 meters. We conducted petrographic analysis to determine the diagenetic processes. Several can be seen in the samples (e.g. Figure 9), some of which enhance porosity while others destroy it. Following is a list of all the diagenetic processes with brief description about each.
Cementation of the sandstone with kaolinite, siderite, and sometimes authigenic muscovite. Siderite appeared in some areas invading and replacing feldspar grains and sometimes corroding quartz grains.
Alteration of feldspar to clay minerals, mostly kaolinite and illite. Some grains exhibit an early stage of alteration where the feldspar grain is still recognised and a fair inter-granular porosity exists. While other feldspar grains completely altered to clay and its boundary can hardly be recognised.
Quartz cementation in the form of overgrowth.
Ductile deformation of muscovite grains exists due to overburden pressure during burial history and/or tectonic events.
Some feldspar grains show dissolution. This particular processes is very important for enhancing the reservoir porosity and thus quality.
Alteration of kaolinite to illite. This occurs at elevated temperatures.
Recrystallization of clay minerals, indicating elevated pressures
A B
Figure 9 - Thin sections showing A. Siderite invading pore space, B. Ductile deformation of muscovite grain Petrology of the Hutton Sandstone, Nappamerri Trough The samples were retrieved in the Hutton Sandstone from seven different wells located in the vicinity of Celsius 1 (Figure 3). The diagenetic processes observed in cuttings retrieved from the Nappamerri Trough are:
Point, line and sutured grain contacts;
Formation of quartz overgrowths on framework grains;
Dissolution/replacement of K-feldspar by authigenic kaolinite and sericite;
Recrystallisation of the detrital clayey matrix into kaolinite and sericite;
Neoformation of chlorite and muscovite;

ARENA Measure Program 1 summary report 10
South Australian Centre
for Geothermal Energy
Research
Calcite cementation and corrosion of the quartz cores and overgrowths;
Iron oxide cementation. Textural and diagenetic characteristics of the Hutton Sandstone at different locations of the basin are comparable, except for the presence of calcite (Figure 10) and widespread iron oxide cementations not seen at Celsius-1 suggesting different compositions of diagenetic fluids across the basin (Dillinger et al 2014).
Figure 10 – Selected images of the Nappamerri Trough samples by optical microscope and SEM (backscatter BS): left - Detrital quartz grain and overgrowths (McLeod 1, xpl); right - Calcite cement (Burley 3, xpl)
In-situ experiments determining the effect of pressure and temperature on secondary mineral growth Secondary mineral growth occurs when a mineral interacts with a fluid with which it is not in equilibrium. A chemical reaction may result in replacement of all or part of the original (parent) mineral and the formation of a new (product) material. Critically, the above process can result in new porosity generation at the reaction front. Very little experimental research has been conducted on the relative contributions of environmental variables such as temperature and pressure on porosity development. Our research aims were to study and quantify the effects of temperature, pressure and timescale on secondary mineral growth. A pilot experiment was performed whereby gypsum was used to cement a quartzite base and the resultant matrix exposed carbonate containing fluid under varying pressure-temperature regimes. Changes in cement composition and associated porosity development were determined. The goal of this research was to identify the hydrothermal conditions and mineral compositions optimal for attaining the fluid flow rates necessary for geothermal energy development. Experimental set-up In order to simulate hydrothermal reactions responsible for secondary mineral growth we developed in-situ flow-through reactors (Figure 11).The reactors were used to determine the effect of pressure, temperature, and fluid composition on mineral replacement reactions and associated changes in permeability. Sample material, consisting of quartz grains cemented with gypsum, was placed in the reactors and exposed to 0.1 molar sodium carbonate solution at a flow rate of 5 ml minute. The samples were subjected to varying temperatures (140oC to 200oC) and pressures (200, 450 and 1,200 bar) for varying time periods (1 hour to 1 week). Samples were non-destructively analyzed for porosity changes using a Skyscan 1072 micro-computer tomography (MCT) analyzer.

ARENA Measure Program 1 summary report 11
South Australian Centre
for Geothermal Energy
Research
Figure 11 - The flow through reactor system showing high pressure pump and backpressure regulator.
XRD analysis of the time series experiment showed that at experimental conditions of 140oC temperature 450 bar pressure and a 5 ml per minute flow rate, no new mineral growth was evident after 1 hour. After 24 hours some replacement of the gypsum with calcite had occurred. After 1 week, all of the gypsum had been replaced with calcite (Figure 12). As expected, porosity development followed the same pattern, with little change in porosity over 24 hours, but an increase from 2 percent to 25 percent over the next 144 hours. At a pressure of 200 and 450 bars (temperature 140oC), no new mineral growth occurred over an 8 hour period. Increasing pressure to 1,200 bars resulted in replacement of gypsum by calcium sulphate and calcite over 8 hours (Figure 12). At all pressure levels, porosity was of the same order (approximately 2 per cent) after 1 hour. After 8 hours, porosity remained at 2 percent at 200 and 450 bar but increased to 18 percent at 1,200 bar. Over a 1 hour timeframe there was no significant change in sample composition or porosity at temperatures between 140 and 200oC. Over 8 hours, porosity increased to 4 percent at 1600C, 15 percent at 180oC and 19 per cent at 200oC, reflecting the increased rate of calcification of the sample at elevated temperatures (Figure 12).
Figure 12 - Effect of: A. pressure on porosity development over time at 140
0C. B. Temperature on porosity
development (pressure = 450 bar) C. Timescale of the mineral replacement reaction (pressure 450 bar, temperature 140
0C)
A B
A B
C
0
10
20
0 1 2 3 4 5 6 7 8
Po
rosi
ty (%
)
Time (Hrs)
Porosity vs Pressure
200 Bar
450 Bar
1200 Bar
0
5
10
15
20
140 160 180 200
Po
rosi
ty (%
)
Temperature (C)
Porosity vs Temperature
1 Hr
8 Hr
0
10
20
30
0 Hr 1 Hr 8Hr 24 Hr 1 Week
Po
rosi
ty (%
)
Time
Porosity over Time

ARENA Measure Program 1 summary report 12
South Australian Centre
for Geothermal Energy
Research
The rate at which secondary mineral growth occurs has been shown to be highly dependent on environmental conditions such as pressure and temperature with reaction rate increasing at temperatures over 160oC and pressures beyond 450 bars. Further work will involve studying cementing materials commonly found in sandstones associated with areas of geothermal interest, (carbonates, kaolinite, illite/smectite, zeolites), to fluids of a composition representative of those found at geothermal drill sites. Predictive modelling from seismic attribute and petrology analysis Penola Trough, Otway Basin Porosity and permeability can be measured in wells using several methodologies with high accuracy, but there are problems with interpolating these values between the wells. The most feasible way to map porosity between wells is to use a tool that measure the rock properties at fine scale. Seismic surveys measure the properties by measuring their response to elastic disturbances called seismic (or elastic) waves. Here we studied in detail the thin sections of the pretty hill formation to locate the highly porous and permeable areas within the Penola Trough. Then we compared that to the seismic attributes at the same location of the sampled well. 3D seismic and well logs results were correlated to the existing petrographic results for possible tool to locate permeable zones Seismic attributes Out of the hundreds of seismic attributes available for the interpreters, we used reflection intensity (RI), relative acoustic impedance (RAI), and quadrature as representatives for reservoir characterization attributes. Highly porous areas were found to contain low RI, RAI, and quadrature. This is a direct result that leads to identifying porous areas between wells (Figures 13 & 14).
Figure 13: High porosity in thin sections is reflected with low RI, RAI, and quadrature attributes values reflected by empty areas around Haselgrove 1, Penola Trough.

ARENA Measure Program 1 summary report 13
South Australian Centre
for Geothermal Energy
Research
Figure 14: low porosity in thin sections is reflected with high RI, RAI, and quadrature attributes values reflected by empty areas around Haselgrove 2, Penola Trough.
Well Logs As well logs such as density (RHOB), sonic velocity (DT), resistivity (LLD), and porosity (PHI) are direct measurements of the actual reservoir, they provide vertical variation in the reservoir characteristics. We display the lithological variation studied from the thin sections vertically with the variation of the porosity from thin sections and with the seismic attributes from 3D seismic. The results show direct relation, indicating that porosity within the reservoir can be mapped vertically and horizontally using seismic attributes (Figure 15).
Figure 15 - Highly porous Pretty Hill Formation showing fair signal of seismic attributes.

ARENA Measure Program 1 summary report 14
South Australian Centre
for Geothermal Energy
Research
The use of the 3D seismic attributes to map the permeable areas within the pretty hill formation shows good correlation between thin sections results and seismic attributes. Thus, these attributes can be used to map sweet spots for hot sedimentary aquifers (Figure 16).
Figure 16: highly porous areas at the Pretty Hill Formation mapped using the relative acoustic impedance seismic attribute.
Conclusions
The thermal history of the Otway and Cooper-Eromanga Basins has resulted in deep burial, heating and destruction of porosity and permeability, which has caused significant reduction in primary reservoir quality. This has implications for HSA development in that there may not be primary reservoirs that are hot enough and of high quality in many onshore parts of Australia. We achieved some new and innovative results by integrating the petrology and geochemistry that was part of the research with seismic attributes and well logs from drilling. This has not been done before, and has provided a new methodology for predicting porosity and permeability across energy basins. The implications are that it may be possible to predict sweet spots for drilling ahead of the drill program To conclude Program 1, we have comprehensively assessed the primary reservoir quality of the two target formations (the Hutton Sandstone and Pretty Hill Formation) using a range of analytical techniques. We have then used those results, plus innovative geophysical and petrophysical techniques, to create a new modelling methodology that will enable prediction of optimal primary reservoir quality ahead of drilling.