Installing Public Electric Vehicle Charging Stations: A ...
78
Installing Public Electric Vehicle Charging Stations: A Site Suitability Analysis in Los Angeles County, California by Jennifer Shengji Jin A Thesis Presented to the Faculty of the USC Graduate School University of Southern California In Partial Fulfillment of the Requirements for the Degree Master of Science (Geographic Information Science and Technology) May 2016
Transcript of Installing Public Electric Vehicle Charging Stations: A ...
Installing Public Electric Vehicle Charging Stations: A Site Suitability Analysis in Los Angeles County, California
by
Jennifer Shengji Jin
A Thesis Presented to the Faculty of the USC Graduate School
University of Southern California In Partial Fulfillment of the
Requirements for the Degree Master of Science
(Geographic Information Science and Technology)
May 2016

Copyright ® 2015 by Jennifer Shengji Jin

To a special person, my mother.

iv
Table of Contents
List of Figures ................................................................................................................................ vi
List of Tables ................................................................................................................................ vii
Acknowledgements ...................................................................................................................... viii
List of Abbreviations ..................................................................................................................... ix
Abstract ........................................................................................................................................... x
Chapter 1 Introduction .................................................................................................................... 1
1.1 Motivation ............................................................................................................................1 1.2 Research Gap .......................................................................................................................4 1.3 Study Area: Los Angeles County ........................................................................................9
Chapter 2 Literature Review ......................................................................................................... 12
2.1 Electric Vehicles ................................................................................................................12 2.2 Environment Impact ...........................................................................................................14 2.3 EV Charging Equipment ....................................................................................................15 2.4 Related Studies in GIS .......................................................................................................19
Chapter 3 Methodology ................................................................................................................ 24
3.1 Methodology Workflow .....................................................................................................25 3.2 DC Fast Charging ..............................................................................................................27
3.2.1. Freeways ..................................................................................................................27 3.2.2. County Government Offices ....................................................................................27 3.2.3. Public Libraries in Los Angeles County ..................................................................28 3.2.4. Public Parks in Los Angeles County .......................................................................29
3.3 Public Access Charging .....................................................................................................30 3.4 Workplace Charging ..........................................................................................................35
3.4.1. Existing Public EV Charging Stations Data ............................................................36
Chapter 4 Results .......................................................................................................................... 37
4.1 DC Fast Charging Results ..................................................................................................37 4.2 Public Access Charging, Level 2 .......................................................................................43 4.3 Workplace Charging, Level 2 ............................................................................................48
Chapter 5 Discussion & Conclusion ............................................................................................. 52

v
5.1 Key Observations ...............................................................................................................52 5.2 Contrasts to Prior Studies ..................................................................................................54 5.3 Future Research .................................................................................................................55
REFERENCES ............................................................................................................................. 58
Appendix A: Los Angeles County Electric Vehicle Charging Stations ....................................... 64
Appendix B: Los Angeles County Public Libraries ..................................................................... 66
Appendix C: Los Angeles County Department of Regional Parks and Recreations .................... 67

vi
List of Figures
Figure 1 Los Angeles County Owned Public Charging Stations .................................................... 7
Figure 2 Los Angeles County Location within the State of California ........................................ 10
Figure 3 Fuel Efficiency Standards. .............................................................................................. 14
Figure 4 Two Common DC Fast Charging Plug. ......................................................................... 17
Figure 5 Electric Vehicle Charging Receptacles. ......................................................................... 18
Figure 6 Level 2 Charging Station. ............................................................................................... 18
Figure 7 Methodology Framework ............................................................................................... 25
Figure 8: Select County Government Offices to Install DC Fast Charging Stations in Modelbuilder ......................................................................................................................... 28
Figure 9 Select County Libraries to Install DC Fast Charging Stations in Modelbuilder ............ 29
Figure 10 Select County Parks to Install DC Fast Charging Stations in Modelbuilder ................ 30
Figure 11 Score Demographic Feature and Add Weighted Score to Census Tract in Modelbuilder............................................................................................................................................... 33
Figure 12 Add Weighted Scores to County Libraries and Parks within Census Tract in Modelbuilder ......................................................................................................................... 35
Figure 13 DC Fast Charging at Los Angeles County Libraries and Parks in GIS Application .... 40
Figure 14 Identified Los Angeles County Libraries and Parks to Install Level 2 Charging Stations for Public Access in GIS Application ................................................................................... 45
Figure 15 Los Angeles County Offices to Install Level 2 Charging Stations .............................. 49

vii
List of Tables
Table 1 Driving Range per Charging Hour ................................................................................... 16
Table 2 Best Locations for Public Access Charging .................................................................... 22
Table 3 List of Data Sources ......................................................................................................... 26
Table 4 Census Tract Demographic Characteristic Ranking System ........................................... 34
Table 5 Selected Government Offices to Install DC Fast Charging Stations ............................... 41
Table 6 Selected Libraries to Install DC Fast Charging Stations ................................................. 42
Table 7 Selected Parks to Install DC Fat Charging Stations ........................................................ 42
Table 8 Selected Libraries to Install Level 2 Charging Stations for Public Access ..................... 46
Table 9 Selected Parks to Install Level 2 Charging Stations for Public Access ........................... 47
Table 10 Los Angeles County Offices .......................................................................................... 50

viii
Acknowledgements
I am grateful to all faculty from the USC GIST program, who assisted me in completing the
master’s program.

ix
List of Abbreviations
AB Assembly Bill
BEV Battery-only Electric Vehicles
DC Direct Current
EV Electric Vehicle
EVCS Electric Vehicle Charging Station
EVSE Electric Vehicle Supply Equipment
GIS Geographic information system
GISci Geographic information science
HOV High Occupancy Vehicle
LAC Los Angeles County
MUD Multi Unit Dwellings
PEV Plug-In Electric Vehicles
SB Senate Bill
SSI Spatial Sciences Institute
USC University of Southern California
x
Abstract
Plug-in electric vehicles (EVs) have shown benefits in reducing gasoline consumption. One of
the key domains affecting EV penetration in the U.S. market is the EV charging station
infrastructure. Charging equipment varies by charging time, how much a battery holds, types of
batteries, and the types of Electric Vehicle Supply Equipment (EVSE). The charging time can
range from 15 minutes to 20 hours depending on the above variables (Alternative Fuels Data
Center 2015). The most affordable EVs on the U.S. auto market, excluding the Tesla, are able to
cover approximately 70−80 miles on a full charge (Schaal 2015). The average range of electric
vehicles per charge is much less than that of conventional gasoline vehicles. Currently, the
problem is that there are not enough public charging stations to supply the increasing number of
electric vehicles on the road. The goal of this thesis is to determine where to install EV charging
stations at public facilities of Los Angeles County. The data used in this study are based on
existing public facilities of Los Angeles, such as government offices and public libraries and
parks. This analysis section is divided into three sub-sections: DC Fast Charging Infrastructure,
Public Access Charging, and Workplace Charging. The three approaches are explained in the
Methodology section and the results are discussed in the Results section. This study
demonstrates how site suitability analysis based on geographic information system (GIS) data
can provide information useful for installing public EV charging stations in Los Angeles County.
The findings of this study show that, by applying the site suitability method, Los Angeles County
would be able to install more EV charging stations at optimal locations and to serve the needs of
their intended users.

1
Chapter 1 Introduction
Plug-in electric vehicles (EV) have shown benefits to reduce gasoline consumption, and one of
the key domains affecting EV penetration in the US market is EV charging station infrastructure.
EVs have many benefits like low emissions to the environment and higher energy efficiency, and
both Federal and State agencies advocate for EVs on this basis (U.S. Department of Energy
2012). The challenge of driving EVs is the short mileage range compared with gasoline vehicles
and long hours of charging activities. In Los Angeles County, California, new EV charging
station infrastructure can be installed at many public facilities like beaches, libraries, parks, and
schools. In this thesis, a site suitability analysis is used to locate areas needed to install EV
charging stations in Los Angeles County. The locations of existing public EV charging stations
and the needs of EV drivers are examined to guide decision makers in placing new charging
stations.
1.1 Motivation
The U.S. federal government has released relevant policies and several incentive
programs to encourage the use of EVs to ease dependence on gasoline consumption. The EV
incentives include purchasing tax credits and installing EV charging stations. These incentives
have been adopted by state and local governments. The American Recovery and Reinvestment
Act of 2009 provided a tax credit of $2,500 per plug-in hybrid electric vehicle sold. The U.S.
Department of Energy also granted $37 million for installing 4,600 charge points around the
nation and allocated $99.8 million to fund the EVProject, which is installing 14,000 level 2
charges (Peterson and Michalek 2013, 430). After 2010, federal tax credits of up to $7,500 were
made available for purchasing EVs. The credit amount varies based on the capacity of the battery

2
used to the fuel the vehicle. Small neighborhood EVs do not qualify for this credit, but they may
qualify for another credit from the Internal Revenue Service (Fuel Economy 2015).
The State of California is also a leading state in promoting sustainable transportation. The
State’s ongoing campaign is to get 1.5 million EVs on the road by 2025. California has long led
the nation in promoting the development and adoption of EVs through the Zero Emissions
Vehicle Program, which aims to have new cars emit 34 percent fewer global warming gases, 75
percent fewer smog emissions, save consumers over $6,000 over the life of the car, and bring
more efficient vehicles (Lavring 2013). Also in California, the State Legislature has passed a
series of bills and laws to support EV use. Assembly Bill 1092 required state agencies to set
standards for installing charging outlets in apartment commercial buildings (California
Legislative Information 2013). Bills AB 266 and SB 286 extended the High Occupancy Vehicle
(HOV) lane sticker program through 2019, giving drivers access to carpool lanes no matter how
many people are in the car (California Legislative Information 2013). SB359 funded four
programs that encourage green vehicle purchases, including $20 million for the Clean Vehicle
Rebate Project (California Legislative Information 2013).
According to a press release from ChargePoint, Los Angeles ranks second among the top
10 EV-friendly metropolitan areas, with nearly 57,000 registered EVs. The number of EV
owners has nearly tripled from 17,000 in 2013 (ChargePoint 2015). Los Angeles County is one
of the most populous areas in the United States, and the daily commute is heavily dependent on
vehicle transportation. Therefore, the County should offer more charging stations to better serve
the increasing number of EV drivers. Installing EV charging stations will not only increase the
driving range but also attract more foot traffic to these public facilities. In addition, it will
increase usage of recreational areas in Los Angeles County, such as public parks and libraries.

3
In a recent Canadian consumers-based study, 18% of Canadian respondents’ report being
aware of at least one public charger. For comparison, a 2011 U.S. survey found that 12% of
respondents had seen public charging locations in their communities (Bailey et al. 2015, 8). This
study shows that there is no significant relationship between consumer awareness of public
charging stations and interest in purchasing a plug-in EV. Thus, awareness of public charging
stations is a strong indicator of purchasing electric vehicles (Bailey et al. 2015, 1). Therefore, the
intent of increasing public charging stations is to extend driving ranges and increase the number
of charging opportunities on the road.
In California, where the state has been pushing to be greener, EV owners are also
experiencing unpleasant interactions at public charging stations. Most people charge at home but
also want to use public chargers, in part because the cars have a limited range—typically, 80
miles. On top of this “range anxiety,” as it is called, drivers like the idea of getting a free or low-
cost charge at a public station (Richtel 2015). Unlike gas stations, charging stations are not yet in
great supply, and that has led to sharp-elbowed competition. EV owners are unplugging one
another’s cars, trading insults, and creating black markets and side deals to trade spots in
corporate parking lots (Richtel 2015). The number of public EV charging stations is not meeting
the need of these charging stations. About half of the 330,000 electric vehicles in the U.S. are
registered in California, and Governor Jerry Brown plans to increase the number of electric
vehicles to 1.5 million (Richtel 2015). Only more public charging station are the obvious long-
term solution.
In terms of spatial distribution, the existing gasoline station networks in many urban areas
are more than sufficient (Melaina and Bremson 2008, 3233). The average range of electric
vehicles per charge is much less than that of conventional gasoline vehicles. Range anxiety is the

4
term used to describe worry on the part of a person driving an electric car that the battery will
run out of power before the destination or a suitable charging point is reached (Oxford
Dictionaries 2015). An EV can take up several hours to charge, depending on charging levels
and car models. Most EV drivers have reliable primary charging sources at home or at their
workplaces. However, EV driving range can be greatly increased on the road if additional
charging stations are available. Despite fast charging stations that can charge 80% of the battery
in less than 30 minutes, it still takes longer than fueling a gasoline vehicle, and it requires more
EV charging infrastructure. In order to have EVs act as primary vehicles for an increasing
number of drivers, more opportunities for EV charging must be created to extend the driving
range.
1.2 Research Gap
An article, “Ready, Set, Charge California!” was a collaborative project by the
Association of Bay Area Governments, Bay Area Climate Collaborative, Clean Fuel Connection,
EV Communities Alliance, and LightMoves Consulting. In this article, EV-readiness issues
include encouraging PE deployment at the regional level and investigations regarding EV
infrastructure planning and investment (PEV Collaborative 2011). It discusses some guiding
principles for installing charging stations like electrical requirement and design in residential and
multi-unit dwellings. However, it lacks information on building an EV charging network in
California.
In 2011, Sonoma County released a general set of guidelines for EV charging stations.
The vision of the County of Sonoma’s Electric Vehicle Charging Station (EVCS) Program is to
provide a comprehensive network of distributed chargers throughout the County which services
both public agencies and the private sector and inspires other communities to initiate their own

5
EVCS programs (County of Sonoma 2011, 1). The planned distributive system of chargers in
Sonoma included both County-owned or leased properties. The County’s guidelines for installing
charging stations were intended for both public and private application.
In Los Angeles County, an EV deployment plan was researched by the UCLA Luskin
School of Public Affairs. The UCLA study was divided into three main charging areas:
workplace charging, multi-unit dwelling (MUD) charging, and retail charging. For workplace
charging, the researchers considered Electric Vehicle Charging Station (EVSC) installation sites
by answering the following questions: what are the largest employers and where are they
located? Which employers are located in neighborhoods where current PEV owners drive on
weekday mornings? Which employers have the highest numbers of white-collar and high-tech
workers? (UCLA Luskin School of Public Affairs 2013, 14).
From the UCLA study, the authors also suggested considering social characteristics of
these employers. Defense contractors are important sources of technology research and
development; workplace PEV charging may thus align with the mission, interest, and image of
the companies and their employees, some of whom may be Plug-in Electric Vehicle (PEV)
drivers. However, security protocol makes it difficult for planners to conduct employee outreach
or establish on-site demonstration projects. Oil companies’ business models would appear to
discourage them from offering workplace charging, but they may wish to demonstrate an interest
in sustainability. Other employers, particularly in the health, technology, and public sector, may
wish to accommodate or attract employees and clients that drive PEVs (UCLA Luskin School of
Public Affairs 2013, 17). These suggested variables could be considered as social indexes in
spatial analysis, but they omit applying it in identifying potential EVCS locations.

6
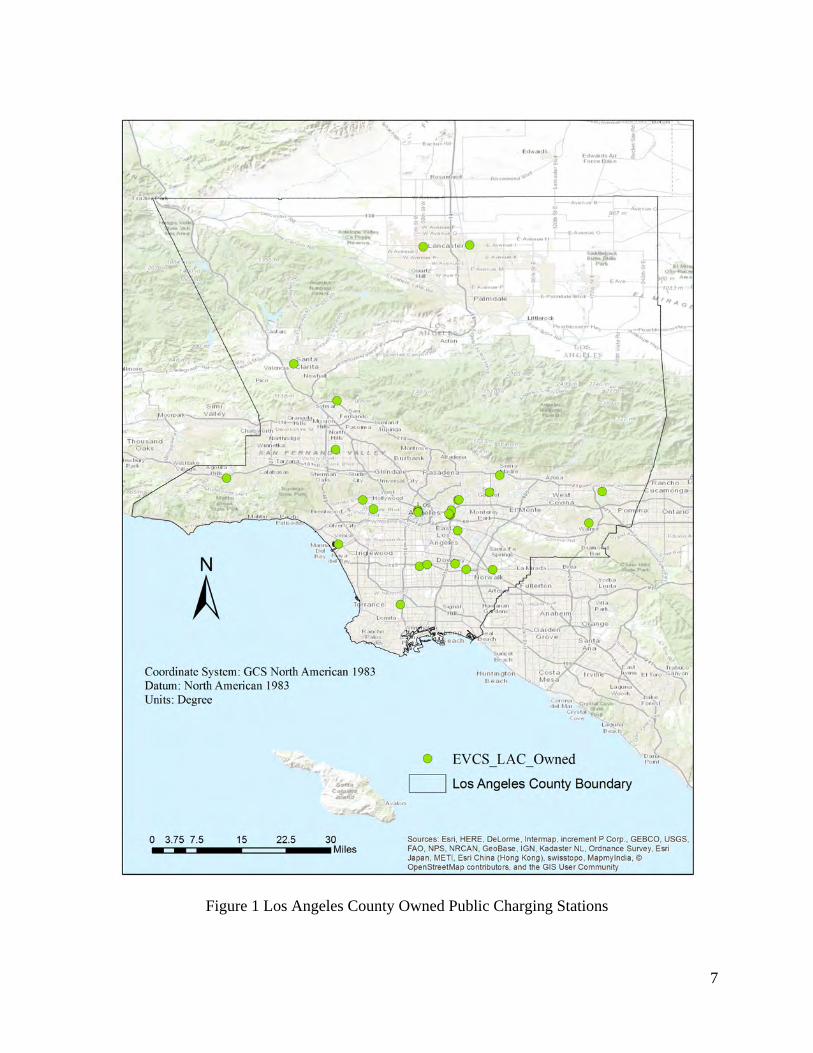
In fact, at the local government level, Los Angeles County has been installing charging
stations at several departmental faculties. In September of 2014, Supervisor Mark Ridley-
Thomas announced that Los Angeles County residents could take advantage of charging stations
at various County faculties⎯for instance, at the Los Angeles County Sheriff’s station in
Lynwood or the Department of Health Services in Downey. EV drivers can charge their vehicles
for up to four hours, free of charge, during the initial year of the program. At the onset of the EV
program, there were over 20 EVCS sites across the County (Supervisor Mark Ridley-Thomas
2014). These charging stations are located at Los Angeles County Sheriff’s stations, county
medical centers, the Department of Human Resources, the Office of the Registrar-Recorder,
Walt Disney Concert Hall, Arboretum, and other locations (see Figure 1 and Appendix A). The
charging availability is subject to office business hours, parking garage hours and basis of first
come first service. Altogether, over 200 publicly accessible charging stations are distributed
throughout Los Angeles County and operated by a variety of other service providers (Los
Angeles County Economic Development Corporation 2015). At the County level, more EV
charging stations should be installed where people can have more charging opportunities.
7
Figure 1 Los Angeles County Owned Public Charging Stations
8
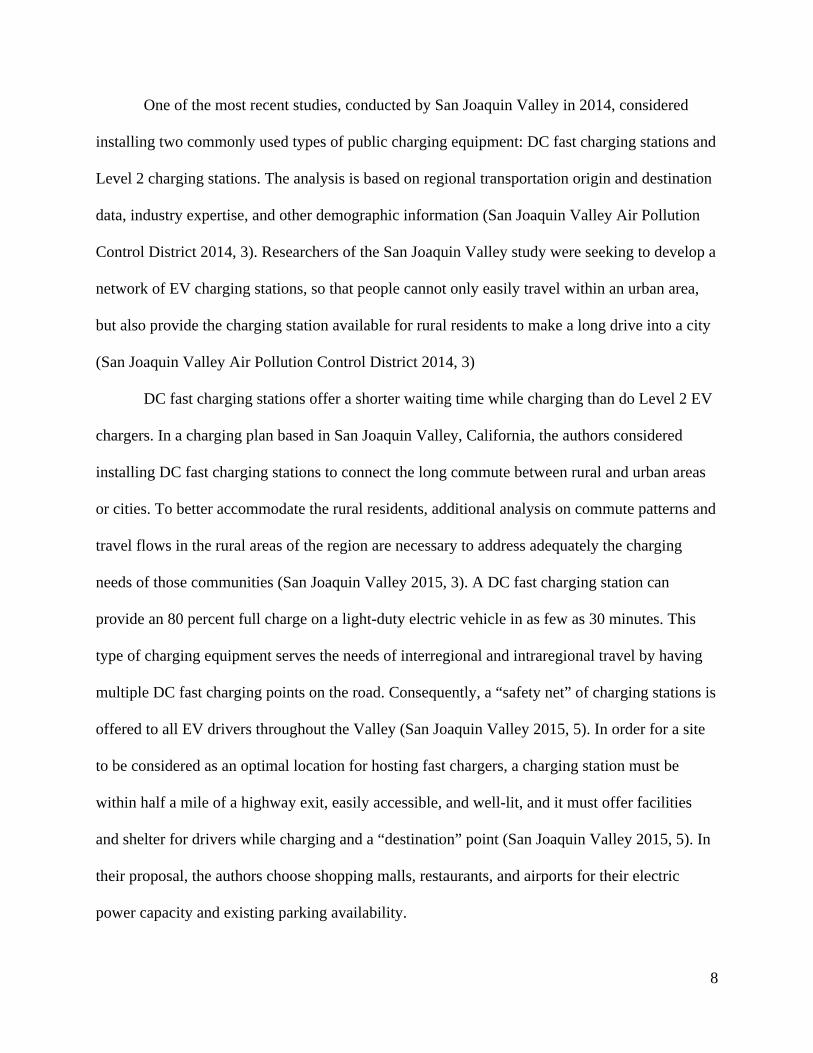
One of the most recent studies, conducted by San Joaquin Valley in 2014, considered
installing two commonly used types of public charging equipment: DC fast charging stations and
Level 2 charging stations. The analysis is based on regional transportation origin and destination
data, industry expertise, and other demographic information (San Joaquin Valley Air Pollution
Control District 2014, 3). Researchers of the San Joaquin Valley study were seeking to develop a
network of EV charging stations, so that people cannot only easily travel within an urban area,
but also provide the charging station available for rural residents to make a long drive into a city
(San Joaquin Valley Air Pollution Control District 2014, 3)
DC fast charging stations offer a shorter waiting time while charging than do Level 2 EV
chargers. In a charging plan based in San Joaquin Valley, California, the authors considered
installing DC fast charging stations to connect the long commute between rural and urban areas
or cities. To better accommodate the rural residents, additional analysis on commute patterns and
travel flows in the rural areas of the region are necessary to address adequately the charging
needs of those communities (San Joaquin Valley 2015, 3). A DC fast charging station can
provide an 80 percent full charge on a light-duty electric vehicle in as few as 30 minutes. This
type of charging equipment serves the needs of interregional and intraregional travel by having
multiple DC fast charging points on the road. Consequently, a “safety net” of charging stations is
offered to all EV drivers throughout the Valley (San Joaquin Valley 2015, 5). In order for a site
to be considered as an optimal location for hosting fast chargers, a charging station must be
within half a mile of a highway exit, easily accessible, and well-lit, and it must offer facilities
and shelter for drivers while charging and a “destination” point (San Joaquin Valley 2015, 5). In
their proposal, the authors choose shopping malls, restaurants, and airports for their electric
power capacity and existing parking availability.

9
1.3 Study Area: Los Angeles County
Los Angeles County is the most populous county in the United States, according to the
2010 U.S. Census. In 2010, the population of Los Angeles County was 9,818,605. Like other
major urban cities in the U.S., people depend on automobile transportation which public transits
and driving a personal vehicle. According to a 2013 American Community Survey, about 86 %
of all workers commuted to work by private vehicle, either driving alone or carpooling
(McKenzi 2015). People depend on private vehicle in daily life and electric vehicles offer an
alternative to gasoline vehicles. According to another study, Los Angeles (LA) has been shown
to be a perfect place to have an electric vehicle in the near future; LA has a car centric culture,
because of the spread-out nature of the city and lack of public transportation options (Schaal
2015).
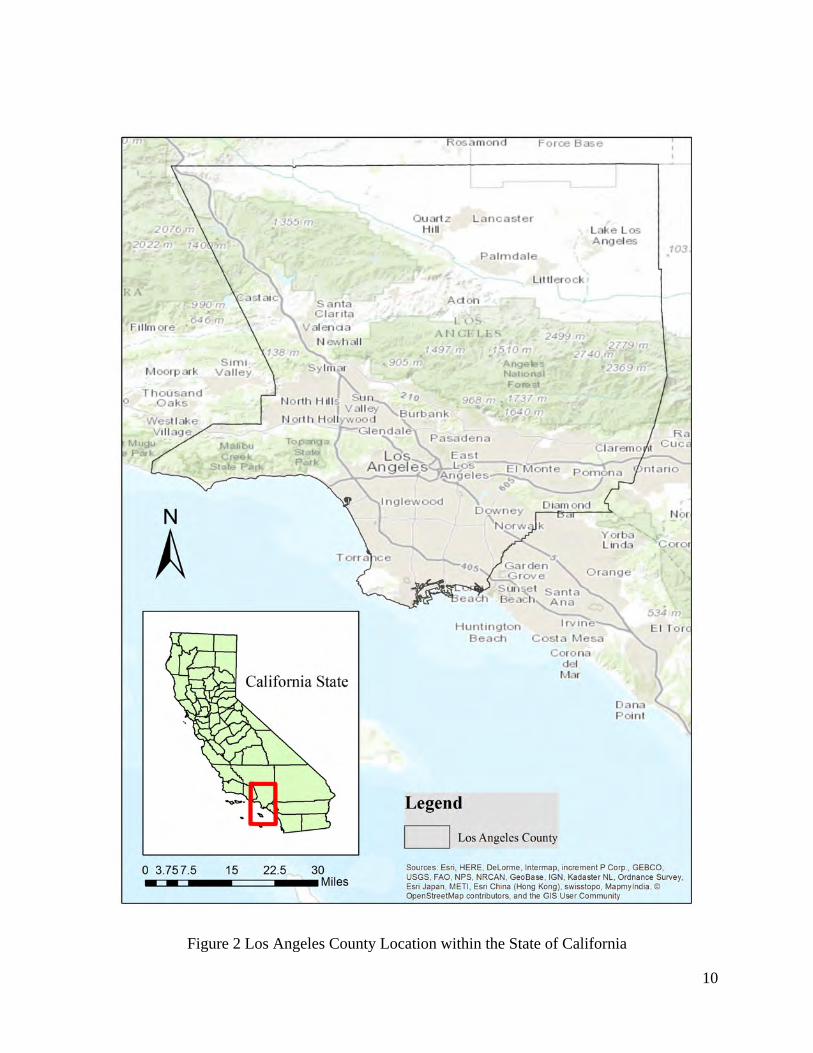
Existing public EV charging stations have shown EV popularity in the region. In Figure
2, the map shows the location of Los Angeles County within the state of California. Los Angeles
County locates in the southern region and the county boundary is in green shade. Right now,
2804 EV charging stations locate mainly in the northern and southern regions of the State
(Alternative Fuel Data Center, 2015). The existing charging station data is used in this site
suitability analysis. Installing more charging stations in Los Angeles County also offers more
charging access in Southern California (see Figure 2).
10
Figure 2 Los Angeles County Location within the State of California

11
In applying the concept from related studies, this thesis aims to perform a site suitability
analysis to locate optimal charging stations within Los Angeles County. The precedent
components are by understanding different types of charging stations, identifying where these
charging services are needed and the intended users. The remainder of this research includes four
chapters. Chapter 2 discusses important background related to the basic features of electric
vehicles, their environment impact, various charging equipment and other relevant studies in this
field. Chapter 3 describes the data and methods used in this study. In Chapter 4, the results of the
study are shown in maps and in tables. Lastly, Chapter 5 reviews the results and discusses the
importance of this research.

12
Chapter 2 Literature Review
Recent published studies on the topic of EVs and their charging equipment focus mainly on
where to install a single charging station. However, researchers have begun considering solutions
that can solve issues of environmental pollution wrought from gasoline vehicles. Currently,
inadequate research exists to examine the potential benefits of installing multiple EV charging
stations at local government facilities. This section introduces the various types of electric
vehicles; the section also outlines state and federal environmental rules and regulations
pertaining to electric vehicles and the installation of electric vehicle charging stations (EVCS);
and the section presents related EV charging studies in the field of Geographic Information
System (GIS).
2.1 Electric Vehicles
Energy-saving vehicles are categorized as hybrids, plug-in hybrids, and all-electric
vehicles. Hybrids do not require charging electricity, whereas plug-in hybrids and battery electric
vehicles (BEVs) must be charged partially or fully. Hybrids, also known as hybrid-electric
vehicles (HEVs) combine the benefits of gasoline engines and electric motors (International
Energy Agency 2015). HEVs have several advantages, including improved fuel economy,
increased power, and additional auxiliary power for electronic devices and power features. The
electric motor applies resistance to the drivetrain causing the wheels to slow down; it also
provides additional power with which to assist in engine acceleration, as ell as passing or hill
climbing. Also, the HEV automatically shuts off the engine when the vehicle comes to a stop,
and restarts when the accelerator is pressed: this prevents wasted energy form idling (Plug-in
Electric Vehicle Resource Center. 2015).

13
Plug-in hybrid, or Plug-in Hybrid-Electric Vehicles (PHEVs) are hybrids with high-
capacity batteries, which can be charged by plugging them into an electrical outlet or charging
station. These vehicles can store enough electricity from the power grid to significantly reduce
their gasoline consumption under typical driving conditions. When compared with conventional
gasoline vehicles, PHEVs offer benefits of less petroleum use, less greenhouse gas emissions,
and lower gasoline costs (Plug-in Electric Vehicle Resource Center. 2015).
All-electric vehicles or Battery-Electric Vehicles (BEVs) run on electricity alone. They
are propelled by one or more electric motors, powered by rechargeable battery packs. BEVs have
several advantages over vehicles with internal combustion engines: they are energy efficient,
environmentally friendly, possess performance benefits, and reduce energy dependence of
gasoline (Plug-in Electric Vehicle Resource Center. 2015). Electric vehicles convert
approximately 59-62 % of the electrical energy at the wheels, whereas conventional vehicles
only convert about 17-21% of gasoline energy. EVs emit no tailpipe pollutants (Plug-in Electric
Vehicle Resource Center. 2015). Electricity from nuclear-, hydro-, solar-, or wind-powered
plants causes no air pollutants. Electric motors provide quiet, smooth operation, stronger
acceleration, and require less maintenance from internal combustion engines. Comparing with
gasoline, electricity is a domestic energy source.
Installing electric vehicle charging stations and deploying of a charging station network
has been researched in urban areas. These urban areas often represent concentrated EV usage,
such as in major cities in Asia, Europe, and North America. Although EV studies have mostly
concentrated on technical requirements, offering recommendations at single site installation,
researchers are now advancing plans for charging networks in urban areas. Successful studies
from other cities have demonstrated different planning approaches to such EV charging.

14
2.2 Environment Impact
Electric vehicles offer the potential of reducing greenhouse gas emissions, as well as
exposure to tailpipe emissions from personal transportation. According to a recent study, EVs
offer a 10% to 24 % potential decrease in global warming impact compared to conventional
diesel or gasoline vehicles (Troy et al. 2012, 1). In the 1960s and 1970s, soaring oil prices and
gasoline shortages peaked with the 1973 Arab Oil Embargo, which created a growing interest in
lowering the U.S.’ dependence on foreign oil, and finding homegrown fuel sources. The 1975
Energy Policy Conservation Act created the Corporate Average Fuel Economy (CAFE)
standards, which mandated efficiency increases in the vehicle fleet by setting standards for
passenger cars starting in 1978 (Peterson and Michalek 2013, 429).
Figure 3 Fuel Efficiency Standards. Source: U.S. Department of Energy 2012
15
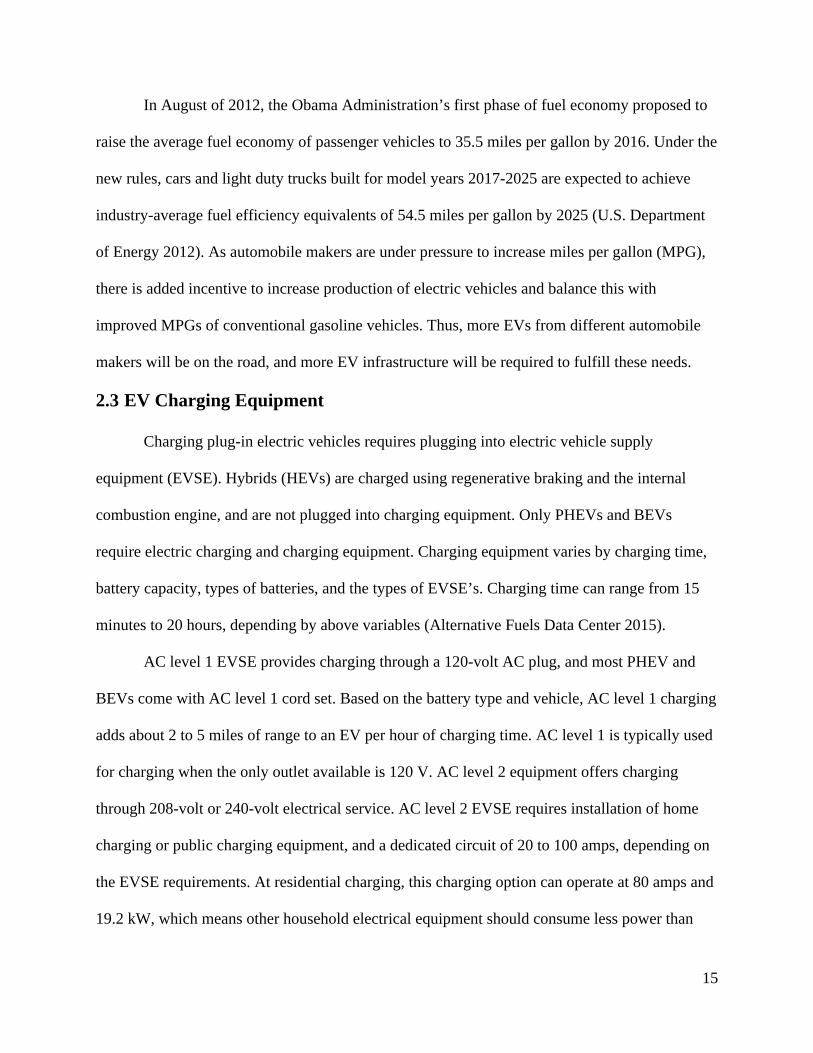
In August of 2012, the Obama Administration’s first phase of fuel economy proposed to
raise the average fuel economy of passenger vehicles to 35.5 miles per gallon by 2016. Under the
new rules, cars and light duty trucks built for model years 2017-2025 are expected to achieve
industry-average fuel efficiency equivalents of 54.5 miles per gallon by 2025 (U.S. Department
of Energy 2012). As automobile makers are under pressure to increase miles per gallon (MPG),
there is added incentive to increase production of electric vehicles and balance this with
improved MPGs of conventional gasoline vehicles. Thus, more EVs from different automobile
makers will be on the road, and more EV infrastructure will be required to fulfill these needs.
2.3 EV Charging Equipment
Charging plug-in electric vehicles requires plugging into electric vehicle supply
equipment (EVSE). Hybrids (HEVs) are charged using regenerative braking and the internal
combustion engine, and are not plugged into charging equipment. Only PHEVs and BEVs
require electric charging and charging equipment. Charging equipment varies by charging time,
battery capacity, types of batteries, and the types of EVSE’s. Charging time can range from 15
minutes to 20 hours, depending by above variables (Alternative Fuels Data Center 2015).
AC level 1 EVSE provides charging through a 120-volt AC plug, and most PHEV and
BEVs come with AC level 1 cord set. Based on the battery type and vehicle, AC level 1 charging
adds about 2 to 5 miles of range to an EV per hour of charging time. AC level 1 is typically used
for charging when the only outlet available is 120 V. AC level 2 equipment offers charging
through 208-volt or 240-volt electrical service. AC level 2 EVSE requires installation of home
charging or public charging equipment, and a dedicated circuit of 20 to 100 amps, depending on
the EVSE requirements. At residential charging, this charging option can operate at 80 amps and
19.2 kW, which means other household electrical equipment should consume less power than
16
normal usage, and requires a protective high circuit breaker. If 240-volt services are available at
home, most EVs can be fully charged overnight. Level 2 and level 1 charging equipment uses the
same connector as the EVs (Alternative Fuel Data Center 2015), and are both used in residential
buildings.
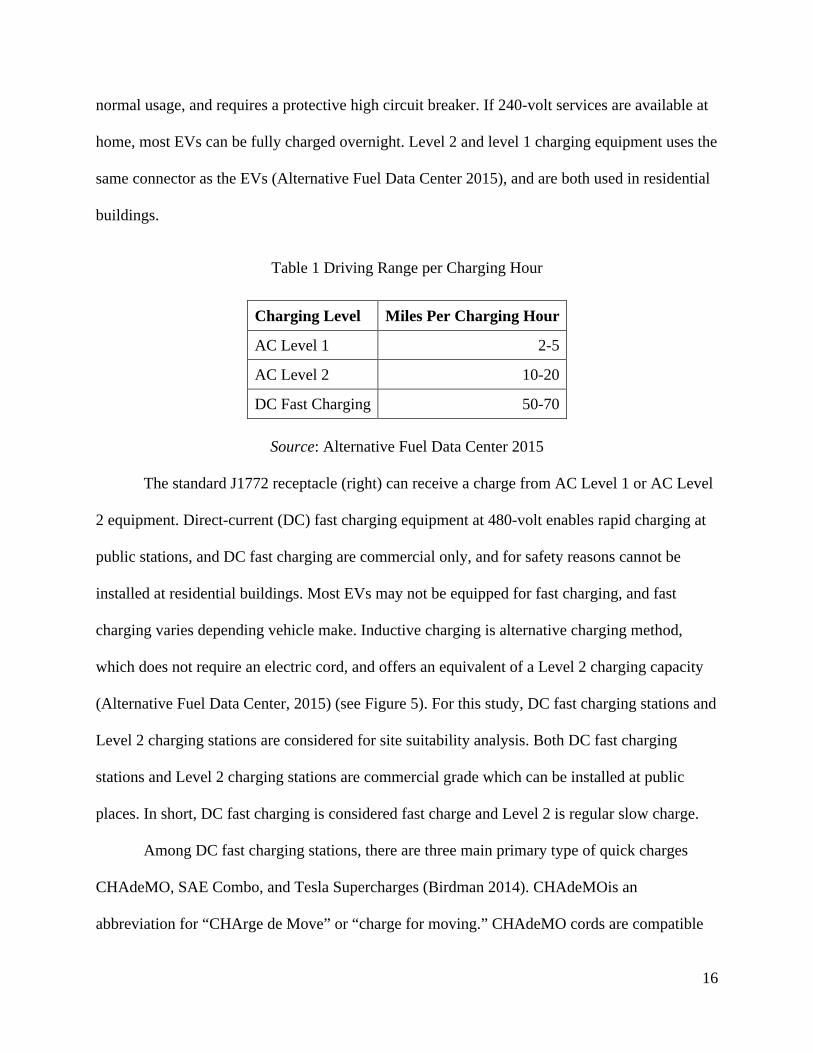
Table 1 Driving Range per Charging Hour
Charging Level Miles Per Charging Hour
AC Level 1 2-5
AC Level 2 10-20
DC Fast Charging 50-70
Source: Alternative Fuel Data Center 2015
The standard J1772 receptacle (right) can receive a charge from AC Level 1 or AC Level
2 equipment. Direct-current (DC) fast charging equipment at 480-volt enables rapid charging at
public stations, and DC fast charging are commercial only, and for safety reasons cannot be
installed at residential buildings. Most EVs may not be equipped for fast charging, and fast
charging varies depending vehicle make. Inductive charging is alternative charging method,
which does not require an electric cord, and offers an equivalent of a Level 2 charging capacity
(Alternative Fuel Data Center, 2015) (see Figure 5). For this study, DC fast charging stations and
Level 2 charging stations are considered for site suitability analysis. Both DC fast charging
stations and Level 2 charging stations are commercial grade which can be installed at public
places. In short, DC fast charging is considered fast charge and Level 2 is regular slow charge.
Among DC fast charging stations, there are three main primary type of quick charges
CHAdeMO, SAE Combo, and Tesla Supercharges (Birdman 2014). CHAdeMOis an
abbreviation for “CHArge de Move” or “charge for moving.” CHAdeMO cords are compatible
17
with electric vehicles made by Toyota, Nissan and Mitsubishi. As of July 2014, there are more
than 600 CHAdeMO charging stations in the United States, more than 1,000 in Europe, and
nearly 2,000 in Japan (Birdman 2014). SAE Combined Charging System, or “Combo Cord”
were invented by American and German automotive engineers, and the electric vehicles made by
General Motor and BMWs are compatible SAE combo cord. All three types of DC fast charging
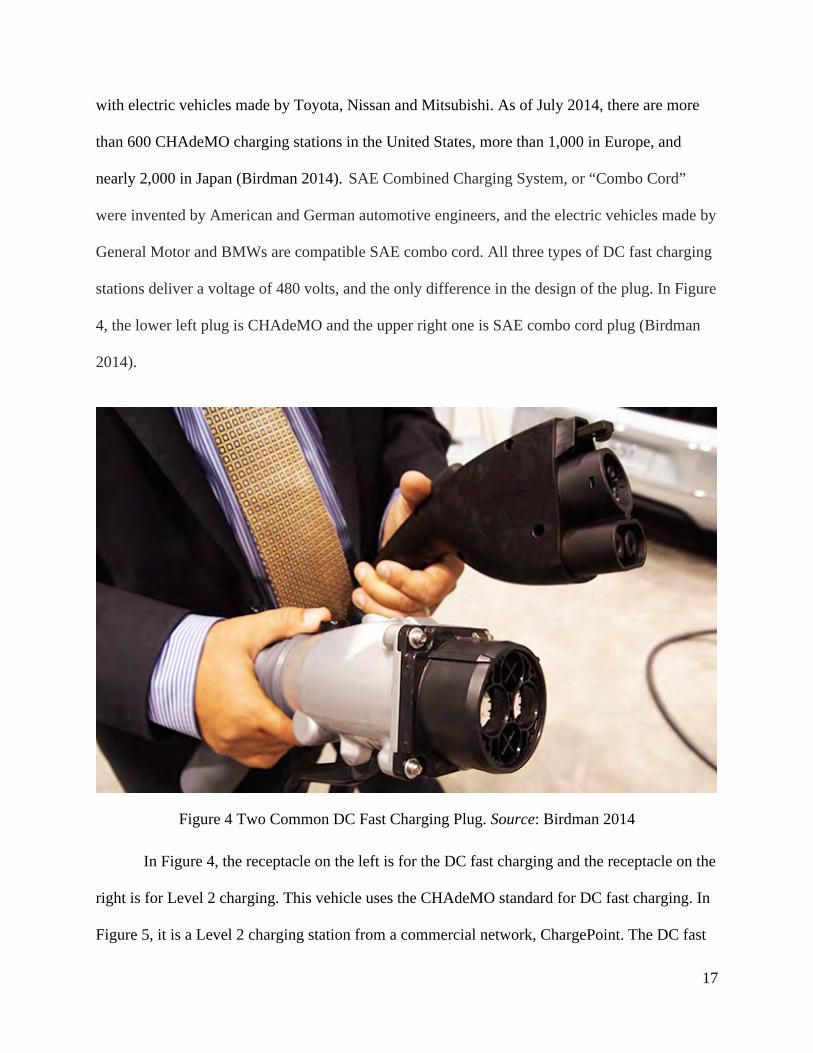
stations deliver a voltage of 480 volts, and the only difference in the design of the plug. In Figure
4, the lower left plug is CHAdeMO and the upper right one is SAE combo cord plug (Birdman
2014).
Figure 4 Two Common DC Fast Charging Plug. Source: Birdman 2014
In Figure 4, the receptacle on the left is for the DC fast charging and the receptacle on the
right is for Level 2 charging. This vehicle uses the CHAdeMO standard for DC fast charging. In
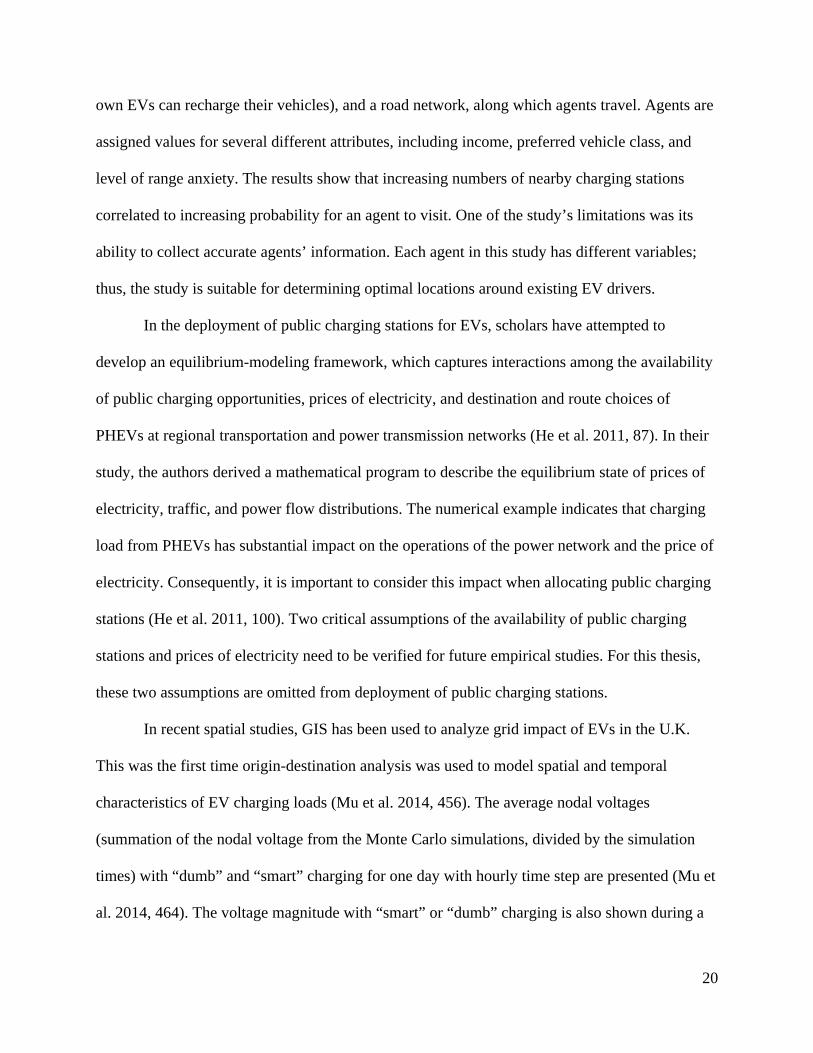
Figure 5, it is a Level 2 charging station from a commercial network, ChargePoint. The DC fast
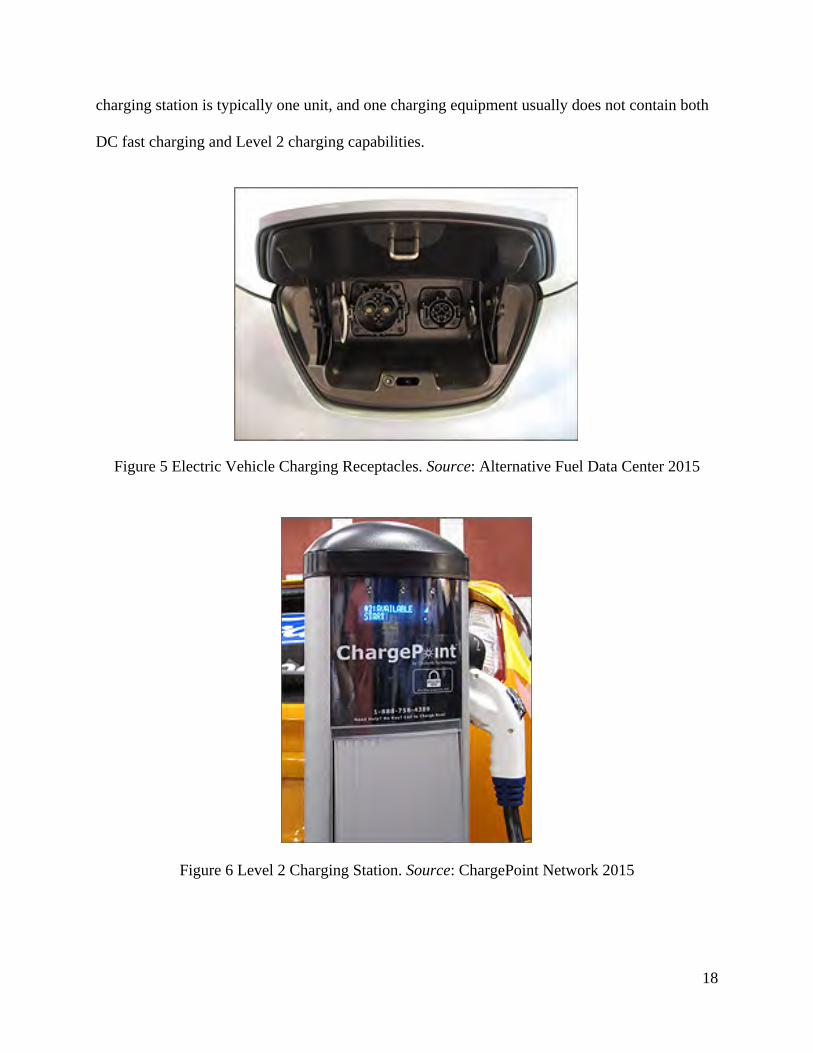
18
charging station is typically one unit, and one charging equipment usually does not contain both
DC fast charging and Level 2 charging capabilities.
Figure 5 Electric Vehicle Charging Receptacles. Source: Alternative Fuel Data Center 2015
Figure 6 Level 2 Charging Station. Source: ChargePoint Network 2015

19
2.4 Related Studies in GIS
In Lisbon, Portugal, an EV charging plan examined daytime and nighttime demands. The
study area was in the center of the Avenidas Novas. The researchers collected demographic
information in this area, such as population older than 17 years of age, the percent of people who
completed high school (p_H), residents working in the tertiary sector (p_r), proportion of
residents younger than 20 years of age (p_20), and the proportion of residents older than 64 years
of age (p_64). The regression equation was obtained after stepwise elimination of the variables,
and the intercept was forced to be 0; the final equation for nighttime was v_h =3.90× p_H −1.18×
p_r +3.41× p_20 +3.28× p_64 (Frade et al. 2011, 93). This regression equation captures the
relationship between the number of cars per household and household characteristics. Through
two math equations, the number of EVS needed to refuel during nighttime in census block was
estimated. With centroids of census blocks, possible EV charging station locations were
determined. This study provides accurate estimations of EV charging stations requirements;
however, its limitation is that the number and characteristics of existing EV drivers do not
change over time.
In the Greater Chicago Area, consisting of four surrounding counties, an agent-based
decision support system for electric vehicle charging infrastructure deployment was investigated
in 2011 (Sweda & Klabjan 2011, 1). This paper identifies patterns in residential EV ownership
and driving activities, enabling strategic deployment of new charging infrastructure (Sweda &
Klabjan 2011, 1). Agent-based modeling is a technique for studying interactions among many
autonomous and heterogeneous decision-makers. The agents all exist within an environment that
consists of houses (where the agents live), workplaces (where the agents work), points of
interest, or other destinations where the agents may visit, charging stations (where agents that
20
own EVs can recharge their vehicles), and a road network, along which agents travel. Agents are
assigned values for several different attributes, including income, preferred vehicle class, and
level of range anxiety. The results show that increasing numbers of nearby charging stations
correlated to increasing probability for an agent to visit. One of the study’s limitations was its
ability to collect accurate agents’ information. Each agent in this study has different variables;
thus, the study is suitable for determining optimal locations around existing EV drivers.
In the deployment of public charging stations for EVs, scholars have attempted to
develop an equilibrium-modeling framework, which captures interactions among the availability
of public charging opportunities, prices of electricity, and destination and route choices of
PHEVs at regional transportation and power transmission networks (He et al. 2011, 87). In their
study, the authors derived a mathematical program to describe the equilibrium state of prices of
electricity, traffic, and power flow distributions. The numerical example indicates that charging
load from PHEVs has substantial impact on the operations of the power network and the price of
electricity. Consequently, it is important to consider this impact when allocating public charging
stations (He et al. 2011, 100). Two critical assumptions of the availability of public charging
stations and prices of electricity need to be verified for future empirical studies. For this thesis,
these two assumptions are omitted from deployment of public charging stations.
In recent spatial studies, GIS has been used to analyze grid impact of EVs in the U.K.
This was the first time origin-destination analysis was used to model spatial and temporal
characteristics of EV charging loads (Mu et al. 2014, 456). The average nodal voltages
(summation of the nodal voltage from the Monte Carlo simulations, divided by the simulation
times) with “dumb” and “smart” charging for one day with hourly time step are presented (Mu et
al. 2014, 464). The voltage magnitude with “smart” or “dumb” charging is also shown during a
21
different time of a day. This model enables power planning and evaluation by identifying the
most critical network components, providing more accurate results with spatial-temporal
characteristics. The authors also suggest that this model is more suitable for the EV impact
analysis of urban electricity networks.
For planners in urban cities, the location selection process can be complicated when
implementing a power network. In 2011, a similar proposal was conducted on determining EV
charging stations in the city of Tianjin, China. The authors proposed a method of locating and
sizing the charging stations for electric vehicles based on grid partition. This method aimed at
minimizing users’ loss on the way to the charging station, zoning the planning area with a grid
partition method, and then selecting the best locations for each partition with a genetic algorithm
based on considerations of traffic density and charging station capacity constraints (Ge et al.
2011, 2726). The authors evenly divided an area into rectangular nodes, and assigned a partition
number within several nodes; thus, each partition was weighted by the traffic and charging
resources required in the surrounding area. By calculating the energy needed and supplied within
a partition, a charging station installation locations could be determined within a single node.
This practical method could be assessed repeatedly as inputs changed. The selection process used
in this study is based on grid. To repeat this successful model, it is designed with known traffic
information and the number of electric vehicles. It is also more viable within an area with high
density of electric vehicles because the chances of using charging stations are higher.
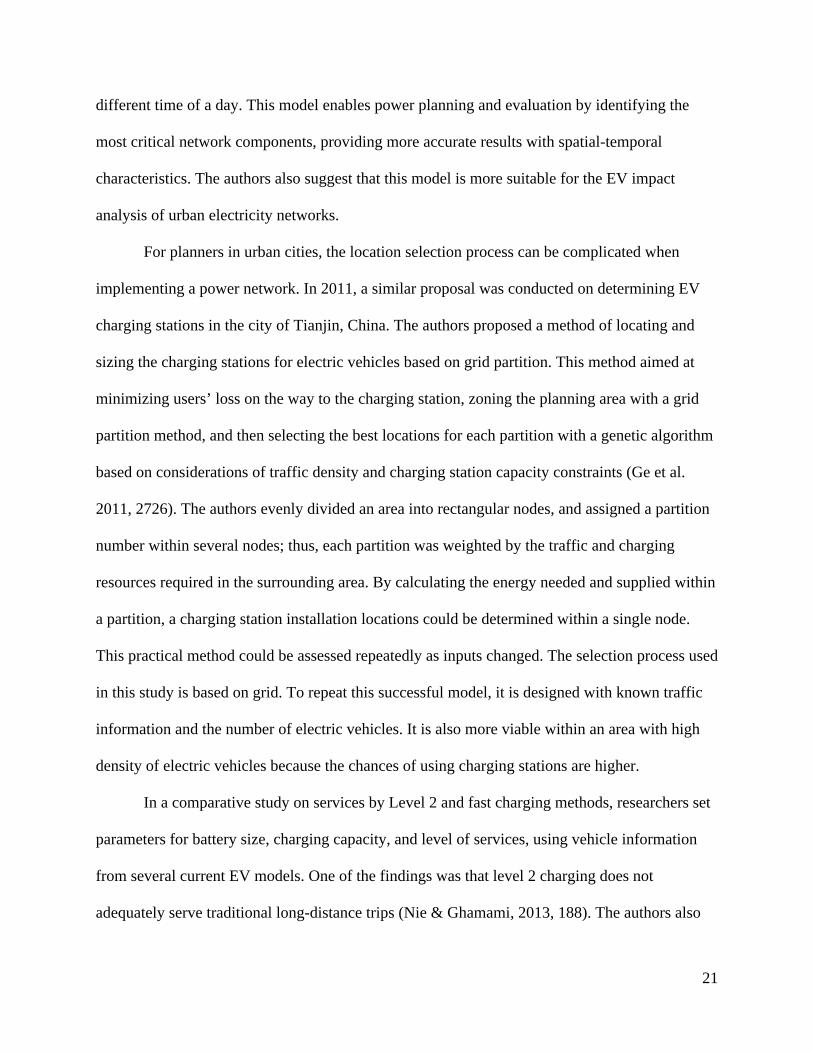
In a comparative study on services by Level 2 and fast charging methods, researchers set
parameters for battery size, charging capacity, and level of services, using vehicle information
from several current EV models. One of the findings was that level 2 charging does not
adequately serve traditional long-distance trips (Nie & Ghamami, 2013, 188). The authors also

22
demonstrated that in order to achieve a reasonable level of service, the fast charging method is
needed to minimize the social cost (Nie & Ghamami, 2013, 189). For this thesis study, the
specific types of charging stations will be considered.
As other researchers have pointed, the benefits of mapping public-owned parcels is
modest, as there are relatively fewer of them as they represent a diverse set of destination types
like recreational areas, workplaces, etc.(DeShazo 2012, 98). These destination types must
consider the potential EV users and how to maximize the usage as pubic benefits. In the study of
San Joaquin Valley Air Pollution Control District (2014), the data obtained from National
Household Travel Survey was set as a basis with which to understand where drivers tend park for
longer periods. These locations may attract drivers to travel “medium-to-long” distances from
their home, as they tend park at these locations for at least one hour, generally providing enough
time to sufficiently charge their vehicles with a Level 2 Charger (San Joaquin Valley Air
Pollution Control District 2014, 13-14). In Table 2, these are considered to be optimal locations
for public charging according to the National Household Travel Survey.
Table 2 Best Locations for Public Access Charging
Airport Amusement park Aquarium Art gallery
Camp ground Casino Dentist’s office Department store
Doctor’s office Grocery store Supermarket Hospital
Library Local government office Lodging Movie theater
Museum Park Restaurant Shopping mall
Stadium Train Station University Zoo Source: San Joaquin Valley Air Pollution Control District 2014
The types of locations listed in Table 2 can be used to meet the goal of this thesis, which
is to identify where to install EV charging stations at public facilities in Los Angeles County. In
23
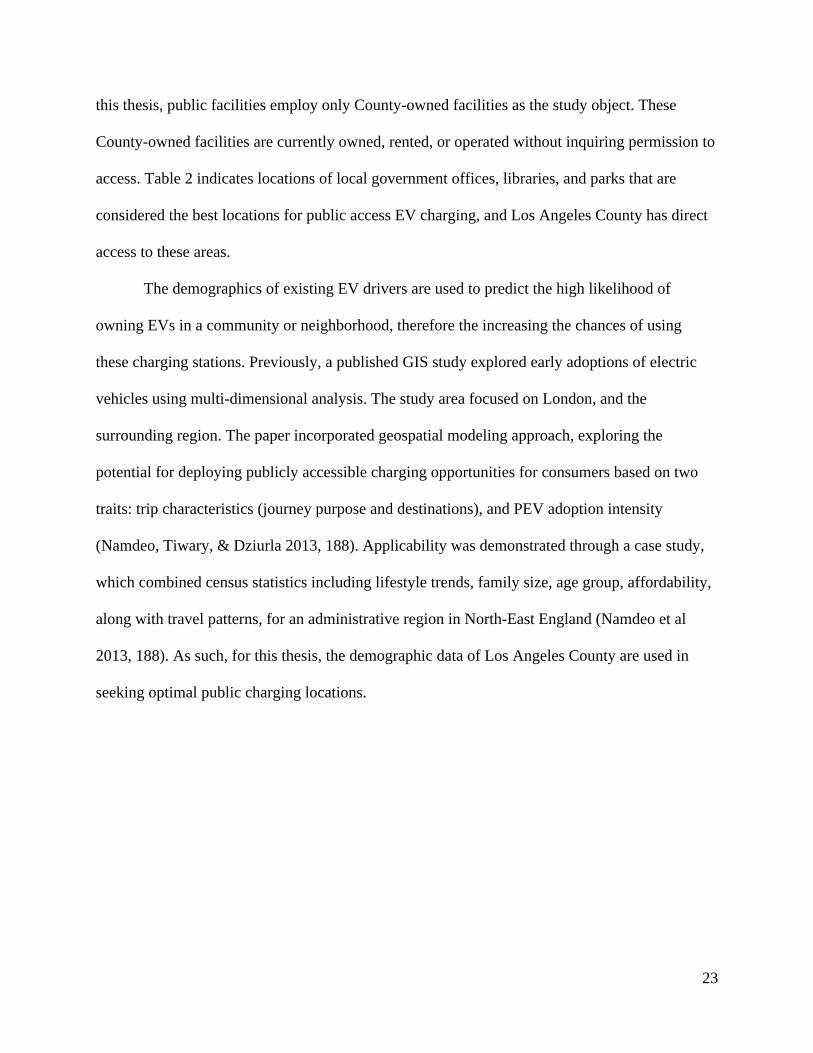
this thesis, public facilities employ only County-owned facilities as the study object. These
County-owned facilities are currently owned, rented, or operated without inquiring permission to
access. Table 2 indicates locations of local government offices, libraries, and parks that are
considered the best locations for public access EV charging, and Los Angeles County has direct
access to these areas.
The demographics of existing EV drivers are used to predict the high likelihood of
owning EVs in a community or neighborhood, therefore the increasing the chances of using
these charging stations. Previously, a published GIS study explored early adoptions of electric
vehicles using multi-dimensional analysis. The study area focused on London, and the
surrounding region. The paper incorporated geospatial modeling approach, exploring the
potential for deploying publicly accessible charging opportunities for consumers based on two
traits: trip characteristics (journey purpose and destinations), and PEV adoption intensity
(Namdeo, Tiwary, & Dziurla 2013, 188). Applicability was demonstrated through a case study,
which combined census statistics including lifestyle trends, family size, age group, affordability,
along with travel patterns, for an administrative region in North-East England (Namdeo et al
2013, 188). As such, for this thesis, the demographic data of Los Angeles County are used in
seeking optimal public charging locations.

24
Chapter 3 Methodology
The objective of this study is to determine suitable installation locations in Los Angeles County
for electric vehicle charging stations. In reference to EV charging location suggested by the San
Joaquin Valley Air Pollution Control District (2014), optimal EV locations selected for the
purpose of this thesis include public libraries, public parks and government offices. In the
methodology section, a site suitability analysis is divided into three sub-sections: DC Fast
Charging Infrastructure, Public Access Charging and Workplace Charging. The data sources of
public libraries, parks, and government offices are first reviewed; then, this chapter provides an
overview of the specific data needed, the variables for the analysis, the charging type that will be
installed, and information about how locations were selected through ArcGIS.
In order to determine potential EV charging stations using GIS, this study applies four
general steps. The main methodology is as follows:
1) Obtain public facilities and their shapefiles
2) Define the key variables for each sub-section and choose the data needed
3) Perform ArcGIS analysis to seek locations that fulfill criteria from each sub-section
4) List the results in maps and tables
Each data shapefile can be tracked from a current, accurate, and reliable source, and
contains addresses of each location, including the name, general service or category, as well as a
site description. In short, DC fast charging equipment can be viewed as providing a “fast”
charge. Level 2 charging equipment installed at public access and workplace sections can be
viewed as providing a “slow” charge.
25
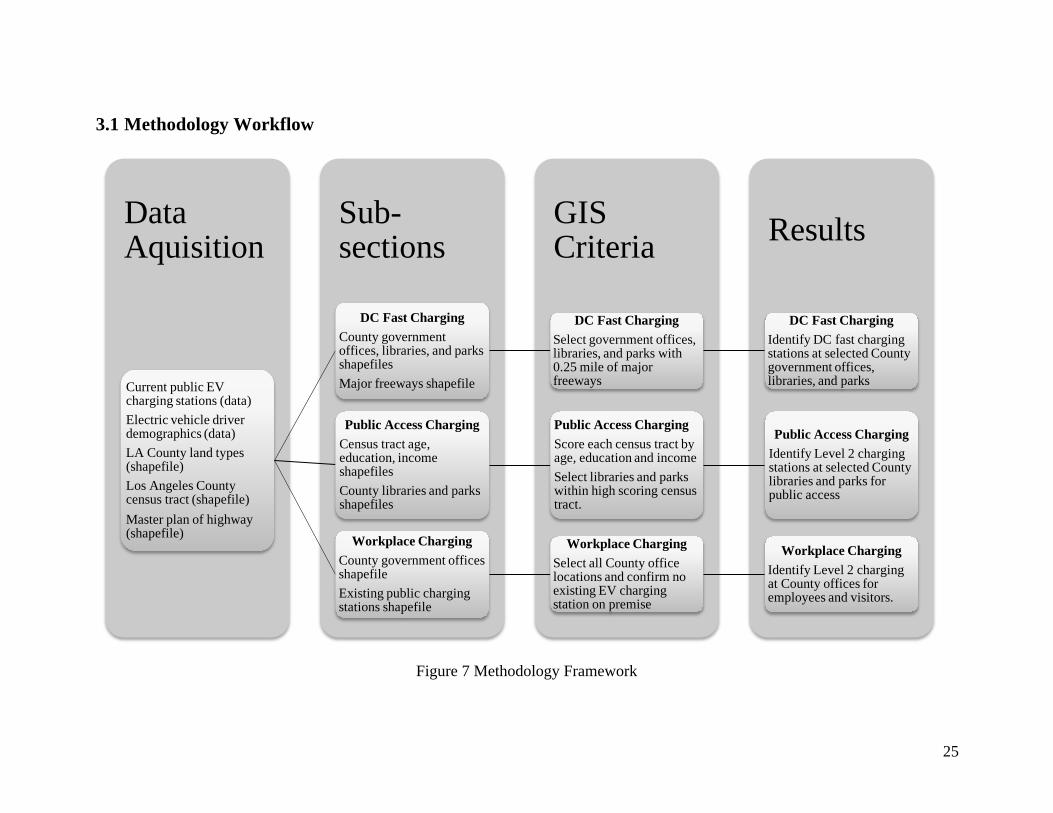
3.1 Methodology Workflow
Figure 7 Methodology Framework
ResultsGIS Criteria
Sub-sections
Data Aquisition
Current public EV charging stations (data)Electric vehicle driver demographics (data)LA County land types (shapefile)Los Angeles County census tract (shapefile)Master plan of highway(shapefile)
DC Fast ChargingCounty governmentoffices, libraries, and parks shapefilesMajor freeways shapefile
DC Fast ChargingSelect government offices, libraries, and parks with 0.25 mile of major freeways
DC Fast ChargingIdentify DC fast charging stations at selected County government offices, libraries, and parks
Public Access ChargingCensus tract age, education, income shapefilesCounty libraries and parks shapefiles
Public Access ChargingScore each census tract by age, education and incomeSelect libraries and parks within high scoring census tract.
Public Access ChargingIdentify Level 2 charging stations at selected County libraries and parks for public access
Workplace ChargingCounty government offices shapefileExisting public charging stations shapefile
Workplace ChargingSelect all County office locations and confirm no existing EV charging station on premise
Workplace ChargingIdentify Level 2 charging at County offices for employees and visitors.
26
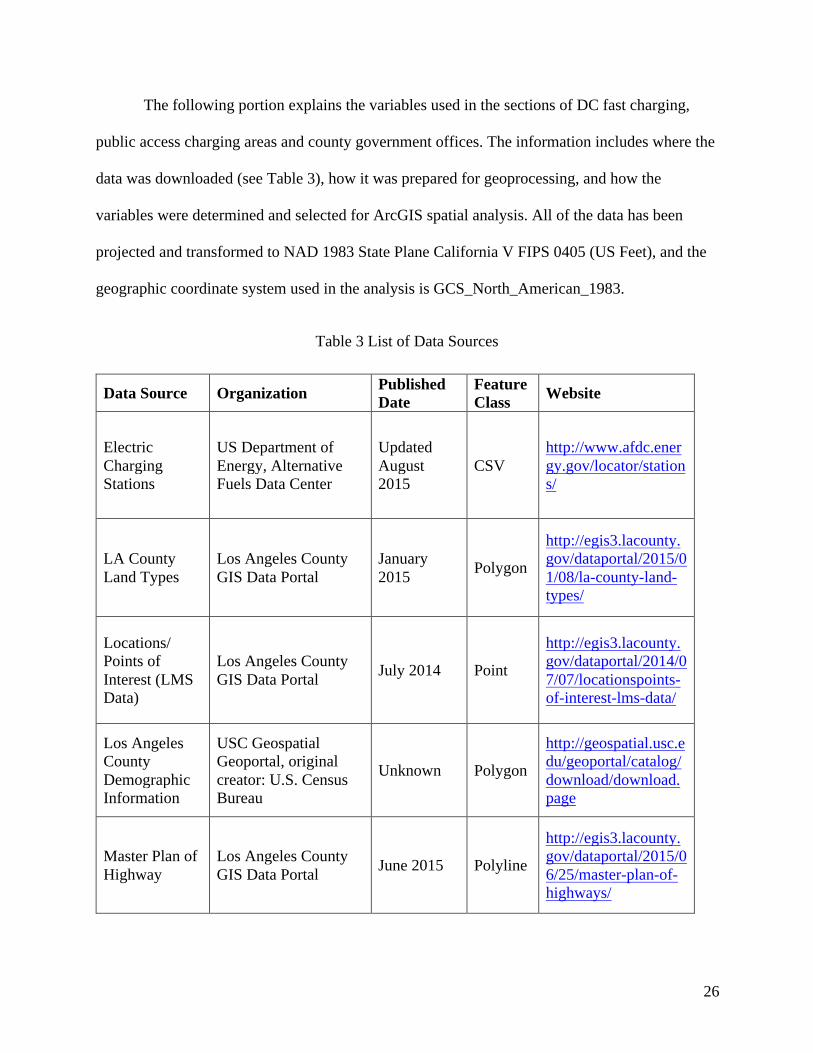
The following portion explains the variables used in the sections of DC fast charging,
public access charging areas and county government offices. The information includes where the
data was downloaded (see Table 3), how it was prepared for geoprocessing, and how the
variables were determined and selected for ArcGIS spatial analysis. All of the data has been
projected and transformed to NAD 1983 State Plane California V FIPS 0405 (US Feet), and the
geographic coordinate system used in the analysis is GCS_North_American_1983.
Table 3 List of Data Sources
Data Source Organization Published Date
Feature Class Website
Electric Charging Stations
US Department of Energy, Alternative Fuels Data Center
Updated August 2015
CSV http://www.afdc.energy.gov/locator/stations/
LA County Land Types
Los Angeles County GIS Data Portal
January 2015 Polygon
http://egis3.lacounty.gov/dataportal/2015/01/08/la-county-land-types/
Locations/ Points of Interest (LMS Data)
Los Angeles County GIS Data Portal July 2014 Point
http://egis3.lacounty.gov/dataportal/2014/07/07/locationspoints-of-interest-lms-data/
Los Angeles County Demographic Information
USC Geospatial Geoportal, original creator: U.S. Census Bureau
Unknown Polygon
http://geospatial.usc.edu/geoportal/catalog/download/download.page
Master Plan of Highway
Los Angeles County GIS Data Portal June 2015 Polyline
http://egis3.lacounty.gov/dataportal/2015/06/25/master-plan-of-highways/
27
3.2 DC Fast Charging
For DC fast charging and public access charging, public facilities must be easily
accessible, support adequate electrical power and have existing parking availability (San Joaquin
Valley Air Pollution Control District 2014, 6). In Los Angeles County, county-owned libraries
and parks are located throughout the county. Parks are managed and maintained by the Los
Angeles County Department of Parks and Recreation because the County of Los Angeles has
direct access, and the right to add public equipment to these parks.
3.2.1. Freeways
The original name of the highway shapefile downloaded from the Los Angeles County
GIS portal website is “Master Plan of Highways.” The shapefile consists of polyline feature data,
and contains all existing and proposed road information of expressways, limited secondary
highways, parkways, major highways, secondary highways, and freeways. For this study,
existing freeways were created as a new feature data. By selecting “select by attributes” in
ArcGIS, a SQL query of “‘HCODE_NAME’ = ‘FREEWAY – EXISTING’” was performed. In
the County of Sonoma, the parameters for searching DC fast charging stations were ½ mile to the
highway exit (County of Sonoma 2014, 5).
3.2.2. County Government Offices
County offices are extracted from the point shapefile of Locations/Points, and the original
file was downloaded from the Los Angele County GIS Data Portal official website. The original
zip file name is LMS_Data_20140707; and the file was last updated in July 2014, and the
original file contains 63,650 points of various locations. County government offices are selected
by choosing cat 1 of “Government” and cat 2 of “County Offices, the selected attributes with
28
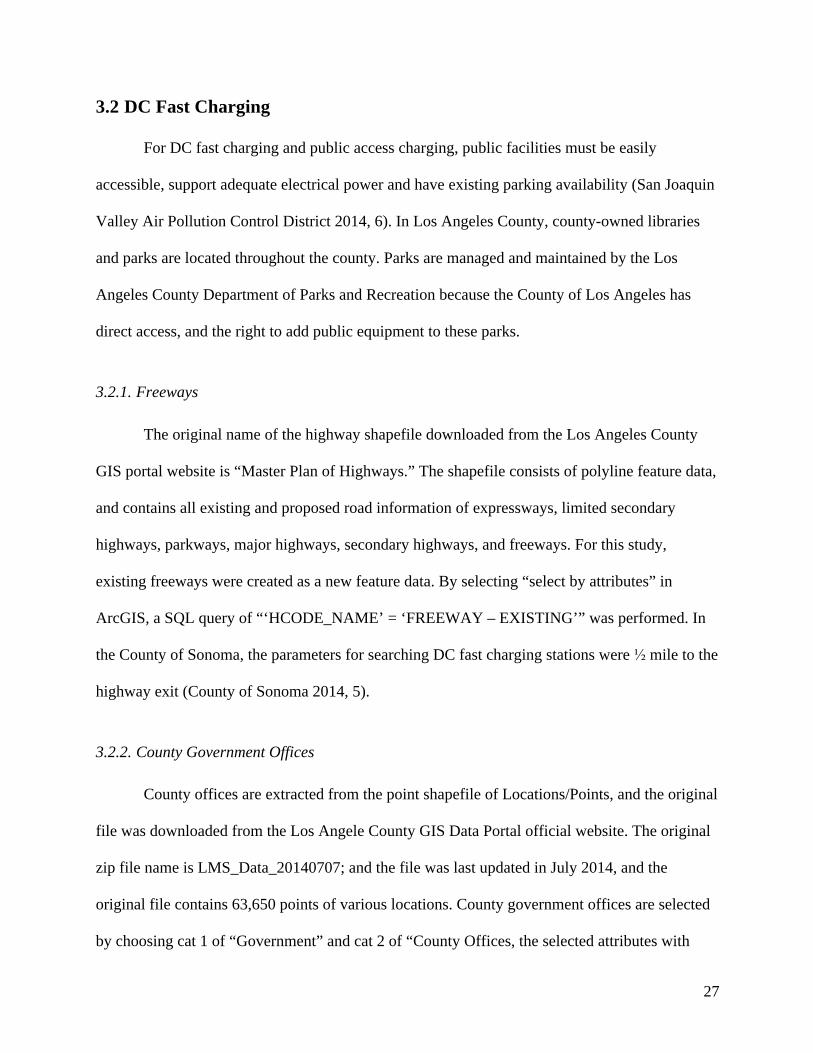
duplicate locations are processed with data the management tool: “Delete Identical in the column
of “post_id”. The result contains 42 locations of County offices.
Figure 8: Select County Government Offices to Install DC Fast Charging Stations in Modelbuilder
3.2.3. Public Libraries in Los Angeles County
In Los Angeles County, over 1,000 libraries are accessible to the general public, and are
operated by local city governments, schools, universities, and the county. This study used public
libraries maintained by Los Angeles County. The County Public Library serves 51 of 88 cities
and unincorporated areas through 84 community-based library outlets, including four
bookmobiles (County of Los Angeles 2015).
The public facilities in Los Angeles County consist of a point shapefile that was
downloaded from the official website of the Los Angeles County GIS Data Portal. The original
zip file name was LMS_Data_20140707, and the file was last updated in July 2014. The original
file contains 63,650 points of various locations. County libraries were selected by choosing cat 1
of “municipal,” cat 2 of “libraries,” and the description of “The County of Los Angeles” The
selected attributes with duplicate locations were processed with the data management tool:
29
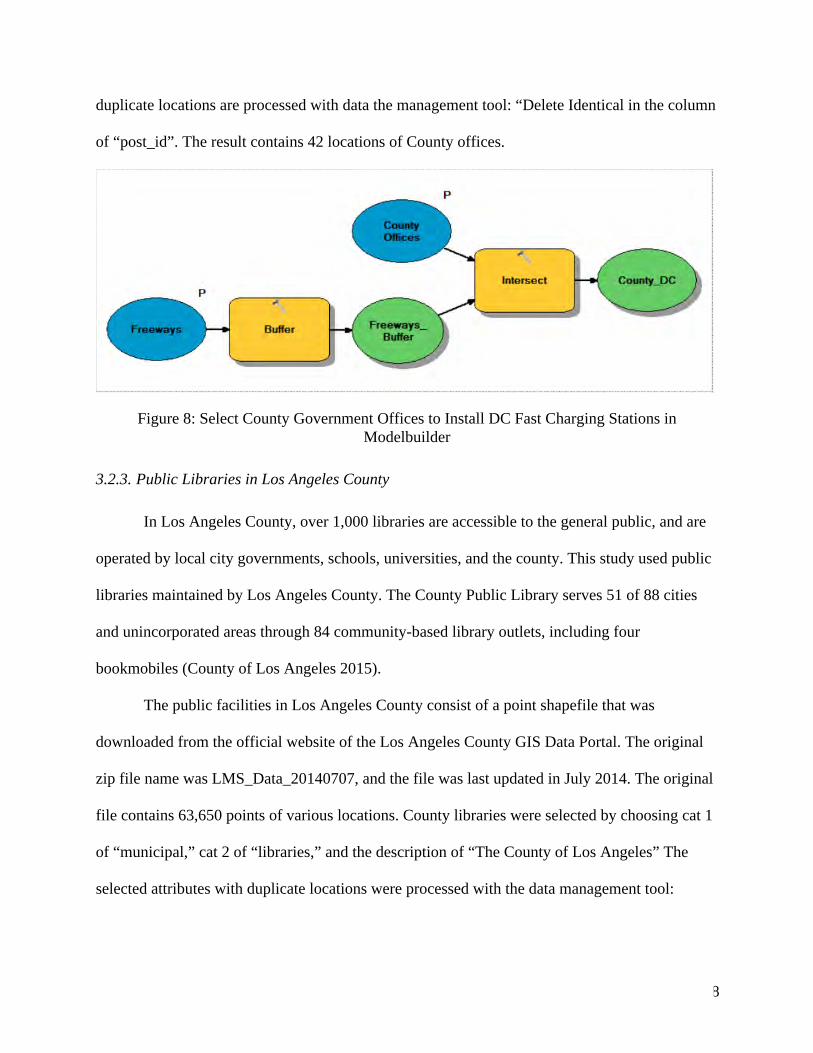
“Delete Identical in the column of “post_id.” Eighty-nine county libraries are within 0.25 miles
of existing freeways, as described in Figure 9.
Figure 9 Select County Libraries to Install DC Fast Charging Stations in Modelbuilder
3.2.4. Public Parks in Los Angeles County
The Los Angeles County parks and recreation system includes 63,000 acres of parks,
lakes, trails, natural areas, and gardens. The County of Los Angeles’ Department of Parks and
Recreation maintains 169 sites for residents. These areas include parks, playgrounds, swimming
pools, gardens, golf courses, sanctuaries, staging areas etc. The swimming pools are amenities of
these parks. The County’s gardens are Descanso Gardens, Los Angeles County Arboretum and
Botanic Garden, South Coast Botanic Garden, and Virginia Robinson Gardens (County of Los
Angeles 2015).
There are 1,277 points in the shapefile of parks and recreation areas. The full list of 169
park and recreation locations is found in Appendix C. For this study, only public parks
maintained by the Los Angeles County Department of Parks and Recreation were selected and
used for analysis from the following data. The land types file in Los Angeles County is a
polygon shapefile, and was downloaded from the official Los Angeles County GIS Data Portal
website.
30
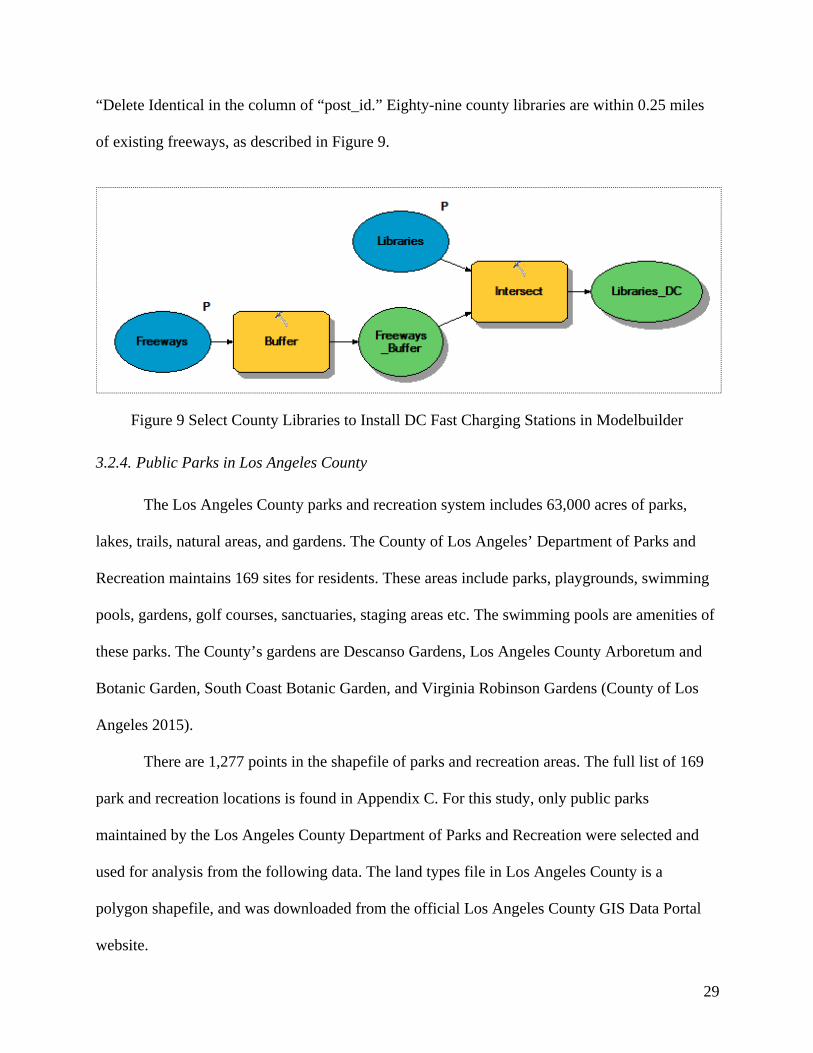
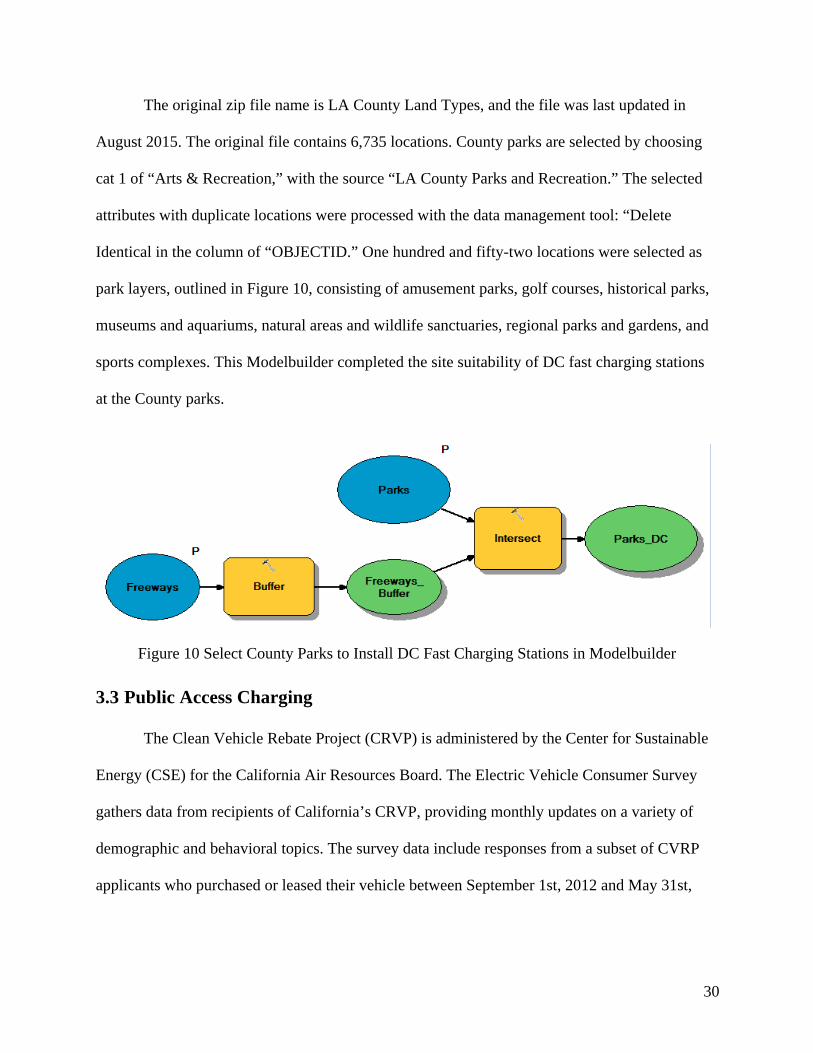
The original zip file name is LA County Land Types, and the file was last updated in
August 2015. The original file contains 6,735 locations. County parks are selected by choosing
cat 1 of “Arts & Recreation,” with the source “LA County Parks and Recreation.” The selected
attributes with duplicate locations were processed with the data management tool: “Delete
Identical in the column of “OBJECTID.” One hundred and fifty-two locations were selected as
park layers, outlined in Figure 10, consisting of amusement parks, golf courses, historical parks,
museums and aquariums, natural areas and wildlife sanctuaries, regional parks and gardens, and
sports complexes. This Modelbuilder completed the site suitability of DC fast charging stations
at the County parks.
Figure 10 Select County Parks to Install DC Fast Charging Stations in Modelbuilder
3.3 Public Access Charging
The Clean Vehicle Rebate Project (CRVP) is administered by the Center for Sustainable
Energy (CSE) for the California Air Resources Board. The Electric Vehicle Consumer Survey
gathers data from recipients of California’s CRVP, providing monthly updates on a variety of
demographic and behavioral topics. The survey data include responses from a subset of CVRP
applicants who purchased or leased their vehicle between September 1st, 2012 and May 31st,

31
2015. Surveys were collected between October 25th, 2013 and June 23rd, 2015. Los Angeles
County and the surrounding counties are included in the South Coast region.
In the South Coast region, 29% of the survey respondents are in the age range of 45 to 54,
25% of respondents are 35-44 years old, and 22% are 55-64 years old. After adding the top three
age groups, 76% of survey respondents are between 35 and 64 years old, and are middle-aged
(Center for Sustainable Energy 2015). In terms of gender, 75% of respondents are male. Thirty-
seven percent of survey respondents have attained bachelor’s degrees as their highest level of
education, while 44% report their highest level of education as graduate degrees. A small portion
of survey respondents report having completed some college work or a high school diploma, and
the majority (81%) of survey respondents possess either a bachelor’s degree or other advanced
degrees (Center for Sustainable Energy 2015). EV driver respondents with annual household
incomes of $100,000 or more represent 74% of the sample, and 26% of EV drivers report
incomes of $99,999 or less. Seventy-nine percent of respondents reside in detached houses
(Center for Sustainable Energy 2015).
The corresponding demographic information of EV drivers generally represent middle-
aged people with bachelor’s degrees or higher, and with high household incomes. Los Angeles
County census tract data were downloaded from USC Geoportal, and three variables – age,
education, and household income – are used in the analysis, and the original census data of 2010
was created by U.S. Census Bureau.
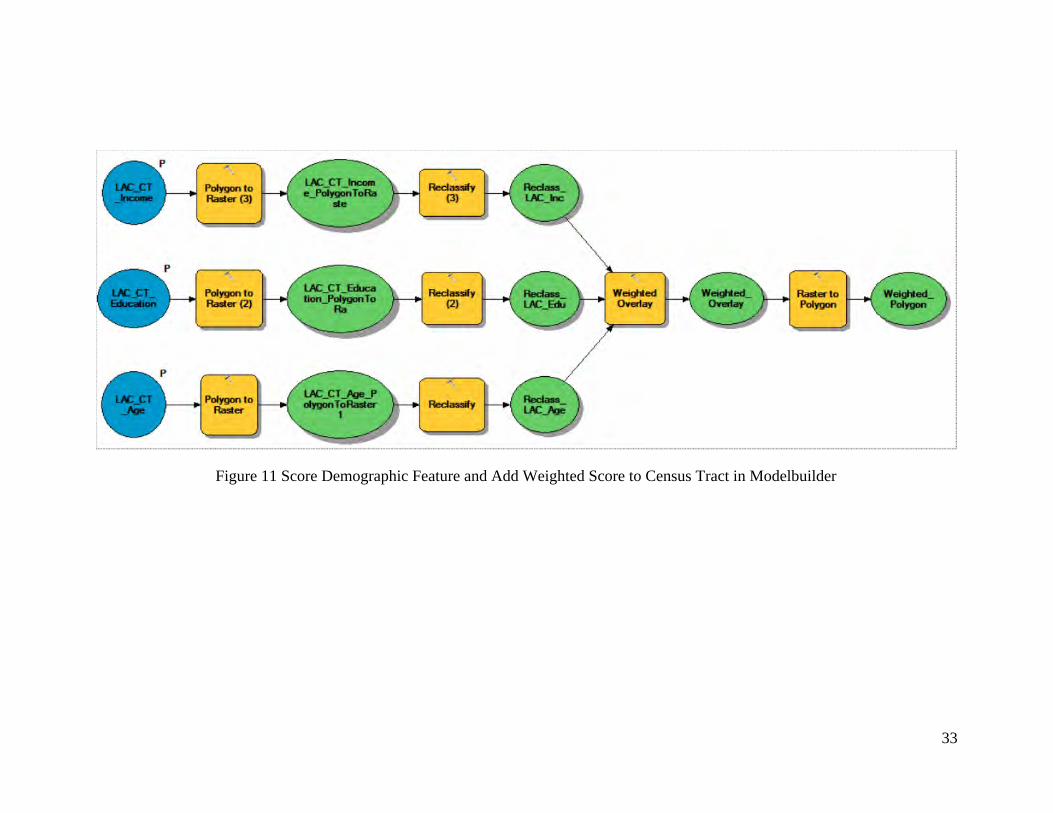
In Figure 11, three census tract shapefiles of age, education, and income are first
converted to raster files by “Polygon to Raster” in ArcGIS. Then, raster files are reclassified, as
outlined in Figures 8, 9, and 10. These reclassified files are combined through the “Weighted
Overlay” tool, and then converted back to a weighted polygon file. This file has the highest

32
weighted score of 5 to each census tract in Los Angeles County, and 5 is the highest possible
score.
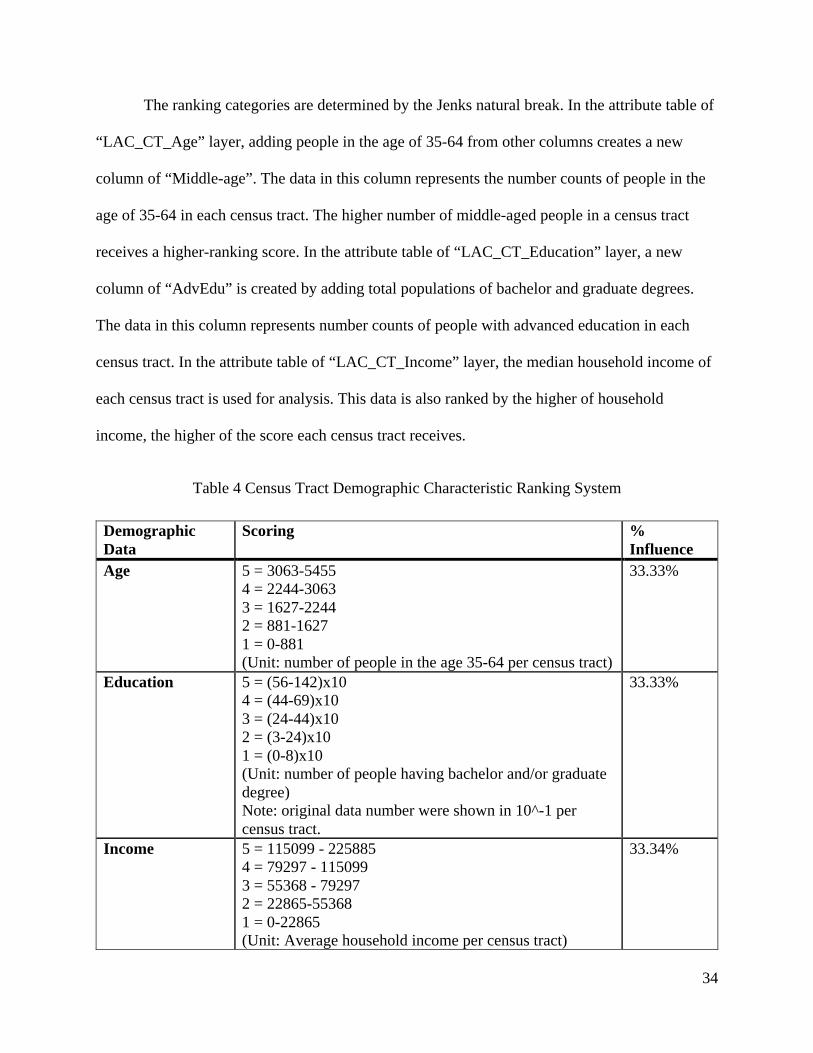
The ranking categories are determined by the Jenks natural break. In the attribute table of
the “LAC_CT_Age” layer, adding people in the age range of 35-64 from other columns creates a
new column of “Middle-age.” The data in this column represents number counts of people in the
age range of 35-64 in each census tract. The higher number of middle-aged people in a census
tract receives a higher-ranking score. In the attribute table of the “LAC_CT_Education” layer,
adding total populations of bachelor and graduate degrees creates a new column of “AdvEdu.”
The data in this column represents number counts of people with advanced education levels in
each census tract. In the attribute table of the “LAC_CT_Income” layer, the median household
income of each census tract is used for analysis. This data is also ranked: the higher the
household income, the higher the score each census tract receives.
33
Figure 11 Score Demographic Feature and Add Weighted Score to Census Tract in Modelbuilder
34
The ranking categories are determined by the Jenks natural break. In the attribute table of
“LAC_CT_Age” layer, adding people in the age of 35-64 from other columns creates a new
column of “Middle-age”. The data in this column represents the number counts of people in the
age of 35-64 in each census tract. The higher number of middle-aged people in a census tract
receives a higher-ranking score. In the attribute table of “LAC_CT_Education” layer, a new
column of “AdvEdu” is created by adding total populations of bachelor and graduate degrees.
The data in this column represents number counts of people with advanced education in each
census tract. In the attribute table of “LAC_CT_Income” layer, the median household income of
each census tract is used for analysis. This data is also ranked by the higher of household
income, the higher of the score each census tract receives.
Table 4 Census Tract Demographic Characteristic Ranking System
Demographic Data
Scoring % Influence
Age
5 = 3063-5455 4 = 2244-3063 3 = 1627-2244 2 = 881-1627 1 = 0-881 (Unit: number of people in the age 35-64 per census tract)
33.33%
Education
5 = (56-142)x10 4 = (44-69)x10 3 = (24-44)x10 2 = (3-24)x10 1 = (0-8)x10 (Unit: number of people having bachelor and/or graduate degree) Note: original data number were shown in 10^-1 per census tract.
33.33%
Income 5 = 115099 - 225885 4 = 79297 - 115099 3 = 55368 - 79297 2 = 22865-55368 1 = 0-22865 (Unit: Average household income per census tract)
33.34%
35
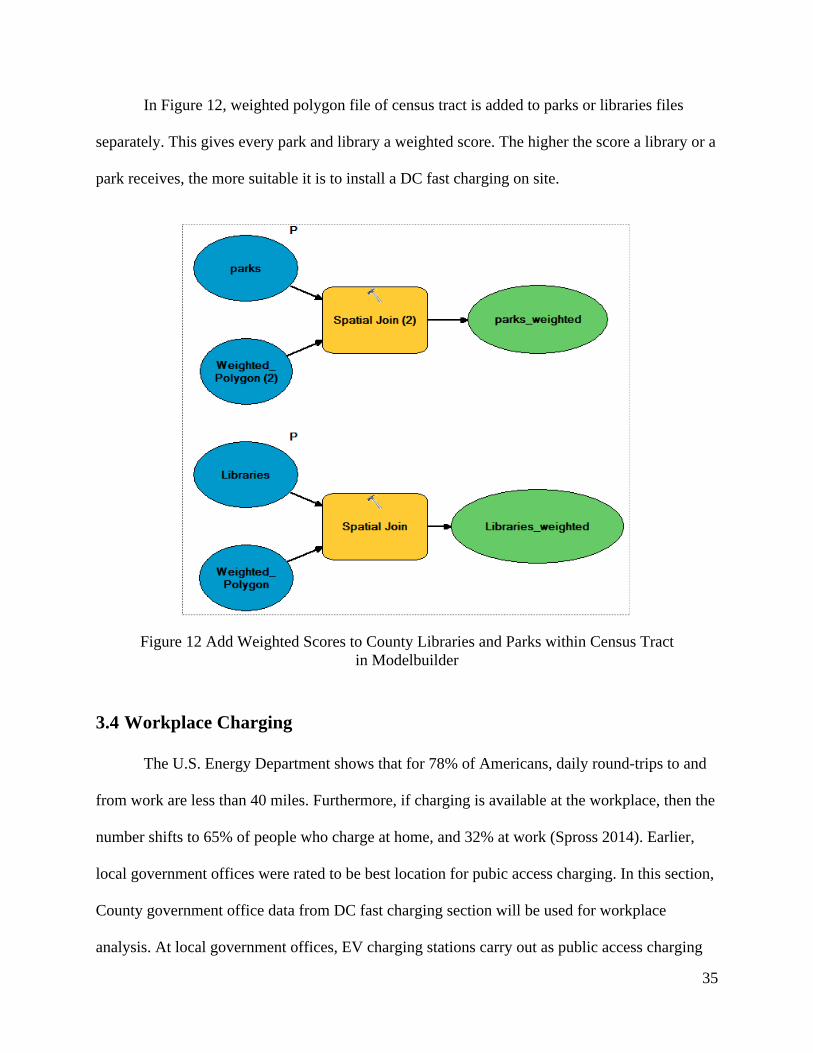
In Figure 12, weighted polygon file of census tract is added to parks or libraries files
separately. This gives every park and library a weighted score. The higher the score a library or a
park receives, the more suitable it is to install a DC fast charging on site.
Figure 12 Add Weighted Scores to County Libraries and Parks within Census Tract in Modelbuilder
3.4 Workplace Charging
The U.S. Energy Department shows that for 78% of Americans, daily round-trips to and
from work are less than 40 miles. Furthermore, if charging is available at the workplace, then the
number shifts to 65% of people who charge at home, and 32% at work (Spross 2014). Earlier,
local government offices were rated to be best location for pubic access charging. In this section,
County government office data from DC fast charging section will be used for workplace
analysis. At local government offices, EV charging stations carry out as public access charging

36
points for the general public so as workplace charging points for the employees. Therefore, in
this sub-section, all County offices are considered suitable unless there are existing EV charging
stations. To locate County offices without a charging station, the two data layers of County
offices and existing public EV charging stations were examined by “Intersect” tool by location in
ArcGIS. No Modelbuilder was required to in this sub-section. The overlapping mechanism
between these two data were further examined by checking the name and addresses of a location.
3.4.1. Existing Public EV Charging Stations Data
The addresses of current or existing EV charging stations can be geocoded into an
ArcGIS shapefile for use in this analysis. Existing public EV charging stations data were
downloaded from the Alternative Fuels Data Center official website. The Alternative Fuels Data
Center (AFDC) is a resource of the U.S. Department of Energy’s Clean Cities program. The
AFDC can provide current and existing public charging stations, including a subcategory for
electric vehicles. Current public EV charging stations can be charging networks, government, or
privately owned.
The original file format from ADFC was CSV, with 11,059 EV charging locations, and
can be opened with Microsoft Excel. It contained records for all electric vehicle-charging
stations in the U.S. Before importing the file to ArcGIS, it was sorted and narrowed down to
charging stations in California. The file includes: general name, addresses with zip code, phone
numbers, hours of operation, number of charging outlets, associated network, longitude/latitude,
and types of charging (level 2 or fast charging). Addresses were geocoded on ArcGIS by
longitude and latitude. By intercepting with the Los Angeles County boundary polygon, the
charging stations within county boundaries were transferred to a new dataset. The final number
of charging stations used in this study was 393.

37
Chapter 4 Results
This chapter describes the results of the site suitability analysis conducted in the previous
chapter, and how the final results were filtered by the initial goals and parameters in the County
of Los Angeles. In addition to existing publicly accessible charging stations at Los Angeles
County facilities, more EV charging stations should be installed for the public and County
employees. In particular, this chapter delineates the type and location of charging stations that
should be installed at public facilities in Los Angeles County. The first goal of this thesis project
is to place DC fast charging stations at County government offices, public libraries, and public
parks near major freeways. The second goal is to place Level 2 charging stations at public
libraries and parks according to EV drivers’ demographic features. The third goal is to place
Level 2 charging stations at all County government offices where there are no existing EV
charging stations.
4.1 DC Fast Charging Results
DC Fast Charging allows an 80% charge in as little as 30 minutes, and it serves the needs
of interregional and intraregional travel while also supplying “safety net” charging opportunities
for all types of drivers throughout a large geographic region (San Joaquin Valley Air Pollution
Control District. 2014, 5). The type of electric vehicle. As explained in Chapter 2, DC fast
charging stations direct current (DC) at 480-volt enables rapid charging at public stations, and
the driving range for per hour charging is 50-70 miles, as outlined in Table 4. In this analysis, the
locations for installing DC fast charging stations are based on the Los Angeles County
government offices, public libraries, and public parks. Optimal locations of DC fast charging
stations must be within one half mile of a highway. Also, the freeways crossing Los Angeles

38
County are used for analysis. There are total of 27 existing and major freeways used in this
study.
In identifying optimal locations for installing DC fast charging stations, ArcGIS
Modelbuilder was used and created two sequences for government offices, public libraries, and
public parks. These two Modelbuilders run separately and each generate its own result.
Modelbuilder is an application to create, edit, and manage models. Models are workflows that
string together sequences of geoprocessing tools, feeding the output of one tool into another tool
as inputs. Executing a series of buffer and intersecting tools automatically generates the output or
resulted features. The geoprocessing tools used were common in ArcGIS applications and they
were executed and used to build a Modelbuilder.
In this sub-section, the freeway layer was first used to create a freeway buffer layer by
applying ½ mile “buffer” tool. Then, the input layers of libraries and parks were geoprocessed by
“intersecting” with the freeway buffer layer, and the resulted layers were County government
office, libraries and parks which were within ½ mile buffer of the freeways. Even seeking
optimal charging locations for County government offices, libraries and parks were executed in
two separate Modelbuilders, the results of these optimal DC fast charging locations were shown
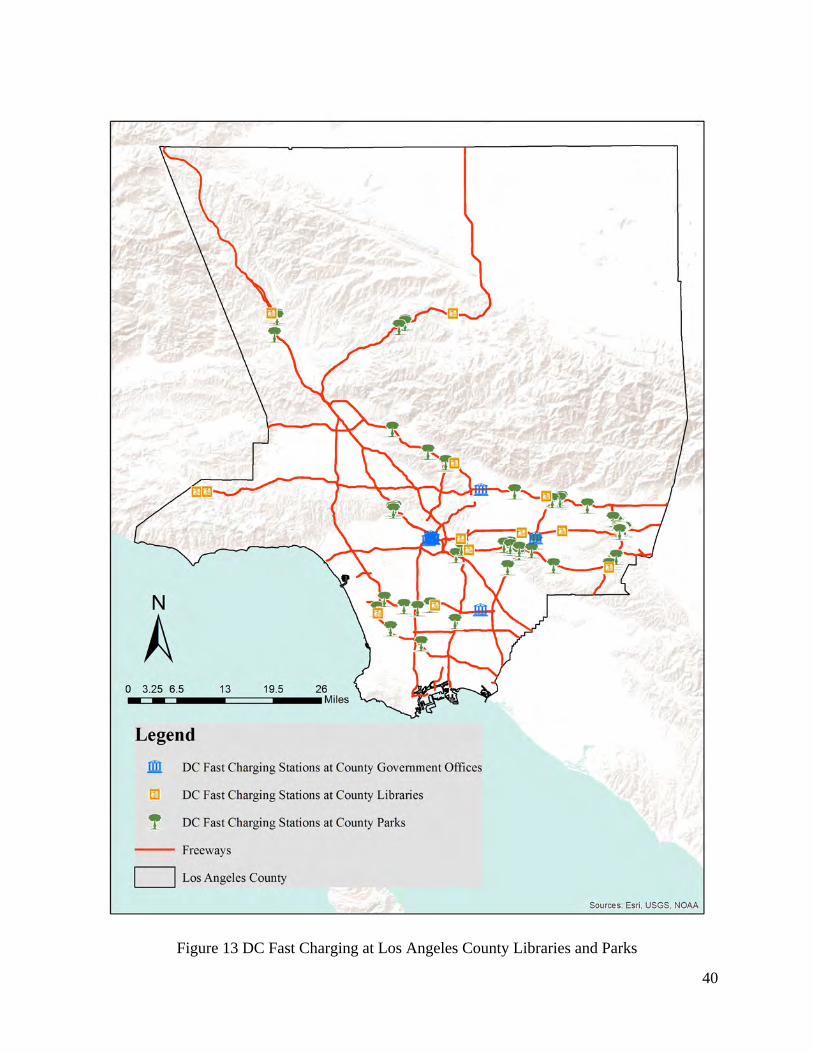
in the same map (see in Figure 13). Red lines represent major freeways, and the names of County
public parks and libraries selected as locations for DC fast charging stations; in the legend three
different symbols were used to represent County government offices, public libraries and parks.
The blue house symbols are the County government offices, the orange symbols are the County
public libraries, and the green trees are the County public parks.
For County government offices, there are 18 offices identified as optimal locations to
install DC fast charging stations, and the name of the government offices are listed in Table 5.

39
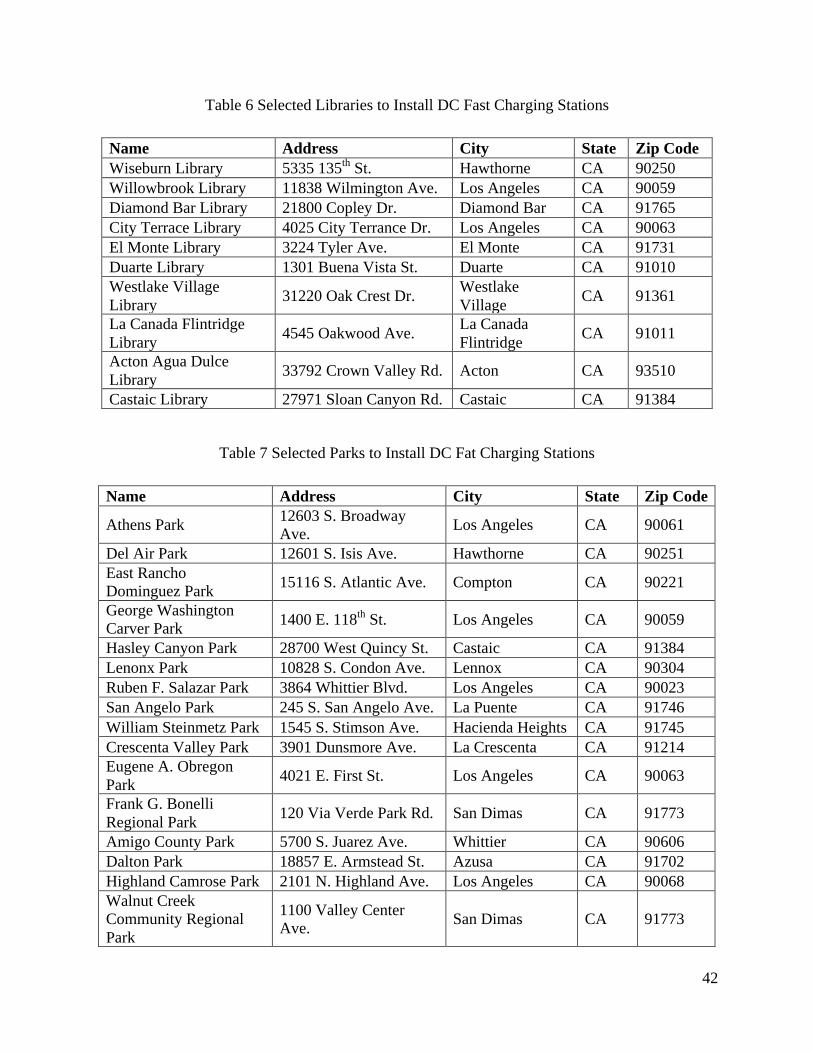
For County libraries, there are 10 libraries identified as optimal locations to install DC fast
charging stations, and the results are described in Table 6, excluding one bookmobile location.
For County parks, the initial results from ArcGIS included parks, golf courses, and other
facilities that are maintained by Los Angeles County Department of Parks and Recreation. For
this thesis research, only County parks are considered as locations to install DC fast charging
stations, and in Table 7, the final results are selected by location name with “park.”
40
Figure 13 DC Fast Charging at Los Angeles County Libraries and Parks

41
Table 5 Selected Government Offices to Install DC Fast Charging Stations
Name Address City State Zip Code ISD - Service Planning Areas 3 And 4 241 N. Figueroa St. Los Angeles CA 90012
Los Angeles County Department Of Parks And Recreation - Regional Parks
265 Cloverleaf Dr. Baldwin Park CA 90706
Los Angeles County Employees Retirement Services
300 N. Lake Ave. Pasadena CA 91101
Los Angeles County Alternate Public Defender Office 320 W. Temple St. Los Angeles CA 90012
Hall Of Records 320 W. Temple St. Los Angeles CA 90012 Los Angeles County Chief Information Office 350 S. Figueroa St. Los Angeles CA 90071
Civil Service Commission Main Office 500 W. Temple St. Los Angeles CA 90012
Claims: Damage, To Person Or Property, Against The County
500 W. Temple St. Los Angeles CA 90012
Commission For Children & Family Main Office 500 W. Temple St. Los Angeles CA 90012
Commission On Disability Main Office 500 W. Temple St. Los Angeles CA 90012
County Administration 500 W. Temple St. Los Angeles CA 90012 Department of Human Resource 500 W. Temple St. Los Angeles CA 90012
Domestic Violence Council Office 500 W. Temple St. Los Angeles CA 90012
EEC Main Office 500 W. Temple St. Los Angeles CA 90012 Los Angeles County Auditor-Controller Main Office 500 W. Temple St. Los Angeles CA 90012
Los Angeles County Treasurer-Tax Collector Main Office
500 W. Temple St. Los Angeles CA 90012
Uncashed Checks Office 500 W. Temple St. Los Angeles CA 90012 Los Angeles County Probation Department-Administration
9150 E. Imperial Hwy Downey CA 90242
42
Table 6 Selected Libraries to Install DC Fast Charging Stations
Name Address City State Zip Code Wiseburn Library 5335 135th St. Hawthorne CA 90250 Willowbrook Library 11838 Wilmington Ave. Los Angeles CA 90059 Diamond Bar Library 21800 Copley Dr. Diamond Bar CA 91765 City Terrace Library 4025 City Terrance Dr. Los Angeles CA 90063 El Monte Library 3224 Tyler Ave. El Monte CA 91731 Duarte Library 1301 Buena Vista St. Duarte CA 91010 Westlake Village Library 31220 Oak Crest Dr. Westlake
Village CA 91361
La Canada Flintridge Library 4545 Oakwood Ave. La Canada
Flintridge CA 91011
Acton Agua Dulce Library 33792 Crown Valley Rd. Acton CA 93510
Castaic Library 27971 Sloan Canyon Rd. Castaic CA 91384
Table 7 Selected Parks to Install DC Fat Charging Stations
Name Address City State Zip Code
Athens Park 12603 S. Broadway Ave. Los Angeles CA 90061
Del Air Park 12601 S. Isis Ave. Hawthorne CA 90251 East Rancho Dominguez Park 15116 S. Atlantic Ave. Compton CA 90221
George Washington Carver Park 1400 E. 118th St. Los Angeles CA 90059
Hasley Canyon Park 28700 West Quincy St. Castaic CA 91384 Lenonx Park 10828 S. Condon Ave. Lennox CA 90304 Ruben F. Salazar Park 3864 Whittier Blvd. Los Angeles CA 90023 San Angelo Park 245 S. San Angelo Ave. La Puente CA 91746 William Steinmetz Park 1545 S. Stimson Ave. Hacienda Heights CA 91745 Crescenta Valley Park 3901 Dunsmore Ave. La Crescenta CA 91214 Eugene A. Obregon Park 4021 E. First St. Los Angeles CA 90063
Frank G. Bonelli Regional Park 120 Via Verde Park Rd. San Dimas CA 91773
Amigo County Park 5700 S. Juarez Ave. Whittier CA 90606 Dalton Park 18857 E. Armstead St. Azusa CA 91702 Highland Camrose Park 2101 N. Highland Ave. Los Angeles CA 90068 Walnut Creek Community Regional Park
1100 Valley Center Ave. San Dimas CA 91773

43
4.2 Public Access Charging, Level 2
This section details how county libraries and parks were selected to install Level 2
charging stations. Charging time at Level 2 charging stations can be as long as 3-4 hours, where
people typically park longer than the wait time for a DC fast charging station. Again, the data
from National Household Travel Survey suggested the best location for public access charging
including libraries and parks (San Joaquin Valley Air Pollution Control District. 2014, 13). For
this thesis, only county libraries and parks data were studied because Los Angeles County has
direct access to install EV charging stations at these locations where the County of Los Angeles
have direct jurisdiction to modify and to install electric vehicle charging equipment. These public
access charging locations are designed to offer immediate service to the neighboring
communities.
In considering this, the demographic features of electric vehicle drivers were used to
perform a site suitability analysis. Given the survey results from the Clean Vehicle Rebate
Project (CRVP), the majority of the EV drivers are middle-aged, have a bachelor’s degree or
higher, and have relative high household incomes. These features are used as variables with
which to analyze 2010 U.S. Census tract in Los Angeles County. They represent the current EV
owners, and can also be used to predict future EV drivers in an area.
In this section, Modelbuilder tools are created to perform site suitability analysis in
determining optimal locations for Level 2 charging stations at public libraries and parks. To
ensure the successful running of the Modelbuilder, the Modelbuilders used in this study are
created as the first and second part. The resulting layer of the first part is used in the second part
of the Modelbuilder. The first part can also be considered as data preparation for selecting the
demographic features needed in each Los Angeles County census tract. In the second part,
44
weighted census tract data was geoprocessed with public libraries and parks in order to
determine the libraries and parks with high weighted scores. Two Modelbuilder files were
created separately for layers of libraries and parks.
In the first Modelbuilder, the “age” layer was people count who are in the age of 35-64
within a census tract; the “education” layer was also people county who held with bachelor or
graduate degrees within a census tract; and the “income” layer was the average household
income per census tract. In the analysis process, demographic variables of age, education, and
income were scored from 1-5 in the 2010 U.S. Census tract data. Then, the scored variables
equally representing 33.33% influencing factor contributed to a weighted scoring of 1-5. The low
score was 1, and the high score was 5. Each census tract was then labeled with a weighted score
of 1-5. In Figure 13, the weighted polygon from light purple to dark purple represents a census
tract with a weighted score from 1 to 5. Accordingly, the County libraries and parks are scored
depending on where they are located by the census tract, and then selected by the high weighted
score. In Figure 13, one library with a weighted score of 5 is selected, four libraries have
weighted scores of 4, and thirty-three libraries have weighted scores of 3. By excluding
bookmobile services, thirty libraries are selected as locations to install Level 2 Charging stations
for public access charging. The final result is specified in Table 7.

45
Figure 14 Identified Los Angeles County Libraries and Parks to Install Level 2 Charging Stations for Public Access in GIS Application
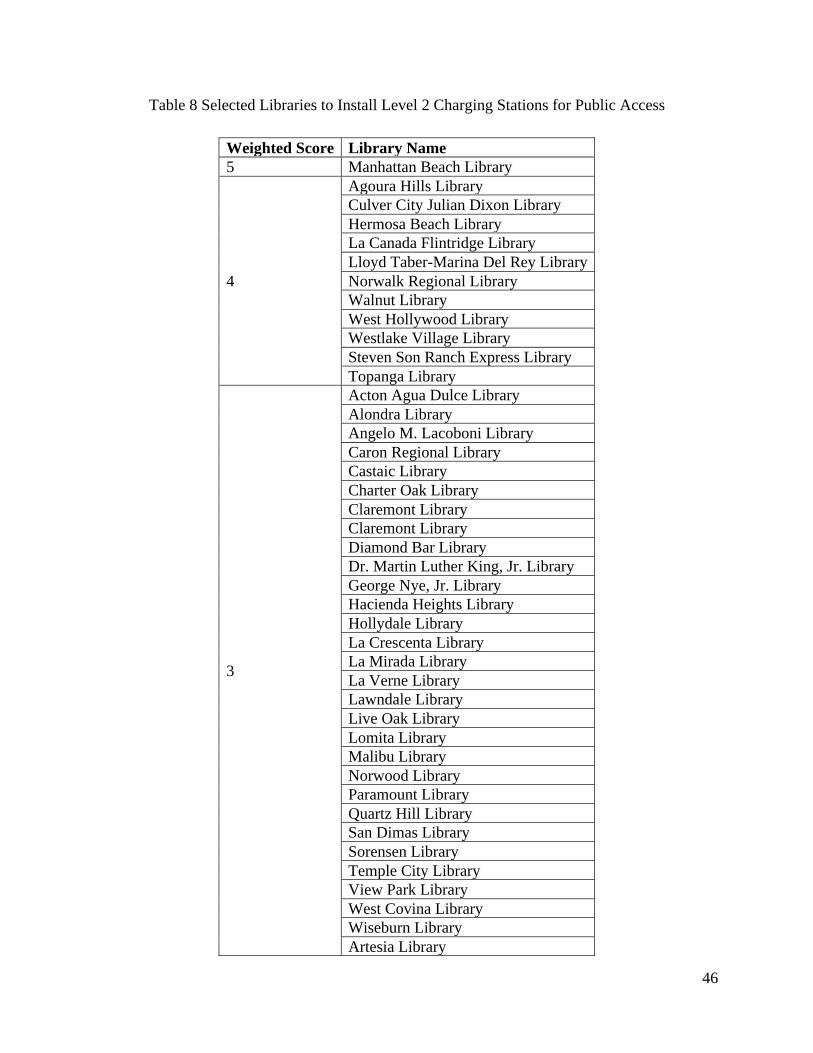
46
Table 8 Selected Libraries to Install Level 2 Charging Stations for Public Access
Weighted Score Library Name 5 Manhattan Beach Library
4
Agoura Hills Library Culver City Julian Dixon Library Hermosa Beach Library La Canada Flintridge Library Lloyd Taber-Marina Del Rey Library Norwalk Regional Library Walnut Library West Hollywood Library Westlake Village Library Steven Son Ranch Express Library Topanga Library
3
Acton Agua Dulce Library Alondra Library Angelo M. Lacoboni Library Caron Regional Library Castaic Library Charter Oak Library Claremont Library Claremont Library Diamond Bar Library Dr. Martin Luther King, Jr. Library George Nye, Jr. Library Hacienda Heights Library Hollydale Library La Crescenta Library La Mirada Library La Verne Library Lawndale Library Live Oak Library Lomita Library Malibu Library Norwood Library Paramount Library Quartz Hill Library San Dimas Library Sorensen Library Temple City Library View Park Library West Covina Library Wiseburn Library Artesia Library
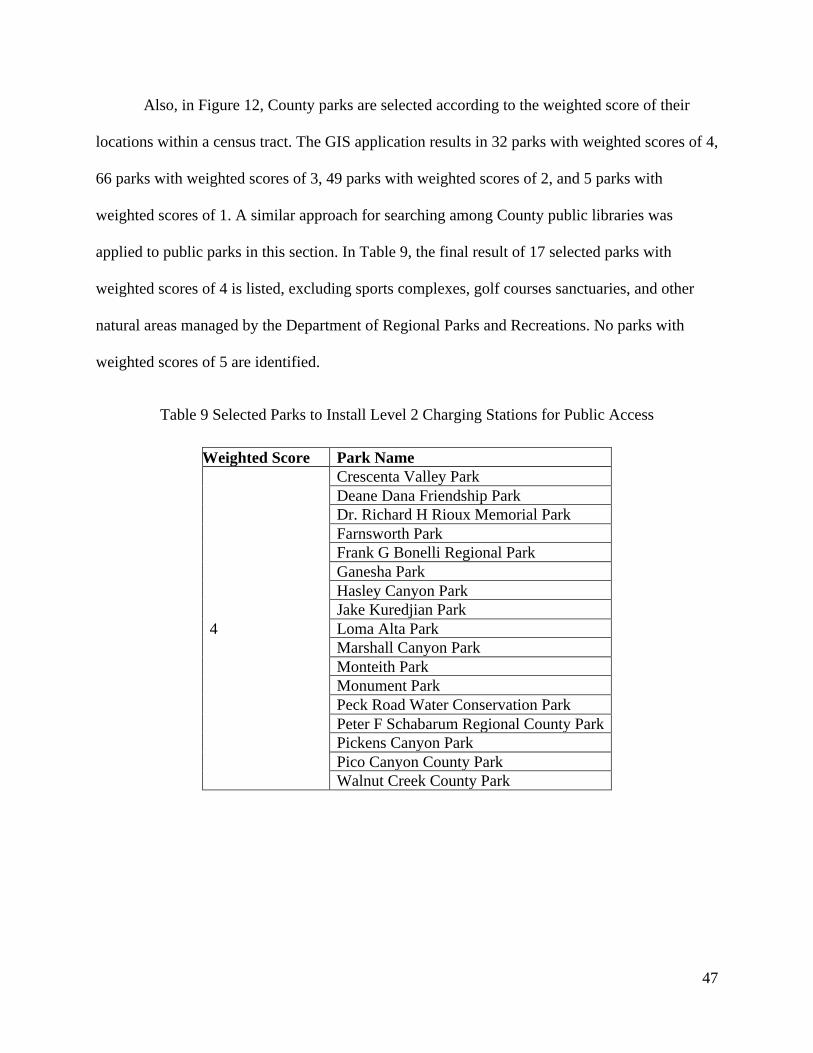
47
Also, in Figure 12, County parks are selected according to the weighted score of their
locations within a census tract. The GIS application results in 32 parks with weighted scores of 4,
66 parks with weighted scores of 3, 49 parks with weighted scores of 2, and 5 parks with
weighted scores of 1. A similar approach for searching among County public libraries was
applied to public parks in this section. In Table 9, the final result of 17 selected parks with
weighted scores of 4 is listed, excluding sports complexes, golf courses sanctuaries, and other
natural areas managed by the Department of Regional Parks and Recreations. No parks with
weighted scores of 5 are identified.
Table 9 Selected Parks to Install Level 2 Charging Stations for Public Access
Weighted Score Park Name
4
Crescenta Valley Park Deane Dana Friendship Park Dr. Richard H Rioux Memorial Park Farnsworth Park Frank G Bonelli Regional Park Ganesha Park Hasley Canyon Park Jake Kuredjian Park Loma Alta Park Marshall Canyon Park Monteith Park Monument Park Peck Road Water Conservation Park Peter F Schabarum Regional County Park Pickens Canyon Park Pico Canyon County Park Walnut Creek County Park

48
4.3 Workplace Charging, Level 2
In this section, the goal is to locate Los Angeles County government offices or locations
to install Level 2 charging stations, without existing EV charging stations on site. According to
the Electric Power Research Institute, the workplace is the second-most frequented location for
charging, following the home. Workplace charging also serves as an alternative for EV drivers
who may not have available residential charging. (San Joaquin Valley Air Pollution Control
District 2014, 39). All County government offices or locations are considered as potential
locations to install Level 2 charging stations. Charging stations at these government offices can
serve both office employees and the visitors upon individual availability. By checking with
existing public charging stations data from U.S. Department of Energy, only one location – LA
County Probation Department, located at 9150 E. Imperial Hwy. Downey, CA 90242 – has
already installed EV charging equipment. Figure 13 indicates the 393 public EV charging
stations, shown in dots as EVLAC.
Table 10 lists the final result of installing Level 2 charging stations at Los Angeles
County government facilities. For the addresses bolded in dark rectangles, they are County
Departmental offices in the same building, sharing different floors or units. These can be
grouped as one location. For this section, the major limitation is the availability of accurate and
current data.
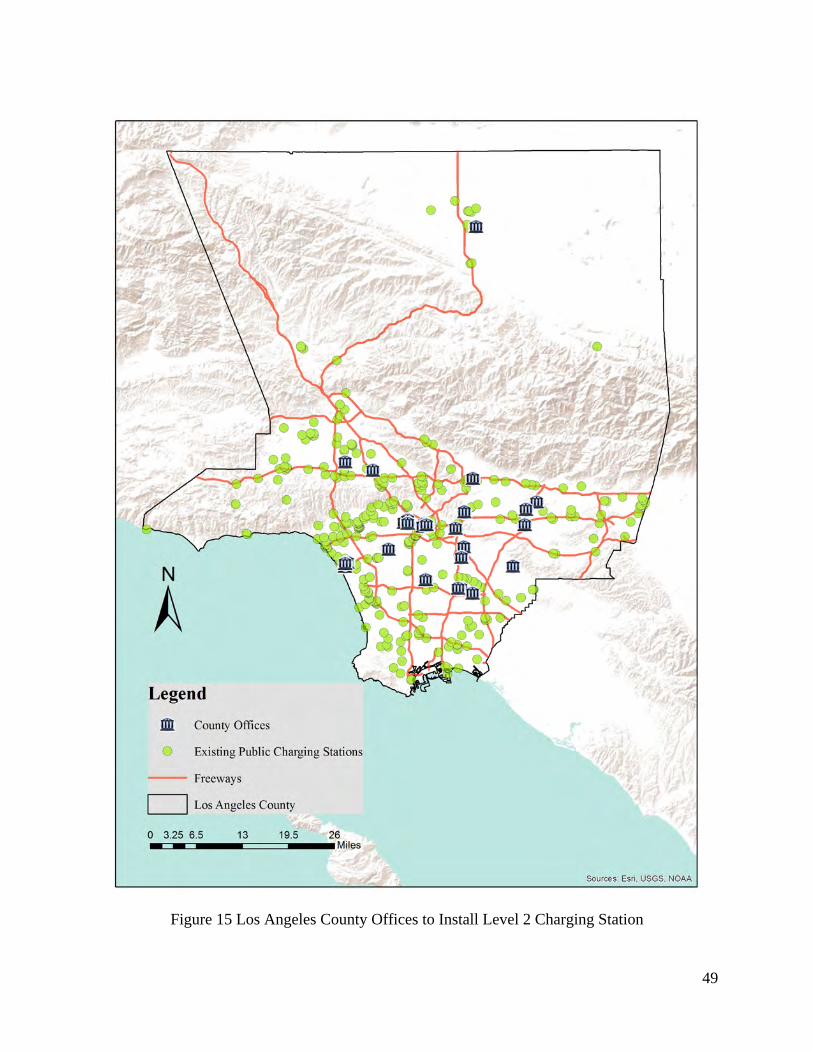
49
Figure 15 Los Angeles County Offices to Install Level 2 Charging Station

50
Table 10 Los Angeles County Offices Table continued to the next page
Name Address City State Zip Code Fraud Hotline 1000 S. Fremont Ave. Alhambra CA 91803 County Procurement & Contracts 1100 N. Eastern Ave. Los Angeles CA 90063 Small Business Assistance Main Office 1100 N. Eastern Ave. Los Angeles CA 90063 Department of Agricultural Commissioner/Weights and Measures South Gate Office 11012 Garfield Ave South Gate CA 90280
Department of Agricultural Commissioner/Weights and Measures Headquarters 12300 Lower Azusa Rd Arcadia CA 91006
Anchorage 47 (Santa Monica Windjammers Yacht Club) 13575 Mindanao Way Marina del Rey CA 90292 Burton Chace Park 13650 Mindanao Way Marina del Rey CA 90292 Los Angeles County Department Of Beaches And Harbors 13837 Fiji Way Marina del Rey CA 90292 Service Planning Areas 5 And 6 1522 E. 102nd St. Los Angeles CA 90002 Service Planning Areas 3 And 4 241 N. Figueroa St. Los Angeles CA 90012 LA County DPW Waterworks - North Maintenance Office 260 E. Avenue K-8 Lancaster CA 93535 Los Angeles County Department Of Parks And Recreation - Regional Parks 265 Cloverleaf Dr. Baldwin Park CA 90706
County Employees Retirement Services 300 N. Lake Ave. Pasadena CA 91101 Human Relations Commission Main Office 3175 W. Sixth St. Los Angeles CA 90020 Alternate Public Defender (APD) Main Office 320 W. Temple St. Los Angeles CA 90012 Hall Of Records 320 W. Temple St. Los Angeles CA 90012 Department of Agricultural Commissioner/Weights and Measures Antelope Valley Office 337 E Ave K10 Lancaster CA 93535
LA County Chief Information Office (CIO) 350 S. Figueroa St. Los Angeles CA 90071 Immunizations 3530 Wilshire Blvd. Los Angeles CA 90010 SA 6 Advisory Committee (SAAC) West Central Mental Health 3751 Stocker St. Los Angeles CA 90008
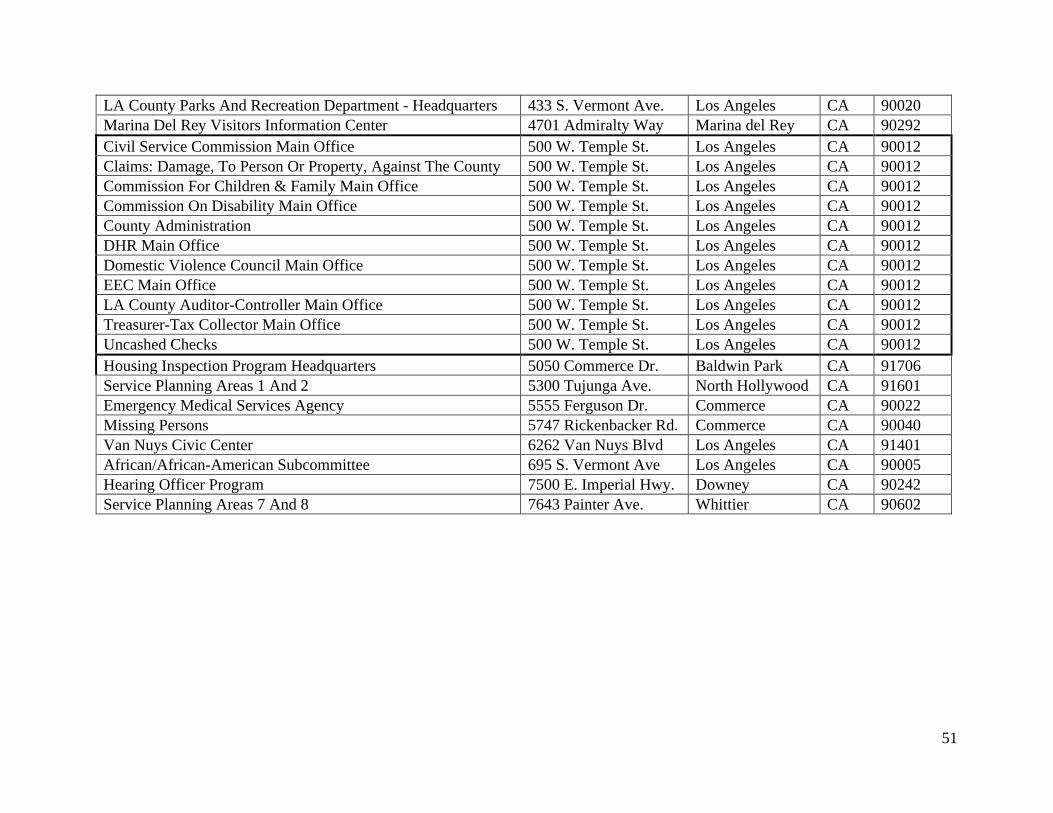
51
LA County Parks And Recreation Department - Headquarters 433 S. Vermont Ave. Los Angeles CA 90020 Marina Del Rey Visitors Information Center 4701 Admiralty Way Marina del Rey CA 90292 Civil Service Commission Main Office 500 W. Temple St. Los Angeles CA 90012 Claims: Damage, To Person Or Property, Against The County 500 W. Temple St. Los Angeles CA 90012 Commission For Children & Family Main Office 500 W. Temple St. Los Angeles CA 90012 Commission On Disability Main Office 500 W. Temple St. Los Angeles CA 90012 County Administration 500 W. Temple St. Los Angeles CA 90012 DHR Main Office 500 W. Temple St. Los Angeles CA 90012 Domestic Violence Council Main Office 500 W. Temple St. Los Angeles CA 90012 EEC Main Office 500 W. Temple St. Los Angeles CA 90012 LA County Auditor-Controller Main Office 500 W. Temple St. Los Angeles CA 90012 Treasurer-Tax Collector Main Office 500 W. Temple St. Los Angeles CA 90012 Uncashed Checks 500 W. Temple St. Los Angeles CA 90012 Housing Inspection Program Headquarters 5050 Commerce Dr. Baldwin Park CA 91706 Service Planning Areas 1 And 2 5300 Tujunga Ave. North Hollywood CA 91601 Emergency Medical Services Agency 5555 Ferguson Dr. Commerce CA 90022 Missing Persons 5747 Rickenbacker Rd. Commerce CA 90040 Van Nuys Civic Center 6262 Van Nuys Blvd Los Angeles CA 91401 African/African-American Subcommittee 695 S. Vermont Ave Los Angeles CA 90005 Hearing Officer Program 7500 E. Imperial Hwy. Downey CA 90242 Service Planning Areas 7 And 8 7643 Painter Ave. Whittier CA 90602

52
Chapter 5 Discussion and Conclusion
The main goal of this thesis research was to identify optimal locations throughout Los Angeles
County to install EV charging stations. This study analyzed the demographic features of existing
electric vehicles drivers, and used these data to predict where current and future EV drivers will
publicly charge their vehicles. While the initial goal was broad, this research clarified where and
what types of EV charging stations should be installed, and also discussed the intended uses of
this equipment, as well as who would benefit from installing charging devices. The remainder of
this chapter discusses key observations of this thesis and the valuable outputs to the decision-
makers in Los Angeles County government; this chapter also presents similarities and contrasts
to recent EV charging infrastructure researches; and the chapter explores possibilities and
suggestions to future research in this field.
5.1 Key Observations
At the onset of this research, the goal was simply to locate where to install more EV
charging stations on Los Angeles County premises, that is, owned or rented properties where the
County has direct jurisdiction to modify or install equipment. The trend of having electric
vehicles is fairly new, and research on installing electric vehicles remains in its infancy. This
research contributes to the literature by conducting a site suitability analysis to scientifically
analyze existing data through ArcGIS tools. The ArcGIS tools used in this thesis were to identify
places by location to major freeways, to add a weighted score by inferring demographic data, and
to filter places with no exiting EV charging stations. Identifying public libraries and parks to
install DC fast charging stations within ½ mile of the major freeways enables people to travel
freely from one end to another end of Los Angeles County, and a network of DC fast charging
stations along the freeways offers ease of commute in an interregional and an intraregional area.

53
Identifying Level 2 charging stations at public libraries and parks was to aim neighborhoods with
designated demographic features, like middle-aged, advanced education, and median or above
household income. Workplace charging was to offer charging opportunities to the employees and
the visitors.
As expected, the results of this research provide recommended locations for public
charging stations in the County of Los Angeles. Installing more charging stations by the County
of Los Angeles would demonstrate how a local government entity follows Federal and State’s
advocacy for green energy and a clean environment. Having more EV charging stations will not
only benefit existing EV drivers, but also will increase the benefits of driving electric vehicles
for the densely-populated Los Angeles County. Currently, there are 31 public charging stations
located in Los Angeles County premises, such as sheriff stations, concert halls, and departmental
offices. These charging stations do not provide enough EV charging stations for the increasing
number of EV drivers.
The ultimate goal of this research is to locate optimal new EV charging stations in order
to maximize usage of these devices in Los Angeles County. This research study demonstrated
how a large entity with multiple geographic locations could help increase the network of people
accessing charging stations. A similar study was completed in another County in California and
together with this study, it can provide valuable data for decision-makers. The selected public
libraries, parks, and government offices offer a forward step in planning where to install charging
stations. At the same time, each location still needs further assessment in order to determine the
number of parking spaces that should be designated as an EV charging space.
54
5.2 Contrasts to Prior Studies
The analysis and results of this research offered several approaches of how to conduct
site suitability analysis in searching optimal EV charging stations. In this thesis, a site suitability
analysis was investigated in three subsections: to locate where to install DC fast charging and
Level 2 charging stations at public place and to locate where to install Level 2 charging stations
at workplaces. These subsections can be viewed and explored individually as well collaborating
them into one expansive method. The various approaches researched in this thesis involved
where and how Los Angeles County may better support installing EV charging stations at the
municipal level where a large government has multiple departmental offices and branches. This
study also offers Los Angeles County solutions where to install more EV charging stations and
depicts actual locations via applicable GIS tools, whereas the current County charging stations
are sparkly distributed at occasional Los Angeles County government offices. This also improves
from previous analysis by Balmin et al (2012) and DeShazo et al (2012) that considers two types
of commercial charging stations.
In contrasts to the two studies conducted by UCLA Luskin School Balmin et al (2012)
and DeShazo et al (2012), this thesis first examined different types of DC fast charging stations
and suggested where to install them in Los Angeles County. In DeShazo et al (2012), the authors
reviewed the needs of EV charging infrastructure, travel patterns of EV drivers, challenges of
creating charging opportunities at residences, workplaces, and retail centers, and the soft and
hard costs of charging equipment installation. They suggested to install more charging stations at
workplaces and publicly accessible sites for people lived in places without immediate home
charging options. They also listed the number of employees and compared the percentage of
people live in single family units and multi-unit dwellings. Even the DeShazo (2012) study

55
pointed out the benefits of having EV charging stations at public-sector sites, their study didn’t
research or suggest where to install charging stations at either workplace or publicly accessible
locations.
The Balmin et al (2012) study in Los Angeles area rather discussed barriers existed for
building EV charging stations in multi-unit dwellings (MUD), but it did not perform a site
suitability analysis on choosing a single EV charging site. In their study, the charging equipment
considered for MUDs were either Level 1 and Level 2 charging, because DC fast charging
require much larger power supply and installation cost and they are less likely to widespread in
residential building (Balmin et al 2012, 10). The goal of Balmin et al (2012) study was to
identify barriers, evaluate existing policies supporting home EV charging installations, and
recommend policy options to address challenges to charging in MUDs in the city of Los Angeles
(Balmin et al 2012, 1). The two EV studies by Balmin et al (2012) and DeShazo et al (2012)
described out the foundation of learning about the new technology of electric vehicles and
recognizing the barriers against how to widespread the charging possibilities at the time when
they conducted the study. Their main concerns were how to install more charging stations at
home, and this thesis focused on public facilities like libraries, parks and workplaces. As times
progress and the need of public charging station increases, this thesis research offers a solution to
a current public interest.
5.3 Future Research
This research successfully clarified two types of commercial EV charging equipment and
identified optimal locations throughout the County of Los Angeles at public libraries, public
parks and county government offices. While this study determined optimal site locations by
considering demographic features of current EV drivers, such as age, education, and income,
56
future research should incorporate other categories of public facilities owned by the County of
Los Angeles. The goal of a site suitability analysis is to identify ideal locations publicly
accessible equipment in order to increase its public use. The more variables a study can
integrate, the more the results can be inclusive and can better represent the initial goals.
In the first and second sections explained earlier in the Methodology in Chapter 3, the
public access charging stations selected only included Los Angeles County-owned public
libraries and parks. These two locations were selected based on the findings from the National
Household Travel Survey used in the San Joaquin Valley study. The San Joaquin Valley study
listed a total of 20 optimal locations to install public accessing charging stations (San Joaquin
Valley Air Pollution Control District 2014). They were chosen based on the average length of
time a vehicle would park. Thus, future studies should perhaps also incorporate foot traffic at a
given location, and the average time people leave their vehicles parked.
The goal of the third section of this research was to advocate for installing EV charging
stations for Los Angeles County government employees, as well as visitors. For future study, the
geographic context of workplace analysis can be enhanced by including other government
facilities managed by the County of Los Angeles, like beaches and harbors, gardens and
arboretum, museums and music center, and etc. At these locations, even the number of
employees are scarce comparing with to the employees in regular Departmental buildings, the
neighbors and visitors in the area can inevitably take advantage of the electric vehicle charging
equipment.
Depending on locations and requirements of government facilities, parking lots are
divided into two sections: one is gated for employees only, and other is for both employees and
visitors. If such detailed information is available as GIS data, government locations could more
57
specifically consider where to install charging stations in gated parking lots. As suggested,
visitor traffic volume of a government office can also provide information as to whether a
particular location is an optimal EV charging place. The limitations in this section were multiple
agencies located within one building sharing same street address, and the parking lot might not
be exclusive to one agency.
The building requirements of installing EV charging stations involves how to choose in
one park space out of an entire parking lot, how to obtain building permits, and how to follow
specific parking guidelines. These building requirements are excluded from this study. However,
if specific data of a location like square feet or electric network is available, these data can be
incorporated into ArcGIS processing on future researches. According to building codes of plug-
in electric vehicle charging, new commercial, industrial and other uses buildings shall provide
2% of parking lot with EV charging equipment. New commercial development shall provide for
electric vehicle charging stations. For instances, office buildings or office parks that employ
more than 1,000 persons or contain more than 250,000 square feet of gross floor area; and new
hopping centers or trade centers that employ 1,000 or more persons or contain 500,000 square
feet of gross floor area (Governor’s Office of Planning and Research 2015). Future studies of
conducting site suitability analysis on charging stations can be enhanced with additional detailed
datasets.

58
REFERENCES
Alternative Fuels Data Center. 2015. “Developing Infrastructure to Charge Plug-In Electric Vehicles.” Accessed June 21, 2015. http://www.afdc.energy.gov/fuels/electricity_infrastructure.html
Bailey, Joseph, Amy Miele, and John Axsen. 2015. "Is awareness of public charging associated with consumer interest in plug-in electric vehicles?" Transportation Research Part D: Transport and Environment 36 (2015): 1-9.
Balmin, Judith, Greg Bonett and Mega Kirkeby. 2015. “Increasing Electric Vehicle Charging Access in Multi-Unit Dwellings in Los Angeles.” Accessed September 21, 2015. http://luskin.ucla.edu/sites/default/files/EV%20Charging%20in%20LA%20MUDs.pdf
Berman, Brad. 2014. 2015. “Quick Charging of Electric Cars.” Plug-in Cars. September 03. Accessed on December 4, 2015. http://www.plugincars.com/electric-car-quick-charging-guide.html
Beverly Hills Community Development. 2015. “Electric Vehicle Charging Station.” Accessed September 20, 2015. http://www.beverlyhills.org/business/constructionlanduse/commercialbuildings/electricvehiclecharging/
California Green Building Standards Code. 2014. “Chapter 3 – Green Buildings” Accessed on September 1, 2015. http://www.ecodes.biz/ecodes_support/free_resources/2013California/13Green/PDFs/Chapter%203%20-%20Green%20Building.pdf
California Green Building Standards Code. 2014. “Chapter 5 – Nonresidential Mandatory Measures” Accessed on September 1, 2015. http://www.ecodes.biz/ecodes_support/free_resources/2013California/13Green/PDFs/Chapter%205%20-%20Nonresidential%20Mandatory%20Measures.pdf
California Legislative Information. 2013. “AB-1092 Building Standards: Electric Vehicle Charging Infrastructure” Accessed on September 20, 2015. http://leginfo.legislature.ca.gov/faces/billNavClient.xhtml?bill_id=201320140AB1092
California Legislative Information. 2013. “AB-266 Vehicles: High-occupancy Vehicle Lanes.” Accessed on September 20, 2015. http://leginfo.legislature.ca.gov/faces/billNavClient.xhtml?bill_id=201320140AB266
California Legislative Information. 2013. “SB-286 Vehicle: High-Occupancy Vehicles Lanes.” Accessed on September 20, 2015. http://leginfo.legislature.ca.gov/faces/billNavClient.xhtml?bill_id=201320140SB286

59
California Legislative Information. 2013. “SB-359 Vehicles: Retirement and Replacement.” Accessed on September 20, 2015. http://leginfo.legislature.ca.gov/faces/billNavClient.xhtml?bill_id=201320140SB359
California Plug-in Electric Vehicle Collaborative. 2012. “Accessibility and Signage for Plug-in Electric Vehicle Charging Infrastructure.” Accessed on September 21, 2015. http://www.pevcollaborative.org/sites/all/themes/pev/files/PEV_Accessibility_120827.pdf
Carver, Stephen J. 1991. “Integrating multi-criteria evaluation with geographical information systems” International Journal of Geographical Information Systems, 5:3, 321-339, DOI: 10.1080/02693799108927858
Center for Sustainable Energy, 2015. “EV Consumer Survey Dashboard.” Accessed June 26, 2015. http://energycenter.org/clean-vehicle-rebate-project/survey-dashboard
ChargePoint. 2013. “ChargePoint Releases List of Top 10 Cities for Electric Vehicles.” Accessed June 20, 2015. http://www.chargepoint.com/press-releases/2013/1024
ChargePoint. 2015. “ChargePoint Announces the Nation’s Top 10 Cities for Electric Vehicles.” Accessed June 20, 2015. http://www.chargepoint.com/press-releases/2015/0302
County of Los Angeles. 2015. “Garden.” Accessed June 20, 2015. https://www.lacounty.gov/things-to-do/parks-and-recreation/gardens
County of Los Angeles. 2015. “Parks and Recreation.” Accessed June 20, 2015. https://www.lacounty.gov/things-to-do/parks-and-recreation
County of Los Angeles. 2015. “Libraries & Museums.” Accessed June 20, 2015. https://www.lacounty.gov/things-to-do/libraries-museums
County of Sonoma. 2011. “Electric Vehicle Charging Station Program and Installation Guidelines.” Accessed September 21, 2015. http://www.sonoma-county.org/prmd/docs/misc/ev_prog_guidelines.pdf
Dawod, Gomaa M. 2013. "Suitability analysis for tourist infrastructures utilizing multi-criteria GIS: A case study in Al-Hada city, Saudi Arabia." International Journal of Geomatics and Geosciences 4, no. 2 (2013): 313-324.
DeShazo, J.R., Ayala Ben-Yehuda, Norman Wong, Susan Woodward, Will Sherwood, Vicky Hsu, Patricia Kwon, Benjamin Nguyen, Jon Overman, Tamar Saksian, Michael Sin, Alex Turek, Brett Williams, and Christian Zarate. 2012. “Southern California Plug-in Electric Vehicle Readiness Plan.” Southern California Association of Governments. UCLA Luskin School of Public Affairs. https://www.scag.ca.gov/Documents/SCAGSouthern%20CA%20PEV%20Readiness%20Plan.pdf

60
Efthymiou, Dimitrios, Constantinos Antoniou, Yannis Tyrinopoylos, and Evangelos Mitsakis. 2012. "Spatial Exploration of Effective electric vehicle infrastructure location." Procedia-Social and Behavioral Sciences 48 (2012): 765-774.
Esri. 2011. “Hot-Spot Analysis Identifies Potential WIC Recipients.” Accessed July 30, 2015. http://www.esri.com/news/releases/11-3qtr/hotspot-analysis-identifies-potential-wic-recipients.html
Frade, Inês, Anabela Ribeiro, Gonçalo Gonçalves, and António Pais Antunes. 2011 “Optimal Location of Charging Stations for Electric Vehicles in a Neighborhood in Lisbon, Portugal.” Transportation Research Record: Journal of the Transportation Research Board, No. 2252, Transportation Research Board of the National Academies, Washington, D.C., 2011, pp. 91–98. DOI: 10.3141/2252-12
Fuel Economy. 2015. “All-Electric Vehicles.” Accessed June 21, 2015. http://www.fueleconomy.gov/feg/evtech.shtml
Fuel Economy. 2015. “Federal Tax Credits for Electric Vehicles Purchased in or after 2010.” Accessed June 21, 2015. http://www.fueleconomy.gov/feg/taxevb.shtml
Fuel Economy. 2015. “How Hybrids Work.” Accessed June 21, 2015. http://www.fueleconomy.gov/feg/hybridtech.shtml
Ge, Shaoyun, Liang Feng, and Hong Liu. 2011. "The planning of electric vehicle charging station based on grid partition method." In Electrical and Control Engineering (ICECE), 2011 International Conference on, pp. 2726-2730. IEEE, 2011. DOI: 10.1109/ICECENG.2011.6057636
Governor’s Office of Planning and Research. 2015. “Example Building Codes for Plug-In Electric Vehicle Charging.” State of California. Accessed on Dec 17. http://webcache.googleusercontent.com/search?q=cache:jGTjTVdUpRkJ:https://www.opr.ca.gov/docs/Example_Building_Codes.docx+&cd=1&hl=en&ct=clnk&gl=us&client=safari
Hawkins, Troy R., Bhawna Singh, Guillaume Majeau‐Bettez, and Anders Hammer Strømman. 2013. “Comparative environmental life cycle assessment of conventional and electric vehicles.” Journal of Industrial Ecology 17 (1): 53-64.
He, Fang, Di Wu, Yafeng Yin, and Yongpei Guan. 2013. "Optimal deployment of public charging stations for plug-in hybrid electric vehicles." Transportation Research Part B: Methodological 47 (2013): 87-101.
International Energy Agency. 2015. “Hybrid Electric Vehicles.” Accessed on Dec 12. http://www.ieahev.org/about-the-technologies/hybrid-electric-vehicles/
Lavring, Damon. 2013. “California’s Sustainable Transport Incentives Leave Other States in the Stone Age.” Wired. October 10. Accessed September 20, 2015. http://www.wired.com/2013/10/california-bills-ev-ready/

61
Los Angeles County Economic Development Corporation. 2015. “Getting EV Ready in Los Angeles County.” Accessed July 10, 2015. http://laedc.org/2013/03/08/getting-ev-ready-in-los-angeles-county/
LA County Electric Vehicle Charging Stations. 2015. “LA County Electric Vehicle Charging Stations Made with Google My Maps.” Accessed July 10, 2015. https://www.google.com/maps/d/u/1/viewer?authuser=1&mid=zy7nG5Nxlu1U.keADwzmJ6zsY
McKenzie, Brian. 2015. “Who Drives to Work? Commuting by Automobile in the United States: 2013.” American Community Survey Reports, August 2015. https://www.census.gov/hhes/commuting/files/2014/acs-32.pdf
Melaina, Marc, and Joel Bremson. "Refueling availability for alternative fuel vehicle markets: sufficient urban station coverage." Energy Policy 36, no. 8 (2008): 3233-3241.
Mu, Yunfei, Jianzhong Wu, Nick Jenkins, Hongjie Jia, and Chengshan Wang. "A Spatial–Temporal model for grid impact analysis of plug-in electric vehicles." Applied Energy 114 (2014): 456-465.
Namdeo, A., A. Tiwary, and R. Dziurla. "Spatial planning of public charging points using multi-dimensional analysis of early adopters of electric vehicles for a city region." Technological Forecasting and Social Change 89 (2014): 188-200.
National Renewable Energy Laboratory. 2014. “California Statewide Plug-in Electric Vehicle Infrastructure Assessment.” Assessed on September 21, 2015 http://www.energy.ca.gov/2014publications/CEC-600-2014-003/CEC-600-2014-003.pdf
Nie, Yu Marco, and Mehrnaz Ghamami. "A corridor-centric approach to planning electric vehicle charging infrastructure." Transportation Research Part B: Methodological 57 (2013): 172-190.
Oxford Dictionaries. 2015. “Range Anxiety.” Accessed July 10, 2015. http://www.oxforddictionaries.com/us/definition/american_english/range-anxiety
Peterson, Scott B., and Jeremy J. Michalek. 2013. “Cost-effectiveness of plug-in hybrid electric vehicle battery capacity and charging infrastructure investment for reducing US gasoline consumption.” Energy Policy 52: 429-38.
PEV Collaborative. 2011. “Ready Set Charge California.” Accessed July 10, 2015. http://www.pevcollaborative.org/sites/all/themes/pev/files/docs/ReadySetCharge_EVGuidelines.pdf
Plug-in Electric Vehicle Resource Center. 2015. “Battery Electric Vehicles.” Accessed on Dec 12. http://driveclean.ca.gov/pev/Plug-in_Electric_Vehicles/BEVs.php
Plug-in Electric Vehicle Resource Center. 2015. “PEV Types.” Accessed on Dec 12. http://driveclean.ca.gov/pev/Plug-in_Electric_Vehicles/PEV_Types.php

62
Richtel, Matt. 2015. “In California, Electric Cars Outpace Plugs, Sparks Fly.” New York Times, October 10. Accessed October 30, 2015. http://www.nytimes.com/2015/10/11/science/in-california-electric-cars-outpace-plugs-and-sparks-fly.html?_r=0
San Diego. 2012. “San Diego Regional Plug-in Electric Vehicle (PEV) Readiness Plan.” Accessed September 21, 2015�https://energycenter.org/sites/default/files/docs/nav/programs/pev-planning/san-diego/Agenda%20Item%207A-DRAFT%20-%20SD%20PEV%20Readiness%20Plan%20Appendices_small.pdf
San Joaquin Valley Air Pollution Control District. 2014. “Charging Roadmap: Siting optimal Locations for Public Charging Stations in the San Joaquin Valley.” Modified May. �https://energycenter.org/sites/default/files/docs/nav/programs/pev-planning/san-joaquin/san_joaquin_valley_siting_analysis-web.pdf
Supervisor Mark Ridley-Thomas. 2014. “EV Charging Stations Available to Residents.” Accessed June 20, 2015. http://ridley-thomas.lacounty.gov/index.php/ev-stations/
Schaal, Eric. 2015. “Why Los Angeles is the Perfect Place for Electric Vehicles.” Autos Cheat Sheet. August 27. Accessed on December 7, 2015.�http://www.cheatsheet.com/automobiles/why-los-angeles-is-the-perfect-place-for-electric-vehicles.html/?a=viewall
Schaal, Eric. 2015. “10 Electric Vehicles with the Best Range in 2015.” Autos Cheat Sheet. September 27. Accessed on October 30, 2015. �http://www.cheatsheet.com/automobiles/top-10-electric-vehicles-with-the-longest-driving-range.html/?a=viewall
Spross Jeff. 2014. “How Some Simple Changes to Building Codes Could Revolutionize the Electric Car Market.” Climate Progress. May 7. Accessed September 20.2015. http://thinkprogress.org/climate/2014/05/07/3435439/ev-outlets-building-codes/
Sweda, Timothy, and Diego Klabjan. "An agent-based decision support system for electric vehicle charging infrastructure deployment." In Vehicle Power and Propulsion Conference (VPPC), 2011 IEEE, pp. 1-5. IEEE, 2011.
UCLA Luskin School of Public Affairs. 2013. “South Bay Cities Plug-in Electric Vehicle Deployment Plan.” Accessed September 21, 2015. http://www.scag.ca.gov/Documents/SCAG_UCLA_Luskin-SBCOG%20PEV%20Deployment%20Plan%20Final.pdf
U.S. Census Bureau. 2015. “Los Angeles County, California Quick Links.” Last Revised Oct 14. Accessed on October 30, 2015. http://quickfacts.census.gov/qfd/states/06/06037.html
U.S. Department of Energy. 2012 “54.5 MPG and Beyond: Fueling Energy-Efficient Vehicles.” Accessed June 19, 2015. http://www.energy.gov/articles/545-mpg-and-beyond-fueling-energy-efficient-vehicles

63
U.S. Department of Energy. 2012 “The History of the Electric Car.” Accessed June 19, 2015. http://www.energy.gov/articles/history-electric-car
U.S. Department of Energy. 2012 “Top 10 Things You Didn’t Know About Electric Vehicles.” Accessed June 19, 2015. http://www.energy.gov/articles/top-10-things-you-didn-t-know-about-electric-vehicles
Xu, Kun, Ping Yi, and Yudhveer Kandukuri. 2013. "Location Selection of Charging Stations for Battery Electric Vehicles in an Urban Area." International Journal of Engineering Research and Science & Technology 2 (3): 15-23.

64
Appendix A: Los Angeles County Electric Vehicle Charging Stations
Station Name Address City State ZIP Access Days & Time
Level 2 EVSE Number
EV Connector Types
Los Angeles County - Department of Health Services Administration
313 N Figueroa Los Angeles CA 90012 Business hours; pay lot 4 J1772
Los Angeles County - Harbor UCLA Medical Center 1000 W Carson St Torrance CA 90502 24 hours daily 4 J1772
Los Angeles County - Health Services 5555 Ferguson Dr. Commerce CA 90022 24 hours daily 4 J1772
Los Angeles County - High Desert Regional Health Center 335 E Ave I Lancaster CA 93535 Business hours 4 J1772
Los Angeles County - Internal Services Department Headquarters
1102 N Eastern Ave Los Angeles CA 90063 6am-6pm M-Thur. 4 J1772
Los Angeles County - Internal Services Department Telecomm 1110 N Eastern Ave Los Angeles CA 90063 6am-6pm M-
Fri. 4 J1772
Los Angeles County - Marina Lot 77 13560 Mindinao Way Marina Del Rey CA 90292 24 hours daily; 2 J1772
Los Angeles County - Martin Luther King Hospital 1670 E 120th St Los Angeles CA 90059 24 hours daily 2 J1772
Los Angeles County - Mid-Valley Comprehensive Health Center
7515 Van Nuys Blvd Van Nuys CA 91405 6am-6pm M-F 5 J1772
Los Angeles County - Music Center Parking 135 N Grand Ave Los Angeles CA 90012 Business
hours; pay lot 3 J1772
Los Angeles County - Olive View UCLA Medical Center 14445 Olive View Dr. Sylmar CA 91342 24 hours daily 14 J1772
Los Angeles County - Probation Department 9150 E Imperial Hwy Downey CA 90242 Business hours 2 J1772
Los Angeles County - Public Works Annex 901 S Fremont Ave Alhambra CA 91803 6am-6pm M-F 3 J1772
Los Angeles County - Public Works Headquarters 900 S Fremont Ave Alhambra CA 91803 6am-6pm M-F 8 J1772

65
Los Angeles County - Rancho Los Amigos Hospital 7601 E Imperial Hwy Downey CA 90242 24 hours daily 5 J1772
Los Angeles County - Walt Disney Concert Hall 115 S Grand Ave Los Angeles CA 90012 Business
hours; pay lot 6 J1772
Los Angeles County Arboretum 301 N Baldwin Ave Arcadia CA 91007 24 hours daily 3 J1772 Los Angeles County Museum of Art 5905 Wilshire Blvd Los Angeles CA 90036 Business
hours; pay lot 3 J1772
Los Angeles County Registrar-Recorder - County Clerk 12400 E Imperial Hwy Norwalk CA 90650 Primarily for
employee use 3 J1772
Los Angeles County Sheriff - Century Station 11705 S Alameda Lynwood CA 90059 Business
hours; pay lot 2 J1772
Los Angeles County Sheriff - Fleet Shop 1104 N Eastern Ave Los Angeles CA 90063 8am-5pm M-F 2 J1772
Los Angeles County Sheriff - Headquarters 4700 Ramona Blvd Monterey Park CA 91754 8am-5pm M-F 2 J1772
Los Angeles County Sheriff - Lost Hills 27050 Agoura Rd Agoura CA 91301 24 hours daily 2 J1772
Los Angeles County Sheriff - Mira Loma Garage 45000 N 60th St W Lancaster CA 93536 7am-4pm M-F 3 J1772
Los Angeles County Sheriff - San Dimas Station 270 S Walnut Ave San Dimas CA 91773 24 hours daily 2 J1772
Los Angeles County Sheriff - Santa Clarita Station
23740 Magic Mountain Pkwy Santa Clarita CA 91355 24 hours daily 2 J1772
Los Angeles County Sheriff - Temple City Station 8838 Las Tunas Dr. Temple City CA 91780 24 hours daily 2 J1772
Los Angeles County Sheriff - Walnut Station 21695 Valley Blvd Walnut CA 91789 24 hours daily 2 J1772
Los Angeles County Sheriff - West Hollywood Station 780 San Vicente Blvd West
Hollywood CA 90069 24 hours daily 2 J1772
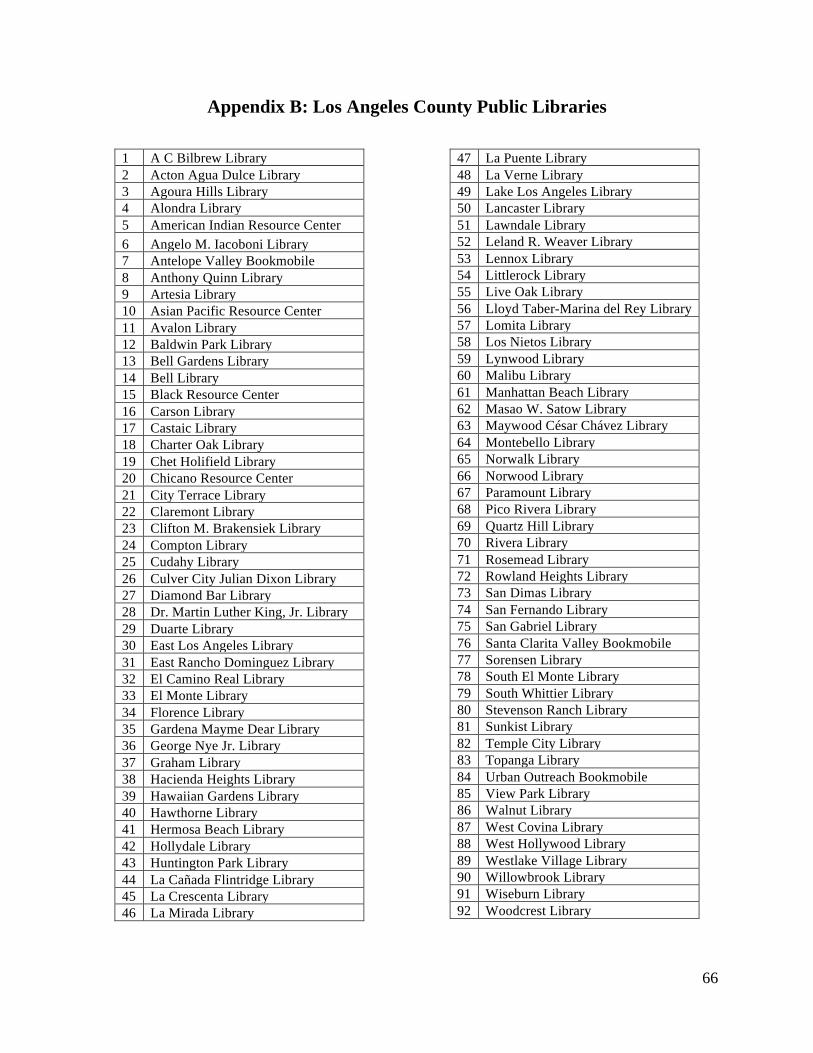
66
Appendix B: Los Angeles County Public Libraries
1 A C Bilbrew Library 2 Acton Agua Dulce Library 3 Agoura Hills Library 4 Alondra Library 5 American Indian Resource Center 6 Angelo M. Iacoboni Library 7 Antelope Valley Bookmobile 8 Anthony Quinn Library 9 Artesia Library 10 Asian Pacific Resource Center 11 Avalon Library 12 Baldwin Park Library 13 Bell Gardens Library 14 Bell Library 15 Black Resource Center 16 Carson Library 17 Castaic Library 18 Charter Oak Library 19 Chet Holifield Library 20 Chicano Resource Center 21 City Terrace Library 22 Claremont Library 23 Clifton M. Brakensiek Library 24 Compton Library 25 Cudahy Library 26 Culver City Julian Dixon Library 27 Diamond Bar Library 28 Dr. Martin Luther King, Jr. Library 29 Duarte Library 30 East Los Angeles Library 31 East Rancho Dominguez Library 32 El Camino Real Library 33 El Monte Library 34 Florence Library 35 Gardena Mayme Dear Library 36 George Nye Jr. Library 37 Graham Library 38 Hacienda Heights Library 39 Hawaiian Gardens Library 40 Hawthorne Library 41 Hermosa Beach Library 42 Hollydale Library 43 Huntington Park Library 44 La Cañada Flintridge Library 45 La Crescenta Library 46 La Mirada Library
47 La Puente Library 48 La Verne Library 49 Lake Los Angeles Library 50 Lancaster Library 51 Lawndale Library 52 Leland R. Weaver Library 53 Lennox Library 54 Littlerock Library 55 Live Oak Library 56 Lloyd Taber-Marina del Rey Library 57 Lomita Library 58 Los Nietos Library 59 Lynwood Library 60 Malibu Library 61 Manhattan Beach Library 62 Masao W. Satow Library 63 Maywood César Chávez Library 64 Montebello Library 65 Norwalk Library 66 Norwood Library 67 Paramount Library 68 Pico Rivera Library 69 Quartz Hill Library 70 Rivera Library 71 Rosemead Library 72 Rowland Heights Library 73 San Dimas Library 74 San Fernando Library 75 San Gabriel Library 76 Santa Clarita Valley Bookmobile 77 Sorensen Library 78 South El Monte Library 79 South Whittier Library 80 Stevenson Ranch Library 81 Sunkist Library 82 Temple City Library 83 Topanga Library 84 Urban Outreach Bookmobile 85 View Park Library 86 Walnut Library 87 West Covina Library 88 West Hollywood Library 89 Westlake Village Library 90 Willowbrook Library 91 Wiseburn Library 92 Woodcrest Library

67
Appendix C: Los Angeles County Department of Regional Parks and Recreations
1 72nd Street Staging Area 2 7th Avenue Staging Area 3 Acton Park 4 Acton Wash Sanctuary 5 Adventure Park 6 Alondra Community Regional Park 7 Alpine Butte Wildlife Sanctuary 8 Altadena Golf Course 9 Amigo Park 10 Apollo Community Regional Park 11 Arboretum and Botanic Garden 12 Arcadia Community Regional Park 13 Athens Park 14 Atlantic Avenue Park 15 Avenue Park 16 Avocado Heights Park 17 Bassett Park 18 Belvedere Community Regional Park 19 Bethune Park, Mary M. 20 Big Rock Creek Wildlife Sanctuary 21 Blalock Wildlife Sanctuary 22 Blevins Park, Bill 23 Bodger Park 24 Bonelli Regional Park, Frank G. 25 Butte Valley Wildflower Sanctuary 26 Campanella Park, Roy 27 Carver Park, George Washington 28 Castaic Lake State Recreation Area 29 Castaic Sports Complex 30 Cerritos Community Regional Park 31 Charles White Park 32 Charter Oak Park 33 Chester Washington Golf Course 34 City Terrace Park 35 Countrywood Park
36 Crescenta Valley Community Regional Park
37 Dalton Park
38 Deane Dana Friendship Park and Nature Center
39 Del Aire Park 40 Del Valle Park 41 Descanso Gardens 42 Devil's Punchbowl Natural Area
43 Dexter Park 44 Diamond Bar Golf Course 45 East Rancho Dominguez Park 46 Eastside Eddie Heredia Boxing Club 47 Eaton Canyon Golf Course 48 Eaton Canyon Park & Nature Center 49 Eaton Canyon Staging Area 50 El Cariso Community Regional Park 51 El Cariso Golf Course 52 El Parque Nuestro 53 Enterprise Park 54 Farnsworth Park, Charles S. 55 Ganesha Park 56 George Lane Park 57 George R. Bones Wildlife Sanctuary 58 Gerhardy Wildlife Sanctuary, Carl O. 59 Gloria Heer Park
60 Hacienda Heights Community and Recreation Center
61 Hart Regional Park, William S. 62 Hasley Canyon Equestrian Center 63 Hasley Canyon Park 64 Helen Keller Park 65 Highland Camrose Park 66 Hollywood Bowl 67 Jackie Robinson Park 68 Jackrabbit Flats Wildlife Sanctuary 69 Jake Kuredjian Park 70 Jesse Owens Community Regional Park 71 John Anson Ford Amphitheatre 72 Kenneth Hahn State Recreation Area 73 Knollwood Golf Course 74 Knollwood Pool 75 La Canada Staging Area 76 La Mirada Community Regional Park 77 La Mirada Golf Course 78 Ladera Park 79 Lakewood Golf Course 80 Lario San Gabriel River Trail 81 Lennox Park 82 Lincoln SPS Staging Area 83 Loma Alta Park 84 Longview Sanctuary 85 Los Amigos Golf Course
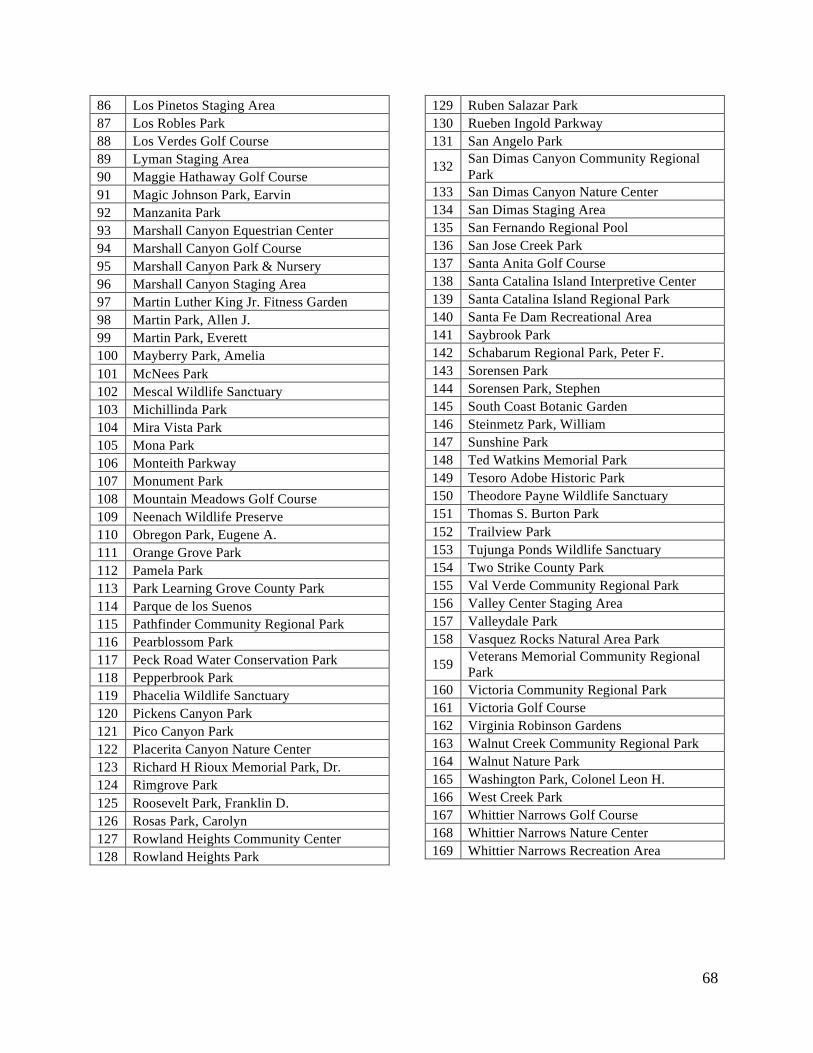
68
86 Los Pinetos Staging Area 87 Los Robles Park 88 Los Verdes Golf Course 89 Lyman Staging Area 90 Maggie Hathaway Golf Course 91 Magic Johnson Park, Earvin 92 Manzanita Park 93 Marshall Canyon Equestrian Center 94 Marshall Canyon Golf Course 95 Marshall Canyon Park & Nursery 96 Marshall Canyon Staging Area 97 Martin Luther King Jr. Fitness Garden 98 Martin Park, Allen J. 99 Martin Park, Everett 100 Mayberry Park, Amelia 101 McNees Park 102 Mescal Wildlife Sanctuary 103 Michillinda Park 104 Mira Vista Park 105 Mona Park 106 Monteith Parkway 107 Monument Park 108 Mountain Meadows Golf Course 109 Neenach Wildlife Preserve 110 Obregon Park, Eugene A. 111 Orange Grove Park 112 Pamela Park 113 Park Learning Grove County Park 114 Parque de los Suenos 115 Pathfinder Community Regional Park 116 Pearblossom Park 117 Peck Road Water Conservation Park 118 Pepperbrook Park 119 Phacelia Wildlife Sanctuary 120 Pickens Canyon Park 121 Pico Canyon Park 122 Placerita Canyon Nature Center 123 Richard H Rioux Memorial Park, Dr. 124 Rimgrove Park 125 Roosevelt Park, Franklin D. 126 Rosas Park, Carolyn 127 Rowland Heights Community Center 128 Rowland Heights Park
129 Ruben Salazar Park 130 Rueben Ingold Parkway 131 San Angelo Park
132 San Dimas Canyon Community Regional Park
133 San Dimas Canyon Nature Center 134 San Dimas Staging Area 135 San Fernando Regional Pool 136 San Jose Creek Park 137 Santa Anita Golf Course 138 Santa Catalina Island Interpretive Center 139 Santa Catalina Island Regional Park 140 Santa Fe Dam Recreational Area 141 Saybrook Park 142 Schabarum Regional Park, Peter F. 143 Sorensen Park 144 Sorensen Park, Stephen 145 South Coast Botanic Garden 146 Steinmetz Park, William 147 Sunshine Park 148 Ted Watkins Memorial Park 149 Tesoro Adobe Historic Park 150 Theodore Payne Wildlife Sanctuary 151 Thomas S. Burton Park 152 Trailview Park 153 Tujunga Ponds Wildlife Sanctuary 154 Two Strike County Park 155 Val Verde Community Regional Park 156 Valley Center Staging Area 157 Valleydale Park 158 Vasquez Rocks Natural Area Park
159 Veterans Memorial Community Regional Park
160 Victoria Community Regional Park 161 Victoria Golf Course 162 Virginia Robinson Gardens 163 Walnut Creek Community Regional Park 164 Walnut Nature Park 165 Washington Park, Colonel Leon H. 166 West Creek Park 167 Whittier Narrows Golf Course 168 Whittier Narrows Nature Center 169 Whittier Narrows Recreation Area