Installed Capacity - semenindonesia.com · United Tractor Semen Gresik 55% PT Swadaya Graha 25% PT...
16
Transcript of Installed Capacity - semenindonesia.com · United Tractor Semen Gresik 55% PT Swadaya Graha 25% PT...

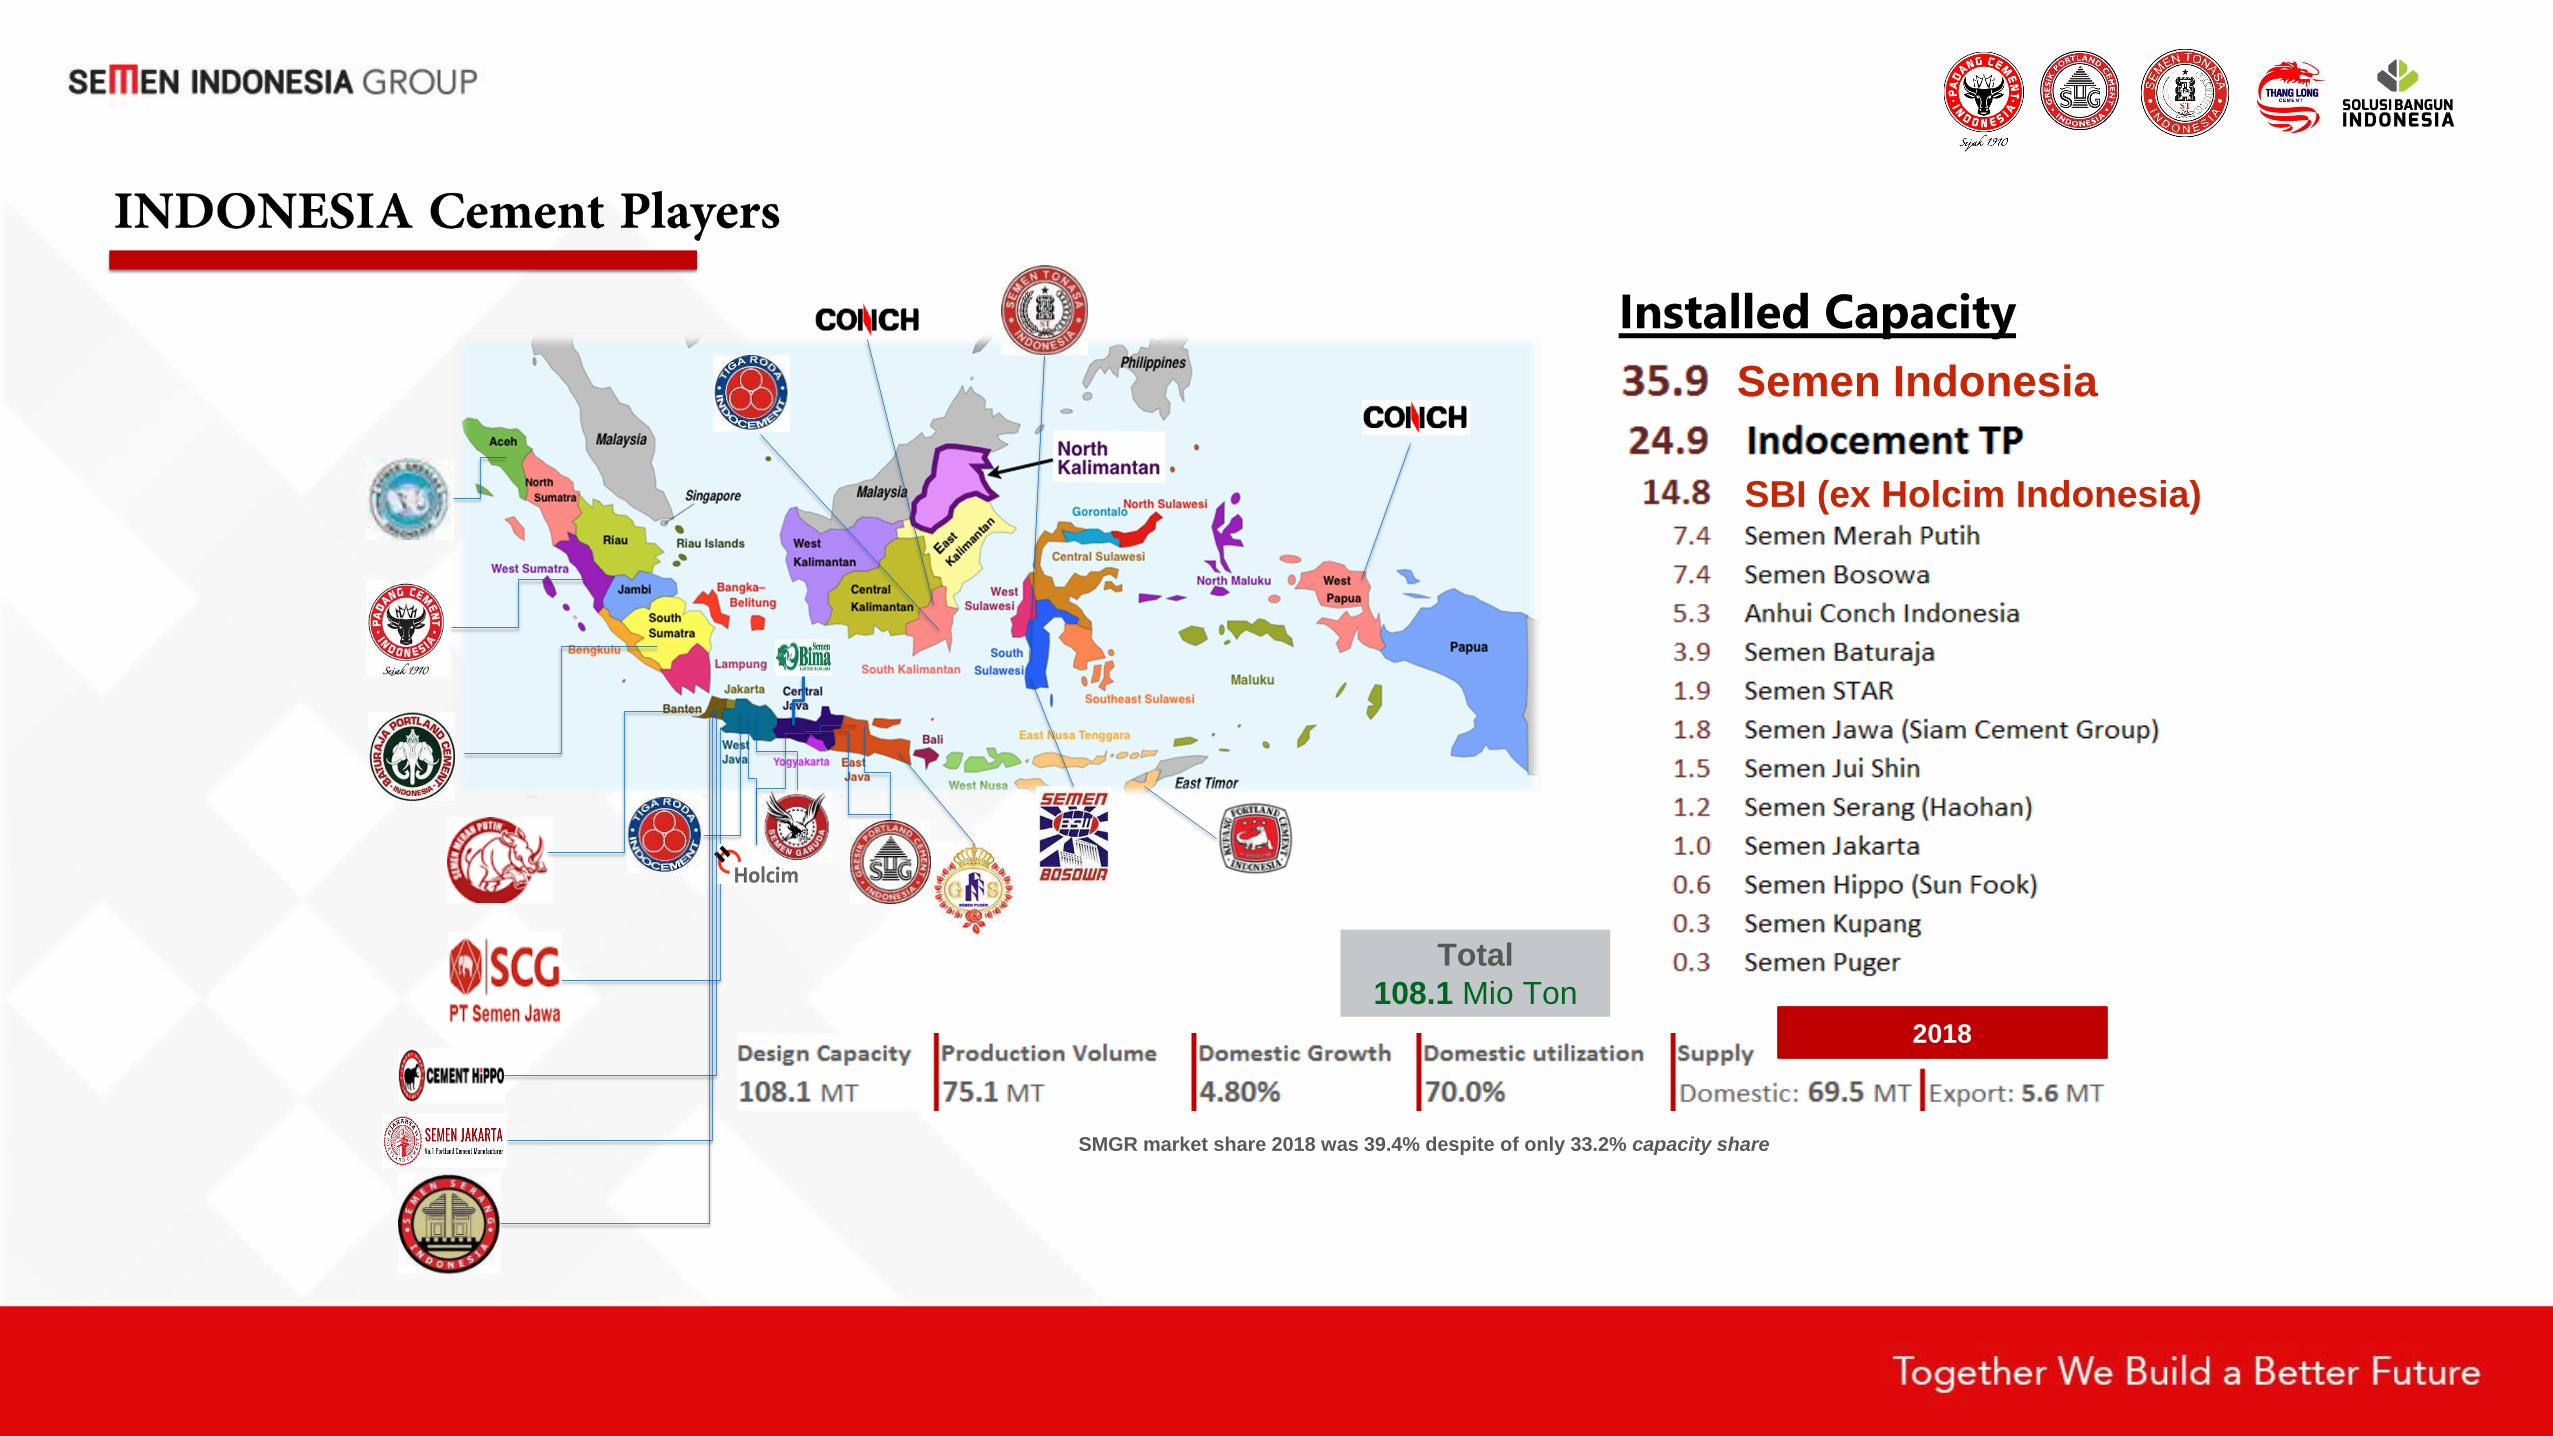
Installed Capacity
Total
108.1 Mio Ton
SMGR market share 2018 was 39.4% despite of only 33.2% capacity share
2018
Semen Indonesia
SBI (ex Holcim Indonesia)

53.17%
26.37%
5.07% 4.09%2.95% 3.12% 2.31% 1.76% 0.93% 0.23%
SMIG(SMGR+ SBI)
INTP Conch Bosowa MerahPutih
Baturaja Jui Shin SiamCement
STAR SemenKupang
Market Share
39.40%
25.50%
15.40%
4.80%3.50% 3.10% 3.10%
1.90% 1.90%1.00% 0.30%
SMGR INTP SBI Conch Bosowa MerahPutih
BaturajaJui Shin SiamCement
STAR SemenKupang
Market Share
SMIG is the market leader in Indonesia with a market share of
39.4% in 2018. The top 3 players dominate 80.3% of domestic
market share. With the acquisition SBI, our market share
increased by 15.40%.
source: Indonesia Cement Association
SMIG

• Established in August 1957
• One of the largest cement players in SE Asia with a design
capacity of 38.2 MTPY of cement and a 40% market share in
Indonesia
• Production facilities in Indonesia’s 3 major islands namely
Java, Sumatera and Sulawesi, and also in Vietnam
• State Owned Enterprise with 51% shares owned by
Government of Indonesia
• Publicly listed in IDX since 1991 with a market capitalization of
$4.8bn
TLCC
70,0%
PT Semen
Indonesia
Aceh
52,28%
SBI
98,4%
PT Semen
Kupang
Indonesia
99,48%
PT Semen
Padang
99,99%
PT
Semen
Tonasa
99,99%
PT Semen
Gresik
99,96%
PT Semen Indonesia Logistic
73,65%
PT Sinergi Mitra Investama
97%
PT Semen Indonesia International
85,00%
PT Sinergi Informatika Semen Indonesia
85,00%
PT Semen Indonesia Beton
99,99%
PT Semen Indonesia Industri Bangunan
99,99%
Industri Kemasan Semen Gresik
60%
United Tractor Semen Gresik
55%
PT Swadaya Graha
25%
PT Krakatau Semen Indonesia
50%
PT Kawasan Industri Gresik
65%
Foreign
individuals
0%
Domestic
institutions
11%
Foreign
institutions
37%Indonesian
Government
51%
Domestic
individuals
1%
*acquired under
SIIB
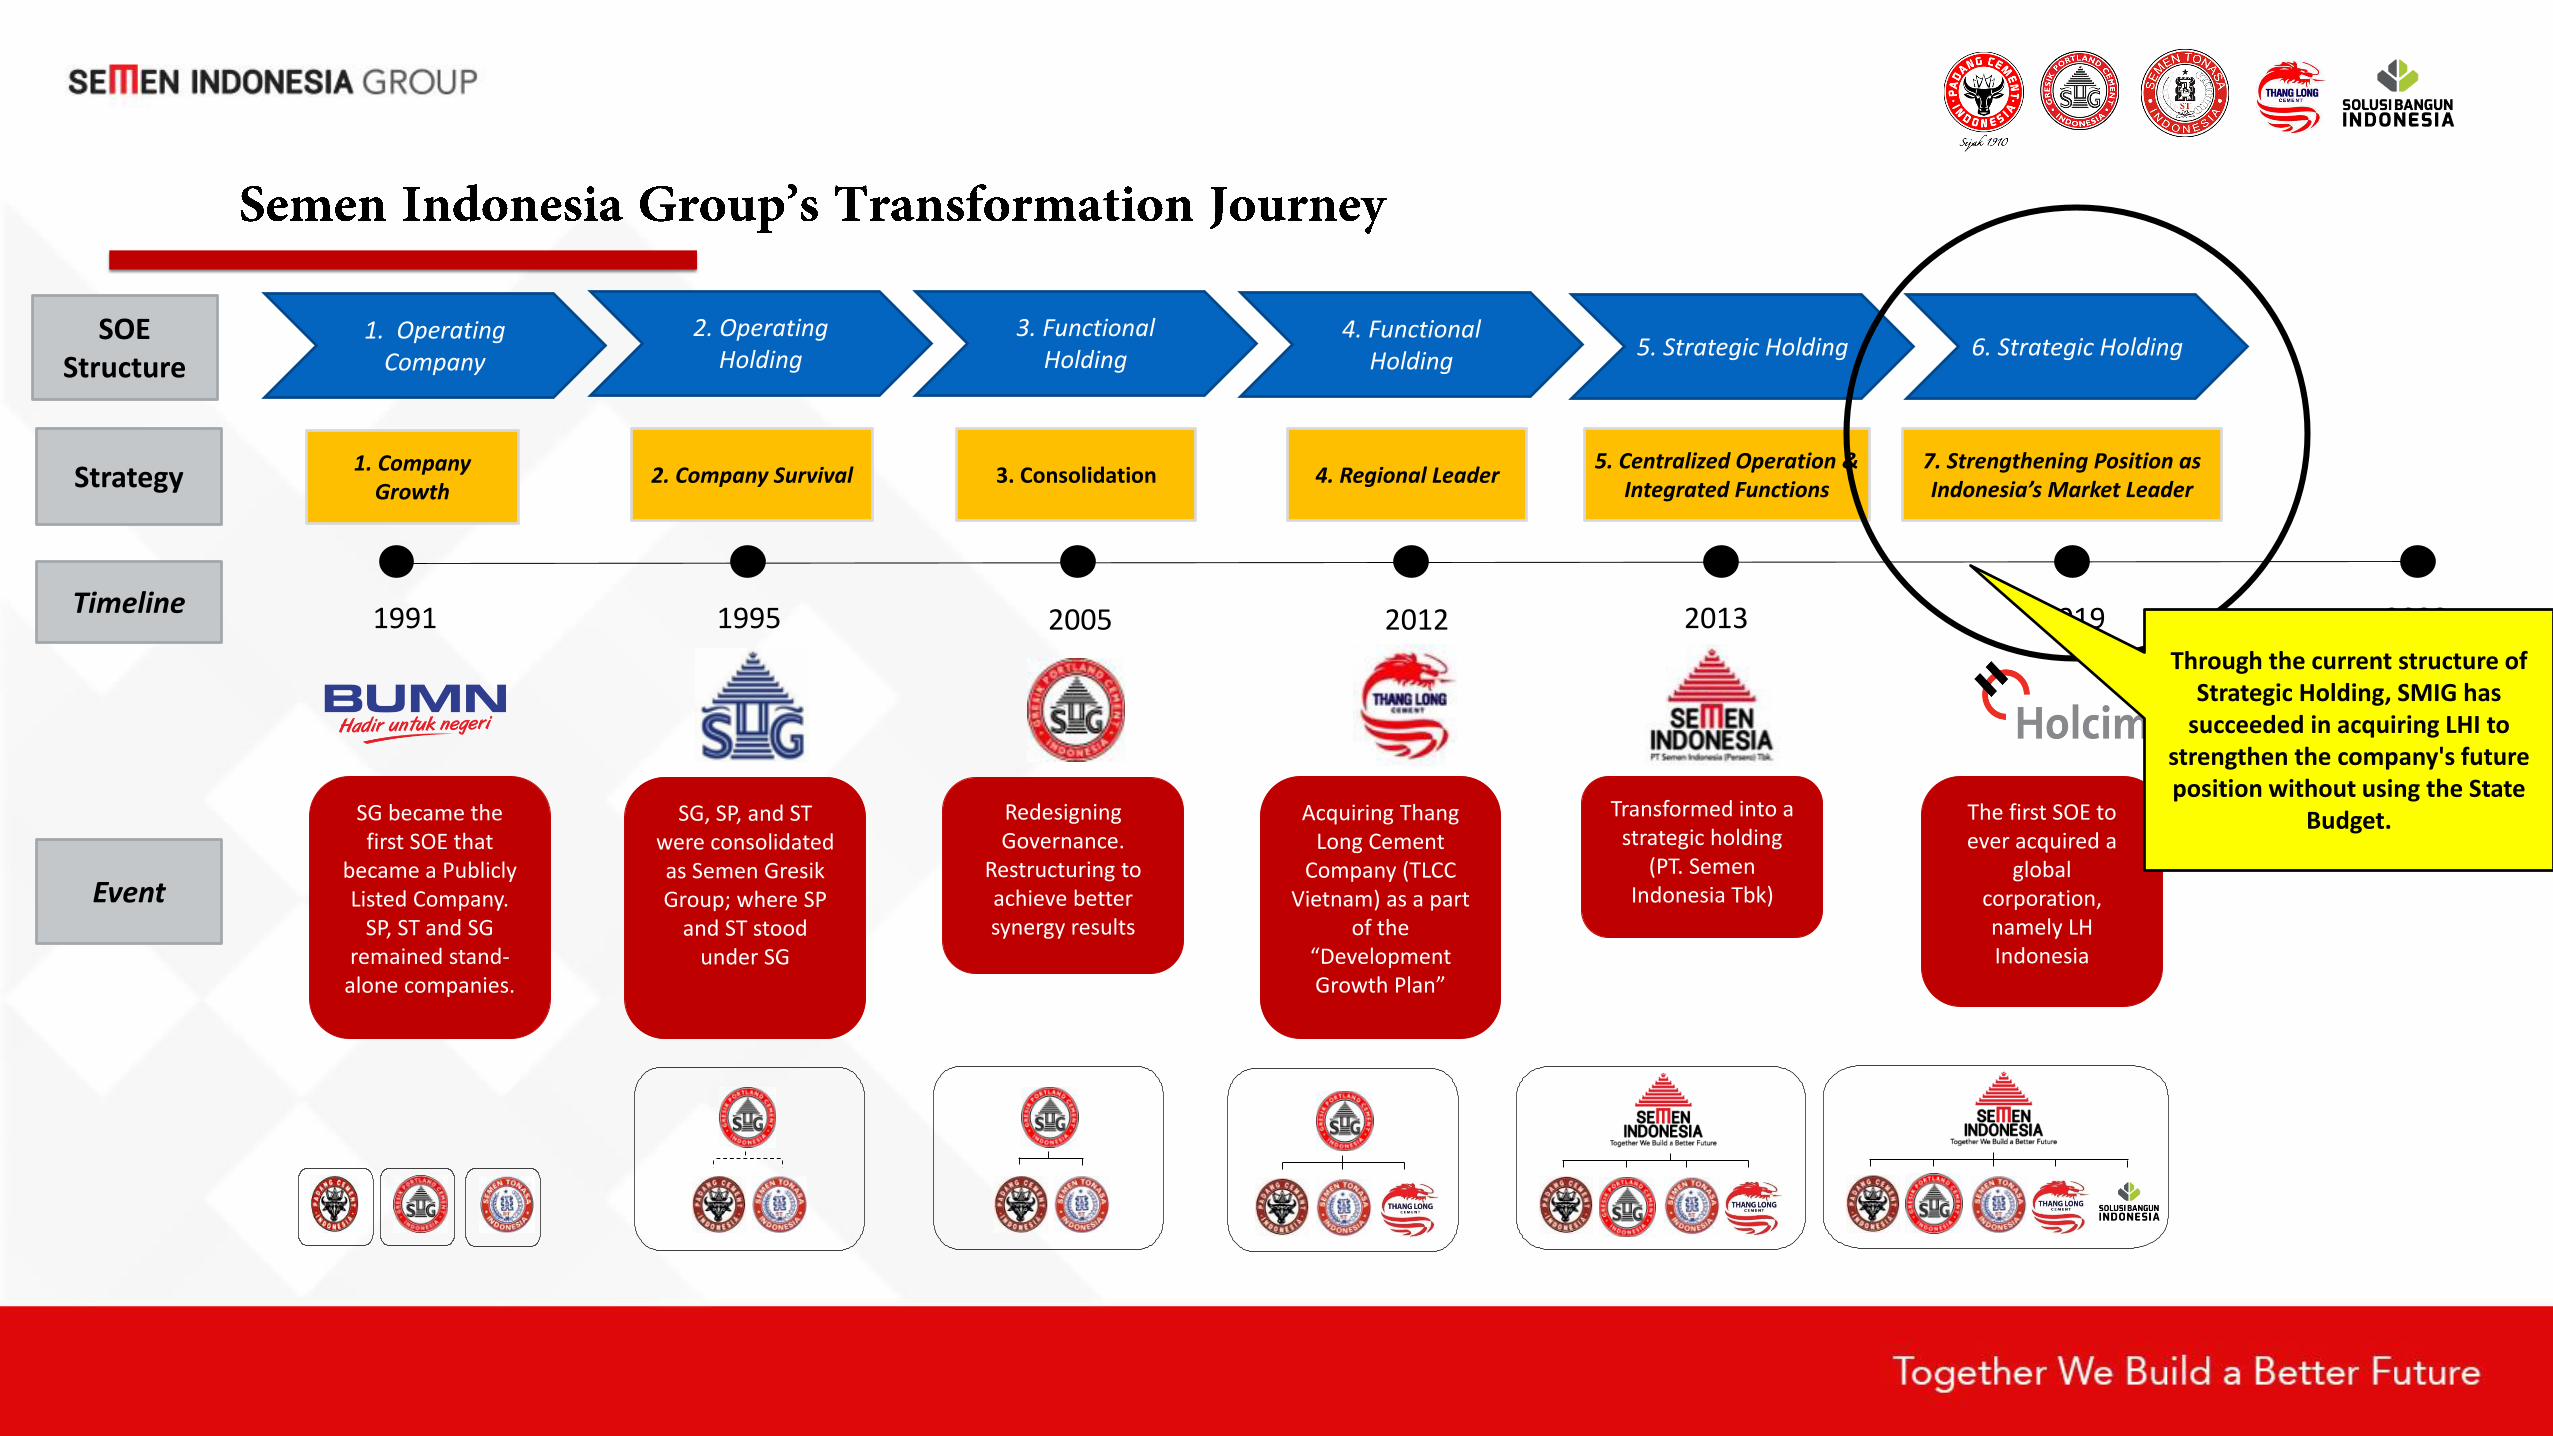
1995 2005 2012 2013
SG became the first SOE that
became a Publicly Listed Company.
SP, ST and SG remained stand-
alone companies.
SG, SP, and ST were consolidated as Semen Gresik Group; where SP
and ST stood under SG
Transformed into a strategic holding
(PT. Semen Indonesia Tbk)
Redesigning Governance.
Restructuring to achieve better synergy results
Acquiring Thang Long Cement
Company (TLCC Vietnam) as a part
of the “Development Growth Plan”
SOE Structure
Timeline
Event
2019
The first SOE to ever acquired a
global corporation, namely LH Indonesia
Strategy1. Company
Growth2. Company Survival 3. Consolidation 4. Regional Leader
5. Centralized Operation & Integrated Functions
7. Strengthening Position as Indonesia’s Market Leader
6. Strategic Holding5. Strategic Holding
2023
4. Functional Holding
3. Functional Holding
2. Operating Holding
1. Operating Company
1991
Through the current structure of Strategic Holding, SMIG has
succeeded in acquiring LHI to strengthen the company's future position without using the State
Budget.
BAG
73%
BULK
27%
32.8 34.239.2
44.1 45.7 46.9 47.5 46.8 49.4 50.8
6.2 6.6
8.8
10.812.2 13 14.5 14.8
16.9 18.830.0%
25.0%
20.0%
15.0%
10.0%
5.0%
0.0%
-5.0%
20
10
0
60
50
40
30
80 40.0%
Bulk Vol
2009 2010 2011 2012 2013 2014 2015 2016 2017 2018
Bag Vol Growth Bag Growth Bulk Bulk Portion
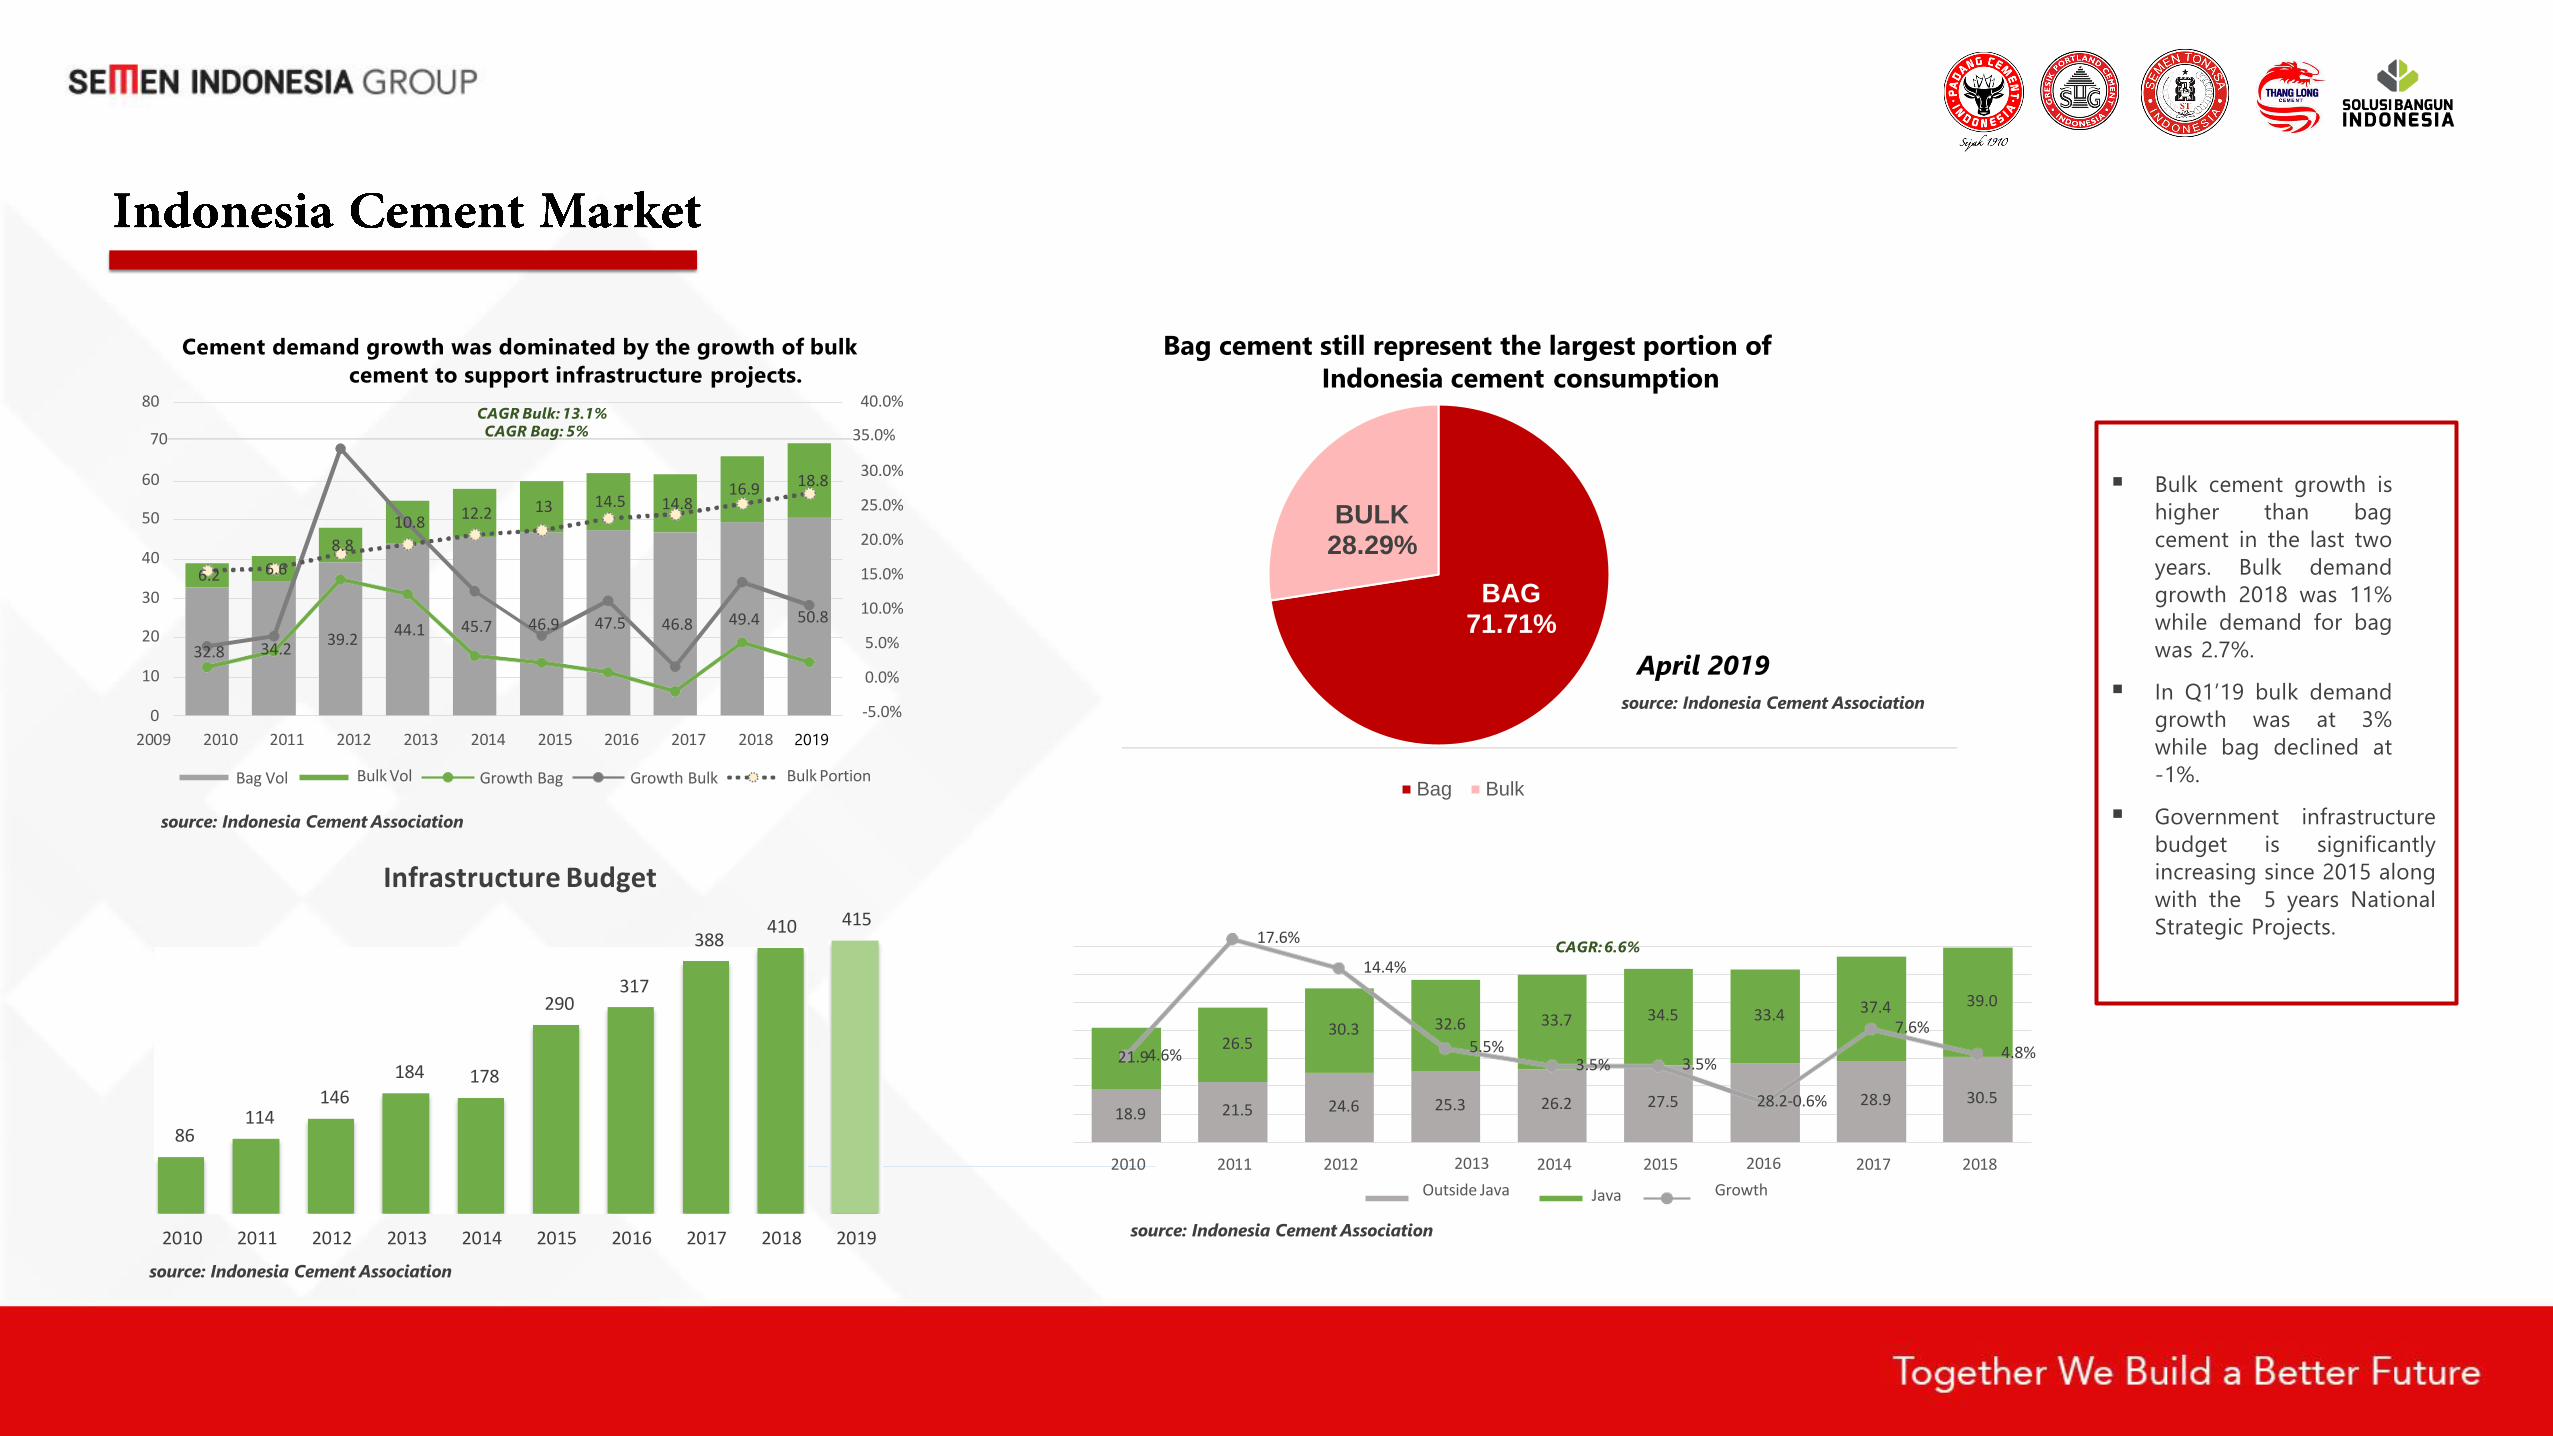
CAGR Bulk: 13.1%
70 CAGR Bag: 5% 35.0%
Cement demand growth was dominated by the growth of bulk
cement to support infrastructure projects.
86114
146
184 178
290317
388410 415
2010 2011 2012 2013 2014 2015 2016 2017 2018 2019
Infrastructure Budget
18.9 21.5 24.6 25.3 26.2 27.5 28.9 30.5
26.530.3 32.6 33.7 34.5 33.4 37.4 39.0
21.94.6%
17.6%
14.4%
5.5%3.5% 3.5%
28.2-0.6%
7.6%
4.8%
2010 2011 2012 2014 2015 2017 20182013
Outside Java Java
2016
Growth
CAGR:6.6%
source: Indonesia Cement Association
source: Indonesia Cement Association
Bag cement still represent the largest portion of
Indonesia cement consumption
BAG71.71%
BULK28.29%
Bag Bulk
Bulk cement growth is
higher than bag
cement in the last two
years. Bulk demand
growth 2018 was 11%
while demand for bag
was 2.7%.
In Q1’19 bulk demand
growth was at 3%
while bag declined at
-1%.
Government infrastructure
budget is significantly
increasing since 2015 along
with the 5 years National
Strategic Projects.
source: Indonesia Cement Association
source: Indonesia Cement Association
April 2019
2019
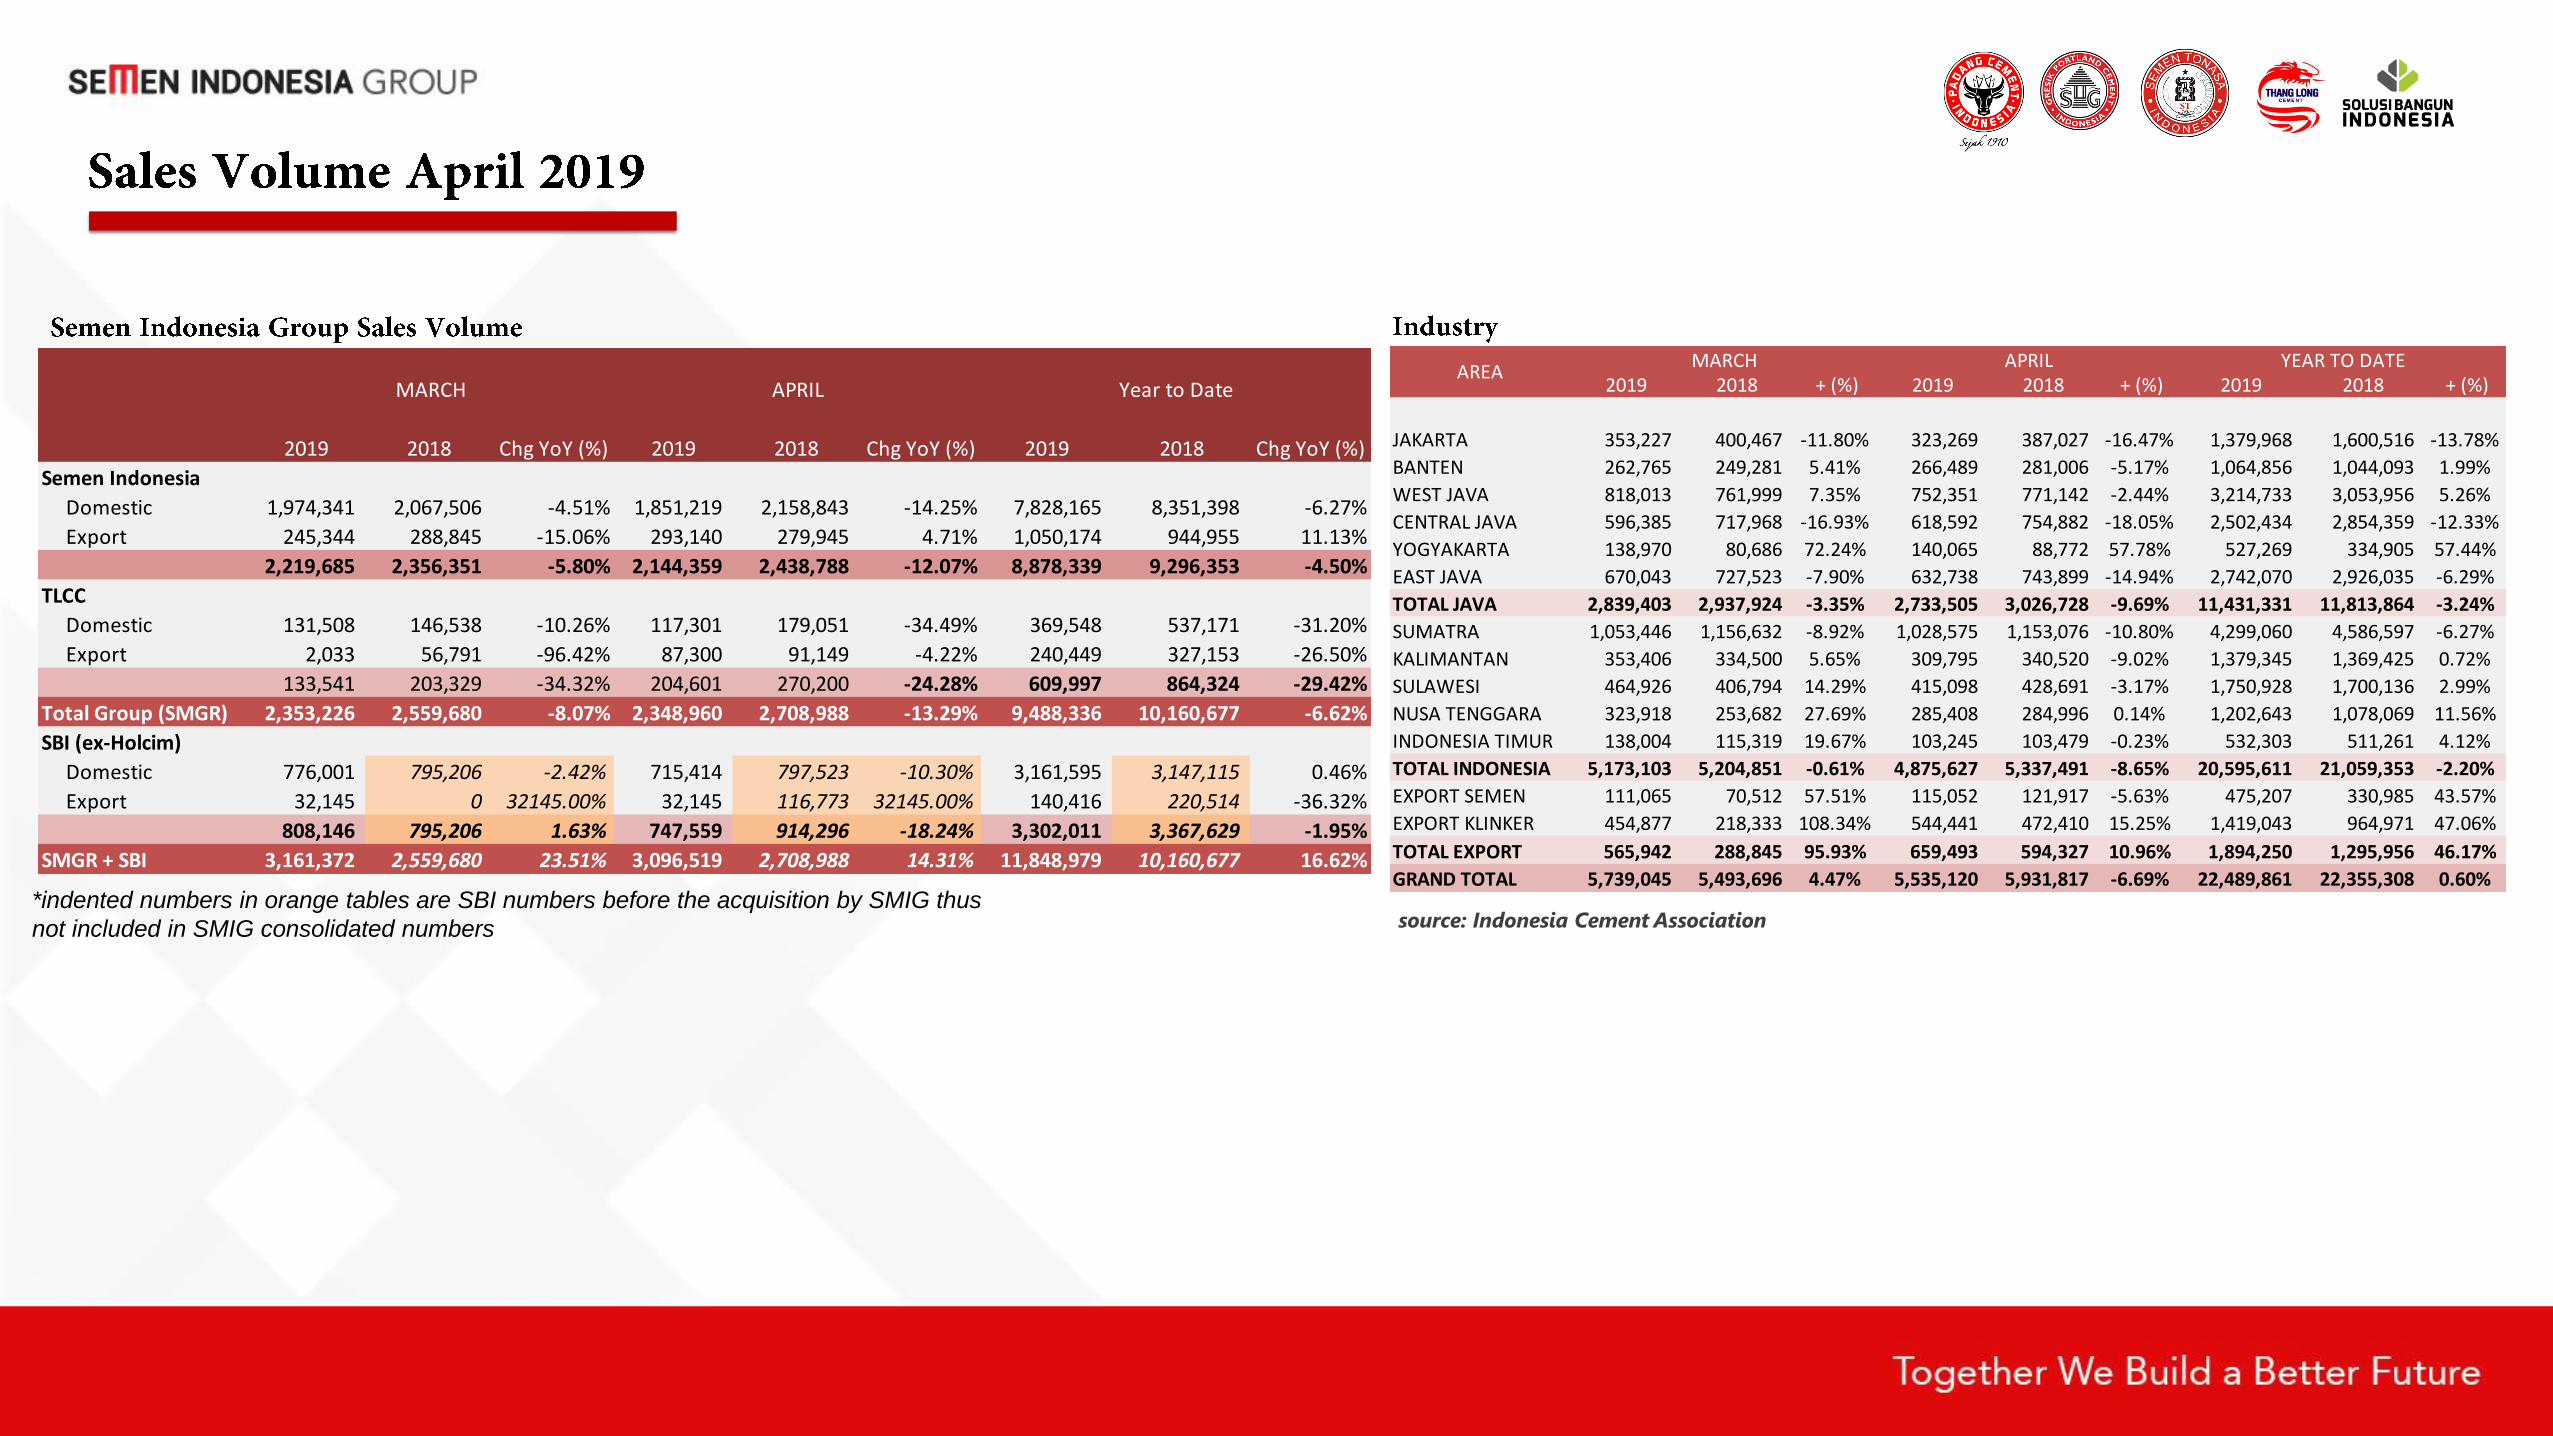
source: Indonesia Cement Association*indented numbers in orange tables are SBI numbers before the acquisition by SMIG thus
not included in SMIG consolidated numbers
2019 2018 Chg YoY (%) 2019 2018 Chg YoY (%) 2019 2018 Chg YoY (%)
Semen Indonesia
Domestic 1,974,341 2,067,506 -4.51% 1,851,219 2,158,843 -14.25% 7,828,165 8,351,398 -6.27%
Export 245,344 288,845 -15.06% 293,140 279,945 4.71% 1,050,174 944,955 11.13%
2,219,685 2,356,351 -5.80% 2,144,359 2,438,788 -12.07% 8,878,339 9,296,353 -4.50%
TLCC
Domestic 131,508 146,538 -10.26% 117,301 179,051 -34.49% 369,548 537,171 -31.20%
Export 2,033 56,791 -96.42% 87,300 91,149 -4.22% 240,449 327,153 -26.50%
133,541 203,329 -34.32% 204,601 270,200 -24.28% 609,997 864,324 -29.42%
Total Group (SMGR) 2,353,226 2,559,680 -8.07% 2,348,960 2,708,988 -13.29% 9,488,336 10,160,677 -6.62%
SBI (ex-Holcim)
Domestic 776,001 795,206 -2.42% 715,414 797,523 -10.30% 3,161,595 3,147,115 0.46%
Export 32,145 0 32145.00% 32,145 116,773 32145.00% 140,416 220,514 -36.32%
808,146 795,206 1.63% 747,559 914,296 -18.24% 3,302,011 3,367,629 -1.95%
SMGR + SBI 3,161,372 2,559,680 23.51% 3,096,519 2,708,988 14.31% 11,848,979 10,160,677 16.62%
APRILMARCH Year to Date 2019 2018 + (%) 2019 2018 + (%) 2019 2018 + (%)
JAKARTA 353,227 400,467 -11.80% 323,269 387,027 -16.47% 1,379,968 1,600,516 -13.78%
BANTEN 262,765 249,281 5.41% 266,489 281,006 -5.17% 1,064,856 1,044,093 1.99%
WEST JAVA 818,013 761,999 7.35% 752,351 771,142 -2.44% 3,214,733 3,053,956 5.26%
CENTRAL JAVA 596,385 717,968 -16.93% 618,592 754,882 -18.05% 2,502,434 2,854,359 -12.33%
YOGYAKARTA 138,970 80,686 72.24% 140,065 88,772 57.78% 527,269 334,905 57.44%
EAST JAVA 670,043 727,523 -7.90% 632,738 743,899 -14.94% 2,742,070 2,926,035 -6.29%
TOTAL JAVA 2,839,403 2,937,924 -3.35% 2,733,505 3,026,728 -9.69% 11,431,331 11,813,864 -3.24%
SUMATRA 1,053,446 1,156,632 -8.92% 1,028,575 1,153,076 -10.80% 4,299,060 4,586,597 -6.27%
KALIMANTAN 353,406 334,500 5.65% 309,795 340,520 -9.02% 1,379,345 1,369,425 0.72%
SULAWESI 464,926 406,794 14.29% 415,098 428,691 -3.17% 1,750,928 1,700,136 2.99%
NUSA TENGGARA 323,918 253,682 27.69% 285,408 284,996 0.14% 1,202,643 1,078,069 11.56%
INDONESIA TIMUR 138,004 115,319 19.67% 103,245 103,479 -0.23% 532,303 511,261 4.12%
TOTAL INDONESIA 5,173,103 5,204,851 -0.61% 4,875,627 5,337,491 -8.65% 20,595,611 21,059,353 -2.20%
EXPORT SEMEN 111,065 70,512 57.51% 115,052 121,917 -5.63% 475,207 330,985 43.57%
EXPORT KLINKER 454,877 218,333 108.34% 544,441 472,410 15.25% 1,419,043 964,971 47.06%
TOTAL EXPORT 565,942 288,845 95.93% 659,493 594,327 10.96% 1,894,250 1,295,956 46.17%
GRAND TOTAL 5,739,045 5,493,696 4.47% 5,535,120 5,931,817 -6.69% 22,489,861 22,355,308 0.60%
AREAAPRILMARCH YEAR TO DATE
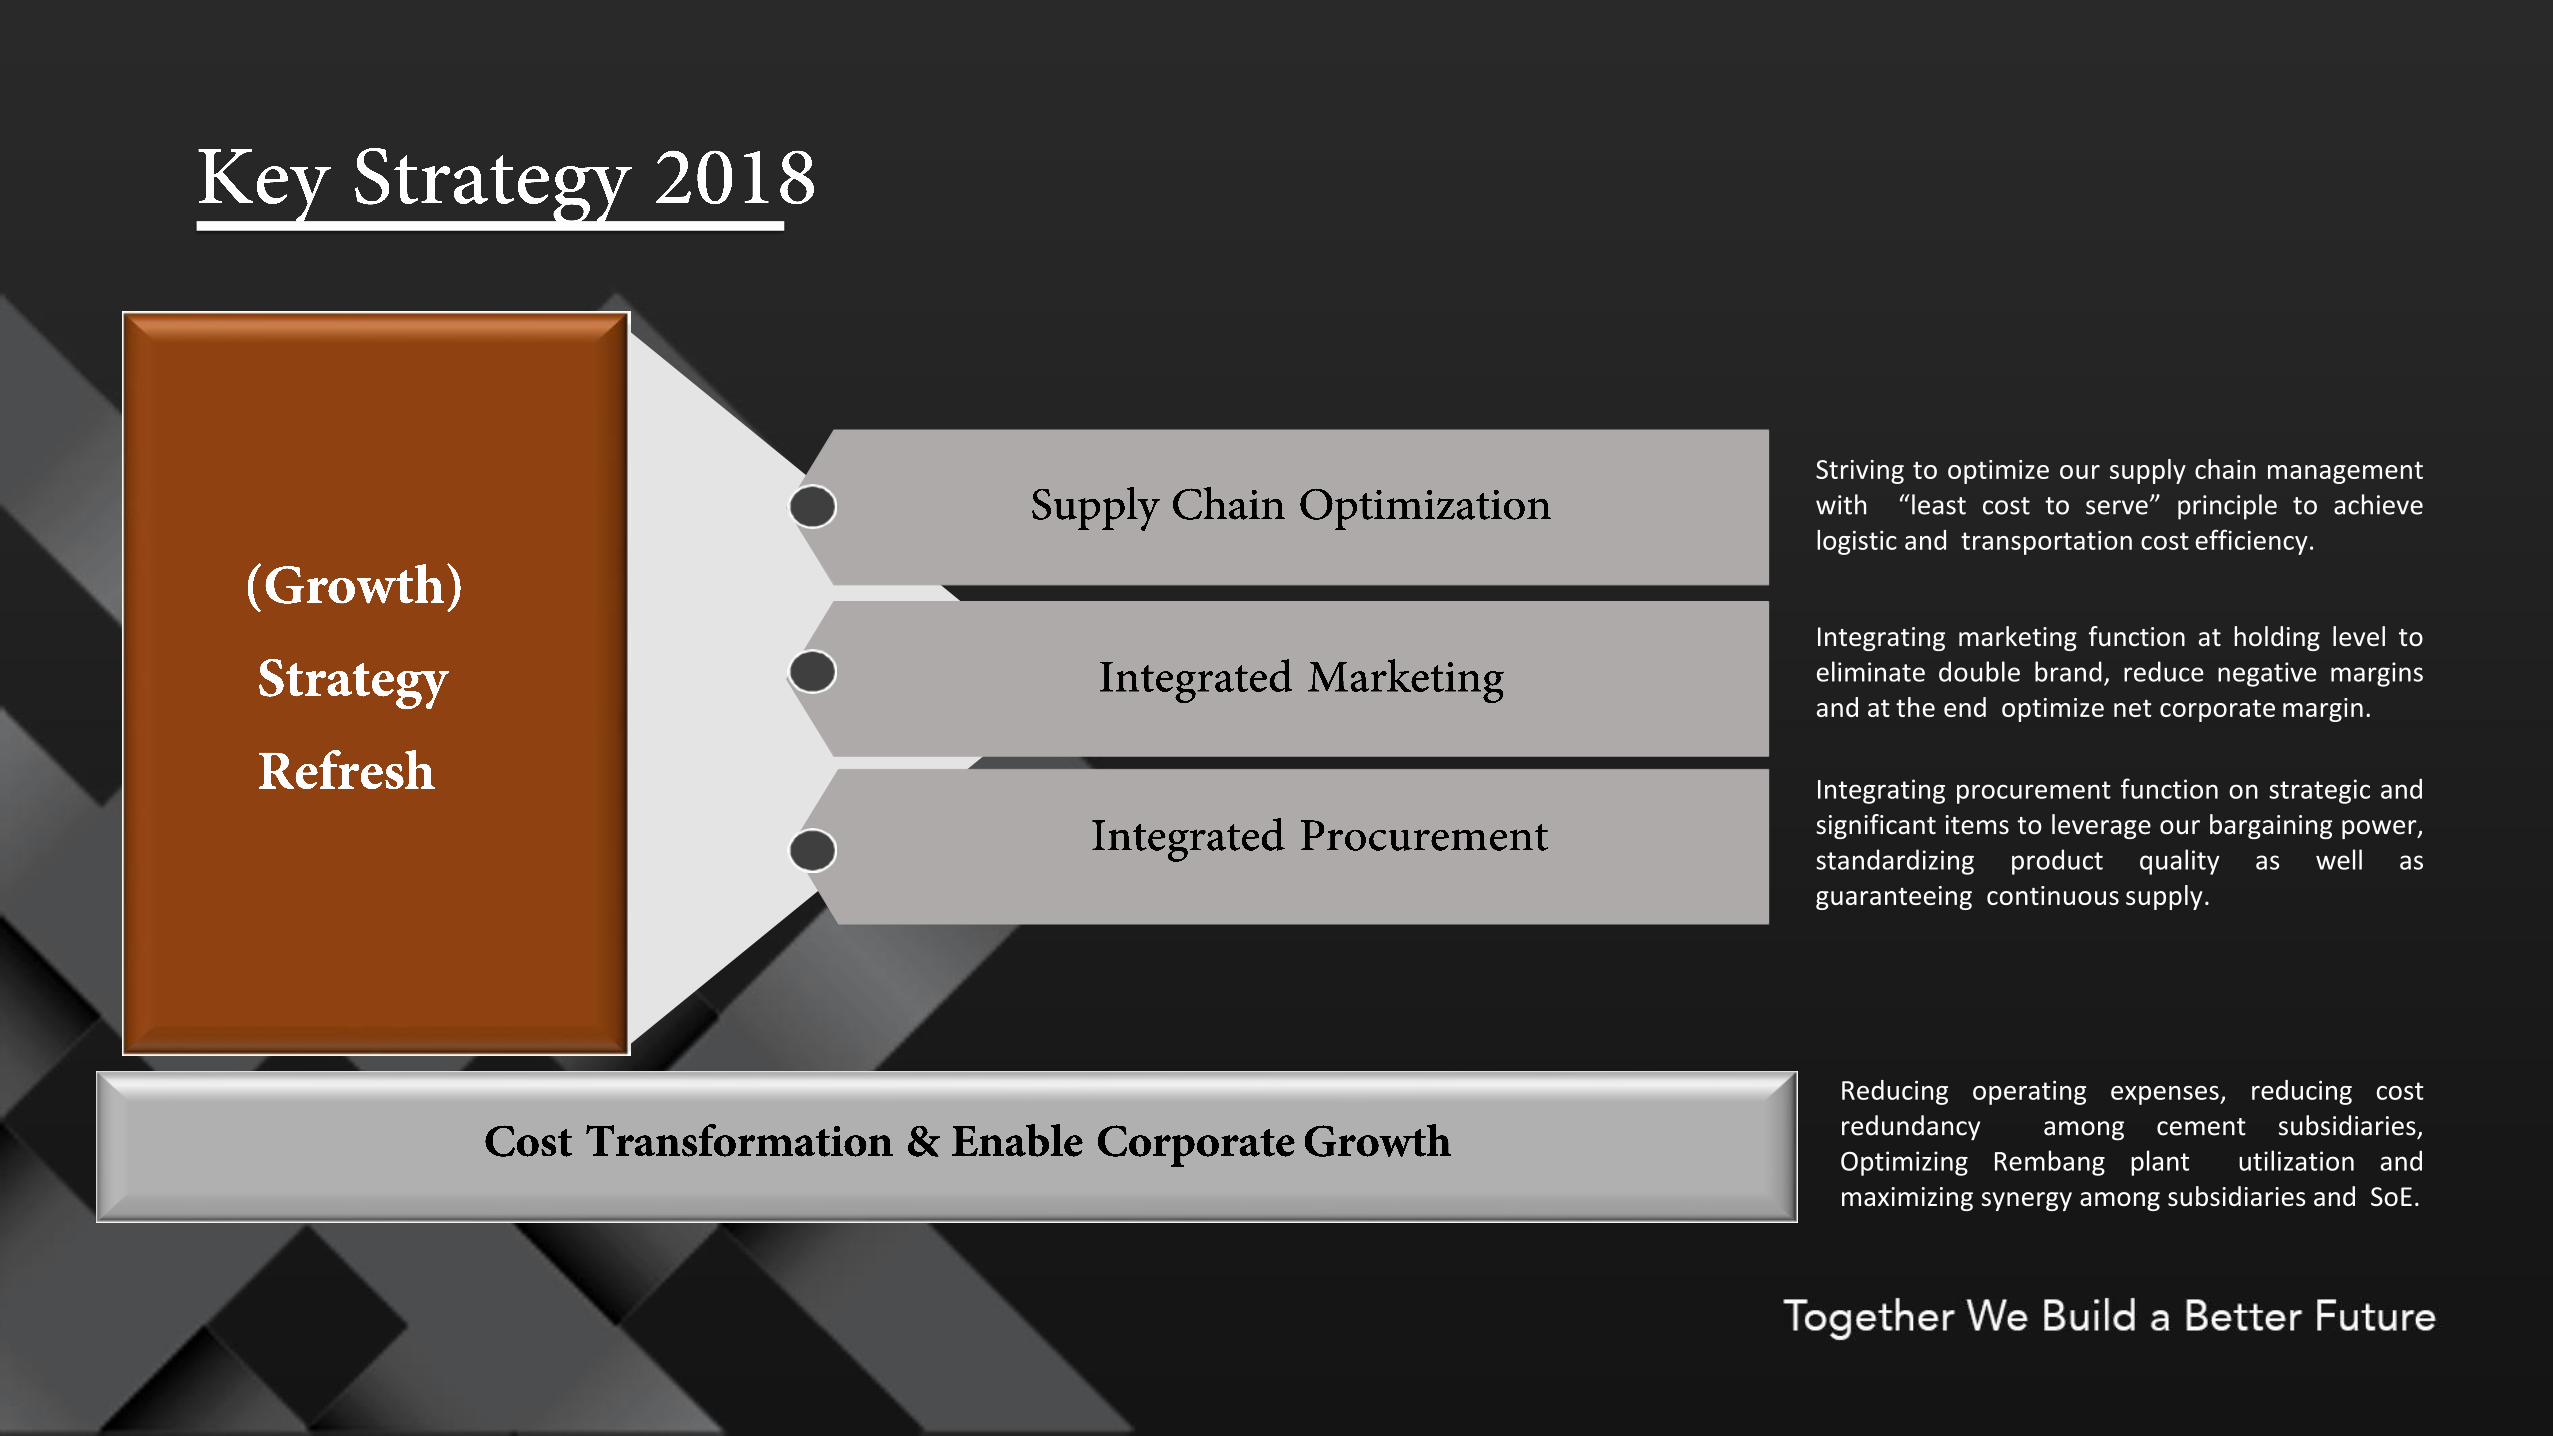
Striving to optimize our supply chain managementwith “least cost to serve” principle to achievelogistic and transportation cost efficiency.
Integrating marketing function at holding level toeliminate double brand, reduce negative marginsand at the end optimize net corporate margin.
Integrating procurement function on strategic andsignificant items to leverage our bargaining power,standardizing product quality as well asguaranteeing continuous supply.
Reducing operating expenses, reducing costredundancy among cement subsidiaries,Optimizing Rembang plant utilization andmaximizing synergy among subsidiaries and SoE.
8
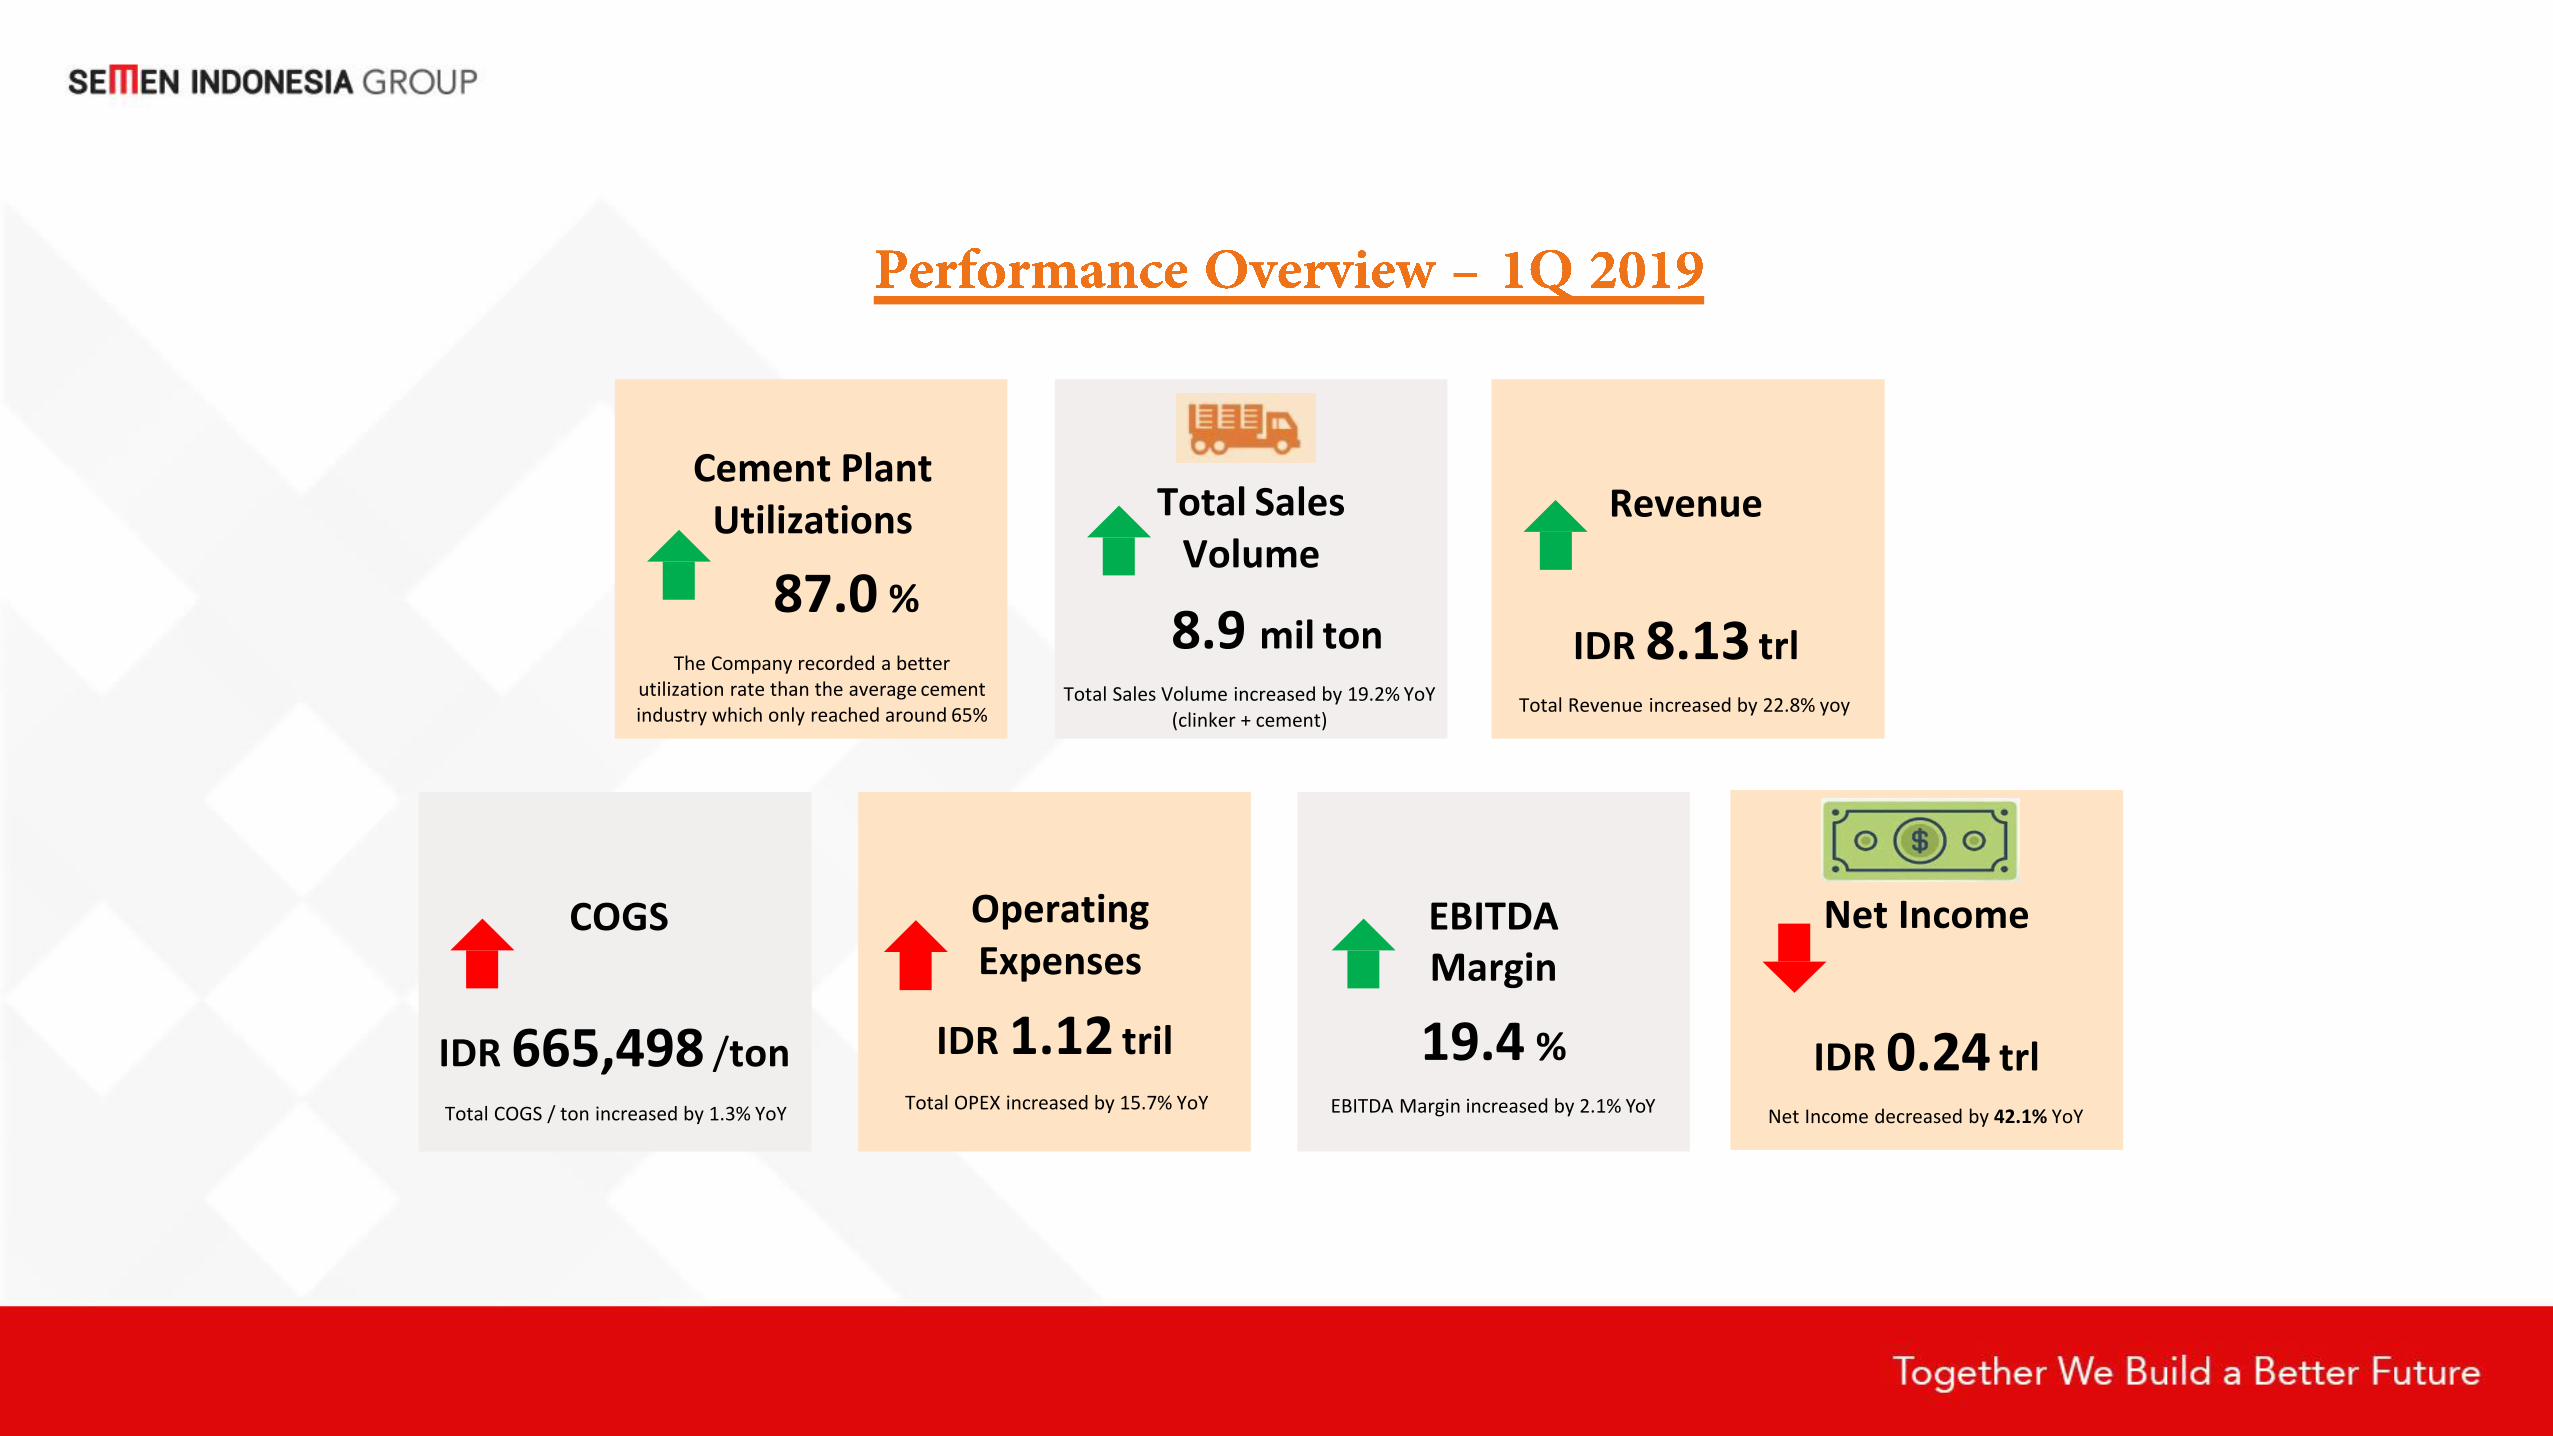
Total Sales Volume
8.9 mil tonTotal Sales Volume increased by 19.2% YoY
(clinker + cement)
Revenue
IDR 8.13 trlTotal Revenue increased by 22.8% yoy
Cement Plant Utilizations
87.0 %
The Company recorded a better utilization rate than the average cement industry which only reached around 65%
Operating Expenses
IDR 1.12 tril
Total OPEX increased by 15.7% YoY
COGS
IDR 665,498 /ton
Total COGS / ton increased by 1.3% YoY
Net Income
IDR 0.24 trlNet Income decreased by 42.1% YoY
EBITDAMargin
19.4 %EBITDA Margin increased by 2.1% YoY
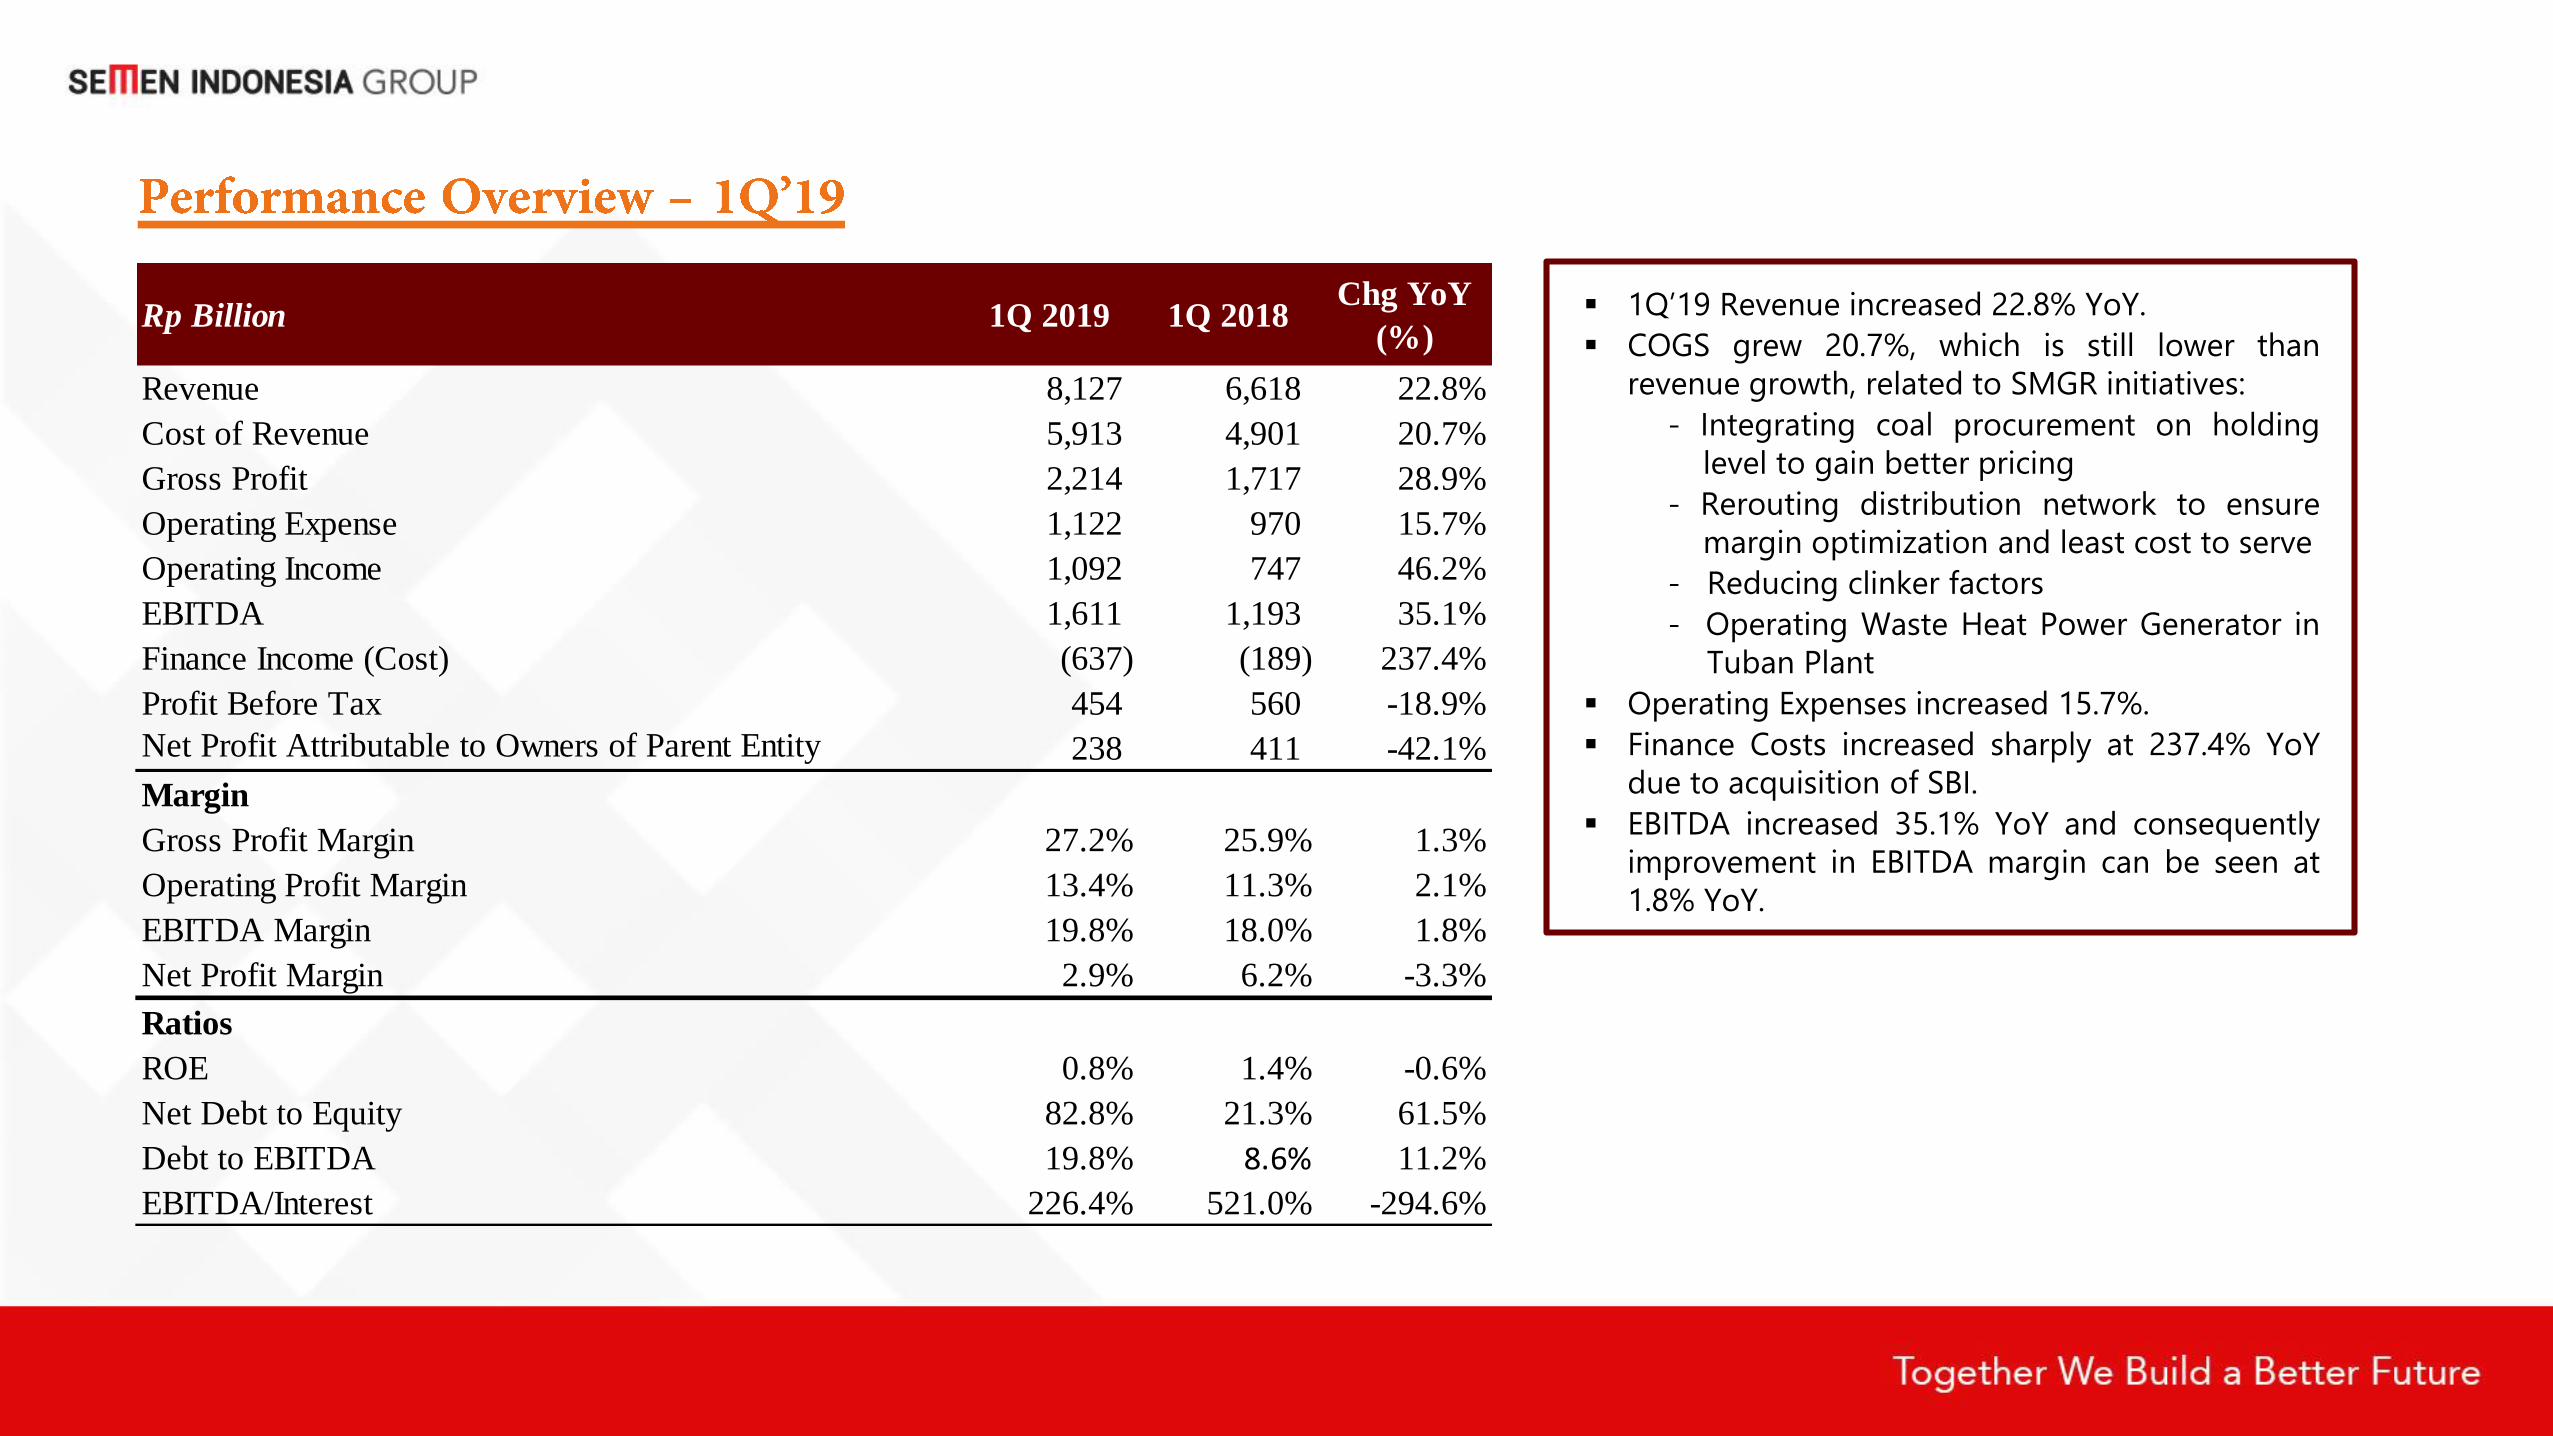
1Q’19 Revenue increased 22.8% YoY.
COGS grew 20.7%, which is still lower than
revenue growth, related to SMGR initiatives:
- Integrating coal procurement on holding
level to gain better pricing
- Rerouting distribution network to ensure
margin optimization and least cost to serve
- Reducing clinker factors
- Operating Waste Heat Power Generator in
Tuban Plant
Operating Expenses increased 15.7%.
Finance Costs increased sharply at 237.4% YoY
due to acquisition of SBI.
EBITDA increased 35.1% YoY and consequently
improvement in EBITDA margin can be seen at
1.8% YoY.
Rp Billion 1Q 2019 1Q 2018Chg YoY
(%)
Revenue 8,127 6,618 22.8%
Cost of Revenue 5,913 4,901 20.7%
Gross Profit 2,214 1,717 28.9%
Operating Expense 1,122 970 15.7%
Operating Income 1,092 747 46.2%
EBITDA 1,611 1,193 35.1%
Finance Income (Cost) (637) (189) 237.4%
Profit Before Tax 454 560 -18.9%
Net Profit Attributable to Owners of Parent Entity 238 411 -42.1%
Margin
Gross Profit Margin 27.2% 25.9% 1.3%
Operating Profit Margin 13.4% 11.3% 2.1%
EBITDA Margin 19.8% 18.0% 1.8%
Net Profit Margin 2.9% 6.2% -3.3%
Ratios
ROE 0.8% 1.4% -0.6%
Net Debt to Equity 82.8% 21.3% 61.5%
Debt to EBITDA 19.8% 8.6% 11.2%
EBITDA/Interest 226.4% 521.0% -294.6%

5,032 3,989
2,847 3,638
5,246 6,049
2014 2015 2016 2017 2018 1Q 2019
Cash Balance (IDRbn)
3,913 3,999 6,260 10,019 9,864
31,929
2014 2015 2016 2017 2018 1Q 2019
Total Interest Bearing Debt (IDRbn)
20.20 19.14
6.48 6.86
2.26
2015 2016 2017 2018 1Q 2019
EBITDA/Interest
0.5 0.5 0.9 2.0 1.5
19.8
2014 2015 2016 2017 2018 1Q 2019
Debt/EBITDA
-0.5%0.0%
11.2%22.8% 20.9%
82.8%
2014 2015 2016 2017 2018 1Q 2019
Net Debt/Equity
15% 20%35% 32%
102%
2015 2016 2017 2018 1Q 2019
Gross Debt/Equity
Source: Internal SMIG
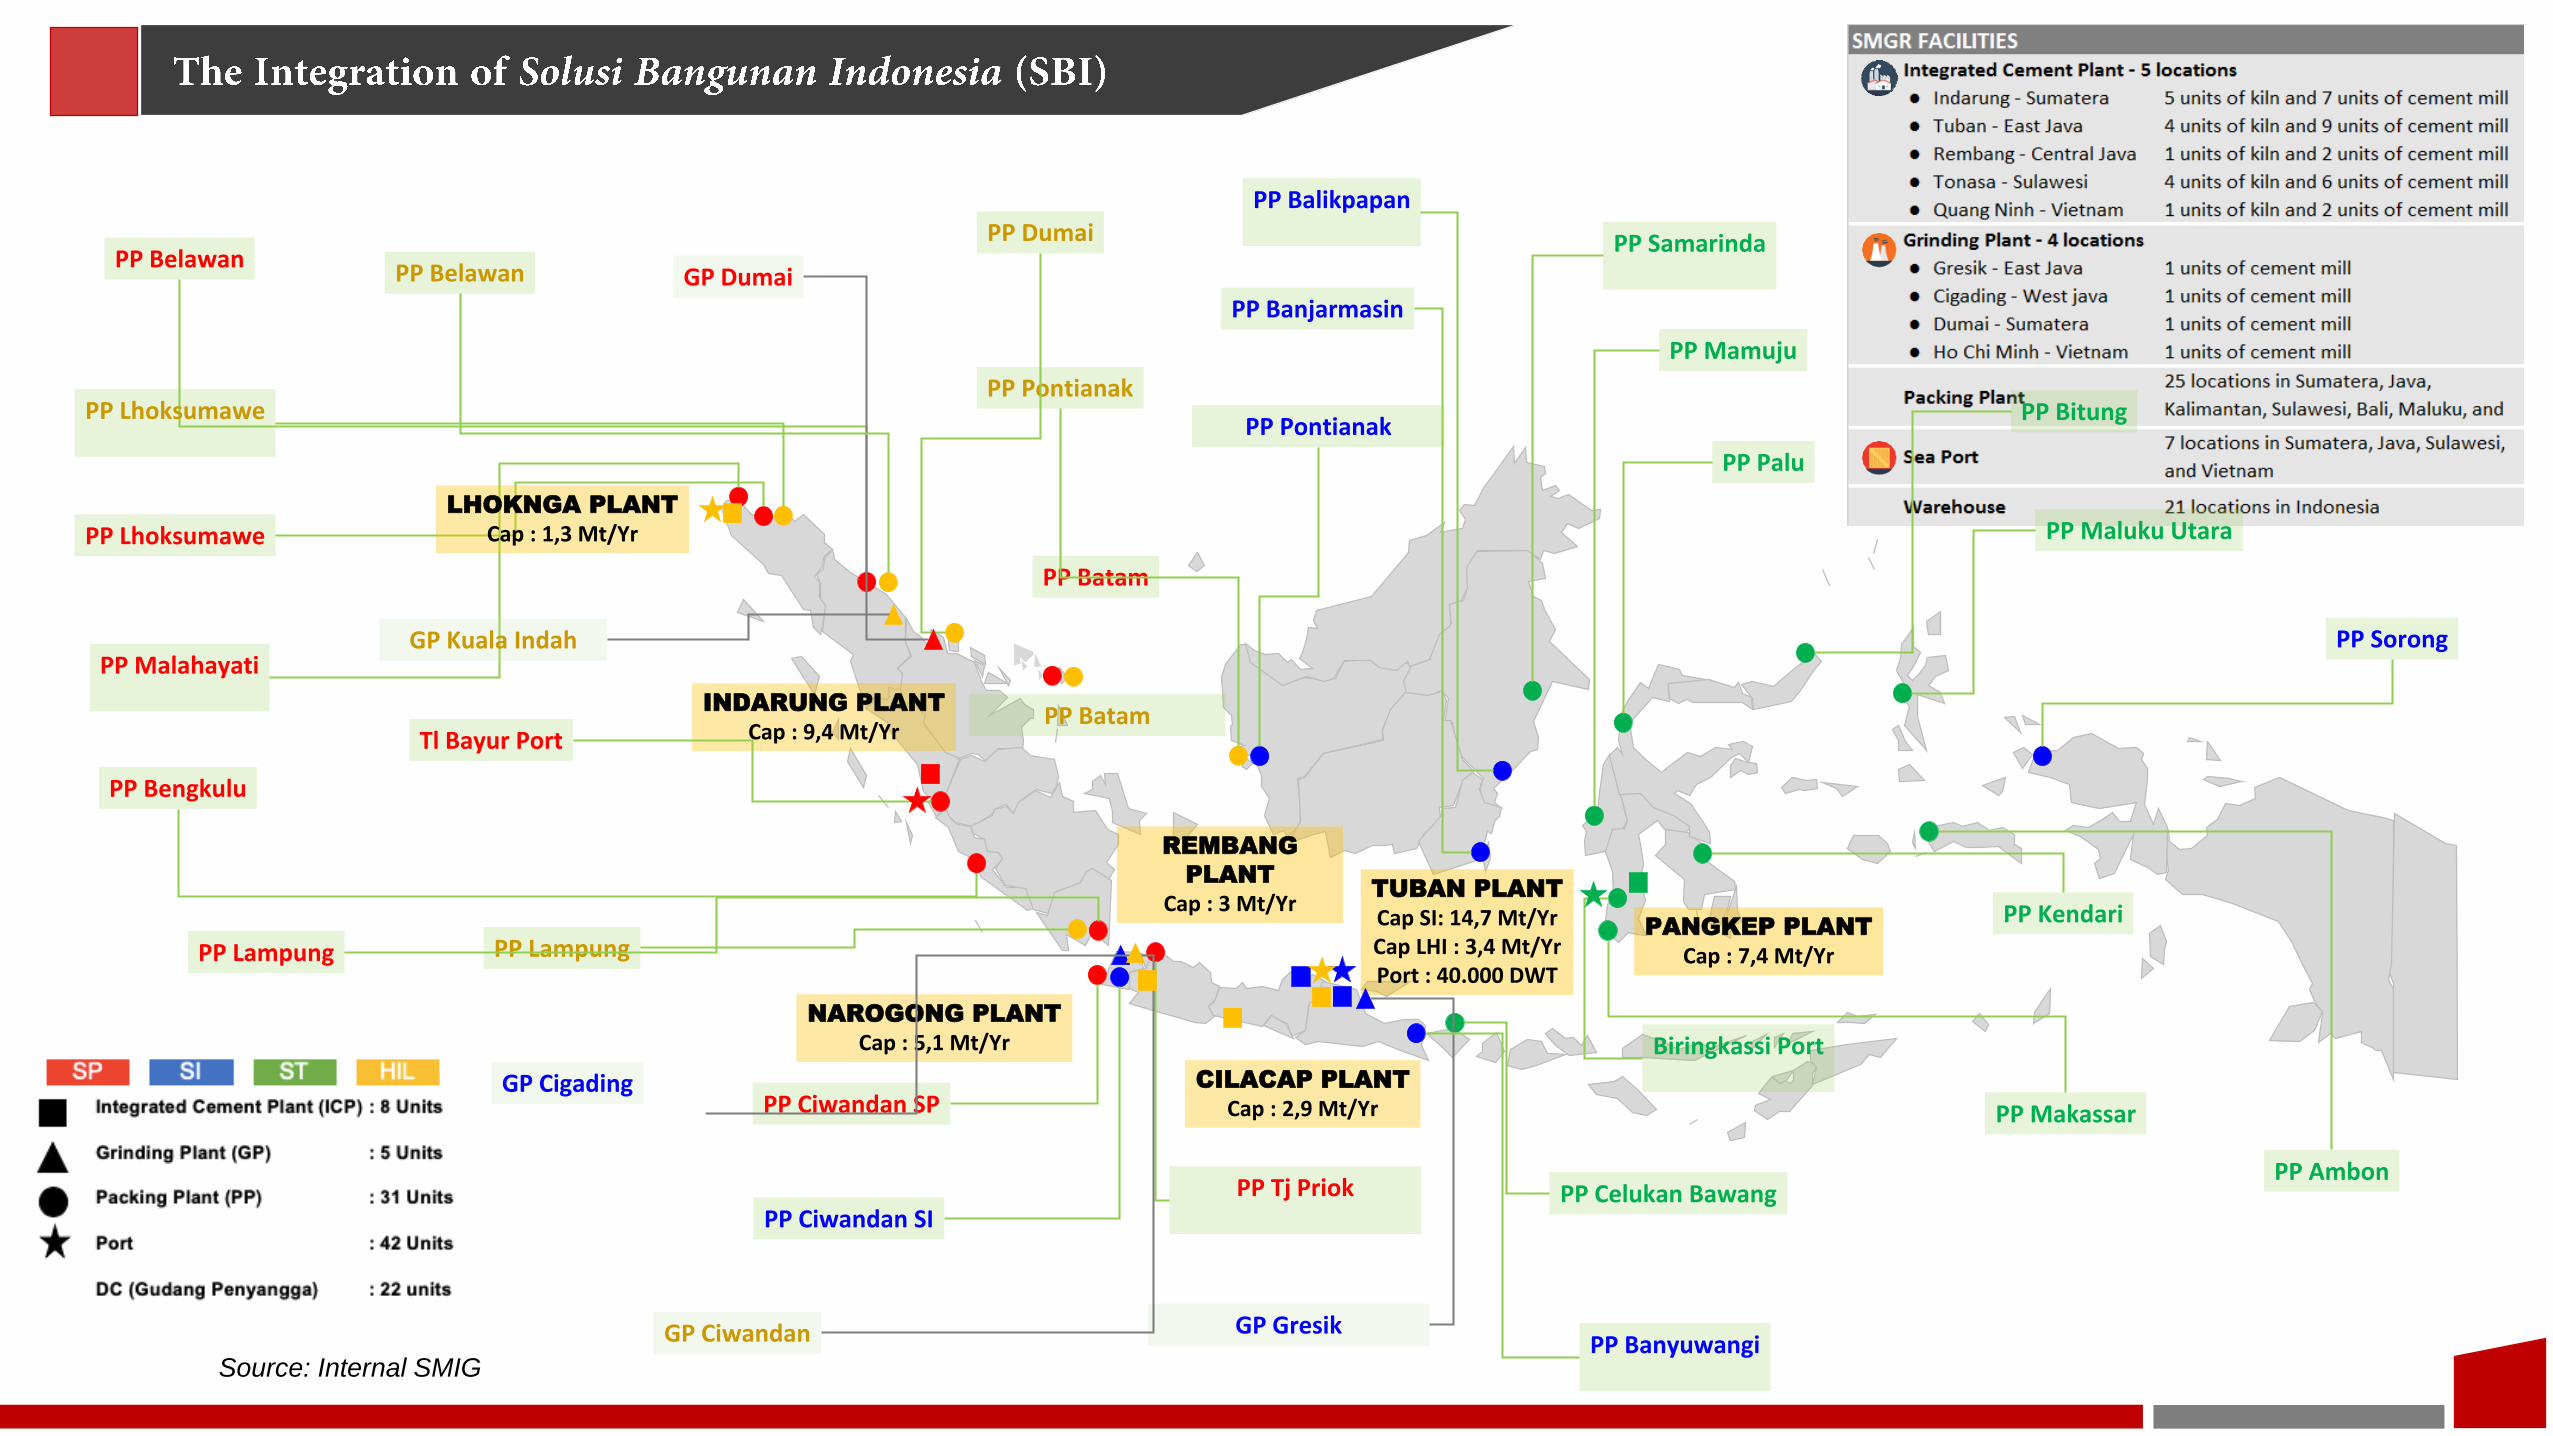
TUBAN PLANT
Cap SI: 14,7 Mt/YrCap LHI : 3,4 Mt/YrPort : 40.000 DWT
INDARUNG PLANT
Cap : 9,4 Mt/Yr
GP Dumai
GP Gresik
PP Lhoksumawe
PP Malahayati
PP Batam
Tl Bayur Port
PP Lampung
PP Pontianak
PP Samarinda
PP Banjarmasin
PP Balikpapan
PP Bitung
PP Palu
PP Mamuju
Biringkassi Port
PP Makassar
PP Kendari
PP Sorong
PP Ambon
PP Banyuwangi
PP Celukan Bawang
PANGKEP PLANT
Cap : 7,4 Mt/Yr
PP Belawan
PP Tj Priok
PP Ciwandan SP
PP Ciwandan SI
PP Maluku Utara
GP Ciwandan
PP Bengkulu
REMBANG
PLANT
Cap : 3 Mt/Yr
LHOKNGA PLANT
Cap : 1,3 Mt/Yr
NAROGONG PLANT
Cap : 5,1 Mt/Yr
CILACAP PLANT
Cap : 2,9 Mt/Yr
PP Lhoksumawe
PP Belawan
PP Pontianak
PP Dumai
PP Batam
GP Kuala Indah
PP Lampung
GP Cigading
IMPORTANT NOTICE
THIS PRESENTATION IS NOT AND DOES NOT CONSTITUTE OR FORM PART OF, AND IS NOT MADE IN CONNECTION WITH, ANY OFFERFOR SALE OR SUBSCRIPTION OF OR SOLICITATION, RECOMMENDATION OR INVITATION OF ANY OFFER TO BUY OR SUBSCRIBE FORANY SECURITIES NOR SHALL IT OR ANY PART OF IT FORM THE BASIS OF OR BE RELIED ON IN CONNECTION WITH ANY CONTRACT,COMMITMENT OR INVESTMENT DECISION WHATSOEVER.
THE SLIDES USED IN THIS PRESENTATION ARE STRICTLY CONFIDENTIAL AND HAVE BEEN PREPARED AS A SUPPORT FOR ORALDISCUSSIONS ONLY. THE INFORMATION CONTAINED IN THIS PRESENTATION IS BEING PRESENTED TO YOU SOLELY FOR YOURINFORMATION AND MAY NOT BE REPRODUCED OR REDISTRIBUTED TO ANY OTHER PERSON, IN WHOLE OR IN PART.
This presentation includes forward-looking statements, which are based on current expectations and forecast about future events. Such statements involve known / unknown risks uncertainties and other factors, which could cause actual results to differ materially from historical results or those
anticipated. Such factors include, among others:
● economic, social and political conditions in Indonesia, and the impact such conditions have on construction and infrastructure spending in
Indonesia;
● the effects of competition;
● the effects of changes in laws, regulations, taxation or accounting standards or practices;
● acquisitions, divestitures and various business opportunities that we may pursue;
● changes or volatility in inflation, interest rates and foreign exchange rates;
● accidents, natural disasters or outbreaks of infectious diseases, such as avian influenza, in our markets;
● labor unrest or other similar situations; and
● the outcome of pending or threatened litigation.
We can give no assurance that our expectations will be attained.
DISCLAIMER
The information contained in this report has been taken from sources which we deem reliable. However, none of PT Semen Indonesia (Persero) Tbk and/or its affiliated companies and/or their respective employees and/or agents make any representation or warranty (express or implied) or
accepts any responsibility or liability as to, or in relation to, the accuracy or completeness of the information and opinions contained in this report or as to any information contained in this report or any other such information or opinions remaining unchanged after the issue thereof.
We expressly disclaim any responsibility or liability (express or implied) of PT Semen Indonesia (Persero) Tbk, its affiliated companies and their respective employees and agents whatsoever and howsoever arising (including, without limitation for any claim, proceedings, action, suits, losses, expenses, damages or costs) which may be brought against or suffered by any person as a result of acting in reliance upon the whole or any part
of the contents of this report and neither PT Semen Indonesia (Persero) Tbk, its affiliated companies or their respective employees or agents accepts liability for any errors, omission or mis-statements, negligent or otherwise, in the report and any liability in respect of the report or any
inaccuracy therein or omission therefrom which might otherwise arise is hereby expresses disclaimed.