InspireData™ User's Manual - School District 41sd41.bc.ca/learning_tech/inspireData/User's...
153
Transcript of InspireData™ User's Manual - School District 41sd41.bc.ca/learning_tech/inspireData/User's...


ii InspireData™ User's Manual
Credits InspireData™ is developed by TERC and published by Inspiration Software®, Inc.
Created by Chris Hancock
Design Chris Hancock and Scot Osterweil
Engineering Clozure Associates: Gary Byers, Jeremy Jones, Mark Nahabedian, Gary Palter, Gail Zacharias; Inspiration Software: Peter Wong
Management & Administration Don Helfgott, Kate Kennedy, David Libby, Glen Secor, Mona Westhaver
Quality Assurance Elizabeth Butcher, Scott Daniels, Kim Russell, Gina Shankland, Geoff Unger, Eric West, Sue Williamson
Product Management John Cromett
Databases, Examples, and Classroom Projects Sue Collins, Bob Coulter, Elise Hooper, Linnea Johnsson, Peggy MacDonald, Caren Normandin, Gina Shankland, Lori Deuchar Yum
Documentation and Help Audrey Brislin, Charis Loeung, Adrian Quan, Mary Beth Saddoris
Icon Library Adrian Quan
Classroom Piloting and Research Ricky Carter, Sally Crissman, Nick Haddad, Katherine Paget, Elizabeth Rowe; Teachers: Jennifer Burgin, Rick Comeau, Deb Gallagher, Liz Gelotte, Jan Preheim, Myra Sussman, Kathy Vandiver
Special Thanks to: Kathy Jean, Tom Plati, Diamond Middle School, Lexington, MA; Lincoln Elementary School, Brookline, MA
InspireData is implemented in LispWorks LISP. Special thanks to Martin Simmons of Lispworks, Ltd. Originally funded under a grant from the National Science Foundation (Grant No. ESI-0242626). Any opinions, findings and conclusions or recommendations expressed in this material are those of the author(s) and do not necessarily reflect the views of the National Science Foundation. TERC is a leading educational research and development lab committed to improving mathematics and science teaching and learning. © 2006 Inspiration Software, Inc. © 2006 TERC, Inc. Font engine © The FreeType Project 1996-2002 Inspiration Software® is a registered trademark, and InspireData™ and the InspireData design mark are trademarks of Inspiration Software, Inc. Other brands and trademarks are the property of their respective owners.
Table of Contents iii
Table of Contents
Chapter 1: Getting started with InspireData™.......................................... 9 Learning InspireData ..................................................................................................................................................9 Customer Service......................................................................................................................................................10 Starting InspireData ..................................................................................................................................................10
About the InspireData Starter screen .....................................................................................................................11 Quitting InspireData .................................................................................................................................................11 About the InspireData views.....................................................................................................................................12
Table View.............................................................................................................................................................12 Plot View ...............................................................................................................................................................13
Uses of tables............................................................................................................................................................14 Uses of plots .............................................................................................................................................................15
Venn plot ...............................................................................................................................................................15 Stack plot ...............................................................................................................................................................16 Pie plot ...................................................................................................................................................................17 Axis plot.................................................................................................................................................................18
Time series data ........................................................................................................................................................19
Chapter 2: Creating a table................................................................... 20 Tools for creating tables ...........................................................................................................................................22 Working with fields ..................................................................................................................................................23
Adding a field ........................................................................................................................................................23 Selecting a field .....................................................................................................................................................23 Renaming a field....................................................................................................................................................24 Setting the data type and formatting of a field .......................................................................................................25 Adding a note to a field..........................................................................................................................................32 Deleting a field.......................................................................................................................................................32 Resizing a field ......................................................................................................................................................33 Reordering fields....................................................................................................................................................33 Copying and pasting a field ...................................................................................................................................33 Creating new fields using copied data ...................................................................................................................34 Overwriting the data in a field with copied data ....................................................................................................34
Working with records ...............................................................................................................................................34 Adding a record .....................................................................................................................................................34 Selecting a record...................................................................................................................................................35 Selecting multiple records......................................................................................................................................35 Adding a note to a record.......................................................................................................................................35 Deleting a record....................................................................................................................................................36 Copying and pasting a record.................................................................................................................................36 Duplicating a record...............................................................................................................................................36 Creating new records using copied data.................................................................................................................37
Changing the name and color scheme of a table.......................................................................................................37 Copying and pasting an entire table..........................................................................................................................37 Undoing a change to your table ................................................................................................................................38

iv InspireData™ User's Manual
Chapter 3: Entering and editing data..................................................... 39 Selecting a cell..........................................................................................................................................................39
Selecting multiple cells ..........................................................................................................................................39 Entering data into a cell ............................................................................................................................................40
Editing data in a cell ..............................................................................................................................................40 Clearing the data in a cell.......................................................................................................................................41 Filling multiple fields with repeating data .............................................................................................................41 Filling multiple records with repeating data ..........................................................................................................42 Adding a note to a cell ...........................................................................................................................................43
Defining the data in a field using a formula..............................................................................................................43 Collecting data using the Circle Game .....................................................................................................................45 Adding a timestamp to a new record ........................................................................................................................46 Sorting records in a table ..........................................................................................................................................47
Chapter 4: Entering data using a Questionnaire .................................... 48 Entering data using a Questionnaire .........................................................................................................................48 Customizing a Questionnaire....................................................................................................................................50
Changing the wording of a question on a Questionnaire .......................................................................................50 Changing the title of a Questionnaire ....................................................................................................................51 Excluding a field from a Questionnaire .................................................................................................................52 Requiring an answer to a question in a Questionnaire ...........................................................................................53
Conducting a survey using a Questionnaire..............................................................................................................54 Administering a Questionnaire on a single computer ............................................................................................54 Administering a Questionnaire on multiple computers..........................................................................................55
Chapter 5: Using icons to visually represent records .............................. 56 Drawing icons using the Icon Editor ........................................................................................................................56
About the Icon Editor tools....................................................................................................................................58 Selecting a color in the Icon Editor........................................................................................................................59
Retrieving an icon from the Icon Library .................................................................................................................60 Importing a photograph or other image file as an icon .............................................................................................60 Selecting areas of the Canvas in the Icon Editor ......................................................................................................61 Copying and pasting an icon in Table View.............................................................................................................61 Changing the default icon of a table .........................................................................................................................62
Chapter 6: Organizing data using multiple tables.................................. 63 Adding a new table to your document ......................................................................................................................63
Switching between tables in a document with multiple tables...............................................................................63 Renaming a table ...................................................................................................................................................64 Duplicating an existing table .................................................................................................................................64
Linking data in multiple tables .................................................................................................................................65 Creating a link field ...............................................................................................................................................65 Identifying and changing the record ID of a table .................................................................................................66

Table of Contents v
Chapter 7: Organizing data using structured fields................................ 67 Using list fields .........................................................................................................................................................67
Creating a list field.................................................................................................................................................68 Using series fields.....................................................................................................................................................69
Creating a series field.............................................................................................................................................69 Using multi-series fields ...........................................................................................................................................71
Creating a multi-series field...................................................................................................................................71 Converting a series field into a multi-series field ..................................................................................................72
Working with series and multi-series columns .........................................................................................................73 Adding a new column to a series or multi-series field...........................................................................................73 Duplicating a column in a series or multi-series field............................................................................................73 Renaming a column in a series or multi-series field ..............................................................................................73 Changing the pattern of column headings in a series or multi-series field.............................................................74 Reordering columns in a series or multi-series field..............................................................................................74 Deleting a column in a series or multi-series field.................................................................................................74
Working with multi-series subfields.........................................................................................................................75 Adding a new subfield to a multi-series field ........................................................................................................75 Selecting a subfield in a multi-series field .............................................................................................................75 Duplicating a subfield in a multi-series field .........................................................................................................75 Renaming a subfield in a multi-series field............................................................................................................76 Changing the data type or formatting of a subfield in a multi-series field.............................................................77 Reordering subfields in a multi-series field ...........................................................................................................77 Deleting a subfield from a multi-series field..........................................................................................................77
Using subtable fields.................................................................................................................................................78 Creating a subtable field ........................................................................................................................................78 Adding a subfield to a subtable..............................................................................................................................78 Adding a subrecord to a subtable...........................................................................................................................78 Expanding and collapsing a subtable .....................................................................................................................79
Deciding which kind of structured field to use .........................................................................................................80 Converting structured fields......................................................................................................................................81 Moving series columns and subfields in and out of structured fields .......................................................................81
Chapter 8: Creating plots ...................................................................... 82 Tools for creating plots .............................................................................................................................................82
The Toolbar in Plot View ......................................................................................................................................83 Creating a Free plot................................................................................................................................................84
Chapter 9: Making a Venn plot ............................................................. 85 Creating a Venn plot .................................................................................................................................................86 Changing the parameters of a Venn loop..................................................................................................................86 Adding an additional Venn loop to a Venn plot .......................................................................................................87

vi InspireData™ User's Manual
Chapter 10: Making a Stack plot........................................................... 88 Creating a Stack plot.................................................................................................................................................89 Reassigning a field to an axis ...................................................................................................................................89 Assigning a formula to an axis .................................................................................................................................90 Changing the axis type in a Stack plot......................................................................................................................91 Reordering categories in a Stack plot .......................................................................................................................92 Combining categories into a supercategory in a Stack plot ......................................................................................92
Removing a category from a supercategory in a Stack plot...................................................................................93 Renaming a supercategory.....................................................................................................................................93 Dissolving a supercategory ....................................................................................................................................93
Changing the maximum and minimum values of a range axis .................................................................................93 Changing the range step of a range axis ...................................................................................................................94 Changing the orientation of a Stack plot...................................................................................................................94 Creating a parallel Stack plot....................................................................................................................................94 Creating a mirror Stack plot......................................................................................................................................95
Chapter 11: Making an Axis plot .......................................................... 96 Creating an Axis plot ................................................................................................................................................96 Reassigning a field to an axis ...................................................................................................................................97 Assigning a formula to an axis .................................................................................................................................97 Changing the axis type in an Axis plot .....................................................................................................................99 Changing the maximum and minimum values of a range axis .................................................................................99 Changing the range step of a range axis .................................................................................................................100 Changing the maximum and minimum values of a continuous axis.......................................................................100 Creating a box plot in an Axis plot .........................................................................................................................101
Applying the IQR method to a box plot...............................................................................................................102
Chapter 12: Making a Pie plot ............................................................ 103 Creating a Pie plot ..................................................................................................................................................104 Displaying multiple pies in a Pie plot .....................................................................................................................104
Chapter 13: Plotting series and multi-series fields................................ 105 Assigning a series field to an axis...........................................................................................................................106 Using the Series Display controls ...........................................................................................................................107 Creating a time graph using Instant Plot.................................................................................................................107
Displaying individual lines in a time graph .........................................................................................................108 Displaying mean or median group lines in a time graph......................................................................................109 Subdividing mean or median group lines in a time graph....................................................................................110
Showing every value in a series-based Axis plot....................................................................................................110

Table of Contents vii
Chapter 14: Working with plots .......................................................... 111 Viewing previously created plots with the Back and Forward buttons...................................................................111 Viewing all of a record’s data in Plot View............................................................................................................112 Changing the size of the icons in a plot ..................................................................................................................112 Selecting items in Plot View...................................................................................................................................113
Selecting icons in Plot View ................................................................................................................................113 Selecting regions of a plot....................................................................................................................................113 Selecting an area of a continuous axis .................................................................................................................113 Selecting a category or range in Plot View..........................................................................................................114
Hiding specific icons in Plot View .........................................................................................................................114 Zooming in on selected icons in a plot.................................................................................................................115 Hiding or excluding selected icons in a plot ........................................................................................................115 Hiding icons using a formula ...............................................................................................................................115 Zooming out and restoring hidden icons..............................................................................................................116
Plotting link fields...................................................................................................................................................116 Clearing a plot.........................................................................................................................................................117 About No Data areas...............................................................................................................................................117
Chapter 15: Coloring, marking and annotating plots ........................... 118 Creating a plot title .................................................................................................................................................118 Creating notes in Plot View....................................................................................................................................118 Labeling and marking icons....................................................................................................................................119
Labeling icons in Plot View.................................................................................................................................119 Labeling selected icons in Plot View...................................................................................................................120 Marking icons ......................................................................................................................................................120
Coloring icons by field to add information to a plot...............................................................................................121 Coloring icons using a text or true/false field ......................................................................................................122 Coloring icons using a number, date, time or datetime field ...............................................................................123 Changing the coloring scheme of a plot...............................................................................................................124 Changing the coloring method of a plot...............................................................................................................124 Coloring by formula.............................................................................................................................................125 Turning coloring off.............................................................................................................................................125
Displaying mean and median data on a plot ...........................................................................................................125 Computing and displaying summary data on a plot................................................................................................126
Chapter 16: Creating a slide show ...................................................... 127 Opening the Slide Sorter.........................................................................................................................................128 Capturing a slide .....................................................................................................................................................128 Viewing a captured slide.........................................................................................................................................128 Renaming a slide.....................................................................................................................................................129 Reordering the slides in a slide show......................................................................................................................129 Making changes to a captured slide ........................................................................................................................129 Deleting a slide .......................................................................................................................................................130 Presenting a slide show...........................................................................................................................................130

viii InspireData™ User's Manual
Chapter 17: Managing, importing, exporting and printing documents .131 Opening, closing and saving documents.................................................................................................................131
Creating a new document.....................................................................................................................................131 Opening an existing document.............................................................................................................................131 Opening a database or example ...........................................................................................................................132 Saving a document...............................................................................................................................................132 Closing a document .............................................................................................................................................132 Saving a document with a different name............................................................................................................132
Importing data from other documents.....................................................................................................................133 Importing a file created by another application ...................................................................................................133 Appending data from another InspireData document to a table...........................................................................133 Copying and pasting data from another InspireData document or other applications .........................................134
Exporting documents ..............................................................................................................................................136 Exporting a table..................................................................................................................................................136 Exporting a plot ...................................................................................................................................................136
Printing ...................................................................................................................................................................137 Setting print options.............................................................................................................................................137 Printing a table or plot..........................................................................................................................................137
Size and memory limits ..........................................................................................................................................137
Chapter 18: Reference ........................................................................ 138 Using keyboard shortcuts........................................................................................................................................138
Shortcuts for common commands........................................................................................................................138 Shortcuts for tables and data entry.......................................................................................................................139 Shortcuts for plots ................................................................................................................................................139 Shortcuts for slide shows .....................................................................................................................................140
Using shortcut menus .............................................................................................................................................140 Using formulas........................................................................................................................................................141
Formula syntax ....................................................................................................................................................141 Formula operators ................................................................................................................................................142 Formula functions ................................................................................................................................................145
Database and example resources ............................................................................................................................147 Glossary ..................................................................................................................................................................149
Index ................................................................................................. 151

Chapter 1: Getting started with InspireData™ 9
Chapter 1: Getting started with InspireData™
Welcome to InspireData, the foremost tool to visualize, investigate and understand data. With InspireData, students investigate, manipulate and analyze data in science, mathematics and social studies. Applying the proven strategies of visual learning to data literacy, students formulate questions and interact with data to identify patterns, trends and relationships, solving problems and building their own conclusions. As a result, students develop deeper content knowledge and stronger critical thinking skills.
Learning InspireData InspireData includes the following help resources and documentation: InspireData Getting Started Guide Each copy of InspireData comes with a printed copy of the InspireData Getting Started Guide. The guide contains system requirements, installation instructions, an introduction to InspireData and a tutorial. The guide is also available as a PDF file, which you can view and print using Adobe® Acrobat® Reader. If your computer does not have Acrobat Reader, you can download a free copy from Adobe at www.adobe.com. To open the Getting Started Guide PDF file, choose InspireData Documentation on the Help menu. Double-click Getting Started Guide.pdf.
InspireData online Help The InspireData Help system contains detailed information about how to use InspireData including special features, tools and commands. To open the Help file, choose InspireData Help on the Help menu. If the Help system is not available, you must install it using the InspireData CD-ROM.
InspireData User’s Manual The InspireData User’s Manual contains all the information in the Help system. The manual is available as a PDF file, which you can view and print using Adobe Acrobat Reader. If your computer does not have Acrobat Reader, you can download a free copy from Adobe at www.adobe.com. To open the User’s Manual PDF file, choose InspireData Documentation from the Help menu. Double-click User’s Manual.pdf.

10 InspireData™ User's Manual
Customer Service Inspiration Software®, Inc. is committed to assisting our customers. If you have comments, questions or need assistance while working with InspireData, you can contact us by email, telephone or fax. Inspiration Software, Inc. provides customer service and technical support for registered users. Be sure to register so you can take advantage of our support services. When you contact us, please be ready to provide your serial number. Our support services are open Monday-Friday from 8 a.m. to 5 p.m. Pacific time. Telephone 503-297-3004 Fax 503-297-4676 Email [email protected]
Starting InspireData After you have your copy of InspireData installed and personalized, you’re ready to get to work. Here’s how you open InspireData:
To start InspireData on a computer running Windows®:
• Click the Start button, point to Programs, then click InspireData.
To start InspireData on a Macintosh® computer:
• Open the folder that contains InspireData, then double-click the InspireData icon.
Chapter 1: Getting started with InspireData™ 11
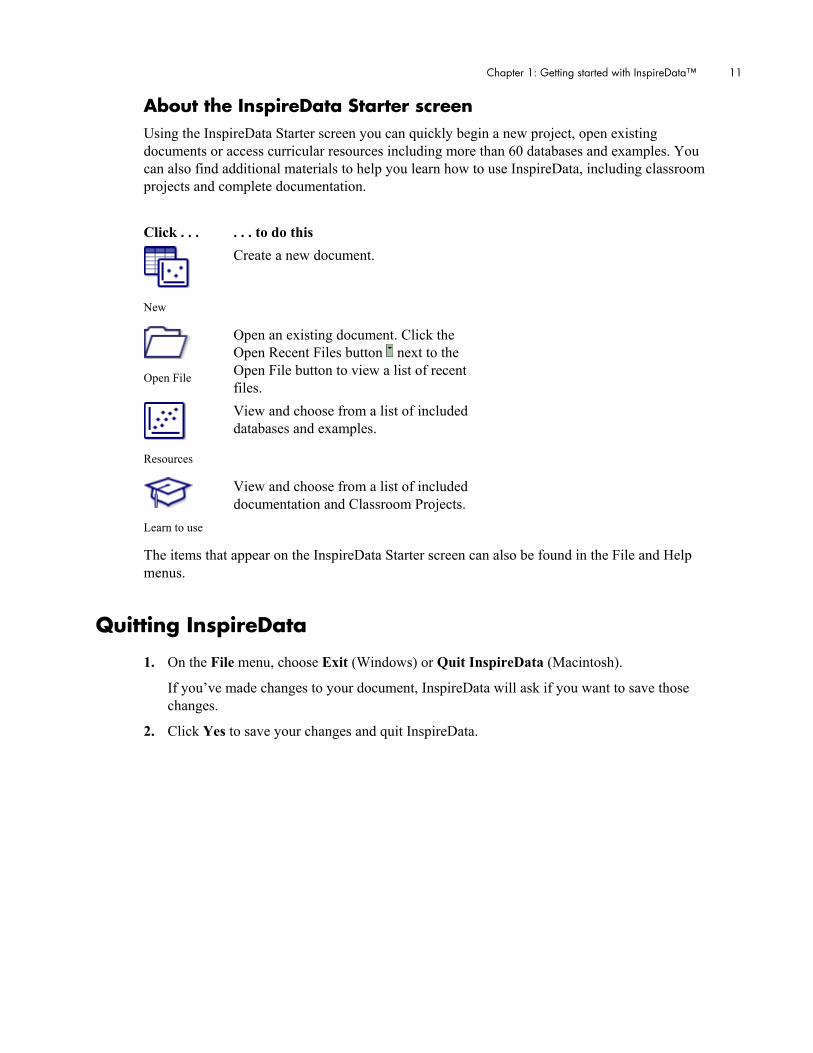
About the InspireData Starter screen Using the InspireData Starter screen you can quickly begin a new project, open existing documents or access curricular resources including more than 60 databases and examples. You can also find additional materials to help you learn how to use InspireData, including classroom projects and complete documentation. Click . . . . . . to do this
New
Create a new document.
Open File
Open an existing document. Click the Open Recent Files button next to the Open File button to view a list of recent files.
Resources
View and choose from a list of included databases and examples.
Learn to use
View and choose from a list of included documentation and Classroom Projects.
The items that appear on the InspireData Starter screen can also be found in the File and Help menus.
Quitting InspireData
1. On the File menu, choose Exit (Windows) or Quit InspireData (Macintosh).
If you’ve made changes to your document, InspireData will ask if you want to save those changes.
2. Click Yes to save your changes and quit InspireData.

12 InspireData™ User's Manual
About the InspireData views InspireData offers two data visualization environments: Table View and Plot View. You work in Table View to enter and record data, and work in Plot View to analyze and understand the data visually. The two environments are integrated; as you enter new data in Table View, information is automatically updated in Plot View.
Table View Use Table View to enter, import and customize data elements to support classroom activities and experiments. As your data is recorded, it is distributed freely in the integrated Plot View.
Chapter 1: Getting started with InspireData™ 13
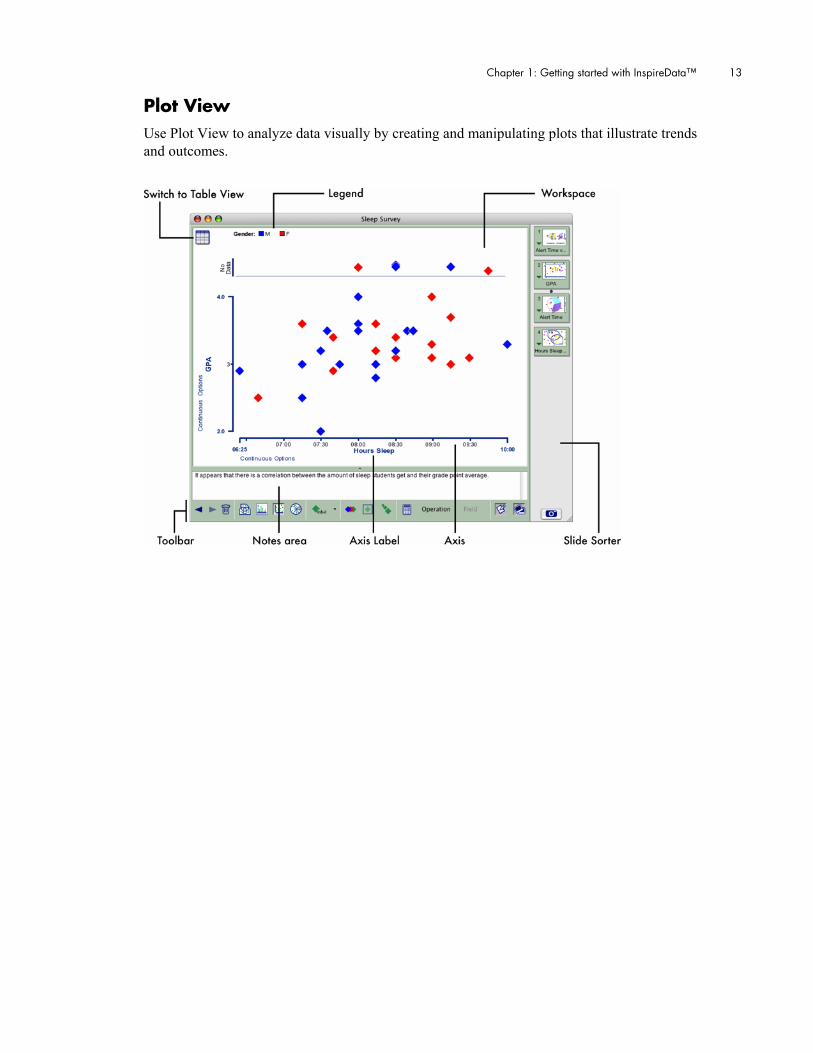
Plot View Use Plot View to analyze data visually by creating and manipulating plots that illustrate trends and outcomes.

14 InspireData™ User's Manual
Uses of tables Use tables to collect and organize raw data into fields and records. InspireData allows you to enter your own data or to import data sets from other sources. Once you have captured the data in a table, you can modify its properties, customize icons and even use formulas to create new data.

Chapter 1: Getting started with InspireData™ 15
Uses of plots Use plots to manipulate data and examine potential changes and impacts on trends and outcomes. You can formulate questions, interact with the data and view the information in different types of plots to find the best way to represent meaning. InspireData provides multiple plot types, including Venn, Stack, Pie and Axis plots.
Venn plot A Venn plot is a powerful way to describe and compare attributes by separating objects into groups based on their characteristics. Venn plots show relationships between mathematical sets and can be used to identify the commonalities and differences between things, people, places, historical events, ideas or physical items. With InspireData, you can create Venn plots with up to three loops.
16 InspireData™ User's Manual
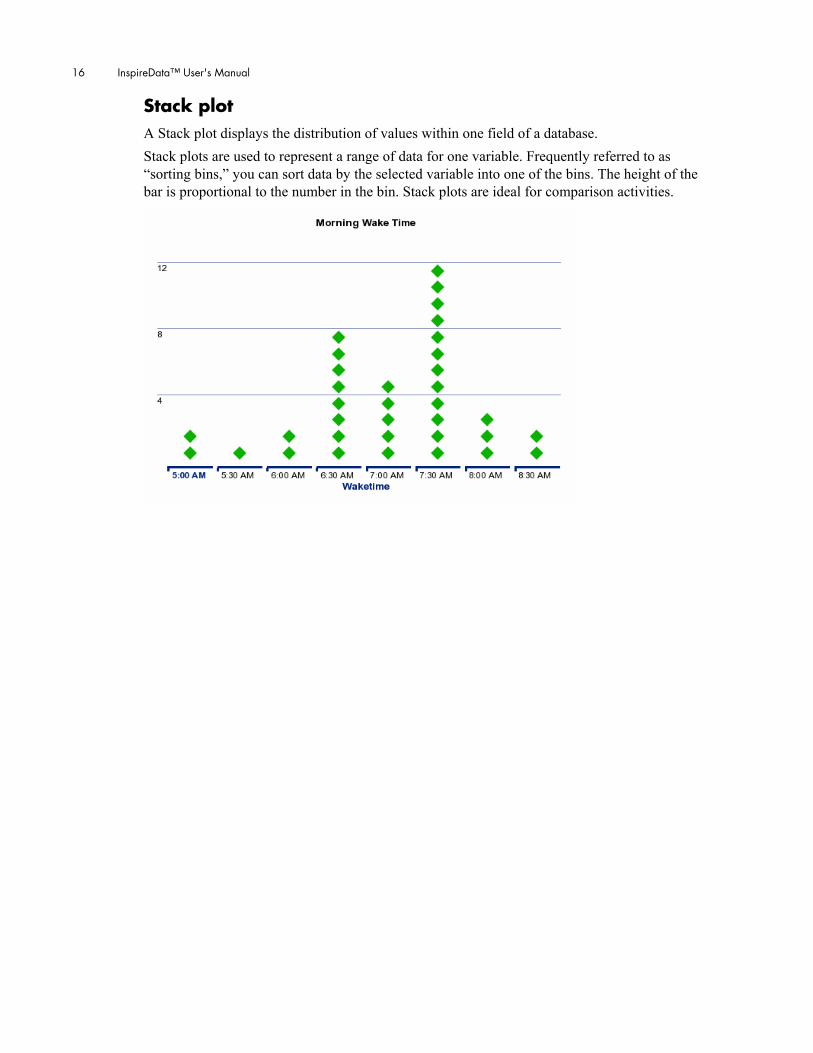
Stack plot A Stack plot displays the distribution of values within one field of a database. Stack plots are used to represent a range of data for one variable. Frequently referred to as “sorting bins,” you can sort data by the selected variable into one of the bins. The height of the bar is proportional to the number in the bin. Stack plots are ideal for comparison activities.

Chapter 1: Getting started with InspireData™ 17
Pie plot A Pie plot shows the distribution of values within one field of a database. The size of the pie’s slices reflect the percentage of records in each category. Pie plots are used to graphically represent the distribution of the entire set of data. Patterns can be easily identified as the value with the largest representation to the smallest representation in the database. You can use Pie plots to illustrate percentages of a whole or to numerically represent a category of facts.

18 InspireData™ User's Manual
Axis plot An Axis plot is an ideal way to investigate correlations. By choosing different variables, you can see if there are any relationships between those variables and gain a more in-depth understanding of the data. Use an Axis plot to compare two fields to see if there is a correlation between them.
Chapter 1: Getting started with InspireData™ 19
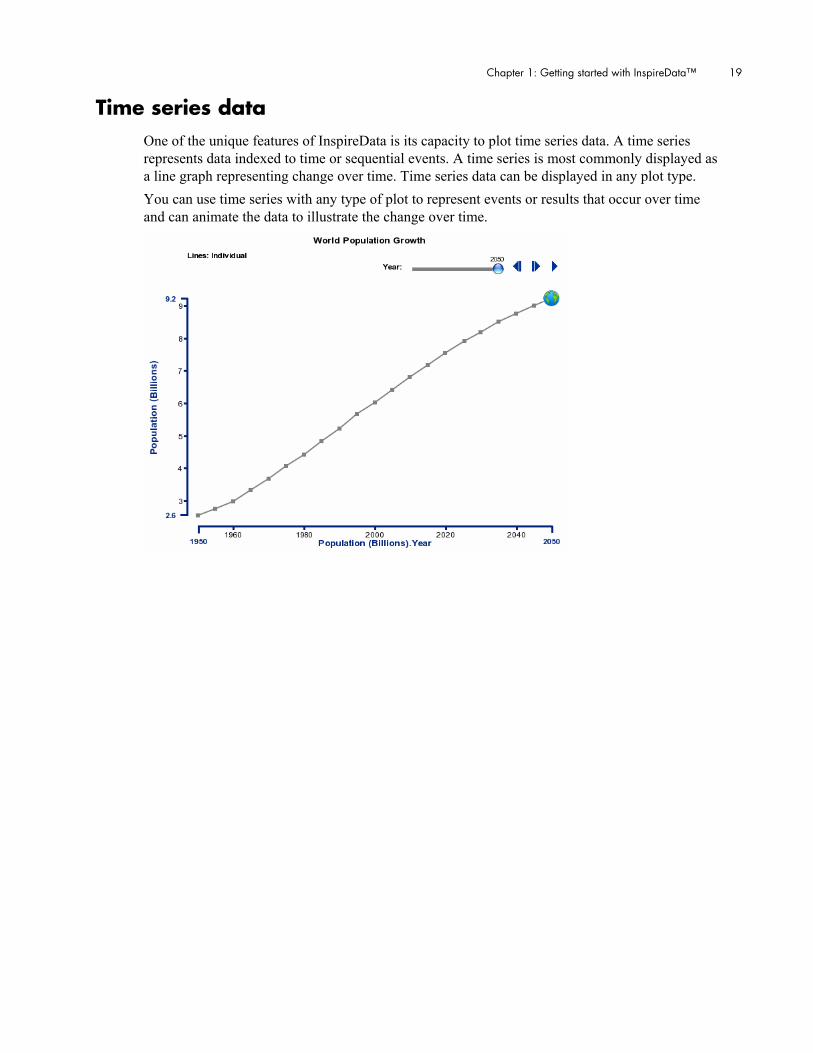
Time series data One of the unique features of InspireData is its capacity to plot time series data. A time series represents data indexed to time or sequential events. A time series is most commonly displayed as a line graph representing change over time. Time series data can be displayed in any plot type. You can use time series with any type of plot to represent events or results that occur over time and can animate the data to illustrate the change over time.
20 InspireData™ User's Manual
Chapter 2: Creating a table
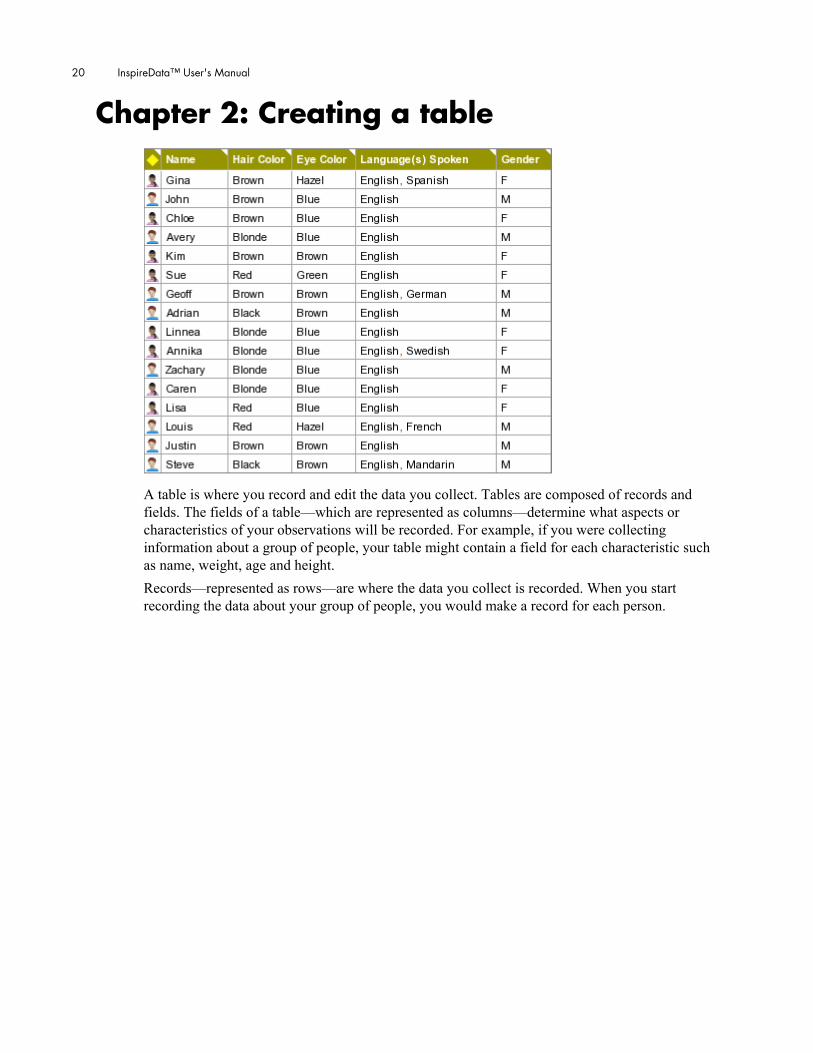
A table is where you record and edit the data you collect. Tables are composed of records and fields. The fields of a table—which are represented as columns—determine what aspects or characteristics of your observations will be recorded. For example, if you were collecting information about a group of people, your table might contain a field for each characteristic such as name, weight, age and height. Records—represented as rows—are where the data you collect is recorded. When you start recording the data about your group of people, you would make a record for each person.

Chapter 2: Creating a table 21
To create a new table:
1. On the File menu, choose New...
The InspireData Starter screen will appear.
2. On the Starter, click the New button.
New documents always start in Table View.

22 InspireData™ User's Manual
Tools for creating tables InspireData provides a variety of tools that make it easy for you to categorize and record your data. The most commonly used functions in InspireData can be found in the Toolbar. In Table View, the Toolbar appears at the top of the screen. Some of the tools listed below will appear or be hidden depending on what you have selected in your table. Click . . . . . . to do this
Plot View
Go to Plot View.
Add Record
Add a record to your table.
Add Field
Add a field to your table.
Cell Data
Edit the contents of a cell. The appearance of this field will vary depending on your current selection.
Accept
Accept a change made in the Cell Data box.
Reject
Reject a change made in the Cell Data box.
Field Type Menu
Change the field type or field data type. The appearance of this menu will vary depending on your current selection.
Note
Add, view or hide a note for the currently selected object.
Chapter 2: Creating a table 23
Working with fields Fields determine what aspects or characteristics of your observations will be recorded in your table. For example, if your observations included information about a group of people, you could create a field for each of the following: name, hair color, eye color, etc. By default, new tables contain 3 fields. As you expand your table, you can add fields, rename, resize and reorder them and more.
Adding a field As you build and expand your table, you may need to add additional fields. For example, if your table contained information about the hair and eye color of a group of people and you wanted to also record their height, you could add a new field to record that data. To add a new field:
• On the Toolbar, click the Add Field button .
-or-
On the Table menu, choose Add Field.
New fields are given a generic name like Field 1. When a new field is created, it is selected so that you can simply type to rename it. Press Enter (Windows) or Return (Mac) when you are finished.
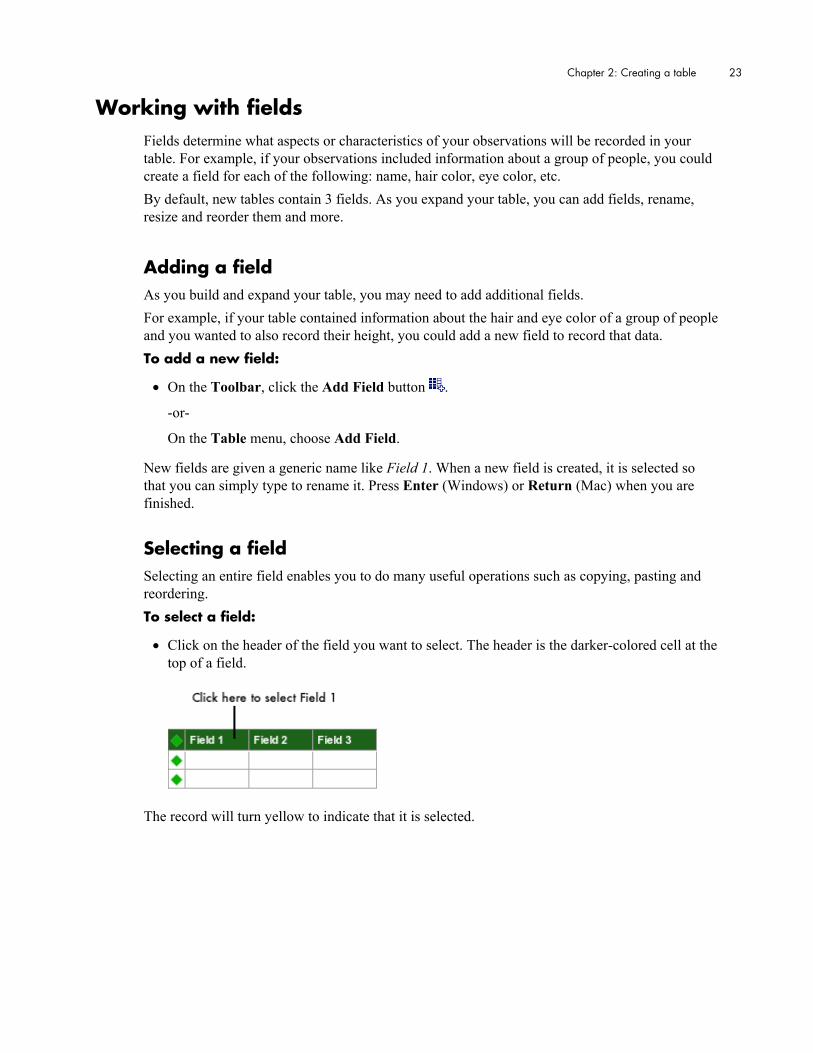
Selecting a field Selecting an entire field enables you to do many useful operations such as copying, pasting and reordering. To select a field:
• Click on the header of the field you want to select. The header is the darker-colored cell at the top of a field.
The record will turn yellow to indicate that it is selected.

24 InspireData™ User's Manual
Renaming a field When a new field is created, it is given a generic name like Field 1, which you will probably want to change to give it a specific meaning. For example, if your table contained information about a group of people and you added a new field to record their ages, you could add a new field and rename it Age. To rename a field:
1. Select the field you want to rename by clicking on its field heading.
2. Type a new name for the field.
3. When you are finished, press Enter (Windows) or Return (Macintosh).
-or-
Click the Accept button to accept the changes or the Reject button to reject the changes.
Note: A field name can include any combination of letters, numbers, special characters and spaces. However, shorter, simpler names are generally more convenient.
Note: If you are renaming multiple fields, press the Tab key after renaming the first field to select the next field to the right. You can begin typing to rename that field or press Tab again to move to the next field.
Chapter 2: Creating a table 25
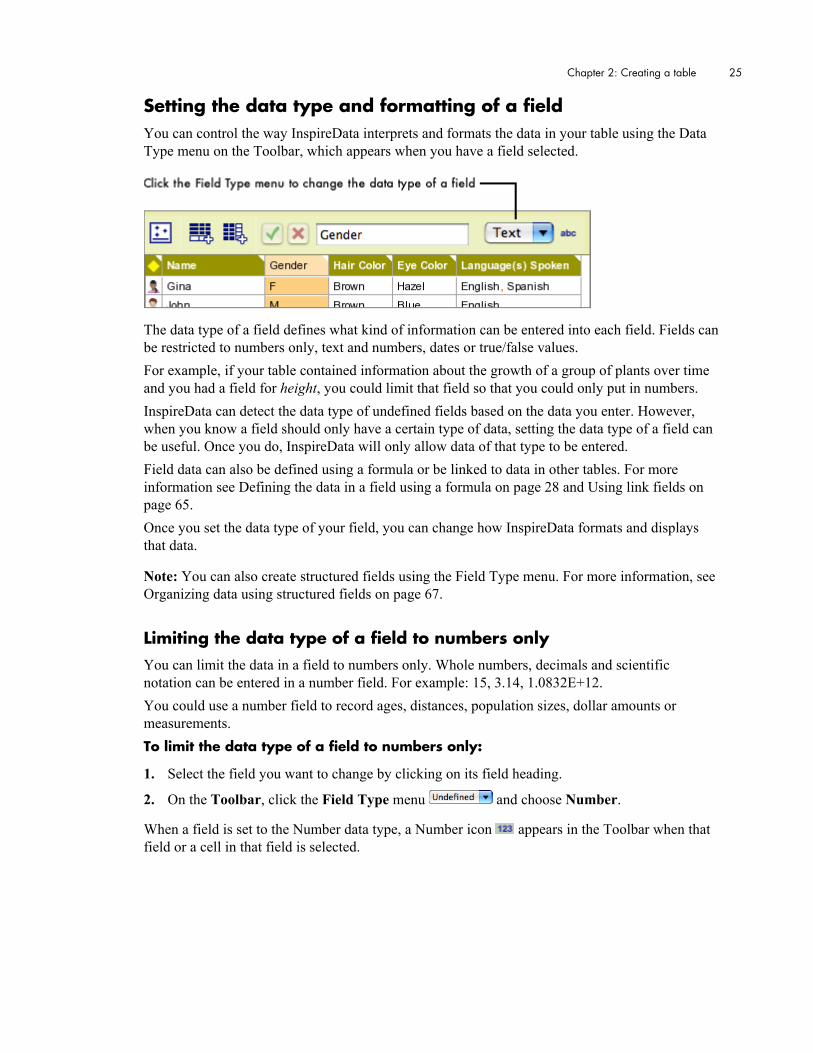
Setting the data type and formatting of a field You can control the way InspireData interprets and formats the data in your table using the Data Type menu on the Toolbar, which appears when you have a field selected.
The data type of a field defines what kind of information can be entered into each field. Fields can be restricted to numbers only, text and numbers, dates or true/false values. For example, if your table contained information about the growth of a group of plants over time and you had a field for height, you could limit that field so that you could only put in numbers. InspireData can detect the data type of undefined fields based on the data you enter. However, when you know a field should only have a certain type of data, setting the data type of a field can be useful. Once you do, InspireData will only allow data of that type to be entered. Field data can also be defined using a formula or be linked to data in other tables. For more information see Defining the data in a field using a formula on page 28 and Using link fields on page 65. Once you set the data type of your field, you can change how InspireData formats and displays that data.
Note: You can also create structured fields using the Field Type menu. For more information, see Organizing data using structured fields on page 67.
Limiting the data type of a field to numbers only You can limit the data in a field to numbers only. Whole numbers, decimals and scientific notation can be entered in a number field. For example: 15, 3.14, 1.0832E+12. You could use a number field to record ages, distances, population sizes, dollar amounts or measurements. To limit the data type of a field to numbers only:
1. Select the field you want to change by clicking on its field heading.
2. On the Toolbar, click the Field Type menu and choose Number.
When a field is set to the Number data type, a Number icon appears in the Toolbar when that field or a cell in that field is selected.

26 InspireData™ User's Manual
Limiting the data type of a field to text and numbers Letters and characters—including spaces—can be entered into a Text field. For example: Robert, 7412 SW 31st Ave, Blue, (555) 555-5555. You could use a Text field to record names, street addresses, colors or categorical information such as high/medium/low or north/south/east/west. To limit the data type of a field to text and numbers only:
1. Select the field you want to change by clicking on its field heading.
2. On the Toolbar, click the Field Type menu and choose Text.
When a field is set to the Text data type, a Text icon appears in the toolbar when that field or a cell in that field is selected.
Note: Numbers entered into a Text field are treated as characters and cannot be used in formulas.
Limiting the data type of a field to true/false True/False fields allow only two possible data values: true or false. These may alternatively be entered and displayed as T/F, Yes/No, or Y/N. You could use a true/false field to record data that can be answered with a Yes or No, such as whether a plant has flowers or not, or if a person remembers dreaming on a given night or not. To limit the data type of a field to true/false:
1. Select the field you want to change by clicking on its field heading.
2. On the Toolbar, click the Field Type menu and choose True/False.
When a field is set to the True/False data type, a T/F icon appears in the toolbar when that field or a cell in that field is selected.
Limiting the data type of a field to dates only A specific date can be entered into a date field. Dates must include a day, month and year. For example: 5/1/1970; May 1, 1970. You could use a date field to record birth dates or the day a plant in your experiment started to flower. To limit the data type of a field to dates only:
1. Select the field you want to change by clicking on its field heading.
2. On the Toolbar, click the Field Type menu and choose Date.
When a field is set to the Date data type, a Date icon appears in the toolbar when that field or a cell in that field is selected.
Chapter 2: Creating a table 27
Limiting the data type of a field to times only A specific time can be entered into a time field. Times must include an hour and minute, and can also include a second. For example: 1:31 PM, 16:06, 5:45:11 AM. You could use a time field to record what time a person wakes up or what time the sun rises and sets. To limit the data type of a field to times only:
1. Select the field you want to change by clicking on its field heading.
2. On the Toolbar, click the Field Type menu and choose Time.
When a field is set to the Time data type, a Time icon appears in the toolbar when that field or a cell in that field is selected.
Limiting the data type of a field to dates and times only A specific date and time can be entered into a datetime field. Datetime fields must include a day, month, year, hour and minute, and can also include a second. For example: 4/24/01 2:41 PM; May 31, 1989 8:21:30 AM. A datetime combines a date and a time in a single value. On a travel itinerary, you might use datetimes for the departure and arrival times of each plane, train or bus you plan to ride. To limit the data type of a field to dates and times only:
1. Select the field you want to change by clicking on its field heading.
2. On the Toolbar, click the Field Type menu and choose Datetime.
When a field is set to Datetime, a Datetime icon appears in the toolbar when that field or a cell in that field is selected.
Converting the data in a field to another data type As you develop and expand your table, you may find that you need to change the data type of a field to another type. For example, if your table had a field that tracked which day an historical event occurred on, but you needed to record the time as well as the date, you could convert your date field into a datetime field. To convert the data in a field to another data type:
1. Select the field you want to change by clicking on its field heading.
2. On the Toolbar, click the Field Type menu on the Toolbar and select the data type you want to change to.
If you have data in the field you are converting, InspireData will convert the data to the new field type, if possible.
Note: If you change a field type by mistake, you can reverse the change by choosing Undo from the Edit menu.

28 InspireData™ User's Manual
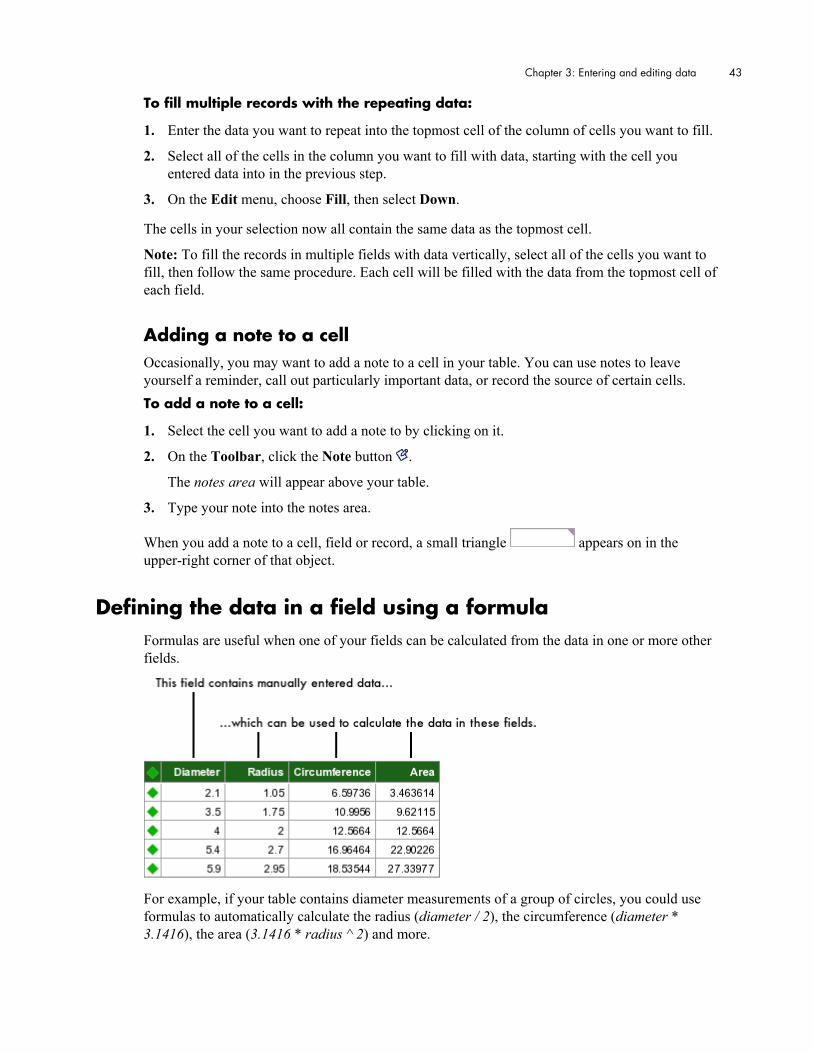
Defining the data in a field using a formula Formulas are useful when one of your fields can be calculated from the data in one or more other fields.
For example, if your table contains diameter measurements of a group of circles, you could use formulas to automatically calculate the radius (diameter / 2), the circumference (diameter * 3.1416), the area (3.1416 * radius ^ 2) and more.

Chapter 2: Creating a table 29
To use a formula to calculate the values in a field:
1. Select the field you want to change by clicking on its field heading.
2. On the Toolbar, click the Field Type menu and choose Formula.
The Formula Editor appears. The formula itself will appear in the top box of the dialog. Below are lists of the field headings in your table, operators and functions that you can double-click to build your formula.
3. Enter your formula into the top box of the Formula Editor.
4. When you are finished, click the OK button.
The cells in your formula field will be filled in automatically with calculated data.
Note: When your formula contains illegal syntax (such that InspireData cannot produce a result based on the formula you’ve entered), an error message will appear beneath the Formula box.
Note: Field headings that contain a space must be contained within single quotes (‘). For example: ‘Spherical Volume’ and ‘Flowers at 40’.
Note: Formulas follow the standard rules for order of operations. Use parentheses to group operations that you want to happen first. For example, where 3 + 3 * 2 would equal 9, (3 + 3) * 2 would equal 12.
Note: To use a function, select the one you want to use from the Functions box, then replace the text between the parentheses (usually number, string, value or field) with one of the field headings in the Field box. Note that when a function asks you to specify a field, that field must be either a series, multi-series or subtable field.
Note: For detailed descriptions of the operators and functions, see Formula functions on page 145 and Formula operators on page 142.
30 InspireData™ User's Manual
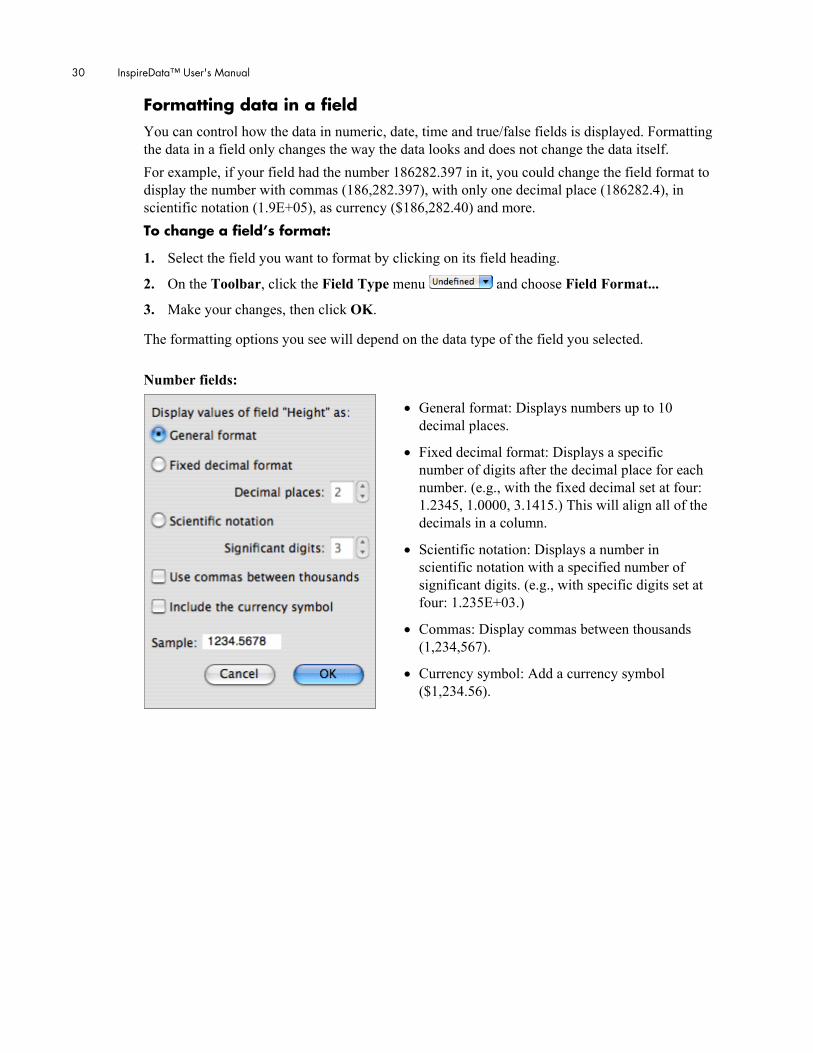
Formatting data in a field You can control how the data in numeric, date, time and true/false fields is displayed. Formatting the data in a field only changes the way the data looks and does not change the data itself. For example, if your field had the number 186282.397 in it, you could change the field format to display the number with commas (186,282.397), with only one decimal place (186282.4), in scientific notation (1.9E+05), as currency ($186,282.40) and more. To change a field’s format:
1. Select the field you want to format by clicking on its field heading.
2. On the Toolbar, click the Field Type menu and choose Field Format...
3. Make your changes, then click OK.
The formatting options you see will depend on the data type of the field you selected. Number fields:
• General format: Displays numbers up to 10 decimal places.
• Fixed decimal format: Displays a specific number of digits after the decimal place for each number. (e.g., with the fixed decimal set at four: 1.2345, 1.0000, 3.1415.) This will align all of the decimals in a column.
• Scientific notation: Displays a number in scientific notation with a specified number of significant digits. (e.g., with specific digits set at four: 1.235E+03.)
• Commas: Display commas between thousands (1,234,567).
• Currency symbol: Add a currency symbol ($1,234.56).

Chapter 2: Creating a table 31
True/False fields:
• True/False fields can be displayed as: True/False, T/F, Yes/No and Y/N.
Date fields:
• Date fields can be displayed as: Month DD YY (November 25 2004), YYYY/MM/DD (2004/11/25), DD-Month-YYYY (25-Nov-2004), MM/DD/YYYY (11/25/2004), YYYY-MM-DD (2004-11-25), DD/MM/YYYY (25/11/2004)
• Month names can be abbreviated, when applicable. (Jan, Feb, Mar, etc.)
• Year names can be displayed as two digits. (98, 99, 00, 01, etc.)
• Months and days can be displayed as two digits, when applicable. (08, 09, 10, 11)

32 InspireData™ User's Manual
Time fields:
• Times can be displayed as 12 hour (5:30 PM) or 24 hour (17:30).
• Times can be displayed with seconds (5:30:15 PM) or without (5:30 PM).
• 12:00 and 24:00 can be displayed as “Noon” and “Midnight”.
Note: Datetime fields contain the same options as both the date and time fields.
Adding a note to a field Occasionally, you may want to add a note to a field in your table. You can use notes to leave yourself a reminder, call out particularly important data, or record the source of certain fields. To add a note to a field:
1. Select the field you want to add a note to by clicking on its field heading.
2. On the Toolbar, click the Note button .
The notes area will appear above your table.
3. Type your note into the notes area.
When you add a note to a cell, field or record, a small triangle appears on in the upper-right corner of that object.
Deleting a field When a field is no longer needed, you can delete it. When a field is deleted, the data contained within it is also deleted. To delete a field:
1. Select the field you want to delete by clicking on its field heading.
2. On the Edit menu, select Delete Field.
-or-
Press the Delete key.
If you delete a field by mistake, you can restore it by choosing Undo from the Edit menu.
Chapter 2: Creating a table 33
Resizing a field The width of a field is automatically set to the width of the field heading. If the data in a field is too long to be displayed, it will appear truncated. When this happens, you may want resize the column so that you can see all of your data. Similarly, if you have many fields in a table, you may want to reduce the size of some fields so that more of them will be visible. To resize a field:
1. Position the cursor over the right edge of the field header for the field you want to resize. The cursor will change to a resize cursor .
2. Drag the cursor to the right or left to increase or reduce the width of the field.
Reordering fields As your table grows, you may want to change the order of the fields in your table. For example, if your table contained information about a group of people, you might add a hair color field to the end of your table, then move that field so that it is next to the eye color field. To reorder fields:
1. Click the header of the field you want to move, then drag it to the new location.
While you drag, the field remains in its original position until you release the mouse button. You can tell where the field will be inserted by watching the carat mark as you drag.
2. When the field is in the place you want it, release the mouse button.
Copying and pasting a field You can cut or copy a field and its data and paste it into another location. You can also paste it into another InspireData document, table or a document in another application. When you cut a field, the field and its data are removed from the table. To copy and paste a field:
1. Select the field you want to cut or copy by clicking on its field heading.
2. On the Edit menu, choose Copy.
3. On the Edit menu, choose Paste.
Pasted fields will be appended to the right of the table. To paste a field into a specific place, select the field to the left of where you want the pasted field to be inserted before pasting.
You can also paste fields from other applications. For more information, see Copying and pasting data from another InspireData document or other applications on page 134.
Note: You can hold the Ctrl (Windows) or Command (Macintosh) key and press C to copy, and hold Ctrl (Windows) or Command (Macintosh) key and press V to paste. For more information on keyboard shortcuts, see Using keyboard shortcuts on page 138.
34 InspireData™ User's Manual
Creating new fields using copied data You can copy data from another InspireData table, document or a document created in another application such as Microsoft® Excel®, then paste it into your table. To create new fields using copied data:
1. Copy the data you want from the other table or application.
2. Select the InspireData document you want to paste into.
3. On the Edit menu, choose Paste Special, then select Add Fields to Table.
Pasted fields are added to the right side of your table. To paste a field into a specific place, select the field to the left of where you want the pasted field to be inserted before pasting.
Overwriting the data in a field with copied data You can overwrite the contents of a field with data copied from another table, document or application. To overwrite the data in a field with copied data:
1. Select the field you want to copy.
2. On the Edit menu, choose Copy.
3. Select the field you want to paste the data into.
4. On the Edit menu, choose Paste Special, then select Paste In.
The data in the selected field is replaced with the copied data.
Working with records After you are finished defining your fields, you can add records to begin recording the data you’ve collected. Records are represented as rows in your table. For each record, you will be able to enter data for each field.
Adding a record As you collect more data, you may need to add more records. For example, if your table contained information about a group of people and you needed to add another person, you can create a new record. To add a new record:
• On the Toolbar, click the Add Record button .
-or-
On the Table menu, choose Add Record.
New records are usually added at the bottom of your table. However, the new record will appear at the top if your table is sorted in ascending order and at the bottom if in descending order.
Chapter 2: Creating a table 35
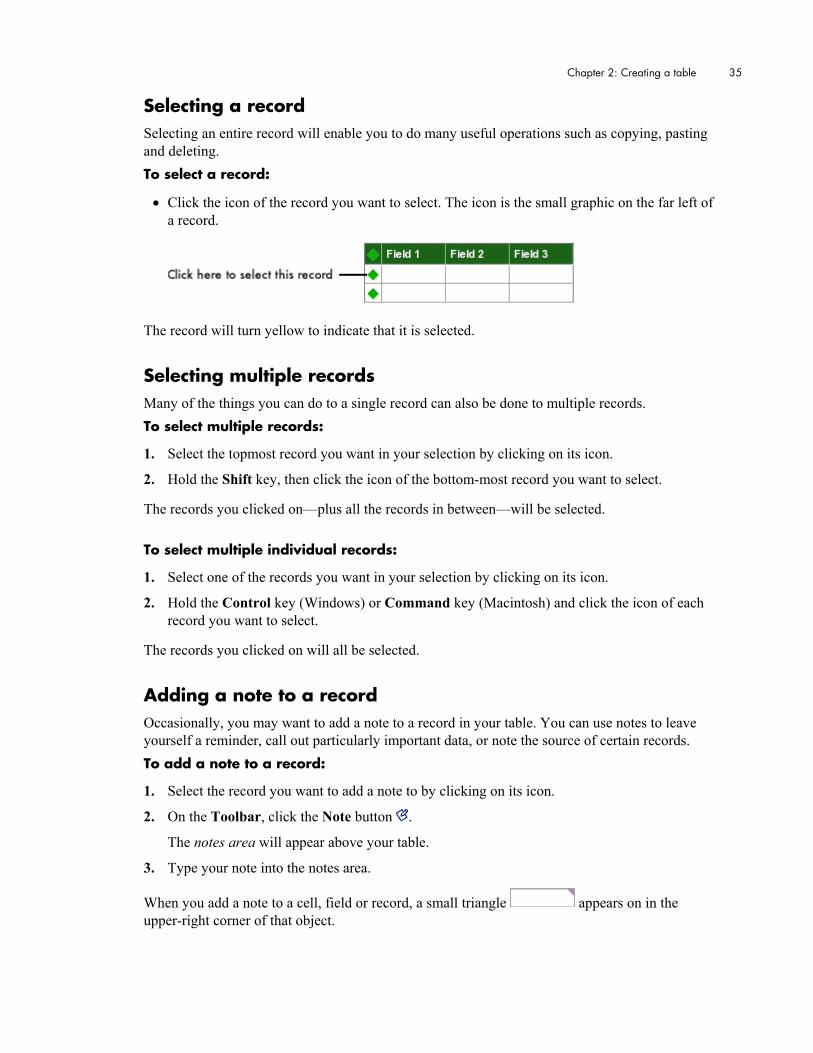
Selecting a record Selecting an entire record will enable you to do many useful operations such as copying, pasting and deleting. To select a record:
• Click the icon of the record you want to select. The icon is the small graphic on the far left of a record.
The record will turn yellow to indicate that it is selected.
Selecting multiple records Many of the things you can do to a single record can also be done to multiple records. To select multiple records:
1. Select the topmost record you want in your selection by clicking on its icon.
2. Hold the Shift key, then click the icon of the bottom-most record you want to select.
The records you clicked on—plus all the records in between—will be selected. To select multiple individual records:
1. Select one of the records you want in your selection by clicking on its icon.
2. Hold the Control key (Windows) or Command key (Macintosh) and click the icon of each record you want to select.
The records you clicked on will all be selected.
Adding a note to a record Occasionally, you may want to add a note to a record in your table. You can use notes to leave yourself a reminder, call out particularly important data, or note the source of certain records. To add a note to a record:
1. Select the record you want to add a note to by clicking on its icon.
2. On the Toolbar, click the Note button .
The notes area will appear above your table.
3. Type your note into the notes area.
When you add a note to a cell, field or record, a small triangle appears on in the upper-right corner of that object.
36 InspireData™ User's Manual
Deleting a record You can delete unwanted or irrelevant records from your table at any time. To delete a record:
1. Select the record you want to delete by clicking on its icon.
2. On the Table menu, select Delete Record.
-or-
Press the Delete key.
Note: If you delete a record accidentally, on the Edit menu, select Undo.
Copying and pasting a record You can cut or copy a record and paste it into another location. You can also paste it into another document, table, or a document in another application. When you cut a record, it is removed from the table. To copy and paste a record:
1. Select the record you want to copy by clicking on its icon.
2. On the Edit menu, choose Copy.
3. Go to the table or document you want to paste the record into.
4. On the Edit menu, choose Paste.
Pasted records are usually added at the bottom of your table. However, if your table is sorted, the duplicated record will appear in sorted order.
You can also paste records from other applications. For more information, see Copying and pasting data from another InspireData document or other applications on page 134.
Note: You can hold the Ctrl (Windows) or Command (Macintosh) key and press C to copy, and hold Ctrl (Windows) or Command (Macintosh) key and press V to paste. For more information on keyboard shortcuts, see Using keyboard shortcuts on page 138.
Duplicating a record As you add records to your table, you may have a set of records that have the same data or differ very slightly. Duplicating similar records is often faster than typing each one. To duplicate a record:
1. Select the record you want to duplicate by clicking on its icon. (The icon is the leftmost cell in a record, usually a diamond .)
2. On the Table menu, select Duplicate Record.
Duplicated records are usually added at the bottom of your table. However, if your table is sorted, the duplicated record will appear in sorted order.
Chapter 2: Creating a table 37
Creating new records using copied data You can copy data from another InspireData table, document or a document created in another application such as Microsoft Excel, then paste it into your table. To create new records using copied data:
1. Copy the data you want from the other document application.
2. Select the InspireData document you want to paste into.
3. On the Edit menu, choose Paste Special, then select Append to Table.
Pasted records are usually added at the bottom of your table. However, if your table is sorted, the pasted records will appear in sorted order.
Changing the name and color scheme of a table You can change the color scheme and name of a table. This is especially useful when your document contains multiple tables. Changing the color scheme changes the colors of the tab, toolbar, field headings and default icon (if you haven’t specified a custom default icon). To change the name and color scheme of a table:
1. On the Table menu, choose Table Properties.
2. Type the new name into the Name text box.
3. Choose a new color scheme from the Color Scheme menu.
4. When you are finished, click the OK button.
Copying and pasting an entire table You can copy and paste the entire contents of a table into another table, document or application. Copying and pasting an entire table:
1. Select the table you want to copy by clicking the icon in the upper-left corner of the table. (The icon is usually a diamond .)
2. On the Edit menu, choose Copy.
3. Go to the table or document you want to paste the record into.
4. On the Edit menu, choose Paste.

38 InspireData™ User's Manual
Undoing a change to your table Changes you make to the fields, records and data in a table—such as adding, editing or deleting—can be undone. To undo a change to your table:
• On the Edit menu, choose Undo.
To redo a change made by undoing, select Redo from the Edit menu.
Note: You can undo all changes made to your document since the last time you saved it.
Chapter 3: Entering and editing data 39
Chapter 3: Entering and editing data Once you set up your table, the data that you collect from your observations, research or experiments can be entered and edited in Table View. InspireData provides a variety of tools to help you enter and edit the data in your table. If your document is in Plot View, switch to Table View by clicking the Table View button in the upper-left corner of the workspace.
Selecting a cell Selecting a cell enables you to type or paste new data and copy or delete existing data. To select a cell:
• Click the cell you want to select.
The cell will turn yellow to indicate that it is selected.
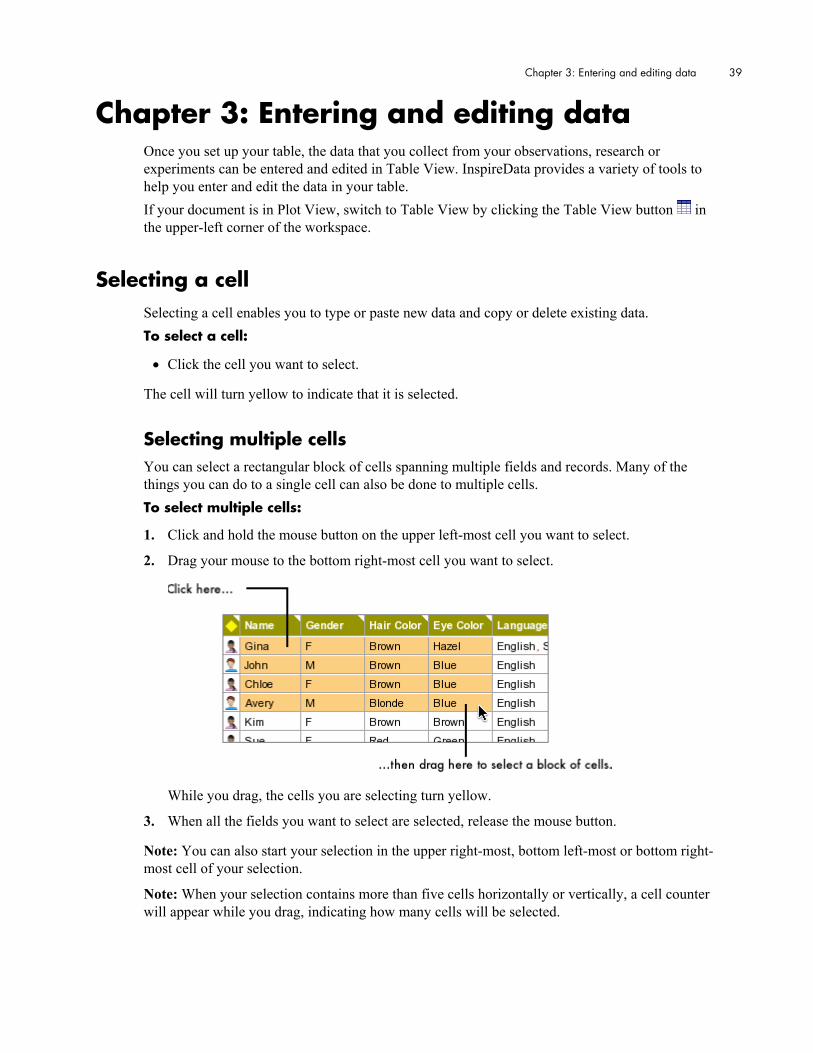
Selecting multiple cells You can select a rectangular block of cells spanning multiple fields and records. Many of the things you can do to a single cell can also be done to multiple cells. To select multiple cells:
1. Click and hold the mouse button on the upper left-most cell you want to select.
2. Drag your mouse to the bottom right-most cell you want to select.
While you drag, the cells you are selecting turn yellow.
3. When all the fields you want to select are selected, release the mouse button.
Note: You can also start your selection in the upper right-most, bottom left-most or bottom right-most cell of your selection.
Note: When your selection contains more than five cells horizontally or vertically, a cell counter will appear while you drag, indicating how many cells will be selected.

40 InspireData™ User's Manual
Entering data into a cell A record is divided into cells, one per field. A cell is where the data for each field and record is stored. To enter data into an empty cell:
1. Select the cell you want to add data to by clicking on it.
2. Type your data into the cell.
3. When you are finished, press Enter (Windows) or Return (Macintosh).
-or-
Click the Accept button to accept the changes or the Reject button to reject the changes.
Editing data in a cell If you make a mistake or need to update the data in a cell, you can edit the contents of a cell at any time. To edit the data in a cell:
1. Select the cell you want to edit by clicking on it.
2. Click on the cell again to enter into text editing mode.
-or-
Click the Cell Data box on the Toolbar.
3. Type your changes into the cell.
4. When you are finished, press Enter (Windows) or Return (Macintosh).
-or-
Click the Accept button to accept the changes or the Reject button to reject the changes.
InspireData features a number of keyboard shortcuts that are useful when entering and editing text. For more information, see Using keyboard shortcuts on page 138.
Note: To replace the data in a cell instead of editing it, select the cell, then begin typing. The data you type will replace the text that was there previously.

Chapter 3: Entering and editing data 41
Clearing the data in a cell As you work, it may be useful to erase the data from one or more cells to remove inaccurate or irrelevant data. To clear the data in a cell:
1. Select the cell or cells you want to clear by clicking on them.
2. On the Edit menu, choose Clear.
If your selection contains multiple cells, all of the cells in your selection will be cleared. For more information, see Selecting multiple cells on page 39.
Note: Clearing only erases the contents of the cells and does not affect field names, field formats, column headings or icons.
Filling multiple fields with repeating data You can also use the Fill command to enter the same data into multiple fields in a record.

42 InspireData™ User's Manual
To fill a row of cells with the repeating data:
1. Enter the data you want to repeat into the leftmost cell of the row of cells you want to fill.
2. Select all of the cells in the row you want to fill with data, starting with the cell you entered data into in the previous step.
3. On the Edit menu, choose Fill, then select Right.
The cells in your selection now all contain the same data as the leftmost cell.
Note: To fill the fields in multiple records with data horizontally, select all of the cells you want to fill, then follow the same procedure. Each cell will be filled with the data from the leftmost cell of each record.
Note: Only cells of compatible data types can be filled. For example, if you have a cell with text selected on the left and a cell that can only accept numbers on the right, the Fill command will be unavailable in the Edit menu because text cannot be entered into a number-only field. For more information about field data types, see Setting the data type and formatting of a field on page 25.
Filling multiple records with repeating data Sometimes you will need to enter the same data into multiple records in a field. You could use copy and paste to do this, but when you need to fill cells with lots of data, using the Fill command is often faster.
Chapter 3: Entering and editing data 43
To fill multiple records with the repeating data:
1. Enter the data you want to repeat into the topmost cell of the column of cells you want to fill.
2. Select all of the cells in the column you want to fill with data, starting with the cell you entered data into in the previous step.
3. On the Edit menu, choose Fill, then select Down.
The cells in your selection now all contain the same data as the topmost cell.
Note: To fill the records in multiple fields with data vertically, select all of the cells you want to fill, then follow the same procedure. Each cell will be filled with the data from the topmost cell of each field.
Adding a note to a cell Occasionally, you may want to add a note to a cell in your table. You can use notes to leave yourself a reminder, call out particularly important data, or record the source of certain cells. To add a note to a cell:
1. Select the cell you want to add a note to by clicking on it.
2. On the Toolbar, click the Note button .
The notes area will appear above your table.
3. Type your note into the notes area.
When you add a note to a cell, field or record, a small triangle appears on in the upper-right corner of that object.
Defining the data in a field using a formula Formulas are useful when one of your fields can be calculated from the data in one or more other fields.
For example, if your table contains diameter measurements of a group of circles, you could use formulas to automatically calculate the radius (diameter / 2), the circumference (diameter * 3.1416), the area (3.1416 * radius ^ 2) and more.

44 InspireData™ User's Manual
To use a formula to calculate the values in a field:
1. Select the field you want to change by clicking on its field heading.
2. On the Toolbar, click the Field Type menu and choose Formula.
The Formula Editor appears. The formula itself will appear in the top box of the dialog. Below are lists of the field headings in your table, operators and functions that you can double-click to build your formula.
3. Enter your formula into the top box of the Formula Editor.
4. When you are finished, click the OK button.
The cells in your formula field will be filled in automatically with calculated data.
Note: When your formula contains illegal syntax (such that InspireData cannot produce a result based on the formula you’ve entered), an error message will appear beneath the Formula box.
Note: Field headings that contain a space must be contained within single quotes (‘). For example: ‘Spherical Volume’ and ‘Flowers at 40’.
Note: Formulas follow the standard rules for order of operations. Use parentheses to group operations that you want to happen first. For example, where 3 + 3 * 2 would equal 9, (3 + 3) * 2 would equal 12.
Note: To use a function, select the one you want to use from the Functions box, then replace the text between the parentheses (usually number, string, value or field) with one of the field headings in the Field box. Note that when a function asks you to specify a field, that field must be either a series, multi-series or subtable field.
Note: For detailed descriptions of the operators and functions, see Formula functions on page 145 and Formula operators on page 142.

Chapter 3: Entering and editing data 45
Collecting data using the Circle Game InspireData includes a special type of table called the Circle Game. You can have a group of people play a simple, mouse-operated game and collect their reaction times in a table for analysis. You can also configure and customize the game options to create variations. To collect data using the Circle Game:
1. On the Table menu, choose New Special Table, then select Circle Game.
A new table will be added to your document. The Circle Game controls will appear on the right side of the Toolbar.
2. On the Toolbar, click the Circle Game Options button (to the right of the Play button) and choose the game type you want to use.
3. Click the Play button.
The Circle Game will appear. Click the circles as they appear until the game is finished.

46 InspireData™ User's Manual
4. When the game is finished, data collected from the game will appear on your table.
You can now either play the game again or add fields and begin analyzing the data you’ve collected.
Note: You can set the number of trials per game and the distance, delay and size of the circles in your experiment by clicking the Circle Game Options button and selecting Custom Game.
Adding a timestamp to a new record InspireData includes a special type of table called Timestamp. When you create a new record in the Timestamp table, the time and date the record was created will automatically be recorded in a datetime field. Adding a timestamp to a new record:
1. On the Table menu, choose New Special Table, then select Timestamp.
A new table containing a field named Time will be added to your document.
2. On the Toolbar, click the Add Record button.
Whenever you add a new record to your table, the time and date you added it on will be recorded in the Time field.

Chapter 3: Entering and editing data 47
Sorting records in a table As you add more records to your table, you may want to sort your data to make records easier to find. This is especially useful for large tables with many records. You can change your sorting options at any time. To sort the records in a table:
1. On the Table menu, choose Sort.
The sort dialog box appears.
2. Select the field you want to sort by from the left menu.
3. Choose whether records should be sorted in ascending (alphabetical, numerical or chronological) or descending (reverse alphabetical, numerical or chronological) order from the right menu.
4. When you are finished, click the OK button.
After you specify a field to sort by in the Sort dialog, a second row of menus appears. You can use this to choose which field to sort by if some of the records in the primary sort field have equal values. After specifying a secondary sort field, a third row appears and so on.
Note: If you add or change records after sorting your table, they will automatically be sorted.
Note: If a column of numbers appears to be sorted out of order (103, 13, 16, 24, 4, 52, 9), make sure the field type of your sort field is Number. For more information, see Limiting the data type of a field to numbers only on page 25.
Note: To turn return your records to their original order, open the Sort dialog and select <none> for each of the left menus.

48 InspireData™ User's Manual
Chapter 4: Entering data using a Questionnaire
InspireData’s Questionnaire feature allows you to create new records and enter data for those records using an onscreen form, similar to one you might find on a web page. The Questionnaire is especially useful when you have a group of people who aren’t familiar with InspireData. Using Questionnaires, those people can enter data directly into your document. By writing questions that correspond to each field, you can make it easy for your respondents to know which data goes where. For example, if you were collecting information about a group of people, you could have each person come to the computer and fill in the Questionnaire. When each person finishes a Questionnaire, a new record with their data is added to the table. You can set up one or more computers as Questionnaire stations and let people take turns filling out the form. When a Questionnaire is completed, its data is added as a record to your table.
Entering data using a Questionnaire InspireData can automatically create a Questionnaire, which you can use at any time. This default Questionnaire presents all the fields, using the field names as the questions. When you add a new field to your table, a new question is automatically added to the Questionnaire. To enter data using a Questionnaire:
1. Open the table you want to enter data into.
2. On the Table menu, choose Launch Questionnaire.
3. Enter data into the boxes next to each question.

Chapter 4: Entering data using a Questionnaire 49
Optionally, each record can be assigned a custom icon by clicking on the Icon near the top of the dialog or the Import... button. For more information, see Importing a photograph or other image file as an icon on page 60.
4. When you’re done entering data for this record, click the Add Record button.
A new record with the data you’ve entered is added to the table. The form will be cleared and be ready for the next record.
5. When you’re done adding records, click the Done button.
You can also customize a Questionnaire with your own questions, determine which fields shouldn’t appear, and which will require an answer. For more information, see Changing the wording of a question on a Questionnaire on page 50.
Note: If the Add Record button is unavailable when you are using a Questionnaire, one or more of the questions that require an answer may not have been filled out yet. For more information, see Requiring an answer to a question in a Questionnaire on page 53.
Note: Fields with the following field types are omitted from Questionnaires: series, multi-series, subtable and formula.
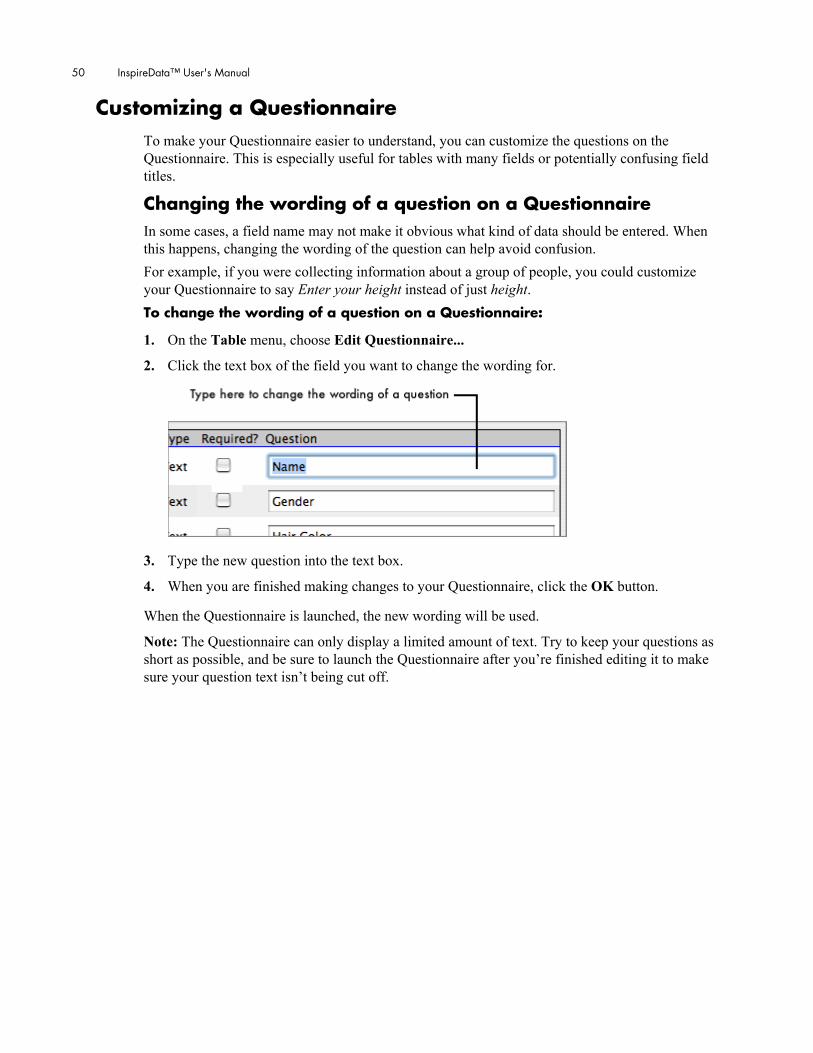
50 InspireData™ User's Manual
Customizing a Questionnaire To make your Questionnaire easier to understand, you can customize the questions on the Questionnaire. This is especially useful for tables with many fields or potentially confusing field titles.
Changing the wording of a question on a Questionnaire In some cases, a field name may not make it obvious what kind of data should be entered. When this happens, changing the wording of the question can help avoid confusion. For example, if you were collecting information about a group of people, you could customize your Questionnaire to say Enter your height instead of just height. To change the wording of a question on a Questionnaire:
1. On the Table menu, choose Edit Questionnaire...
2. Click the text box of the field you want to change the wording for.
3. Type the new question into the text box.
4. When you are finished making changes to your Questionnaire, click the OK button.
When the Questionnaire is launched, the new wording will be used.
Note: The Questionnaire can only display a limited amount of text. Try to keep your questions as short as possible, and be sure to launch the Questionnaire after you’re finished editing it to make sure your question text isn’t being cut off.

Chapter 4: Entering data using a Questionnaire 51
Changing the title of a Questionnaire You can change the title that people will see when you launch a Questionnaire. By default, the title of your Questionnaire will be: “Fill in this questionnaire for Your Database’s name:” To change the title of a Questionnaire:
1. On the Table menu, choose Edit Questionnaire...
2. Click the Use custom title check box at the top of the dialog.
3. Type the new title into the Use custom title: text box.
4. When you are finished making changes to your Questionnaire, click the OK button.
When the Questionnaire is launched, the new wording will be used.
Note: The Questionnaire can only display a limited amount of text. Try to keep your questions as short as possible, and be sure to launch the Questionnaire after you’ve finished editing it to make sure your question text isn’t being cut off.
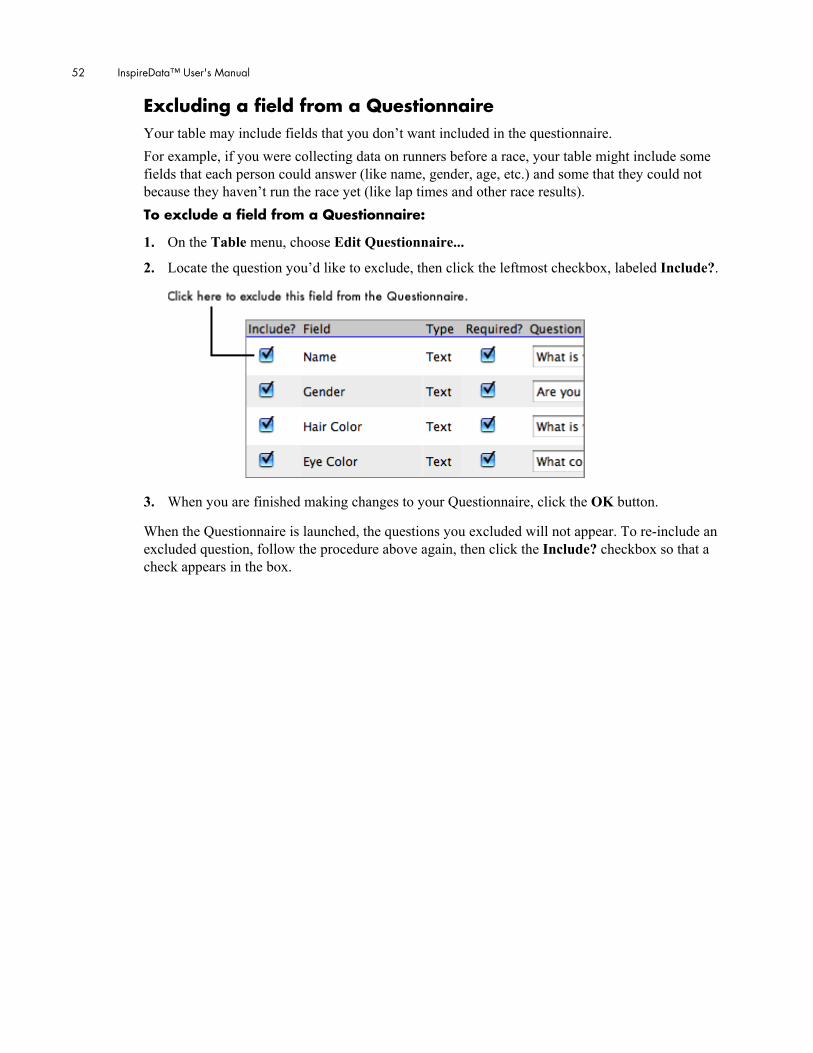
52 InspireData™ User's Manual
Excluding a field from a Questionnaire Your table may include fields that you don’t want included in the questionnaire. For example, if you were collecting data on runners before a race, your table might include some fields that each person could answer (like name, gender, age, etc.) and some that they could not because they haven’t run the race yet (like lap times and other race results). To exclude a field from a Questionnaire:
1. On the Table menu, choose Edit Questionnaire...
2. Locate the question you’d like to exclude, then click the leftmost checkbox, labeled Include?.
3. When you are finished making changes to your Questionnaire, click the OK button.
When the Questionnaire is launched, the questions you excluded will not appear. To re-include an excluded question, follow the procedure above again, then click the Include? checkbox so that a check appears in the box.

Chapter 4: Entering data using a Questionnaire 53
Requiring an answer to a question in a Questionnaire Your table may include fields that you would like answered by every respondent. For example, if you were collecting a variety of personal information from a group of people but were particularly interested in finding out what their favorite hobbies were, you can require an answer to that question before they can add their data to the table. If a question is set as required, the words “This value is required” will appear below the question in the Questionnaire. Respondents will not be able to submit their record until this field is filled out. To require an answer to a question:
1. On the Table menu, choose Edit Questionnaire...
2. Locate the question you’d like to make required, then click the checkbox labeled Required?.
3. When you are finished making changes to your Questionnaire, click the OK button.
When the Questionnaire is launched, the questions you marked as required will need to be answered before a new record can be added. To make an answer-required question optional, follow the same procedure again, then click the Required? checkbox so that a check does not appear in the box.

54 InspireData™ User's Manual
Conducting a survey using a Questionnaire Once you have your Questionnaire set up the way you like, you can conduct the survey on one or more computers.
Administering a Questionnaire on a single computer
1. Open the document you want to add records to.
2. On the Table menu, choose Launch Questionnaire...
3. Ask your subjects to come to the computer one at a time.
4. Instruct each subject to fill out the form and click the Add Record button when they are finished.
For more information, see Entering data using a Questionnaire on page 48.
5. After all of the subjects have entered their data, click the Done button.
6. On the File menu, choose Save to save your data.
Note: If one of your subjects accidentally clicks the Done button before everyone has entered their data, relaunch the survey by choosing Launch Questionnaire... on the Table menu.

Chapter 4: Entering data using a Questionnaire 55
Administering a Questionnaire on multiple computers If you are conducting a large survey, it may be helpful to administer your Questionnaire on more than one computer. For example, your survey might need to gather data from multiple classrooms. For large groups, administering a Questionnaire on multiple computers can reduce the amount of time it takes to conduct the survey. To administer a Questionnaire on multiple computers:
1. On each computer, open the document you want to add records to.
2. On the Table menu, choose Launch Questionnaire... at each computer.
3. Ask your subjects to come to each computer one at a time.
4. Instruct each subject to fill out the form and click the Add Record button when they are finished.
For more information, see Entering data using a Questionnaire on page 48.
5. After all of the subjects have entered their data, click the Done button.
Note: If one of your subjects accidentally clicks the Done button before everyone has entered their data, relaunch the survey by choosing Launch Questionnaire... on the Table menu.
6. On the File menu, choose Save to save your data at each computer.
When administering a survey on multiple computers, it is useful to save the documents from each computer to the same folder on the network with a unique name such as My survey - classroom 1.extension.
7. Open one of the saved documents.
8. Use InspireData’s Append Data feature to combine the tables from each document. For more information, see Appending data from another InspireData document to a table on page 133.

56 InspireData™ User's Manual
Chapter 5: Using icons to visually represent records
Icons are small pictures that can be used to visually identify your data in Table View and represent your data in Plot View. Icons are especially useful when your table contains many records, as each record in your table can have its own unique icon. For example, if your table contained a record for each country of the world, you could draw or import a picture of the flag for each country. This way, when you switch to Plot View, the icons will be much easier to differentiate and identify.
Drawing icons using the Icon Editor InspireData’s Icon Editor enables you to draw icons you can use to uniquely identify the records in your table. You can draw a variety of shapes and lines, then fill the shapes with different colors. After you create an icon, you can add it to the Icon Library to use with other records. To draw an icon using the Icon Editor:
1. Select the icon you want to edit by clicking on it.
2. On the Edit menu, choose Edit Icon.
The Icon Editor opens. • The Color palette is on the left side of the dialog box. This is where you will choose the
colors you will use on your icon.

Chapter 5: Using icons to visually represent records 57
• The Canvas is in the center of the dialog box. This is the area you will draw into. • The Tool palette is located between the Color palette and Canvas. This is where you will
choose the tools you will use to draw your icon. • The Size Preview boxes are on the far right of the dialog box. These show how your icon
will appear at different sizes in the Plot View. • The Icon Library is at the bottom of the dialog box. This is where you can store and
retrieve your saved icons.
3. Click a tool from the Tool palette to select it.
4. Click a color on the Color palette to use with your selected tool.
5. Click and drag on the Canvas to use your selected tool.
6. When you are finished, click the OK button to save your icon.
If you want to start off with a blank Canvas, click the Clear button after opening the Icon Editor. To find out what each of the tools in the Tool palette does, see About the Icon Editor tools on page 58.
Tip: You can also double-click the icon you want to edit to open the Icon Editor.
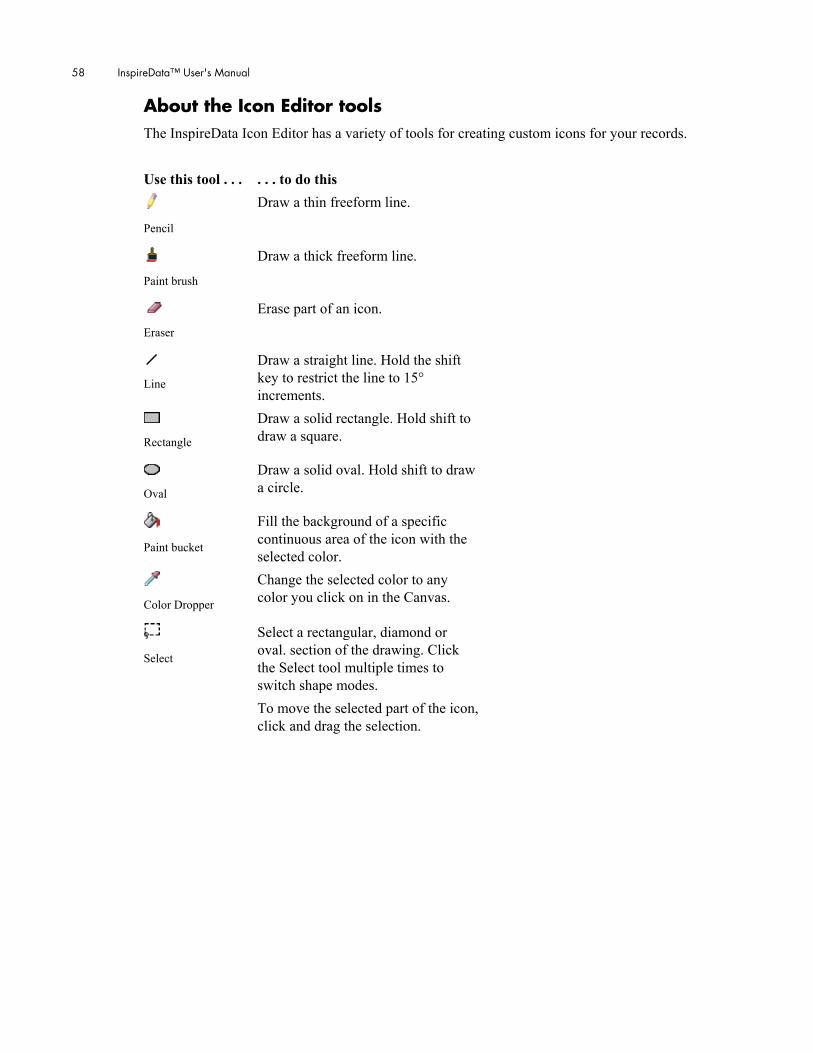
58 InspireData™ User's Manual
About the Icon Editor tools The InspireData Icon Editor has a variety of tools for creating custom icons for your records. Use this tool . . . . . . to do this
Pencil
Draw a thin freeform line.
Paint brush
Draw a thick freeform line.
Eraser
Erase part of an icon.
Line
Draw a straight line. Hold the shift key to restrict the line to 15° increments.
Rectangle
Draw a solid rectangle. Hold shift to draw a square.
Oval
Draw a solid oval. Hold shift to draw a circle.
Paint bucket
Fill the background of a specific continuous area of the icon with the selected color.
Color Dropper
Change the selected color to any color you click on in the Canvas.
Select
Select a rectangular, diamond or oval. section of the drawing. Click the Select tool multiple times to switch shape modes. To move the selected part of the icon, click and drag the selection.
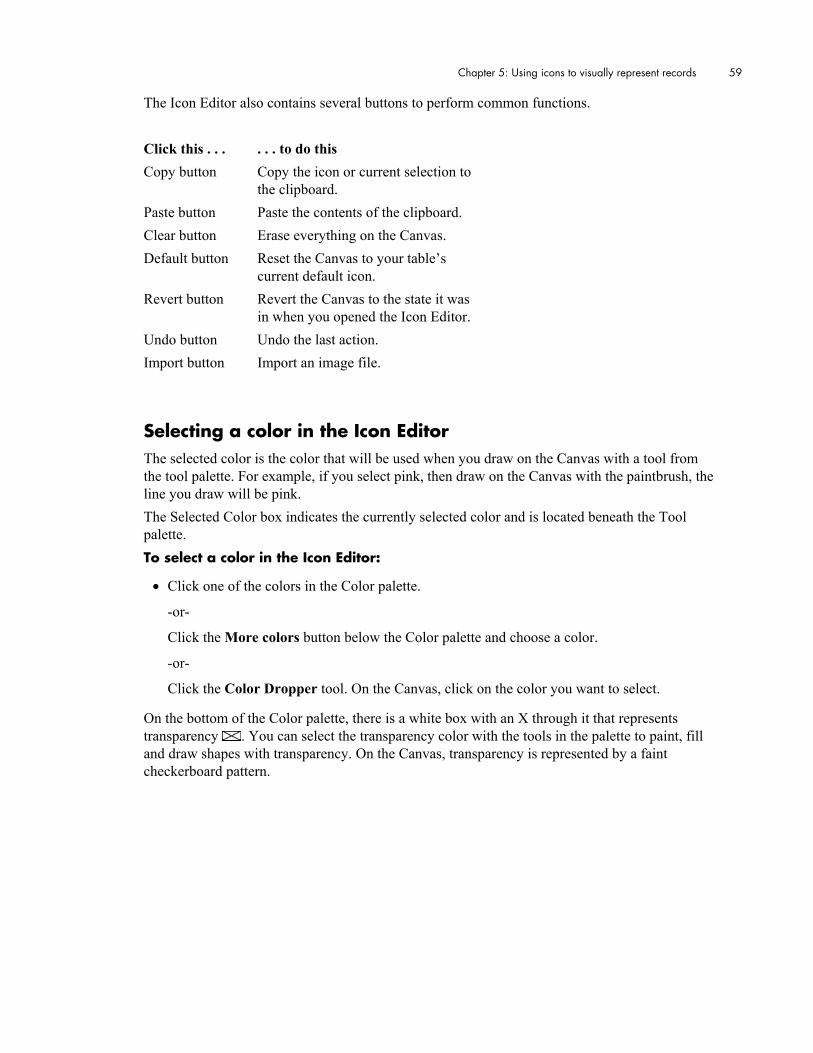
Chapter 5: Using icons to visually represent records 59
The Icon Editor also contains several buttons to perform common functions. Click this . . . . . . to do this Copy button Copy the icon or current selection to
the clipboard. Paste button Paste the contents of the clipboard. Clear button Erase everything on the Canvas. Default button Reset the Canvas to your table’s
current default icon. Revert button Revert the Canvas to the state it was
in when you opened the Icon Editor. Undo button Undo the last action. Import button Import an image file.
Selecting a color in the Icon Editor The selected color is the color that will be used when you draw on the Canvas with a tool from the tool palette. For example, if you select pink, then draw on the Canvas with the paintbrush, the line you draw will be pink. The Selected Color box indicates the currently selected color and is located beneath the Tool palette. To select a color in the Icon Editor:
• Click one of the colors in the Color palette.
-or-
Click the More colors button below the Color palette and choose a color.
-or-
Click the Color Dropper tool. On the Canvas, click on the color you want to select.
On the bottom of the Color palette, there is a white box with an X through it that represents transparency . You can select the transparency color with the tools in the palette to paint, fill and draw shapes with transparency. On the Canvas, transparency is represented by a faint checkerboard pattern.

60 InspireData™ User's Manual
Retrieving an icon from the Icon Library The Icon Library is located at the bottom of the Icon Editor. InspireData also comes with 120 icons that you can use or edit to suit your needs. The library will also temporarily store the last 10 custom icons you’ve created until you quit the application. To retrieve an icon from the Icon Library:
1. In Table View, double-click an icon to open the Icon Editor.
2. Scroll to the icon you want to retrieve from the Icon Library and click on it.
The icon from the library appears on the Canvas.
Note: When you retrieve an icon from the Icon Library, the retrieved icon replaces whatever is on the Canvas. To restore the previous contents of the Canvas, click the Undo button.
Note: You cannot store your own icons in the Icon Library. However, you can copy an icon and paste it into another table, document or application. For more information, see Copying and pasting an icon in Table View on page 61.
Importing a photograph or other image file as an icon InspireData provides a variety of simple tools to create icons, but you may want to import a photograph or a drawing you’ve drawn in another application. For example, if your table contained information on a group of people, you could import a photograph of each person into their record. Also, if your table contained information about the planets, you could save a picture of each from your web browser, then import it into InspireData. InspireData can import .GIF, .JPG, .JPEG, .TGA, .TIFF, .TIF and .PNG files for use as icons. Imported graphics will be automatically resized to fit into the space available on the Canvas of the Icon Editor. To import an image file as an icon:
1. In Table View, double-click an icon to open the Icon Editor.
2. Click the Import button.
3. Locate and click on the file you want to import.
4. Click the Open button.
When you import a photograph, you may want to trim out some of the background so that only the subject is visible. This is especially useful when plotting; if you have a group of icons that overlap, an icon with a transparent background will allow you to see the other icons underneath it. You can use the Select tool (especially the diamond and oval shapes) to create a vignette or the eraser tool to trim irregular areas. For more information, see Selecting areas of the Canvas in the Icon Editor on page 61.
Note: When you import an image file, the imported graphic replaces whatever is on the Canvas. To restore the previous contents of the Canvas, click the Undo button.

Chapter 5: Using icons to visually represent records 61
Selecting areas of the Canvas in the Icon Editor Selecting areas of the Canvas in the Icon Editor is useful for moving, erasing, copying and pasting those areas. To select an area of the Canvas:
1. In Table View, double-click an icon to open the Icon Editor.
2. Click on the Select tool.
To switch between rectangle, diamond and oval selection modes, click the Select tool until the shape you want appears.
3. Click and drag an area of the Canvas to select it.
To select a square or circular area of the Canvas, hold the Shift key.
Once you select an area of the Canvas, you can: • Press the Backspace key (Windows) or Delete key (Macintosh) to delete everything
inside of your selection. • Press Ctrl+Backspace (Windows) or Command+Delete (Macintosh) to delete
everything outside of your selection. • Click and drag inside your selection to move it. • Click the Copy button to copy the selection, then click Paste to paste it elsewhere on the
Canvas.
Copying and pasting an icon in Table View You can copy an icon in Table View, then paste it to one or more records without opening the Icon Editor. This is often the fastest way to change the icon of a group of records. You can also paste an image copied from another application. For example, if your table contained information about the eye color of a group of people, you could draw a blue circle (or import a picture of a blue eye) for one record, copy and paste that icon onto all of the other records that have blue eyes, then repeat for the other eye colors. To copy and paste an icon in Table View:
1. Select the icon you want to copy.
2. On the Edit menu, choose Copy Icon.
3. Select the record or records you want to change the icons for.
4. On the Edit menu, choose Paste Icon.
Note: To paste an image from another application—like a web browser—copy the image in the other application, then paste as noted above. For more information about copying an image in another application, please see the documentation for that application.
62 InspireData™ User's Manual
Changing the default icon of a table You can change the default icon for the new records you create. Changing the default icon for a table will also change the icons for existing records that don’t have customized icons. For example, your table could contain information about a group of plants and already contain a few records. If you decided that the icon for each record should be a leaf, you could change the default icon, which would change the icons of the existing records, plus automatically assign the same icon to all new records you create afterwards. To change the default icon of a table:
1. Double-click the icon in the top-left corner of your table (located next to the field headings).
2. Make the changes you want to make to the icon.
3. When you are finished, click the OK button.
When you change the default icon, the icons that were assigned to the old default icon will be updated with the new one.

Chapter 6: Organizing data using multiple tables 63
Chapter 6: Organizing data using multiple tables
You can create multiple tables in a single document. This is useful when you have multiple sets of similar records.
For example, you could have several classrooms performing the same experiment on multiple sets of subjects. You could also have multiple types of experiments performed on one set of subjects. Since you will probably want to have easy access to all of your data sets while entering and examining data for that project, multiple tables make more sense than multiple documents. Multiple tables are especially useful when used with linked fields, which allow you to access any of the data in one table from another. For more information, see Linking data in multiple tables on page 65.
Adding a new table to your document Multiple tables are useful when you have more than one set of similar or related data. You can add up to 10 different tables to a single document. To add a new table to your document:
• On the Table menu, choose New Table.
Switching between tables in a document with multiple tables When a document contains more than one table, a tab for each table is displayed above the Toolbar.
64 InspireData™ User's Manual
To switch between tables in a document with multiple tables:
• Click the tab of the table you want to view.
Note: If your document contains slides using a table other than the one you have selected, viewing that slide will switch you to that table. For more information, see Viewing a captured slide on page 128.
Renaming a table When a new table is created, it is given a generic name like Table 1. You may want to rename your tables to easily identify which tab contains what data. To rename a table:
1. On the Table menu, choose Table Properties.
2. Type the new name into the Name text box, then click OK.
Duplicating an existing table If the tables you want to enter into your document are very similar, you can enter the fields and records into one table, duplicate it, then modify the data in the duplicated copy. For example, if you performed the same experiment on two separate groups of plants and wanted to record the results for each group in a separate table, you could set up your fields once, then duplicate that table. This way, you won’t have to set up your fields twice. To duplicate an existing table:
• On the Table menu, choose Duplicate Table.

Chapter 6: Organizing data using multiple tables 65
Linking data in multiple tables A link field can be used to plot or calculate formulas with data contained in another table. This is especially useful when you have multiple tables with related information. When data from another table is linked, it can be accessed in Plot View and in formulas as well.
For example, if your document contained a table with information for the top 50 scorers in a basketball league, you could create another table in the same document containing information on each team in the league, then link each player to their corresponding team. You could then plot the information from one table against the information of the other: the points scored by each player against the team’s win/loss percentage for example. For more information, see Plotting link fields on page 116.
Creating a link field You can change to the link data type just like any other data type. Once you do, you will then have to link the records within the link field to a record in the linked table. To create a link field:
1. In a document with two or more tables, click the field heading of the field you want to link.
2. Click the Field type menu and choose Link.
3. Select the table you want to link to and click OK.
4. For each record in the link field, type the record ID of the record in the linked table you want to link to.
If the record ID you enter is not found in the linked table, InspireData will not accept the input.
The link ID is usually the data in the leftmost cell of the record in the linked table. For more information, see Identifying and changing the record ID of a table on page 66.

66 InspireData™ User's Manual
Identifying and changing the record ID of a table Every table designates one field as the record ID field. Record IDs are especially useful when linking a record in one table to another. To identify the record ID field of a table:
1. On the Table menu, choose Table Properties.
The drop-down menus near the bottom of the dialog identify which field is being used as the record ID field.
If you are linking your table to another, you may want to click the Display record ID field checkbox.
2. When you are finished, click the OK button.
You can also change the field InspireData uses as the record ID if the automatically chosen field contains data that is too hard to remember or type. To change the record ID field of a table:
1. On the Table menu, choose Table Properties.
2. Select a field to use as the record ID field using the drop-down menus near the bottom of the dialog.
3. If you want to use more than one field to generate the record ID field, choose another field to use.
4. When you are finished, click the OK button.
Note: If you change the record ID field of a table being linked to, InspireData will automatically change the values in the linking table to match the new record ID field.
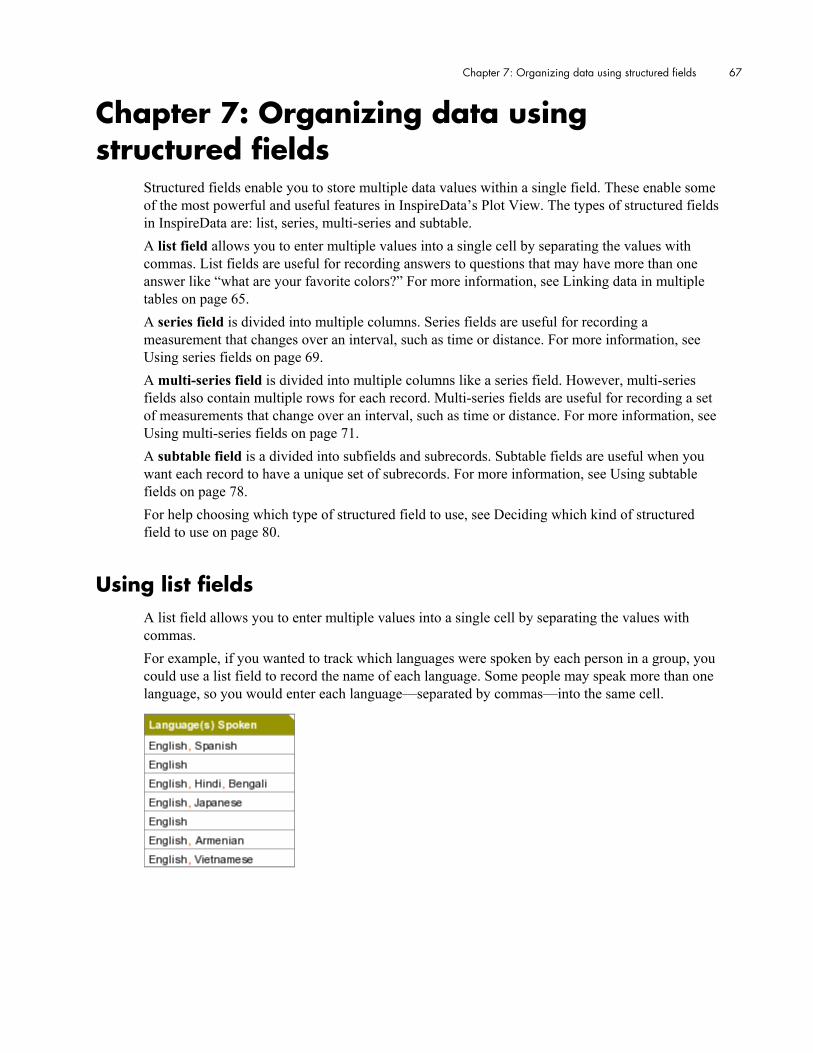
Chapter 7: Organizing data using structured fields 67
Chapter 7: Organizing data using structured fields
Structured fields enable you to store multiple data values within a single field. These enable some of the most powerful and useful features in InspireData’s Plot View. The types of structured fields in InspireData are: list, series, multi-series and subtable. A list field allows you to enter multiple values into a single cell by separating the values with commas. List fields are useful for recording answers to questions that may have more than one answer like “what are your favorite colors?” For more information, see Linking data in multiple tables on page 65. A series field is divided into multiple columns. Series fields are useful for recording a measurement that changes over an interval, such as time or distance. For more information, see Using series fields on page 69. A multi-series field is divided into multiple columns like a series field. However, multi-series fields also contain multiple rows for each record. Multi-series fields are useful for recording a set of measurements that change over an interval, such as time or distance. For more information, see Using multi-series fields on page 71. A subtable field is a divided into subfields and subrecords. Subtable fields are useful when you want each record to have a unique set of subrecords. For more information, see Using subtable fields on page 78. For help choosing which type of structured field to use, see Deciding which kind of structured field to use on page 80.
Using list fields A list field allows you to enter multiple values into a single cell by separating the values with commas. For example, if you wanted to track which languages were spoken by each person in a group, you could use a list field to record the name of each language. Some people may speak more than one language, so you would enter each language—separated by commas—into the same cell.

68 InspireData™ User's Manual
Because a list field allows multiple values, each language can be treated separately. This comes in handy when plotting.
Notice that the icons for the bilingual records are listed in each category. Because each value in the list (language) is treated individually, a record can be shown in two places at one time. When this occurs, the record’s icon becomes translucent, indicating that it has split.
Creating a list field
1. Select the field you want to change.
2. Click the Field type button, then choose List.
When you enter your data, separate each value with a comma.
Note: If your data contains a comma, such as the phrase Et tu, brute, use quotes around the entire phrase. For example: “Et tu, brute” or “I think, therefore I am.”

Chapter 7: Organizing data using structured fields 69
Using series fields A series field is divided into multiple columns. Series fields are useful for recording a measurement that changes over an interval, such as time or distance. For example, if you were recording the height of a group of plants over the course of a month, you could create a series field with a separate column for each day.
When a series field is plotted, you can see how the data changes over time because it stores multiple columns of data in a single field. This enables you to create line graphs as well as other types of series-based plots. For more information, see Plotting series and multi-series fields on page 105.
Creating a series field
1. Click the Add Field button on the Toolbar to create a new field.
-or-
Select the field you want to convert into a series field.
2. Click the Field type button, and choose Series...

70 InspireData™ User's Manual
The Series field dialog appears.
3. To use a repeating pattern of numbers for your column headings (1, 2, 3; 25, 50, 75; etc.), click the Pattern radio button, type in the number you want to start from in the from box, the number you want to end at in the to box, and the interval you want between each heading in the in steps of box.
-or-
To use a list of headings (empty, halfway, full; red, green, blue), click the List of headings radio button, and enter your headings into the column headings text box, separating each with a comma.
4. Enter the units of measure that your headings represent into the headings stand for box. (For
example, if your headings listed the years between 1900 and 2000 in 4 year intervals, you would enter Year.)
5. Choose a data type from the data type menu.
6. When you are finished setting your options, click the OK button.
Note: You can change the headings of a series field at any time after you create one. Select the field you want to change, click the Field type button, choose Series, then select Column Headings.
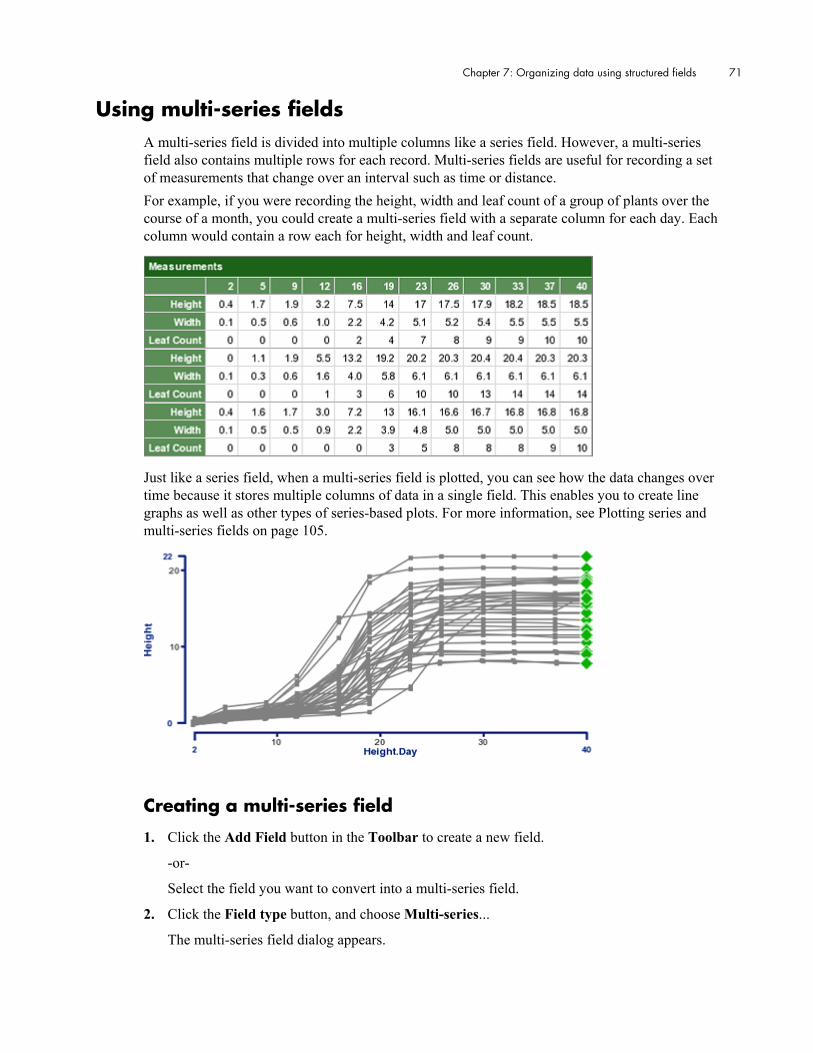
Chapter 7: Organizing data using structured fields 71
Using multi-series fields A multi-series field is divided into multiple columns like a series field. However, a multi-series field also contains multiple rows for each record. Multi-series fields are useful for recording a set of measurements that change over an interval such as time or distance. For example, if you were recording the height, width and leaf count of a group of plants over the course of a month, you could create a multi-series field with a separate column for each day. Each column would contain a row each for height, width and leaf count.
Just like a series field, when a multi-series field is plotted, you can see how the data changes over time because it stores multiple columns of data in a single field. This enables you to create line graphs as well as other types of series-based plots. For more information, see Plotting series and multi-series fields on page 105.
Creating a multi-series field
1. Click the Add Field button in the Toolbar to create a new field.
-or-
Select the field you want to convert into a multi-series field.
2. Click the Field type button, and choose Multi-series...
The multi-series field dialog appears.
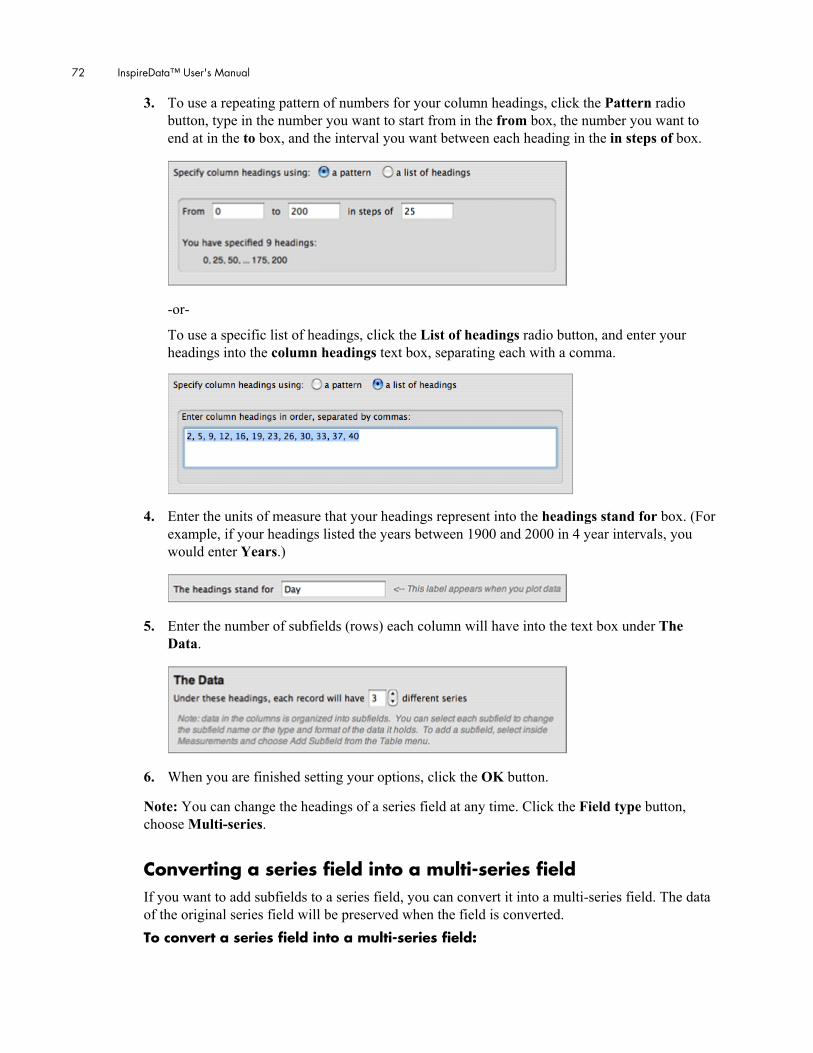
72 InspireData™ User's Manual
3. To use a repeating pattern of numbers for your column headings, click the Pattern radio button, type in the number you want to start from in the from box, the number you want to end at in the to box, and the interval you want between each heading in the in steps of box.
-or-
To use a specific list of headings, click the List of headings radio button, and enter your headings into the column headings text box, separating each with a comma.
4. Enter the units of measure that your headings represent into the headings stand for box. (For
example, if your headings listed the years between 1900 and 2000 in 4 year intervals, you would enter Years.)
5. Enter the number of subfields (rows) each column will have into the text box under The
Data.
6. When you are finished setting your options, click the OK button.
Note: You can change the headings of a series field at any time. Click the Field type button, choose Multi-series.
Converting a series field into a multi-series field If you want to add subfields to a series field, you can convert it into a multi-series field. The data of the original series field will be preserved when the field is converted. To convert a series field into a multi-series field:
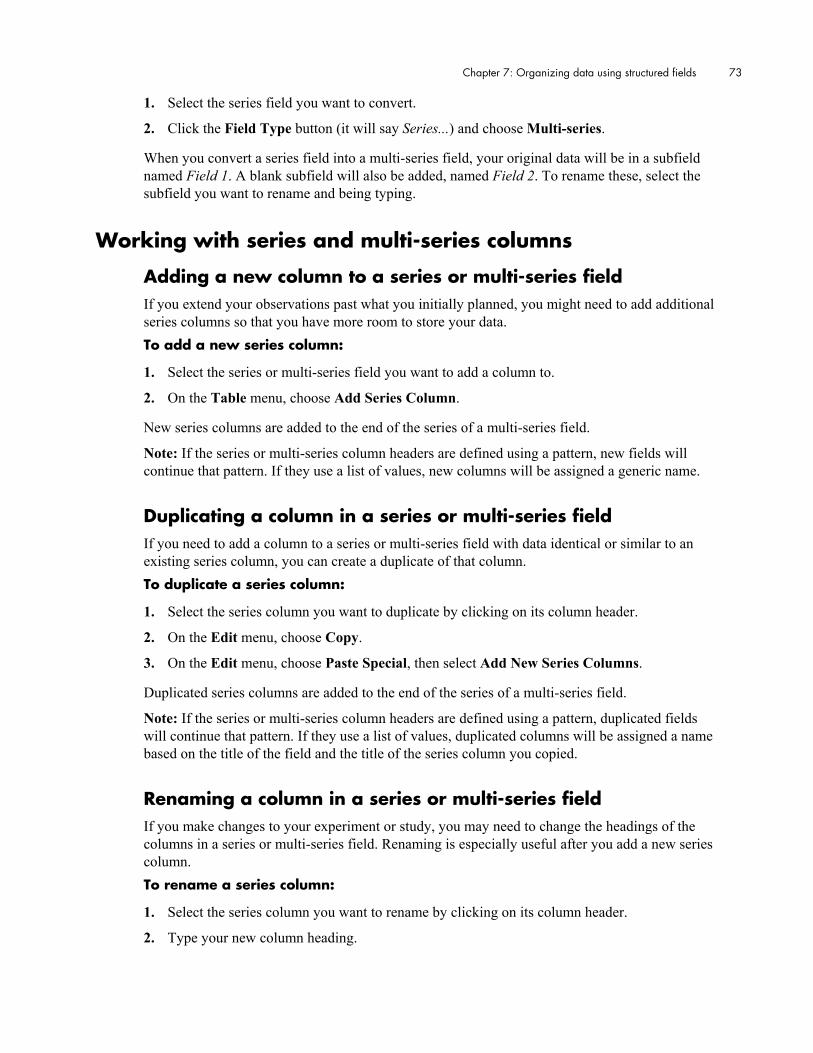
Chapter 7: Organizing data using structured fields 73
1. Select the series field you want to convert.
2. Click the Field Type button (it will say Series...) and choose Multi-series.
When you convert a series field into a multi-series field, your original data will be in a subfield named Field 1. A blank subfield will also be added, named Field 2. To rename these, select the subfield you want to rename and being typing.
Working with series and multi-series columns
Adding a new column to a series or multi-series field If you extend your observations past what you initially planned, you might need to add additional series columns so that you have more room to store your data. To add a new series column:
1. Select the series or multi-series field you want to add a column to.
2. On the Table menu, choose Add Series Column.
New series columns are added to the end of the series of a multi-series field.
Note: If the series or multi-series column headers are defined using a pattern, new fields will continue that pattern. If they use a list of values, new columns will be assigned a generic name.
Duplicating a column in a series or multi-series field If you need to add a column to a series or multi-series field with data identical or similar to an existing series column, you can create a duplicate of that column. To duplicate a series column:
1. Select the series column you want to duplicate by clicking on its column header.
2. On the Edit menu, choose Copy.
3. On the Edit menu, choose Paste Special, then select Add New Series Columns.
Duplicated series columns are added to the end of the series of a multi-series field.
Note: If the series or multi-series column headers are defined using a pattern, duplicated fields will continue that pattern. If they use a list of values, duplicated columns will be assigned a name based on the title of the field and the title of the series column you copied.
Renaming a column in a series or multi-series field If you make changes to your experiment or study, you may need to change the headings of the columns in a series or multi-series field. Renaming is especially useful after you add a new series column. To rename a series column:
1. Select the series column you want to rename by clicking on its column header.
2. Type your new column heading.
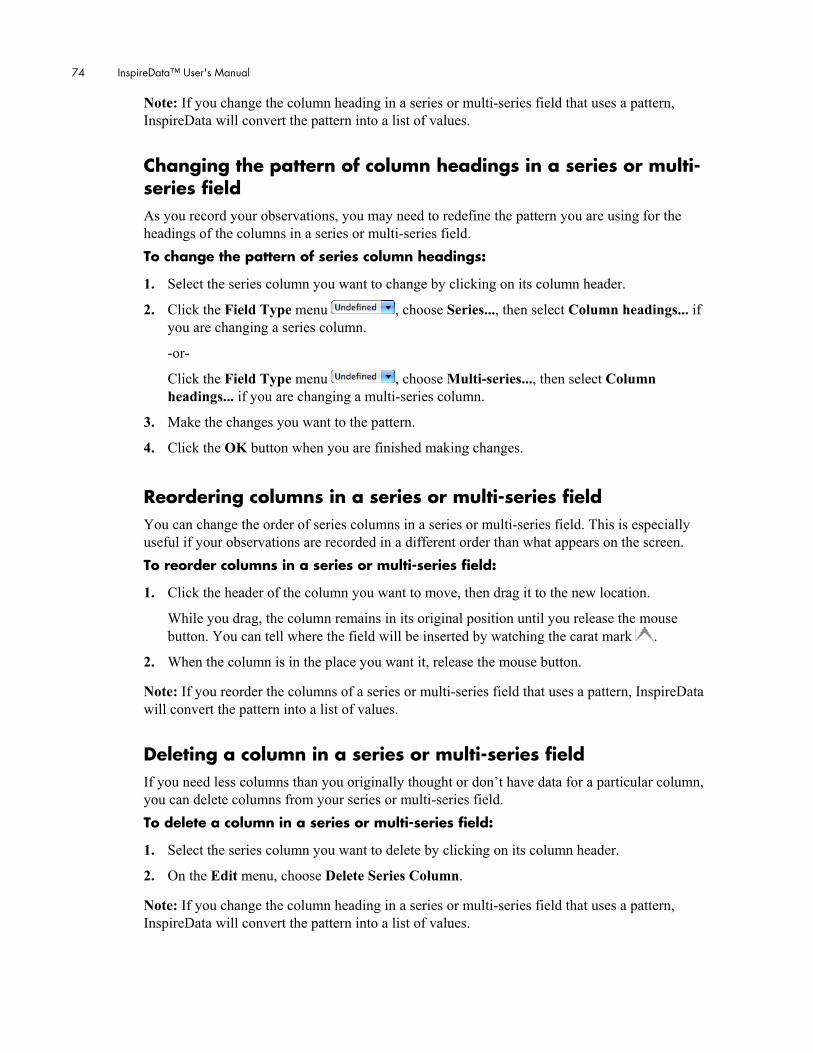
74 InspireData™ User's Manual
Note: If you change the column heading in a series or multi-series field that uses a pattern, InspireData will convert the pattern into a list of values.
Changing the pattern of column headings in a series or multi-series field As you record your observations, you may need to redefine the pattern you are using for the headings of the columns in a series or multi-series field. To change the pattern of series column headings:
1. Select the series column you want to change by clicking on its column header.
2. Click the Field Type menu , choose Series..., then select Column headings... if you are changing a series column.
-or-
Click the Field Type menu , choose Multi-series..., then select Column headings... if you are changing a multi-series column.
3. Make the changes you want to the pattern.
4. Click the OK button when you are finished making changes.
Reordering columns in a series or multi-series field You can change the order of series columns in a series or multi-series field. This is especially useful if your observations are recorded in a different order than what appears on the screen. To reorder columns in a series or multi-series field:
1. Click the header of the column you want to move, then drag it to the new location.
While you drag, the column remains in its original position until you release the mouse button. You can tell where the field will be inserted by watching the carat mark .
2. When the column is in the place you want it, release the mouse button.
Note: If you reorder the columns of a series or multi-series field that uses a pattern, InspireData will convert the pattern into a list of values.
Deleting a column in a series or multi-series field If you need less columns than you originally thought or don’t have data for a particular column, you can delete columns from your series or multi-series field. To delete a column in a series or multi-series field:
1. Select the series column you want to delete by clicking on its column header.
2. On the Edit menu, choose Delete Series Column.
Note: If you change the column heading in a series or multi-series field that uses a pattern, InspireData will convert the pattern into a list of values.

Chapter 7: Organizing data using structured fields 75
Working with multi-series subfields
Adding a new subfield to a multi-series field If you add another measurement to your observations, you can add additional subfields to record your additional data. To add a subfield to a multi-series field:
1. Select the multi-series field you want to add a subfield to.
2. On the Table menu, select Add Subfield.
3. Type a name for the new subfield, then press Enter (Windows) or Return (Macintosh) when you are finished.
A new subfield is added for each record in your table.
Selecting a subfield in a multi-series field Multi-series fields contain subfields, which appear as rows. Each record will have an identical set of subfields, so when you select an entire subfield and make changes such as copying, pasting or renaming, the change will be reflected in each record. To select a subfield:
• Click on the header of the subfield you want to select. The header is the darker-colored cell on the left side of the multi-series field.
When you select a subfield, the subfield you clicked on and the corresponding subfield in every other record will turn yellow to indicate that it is selected.
Duplicating a subfield in a multi-series field If you need to add a subfield to each record with data identical or similar to an existing subfield, you can create a duplicate of that subfield. To duplicate a subfield:
1. Select the subfield you want to duplicate by clicking on its subfield heading.
2. On the Edit menu, choose Copy.
3. On the Edit menu, choose Paste Special, then select Add Fields to Multi-series.
The copied subfield will be added to each record. Pasted subfields are added below your current selection.

76 InspireData™ User's Manual
Renaming a subfield in a multi-series field If you make changes to your experiment or study, you may need to change the headings of the subfield in a multi-series field. Since the subfield headings in each record must be the same, renaming a subfield in one record will automatically update the corresponding subfield in the other records. To rename a subfield:
1. Select the subfield you want to rename by clicking on its subfield heading.
2. Type a new name for the subfield.
3. When you are finished, press Enter (Windows) or Return (Macintosh).
-or-
Click the Accept button to accept the changes or the Reject button to reject the changes.
The name of the subfield will be changed for each record.
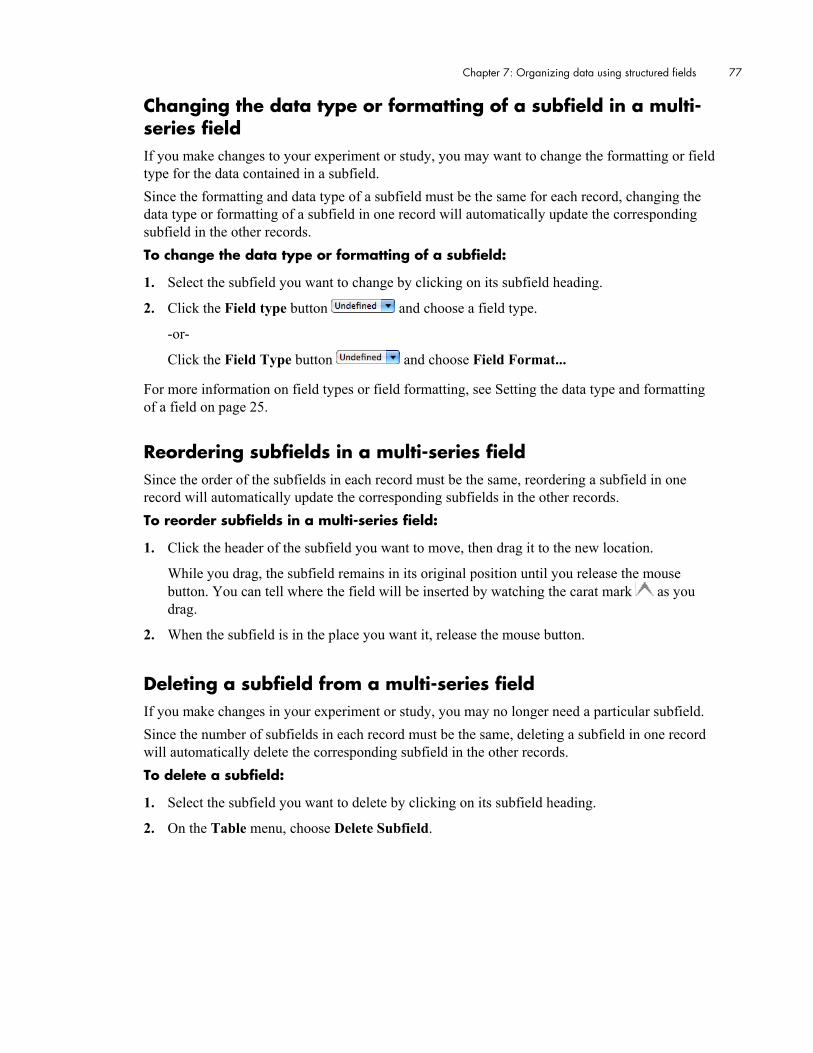
Chapter 7: Organizing data using structured fields 77
Changing the data type or formatting of a subfield in a multi-series field If you make changes to your experiment or study, you may want to change the formatting or field type for the data contained in a subfield. Since the formatting and data type of a subfield must be the same for each record, changing the data type or formatting of a subfield in one record will automatically update the corresponding subfield in the other records. To change the data type or formatting of a subfield:
1. Select the subfield you want to change by clicking on its subfield heading.
2. Click the Field type button and choose a field type.
-or-
Click the Field Type button and choose Field Format...
For more information on field types or field formatting, see Setting the data type and formatting of a field on page 25.
Reordering subfields in a multi-series field Since the order of the subfields in each record must be the same, reordering a subfield in one record will automatically update the corresponding subfields in the other records. To reorder subfields in a multi-series field:
1. Click the header of the subfield you want to move, then drag it to the new location.
While you drag, the subfield remains in its original position until you release the mouse button. You can tell where the field will be inserted by watching the carat mark as you drag.
2. When the subfield is in the place you want it, release the mouse button.
Deleting a subfield from a multi-series field If you make changes in your experiment or study, you may no longer need a particular subfield. Since the number of subfields in each record must be the same, deleting a subfield in one record will automatically delete the corresponding subfield in the other records. To delete a subfield:
1. Select the subfield you want to delete by clicking on its subfield heading.
2. On the Table menu, choose Delete Subfield.

78 InspireData™ User's Manual
Using subtable fields A subtable field is a divided into subfields and subrecords. Subtable fields are useful when you want each record to contain a unique number of subrecords. For example, if you were cataloging information about the planets in the Solar system, you could use a subtable to list information about the moons of each planet. The subfields and subrecords can be selected, copied, pasted and more, just like regular fields and records. For more information on how to do these things, see Working with fields on page 23 and Working with records on page 34.
Creating a subtable field
1. Click the Add Field button in the Toolbar to create a new field.
-or-
Select the field you want to convert into a subtable field.
2. Click the Field type button, and choose Subtable.
New subtables contain two subfields named Field 1 and Field 2. You can move, copy, paste and set the data type for subfields just as you do with regular fields. For more information, see Working with fields on page 23.
Adding a subfield to a subtable As you expand your subtable, you may need to add additional subfields. To add a subfield to a subtable:
1. Select the subtable field you want to add a subfield to.
2. On the Table menu, choose Add Subfield.
New subfields are added to the end of the series of the subtable.
Adding a subrecord to a subtable When a subtable is first created, none of the records contain subrecords. This is because often only a few records in a table will require use of the subtable. To add a subrecord to a subtable:
1. Select the cell in the subtable field of the record you want to add a subrecord to.
2. On the Table menu, choose Add Subrecord.
You can move, copy, paste and set the data type for subrecords just as you do with regular records. For more information, see Working with records on page 34.

Chapter 7: Organizing data using structured fields 79
Expanding and collapsing a subtable Many other data tools do not share InspireData’s ability to organize data into subtables and instead use a flat table with redundant data for each record in a subtable. You can expand and compress your InspireData subtables to switch between these two organization methods.
For example, if you have a table with a normal single value field and a subtable field with 3 subfields, when you expand the subtable, you will end up with four single value fields (the original single value field plus the 3 subfields) and an extra record for each subrecord contained in the subtable.
To expand a subtable:
1. Select the subtable field you want to expand.
2. On the Table menu, choose Transform, then select Expand.
The table now includes one record for every row of the subtable, with data outside of the subtable repeated for each new row.
To compress a subtable:
1. Select the leftmost field with redundant data you want to compress. (In the prior example, it would be the Record Number field.)
2. On the Table menu, choose Transform, then select Collapse.
The table now contains just one record for each redundant record in the field you selected and a subtable with subrecords for the non-redundant data for each record.

80 InspireData™ User's Manual
Deciding which kind of structured field to use Deciding which kind of structured field to use can be a confusing task. Below are a set of questions that can help you decide:
1. Will each of the records you enter have the same number of values? • For example, if you are taking the same set of measurements on each thing in a group,
answer yes. • If you were recording whether an animal had spots—and if so, how many—answer no. • If you were asking someone to list their favorite three foods, answer yes. If you wouldn’t
specify how many of their favorite foods to list, answer no.
2. Will each of the records you enter contain more than one kind of measurement? • For example, if you were measuring the height, width, depth and weight of each object in
a set, answer yes. • If you were measuring only the height of each object in a set, answer no. • If you were asking someone to list their favorite food only, answer no. If you were asking
for their favorite food, color and type of music, answer yes.
• If you answered no to both questions, use a list field. For more information, see Using list fields on page 67.
• If you answered yes to Question 1 and no to Question 2, use a series field. For more information, see Using series fields on page 69.
• If you answered yes to both questions, use a multi-series field. For more information, see Using multi-series fields on page 71.
• If you answered no to Question 1 and yes to Question 2, use a subtable field. For more information, see Using subtable fields on page 78.
Remember that you can convert any structured field to another type at any time. For more information, see Converting structured fields on page 81.
Chapter 7: Organizing data using structured fields 81
Converting structured fields As you continue to build your table, you may find that you need to change one kind of structured field into another to accommodate the data you are trying to record. For example, if you initially created a series field to record the height of a group of plants, then decided to record both the height, width and leaf count of those plants, you can convert your series field into a multi-series field. When you convert a structured field containing data, InspireData will attempt to preserve as much of the data as possible. To convert one type of structured field into another:
1. Select the field you want to convert.
2. On the Toolbar, click the Field Type menu and select the field type you want to change to.
Depending on the field type you choose, you may be presented with options. For more information, see the documentation for that field type.
If converting the selected field type will cause some information to be discarded, InspireData will ask if you want to proceed.
The data from the original field will be reorganized to fit the new structured field. InspireData will attempt to translate the original field’s data into the new structure as logically as possible.
If the conversion will result in a loss of some data, InspireData will ask if you want to continue. If the results are not acceptable, choose Undo from the Edit menu.
Moving series columns and subfields in and out of structured fields
Series columns and subfields in series, multi-series and subtable fields can be moved around the table. This may be useful when you want to keep just one subfield in a subtable or want to move data from a series field to a multi-series field. To move a series column or subfield out of a structured field:
1. Select the series column or subfield you want to move, then drag it to the new location.
While you drag, the series column or subfield remains in its original position until you release the mouse button. You can tell where the field will be inserted by watching the carat mark .
2. When the series column or subfield is in the place you want it, release the mouse button.
InspireData will automatically adapt the series column or subfield you moved to its new location. For example, if you placed a series column next to a single value field, the series column would change into a normal single value field as well. If you moved a multi-series column next to a single value field, it would change into a subtable field. If you dragged it into a subtable field, it would adapt its structure to become a subfield.
Additionally, you can drag single value columns into a series, multi-series or subtable field.

82 InspireData™ User's Manual
Chapter 8: Creating plots A plot is a visual representation of your data. Using the Venn, Stack, Axis and Pie plot types, you can change the formation of your data and visually discover correlations. Each plot type represents your data in a unique way, helping you find hidden patterns and relationships that may otherwise be missed. As you make changes to your plots, InspireData will fluidly animate the movement of your records. This enables an even deeper understanding of the data because you can actually see how the relationship between data points changes. The data in Plot View is taken directly from the Table View and is represented by icons. Exploring your data in Plot View does not change the data in Table View.
Tools for creating plots InspireData provides a variety of tools to manipulate, mark and identify the data in your plot. Your plot appears in the workspace, which is where you will set and change the parameters for each plot. The Legend appears above the workspace when you have icon coloring turned on and displays information when you select areas of the workspace. In Plot View, the Toolbar is located at the bottom of the screen. The Slide Sorter allows you to store, organize and view notable plots. The notes area provides a space to annotate your plot and data.
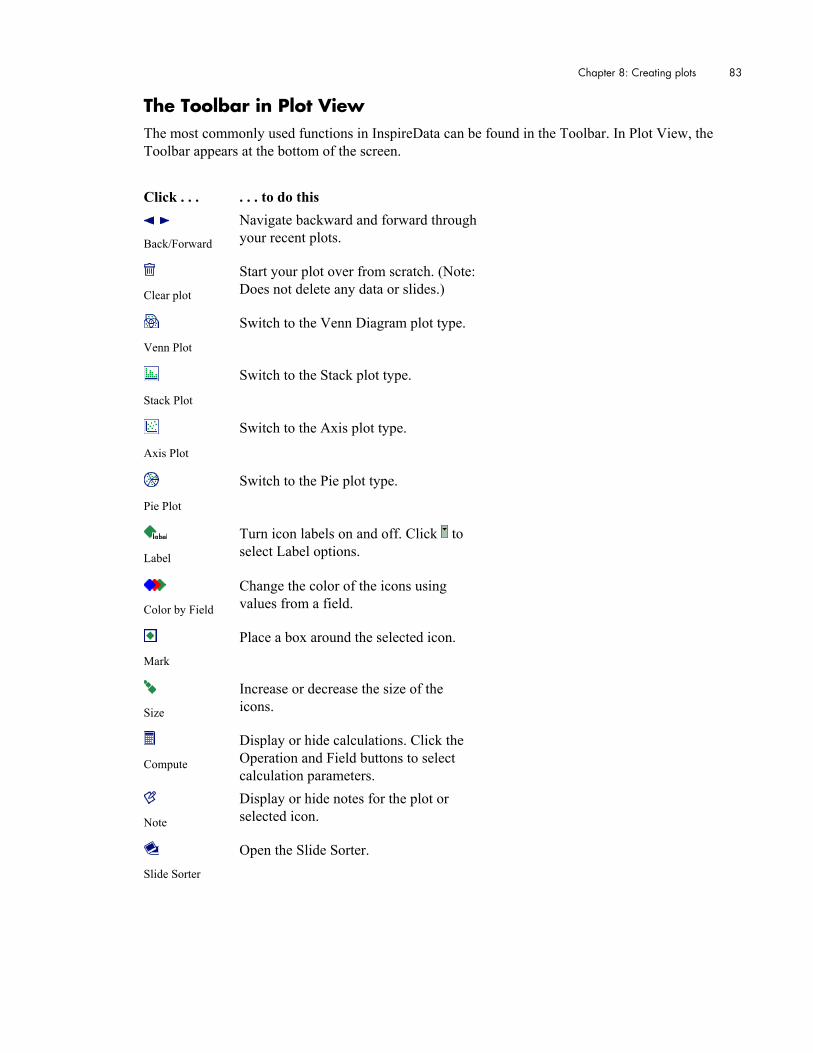
Chapter 8: Creating plots 83
The Toolbar in Plot View The most commonly used functions in InspireData can be found in the Toolbar. In Plot View, the Toolbar appears at the bottom of the screen. Click . . . . . . to do this
Back/Forward
Navigate backward and forward throughyour recent plots.
Clear plot
Start your plot over from scratch. (Note: Does not delete any data or slides.)
Venn Plot
Switch to the Venn Diagram plot type.
Stack Plot
Switch to the Stack plot type.
Axis Plot
Switch to the Axis plot type.
Pie Plot
Switch to the Pie plot type.
Label
Turn icon labels on and off. Click to select Label options.
Color by Field
Change the color of the icons using values from a field.
Mark
Place a box around the selected icon.
Size
Increase or decrease the size of the icons.
Compute
Display or hide calculations. Click the Operation and Field buttons to select calculation parameters.
Note
Display or hide notes for the plot or selected icon.
Slide Sorter
Open the Slide Sorter.

84 InspireData™ User's Manual
Creating a Free plot When you switch from Table View to Plot View for the first time, you create a Free plot. A Free plot enables you to move icons on the workspace without restrictions.
Free plots are useful when you want to arrange your icons in a way that isn’t available using Venn, Stack, Axis or Pie plots. If you’ve created one of these types of plots, you can return to the Free plot by clicking on the Plot Type button of the plot that is currently being displayed. For example, if your plot type is Pie plot, click the Pie Plot button to return to Free plot. The Color by Field and Label options are particularly useful in Free plots. For more information, see Coloring icons by field to add information to a plot on page 121 and Labeling icons in Plot View on page 119.
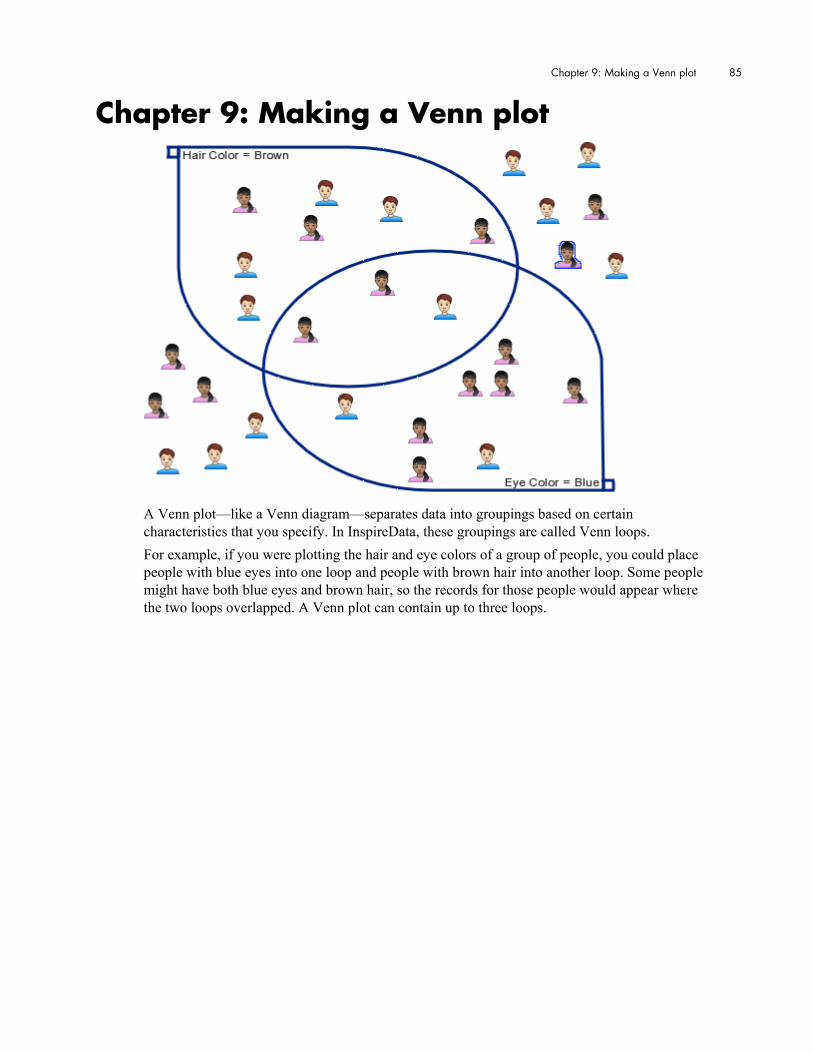
Chapter 9: Making a Venn plot 85
Chapter 9: Making a Venn plot
A Venn plot—like a Venn diagram—separates data into groupings based on certain characteristics that you specify. In InspireData, these groupings are called Venn loops. For example, if you were plotting the hair and eye colors of a group of people, you could place people with blue eyes into one loop and people with brown hair into another loop. Some people might have both blue eyes and brown hair, so the records for those people would appear where the two loops overlapped. A Venn plot can contain up to three loops.
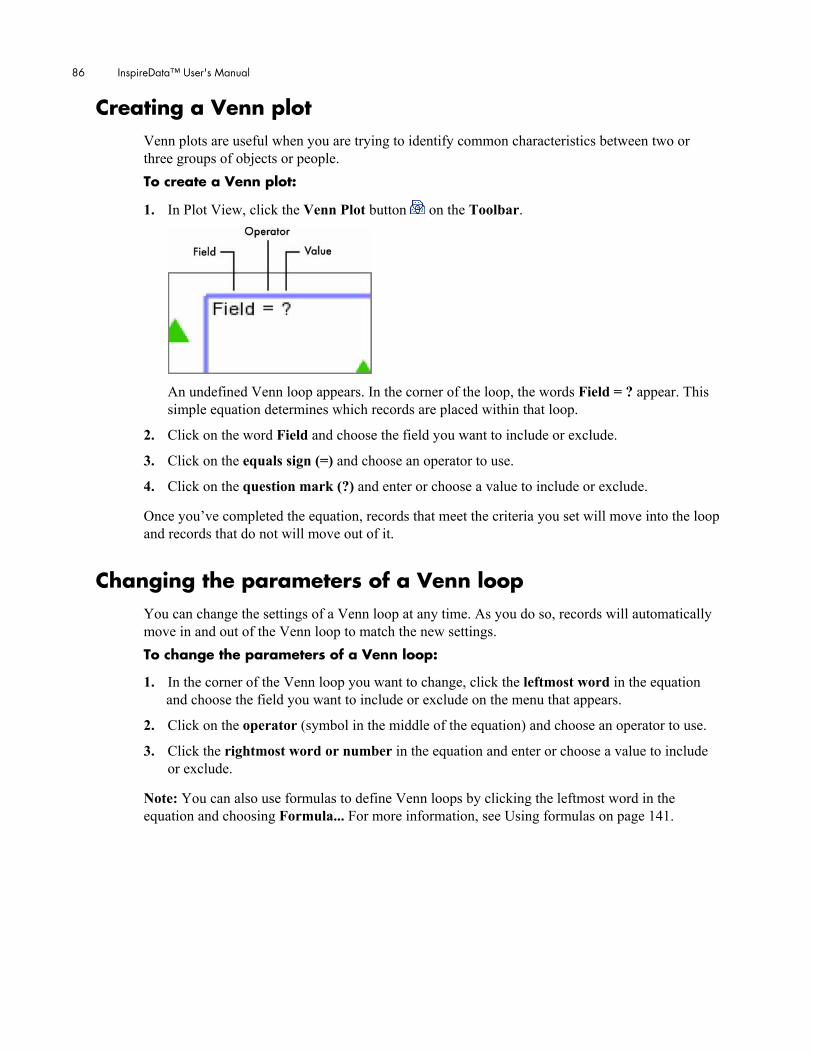
86 InspireData™ User's Manual
Creating a Venn plot Venn plots are useful when you are trying to identify common characteristics between two or three groups of objects or people. To create a Venn plot:
1. In Plot View, click the Venn Plot button on the Toolbar.
An undefined Venn loop appears. In the corner of the loop, the words Field = ? appear. This simple equation determines which records are placed within that loop.
2. Click on the word Field and choose the field you want to include or exclude.
3. Click on the equals sign (=) and choose an operator to use.
4. Click on the question mark (?) and enter or choose a value to include or exclude.
Once you’ve completed the equation, records that meet the criteria you set will move into the loop and records that do not will move out of it.
Changing the parameters of a Venn loop You can change the settings of a Venn loop at any time. As you do so, records will automatically move in and out of the Venn loop to match the new settings. To change the parameters of a Venn loop:
1. In the corner of the Venn loop you want to change, click the leftmost word in the equation and choose the field you want to include or exclude on the menu that appears.
2. Click on the operator (symbol in the middle of the equation) and choose an operator to use.
3. Click the rightmost word or number in the equation and enter or choose a value to include or exclude.
Note: You can also use formulas to define Venn loops by clicking the leftmost word in the equation and choosing Formula... For more information, see Using formulas on page 141.

Chapter 9: Making a Venn plot 87
Adding an additional Venn loop to a Venn plot Once you’ve created a Venn plot, you may want to add another loop. A Venn plot can contain up to three loops. To add a Venn loop:
1. In the lower-left corner of the workspace, click the Add Venn Loop button .
2. Click on the word Field and choose the field you want to include or exclude.
3. Click on the equals sign (=) and choose an operator to use.
4. Click on the question mark (?) and enter or choose a value to include or exclude.
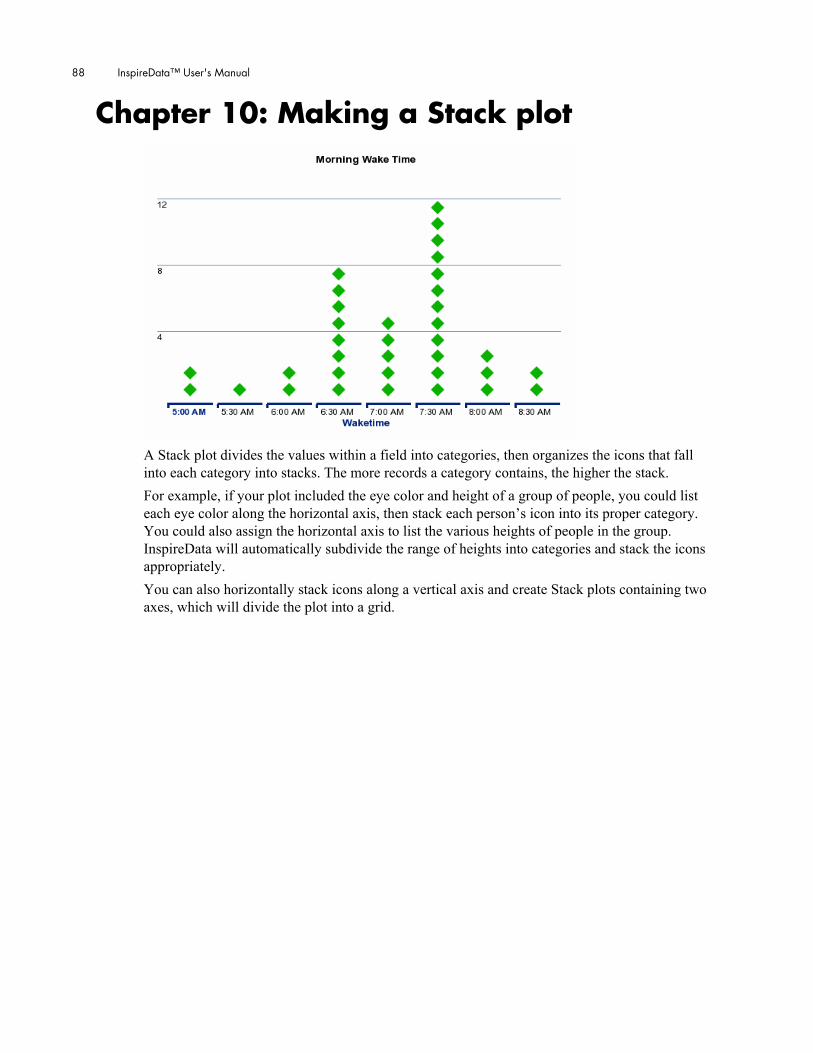
88 InspireData™ User's Manual
Chapter 10: Making a Stack plot
A Stack plot divides the values within a field into categories, then organizes the icons that fall into each category into stacks. The more records a category contains, the higher the stack. For example, if your plot included the eye color and height of a group of people, you could list each eye color along the horizontal axis, then stack each person’s icon into its proper category. You could also assign the horizontal axis to list the various heights of people in the group. InspireData will automatically subdivide the range of heights into categories and stack the icons appropriately. You can also horizontally stack icons along a vertical axis and create Stack plots containing two axes, which will divide the plot into a grid.

Chapter 10: Making a Stack plot 89
Creating a Stack plot Stack plots are useful for quickly representing the number of records contained within a set of categories or range of numbers. To create a Stack plot:
1. In Plot View, click the Stack Plot button on the Toolbar.
Since no field is assigned to the horizontal axis, all of the icons will form a single stack in the center of the workspace.
2. Click on the Axis Label, then choose the field you want to assign.
After you assign a field to the X axis, the records will move into their proper categories. You can change what field is assigned to the axis at any time. The numbers on the left side of the plot can help you count the number of icons in a stack.
Note: When there are more categories in your document than there is room to display, InspireData will create an Other category where the categories with the lowest quantity of records are combined.
Reassigning a field to an axis When you assign a field to an axis, InspireData plots the values contained in that field. You can reassign an axis at any time. Axes are available in Stack, Axis and Pie plots.
To reassign a field to an axis:
1. In Plot View, click the Axis Label of the axis you want to reassign.
2. Select a field to assign from the menu that appears.
The Axis Label will change to display the name of the field you selected.

90 InspireData™ User's Manual
Assigning a formula to an axis You can use a formula to plot data that can be calculated using the data in one or more fields.
For example, if your table contained measurements of the height and width of a group of rectangular objects, you could use a formula to calculate and plot the area of each object using a formula. To assign a formula to an axis:
1. In Plot View, click the Axis Label of the axis you want to reassign.
2. Choose Formula... from the menu that appears.
The Formula Editor appears. The formula itself will appear in the top box of the dialog. Below are lists of the field headings in your table, operators and functions that you can double-click to build your formula.
3. Enter your formula into the top box of the Formula Editor.
4. When you are finished, click the OK button.
The Axis Label will change to display your formula.
Chapter 10: Making a Stack plot 91
Note: When your formula contains illegal syntax (such that InspireData cannot produce a result based on the formula you’ve entered), an error message will appear beneath the Formula box.
Note: Field headings that contain a space must be contained within single quotes (‘). For example: ‘Spherical Volume’ and ‘Flowers at 40’.
Note: Formulas follow the standard order of operations. Use parentheses to group operations that you want to happen first. For example, where 3 + 3 * 2 would equal 9, (3 + 3) * 2 would equal 12.
Note: To use a function, select the one you want to use from the Functions box, then replace the text between the parentheses (usually number, string, value or field) with one of the field headings in the Field box. Note that when a function asks you to specify a field, that field must be either a series, multi-series or subtable field.
For more information about formulas, see Using formulas on page 141.
Changing the axis type in a Stack plot In a Stack plot, you can assign any type of field to an axis. How InspireData divides the axis into categories depends on the data type of the field you assign. If you assign a text or true/false field to an axis, InspireData will create a subdivision for each unique value in the field you selected. This is called a category axis. If you assign a number, date, time or datetime field to an axis, InspireData will set the minimum and maximum values of the axis based on the values in the field you select, create groups of numbers in equal intervals, then stack the records that fall into each category. This is called a range axis. Range axes can be converted into category axes. To change the axis type in an Stack plot:
1. Click the Axis Type menu of the axis you want to change.
The Axis Type menu displays the currently selected axis type. For example, for a range axis, you would click the word Range.
2. Choose the axis type you want to change to.
Note: You cannot change the axis type for axes assigned to text or true/false fields.

92 InspireData™ User's Manual
Reordering categories in a Stack plot When an axis in a Stack plot is set to a text or true/false field, the category with the highest number of records is shown first, the category with the second highest next, and so on. You can rearrange the order of the categories at any time. To reorder categories in a Stack plot:
1. Click the label of the category you want to move.
2. Drag the label to the new location.
When you drag, the category remains in its original position until you release the mouse button. You can tell where the field will be inserted by watching the green diamond as you drag.
3. When the category is in the place you want it, release the mouse button.
Note: To reset the order of categories, click the Reset button next to the axis you want to reset.
Combining categories into a supercategory in a Stack plot Occasionally you may want to combine categories into supercategories to clarify your plot. For example, if your plot contained data on a group of dogs, you could list the various breeds along the axis. However, if what you really wanted to know was how many small, medium and large dogs you had category, then do the same for the medium and large breeds.
To combine categories in a Stack plot:
1. Click the label of one of the categories you want to combine.
2. Drag the label onto the label of a category you want to combine it with.
When you drag, the category remains in its original position until you release the mouse button. You can tell which category will be combined by watching for a grey box around the category’s label.
3. When the category is in the place you want it, release the mouse button.
4. Type a name for your new supercategory.
You can combine as many categories as needed.
Note: Combining categories does not change icon coloring or alter the data in Table View.

Chapter 10: Making a Stack plot 93
Removing a category from a supercategory in a Stack plot
1. Click the diamond next to the supercategory you want to remove a category from.
2. Choose the category you want to remove from the menu.
Renaming a supercategory
1. Click the diamond next to the combined category.
2. Choose Rename Supercategory from the menu.
Dissolving a supercategory
1. Click the diamond next to the supercategory you want to dissolve.
2. Choose Dissolve Supercategory from the menu.
Note: You can dissolve all of the supercategories on an axis at one time by clicking the Reset button next to the axis you want to reset.
Changing the maximum and minimum values of a range axis
You can change the maximum and minimum values displayed in a range axis. This is especially useful when the data in your table contains many records that share a particularly low value for a given field with just a few that have much higher values in the same field (or vice versa). All records that fall below the minimum or exceed the maximum values you define are placed in the far left or right subdivisions, respectively. For example, if your plot contained data on the countries of the world, and the X axis was assigned to the total populations of those countries, almost all of the countries would end up on the far left side of the plot with the most populous few on the right. Since the countries on the left are so closely bunched up and there isn’t anything in the middle, this may not be very useful. Changing the maximum value of the axis will allow you to see the differences between the lesser-populated countries in much more detail because there is room for smaller subdivisions. To change the minimum value of a range axis:
1. Click the smallest number in the range axis you want to change.
2. Type the new minimum value, then click the Accept button.
To change the maximum value of a range axis:
1. Click the Max: button next to the range axis you want to change.
2. Type the new maximum value, then click the Accept button.
Note: To reset the options for a range axis, click the Reset button next to the axis you want to reset.
94 InspireData™ User's Manual
Changing the range step of a range axis Ranges axes are divided into even intervals. The size of the interval is called a range step. InspireData automatically calculates a range step to use based on how much room is available in the window. Occasionally you may need to adjust the size of the range step to increase or decrease the number of subdivisions on your range axis. For example, if you were plotting the ages of a group of people across the X Axis, the range step might be 2 or 3 years. If you wanted to see how many people were in their 20s, 30s, 40s, etc., you could set the range step to 10 years. To change the range step of a range axis:
1. Click the Step: button next to the range axis you want to change.
2. Type the new range step, then click the Accept button.
Note: To reset the options for a range axis, click the Reset button next to the axis you want to reset.
Changing the orientation of a Stack plot In Stack plots, icons are stacked vertically on a horizontal axis by default. You can also have InspireData stack icons horizontally, left to right on a vertical axis. To create a parallel Stack plot:
• Click the Stack Plot Type button in the lower-left corner of the workspace and choose the vertical (first choice) or horizontal (fourth choice) Stack plot type.
Creating a parallel Stack plot Sometimes you might need to create stacks that reflect more than one attribute. Parallel Stack plots enable you to do this by adding a second axis to your plot. For example, if your plot included information on the hair and eye color of a group of people, you could use a parallel Stack plot to display the quantity of people for each combination of hair and eye color. To create a parallel Stack plot:
1. In Plot View, click the Stack Plot button on the Toolbar.
2. Click the Stack Plot Type button in the lower-left corner of the workspace and choose the vertical (second choice) or horizontal (fifth choice) parallel Stack plot type.
3. Click on the Axis Label for each axis and choose the field you want to assign.

Chapter 10: Making a Stack plot 95
Creating a mirror Stack plot A mirror Stack plot is a special kind of parallel stack plot. One of the axes in a mirror Stack plot (called the pivotal axis) will always display only two categories and stack the items in each category in mirror directions. For example, if your plot included information about a group of dogs, you could assign gender to the pivotal axis and the breed of dog to the other axis to see how many of each breed were male or female. The icons in the top category will be stacked upwards and the icons in the bottom category will be stacked downwards. To create a mirror Stack plot:
1. In Plot View, click the Stack Plot button on the Toolbar.
2. Click the Stack Plot Type button in the lower-left corner of the workspace and choose the vertical (third choice) or horizontal (sixth choice) mirror Stack plot type.
3. Click on the Axis Label for each axis and choose the field you want to assign.

96 InspireData™ User's Manual
Chapter 11: Making an Axis plot An Axis plot contains an X axis (horizontal) and a Y axis (vertical). Axis plots are the most versatile plot type in InspireData, enabling you to create a wide variety of graph types. Axis plots can place icons precisely along their axes, making them especially ideal for finding correlations in a numerical set of data.
For example, if your plot included data about the planets in the solar system, you could assign the planets’ distance from the sun to one axis and the orbital period (number of days in each planet’s year) on the other. Since each record is plotted precisely, the correlation between the two factors becomes very easy to see.
Creating an Axis plot Axis plots are useful for discovering correlations between two fields, especially if those fields contain numerical data, dates or times. To create an Axis plot:
1. In Plot View, click the Axis Plot button on the Toolbar.
2. Click on the Axis Label for each axis, then choose the field you want to assign.
You can change what field is assigned to an axis at any time. To do this, click the label of the axis you want to change, then choose the field you want to assign.

Chapter 11: Making an Axis plot 97
Reassigning a field to an axis When you assign a field to an axis, InspireData plots the values contained in that field. You can reassign an axis at any time. Axes are available in Stack, Axis and Pie plots.
To reassign a field to an axis:
1. In Plot View, click the Axis Label of the axis you want to reassign.
2. Select a field to assign from the menu that appears.
The Axis Label will change to display the name of the field you selected.
Assigning a formula to an axis You can use a formula to plot data that can be calculated using the data in one or more fields.
For example, if your table contained measurements of the height and width of a group of rectangular objects, you could use a formula to calculate and plot the area of each object using a formula.
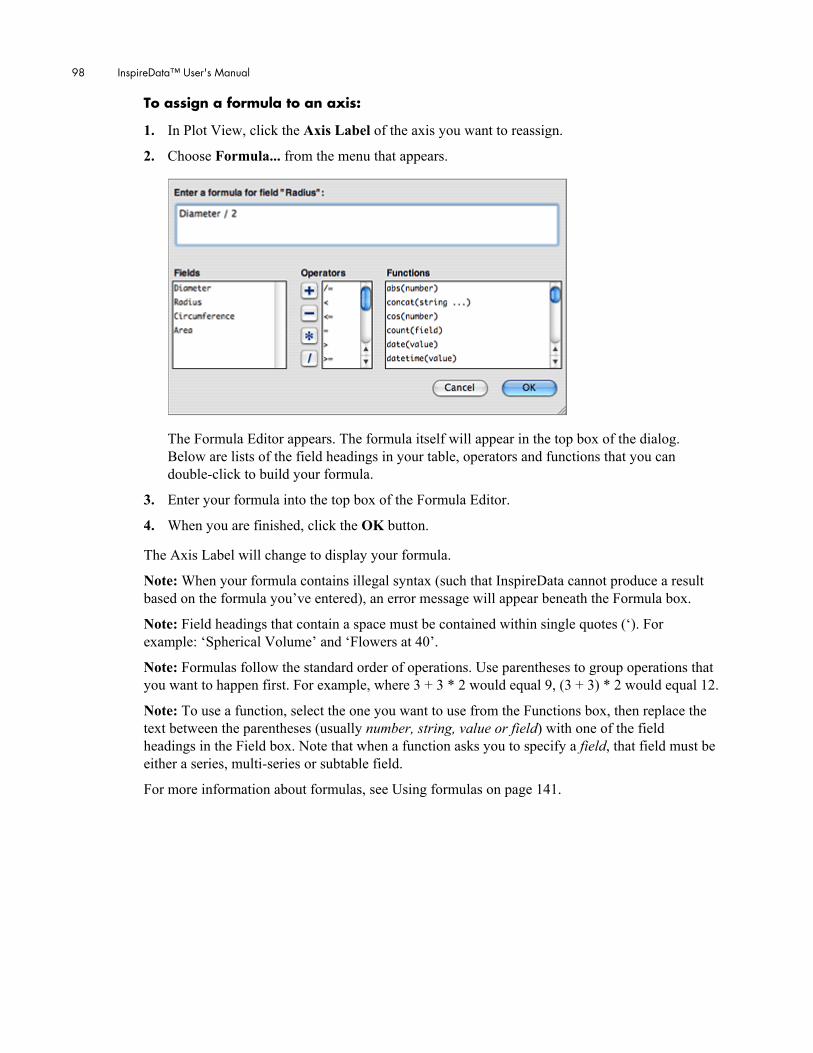
98 InspireData™ User's Manual
To assign a formula to an axis:
1. In Plot View, click the Axis Label of the axis you want to reassign.
2. Choose Formula... from the menu that appears.
The Formula Editor appears. The formula itself will appear in the top box of the dialog. Below are lists of the field headings in your table, operators and functions that you can double-click to build your formula.
3. Enter your formula into the top box of the Formula Editor.
4. When you are finished, click the OK button.
The Axis Label will change to display your formula.
Note: When your formula contains illegal syntax (such that InspireData cannot produce a result based on the formula you’ve entered), an error message will appear beneath the Formula box.
Note: Field headings that contain a space must be contained within single quotes (‘). For example: ‘Spherical Volume’ and ‘Flowers at 40’.
Note: Formulas follow the standard order of operations. Use parentheses to group operations that you want to happen first. For example, where 3 + 3 * 2 would equal 9, (3 + 3) * 2 would equal 12.
Note: To use a function, select the one you want to use from the Functions box, then replace the text between the parentheses (usually number, string, value or field) with one of the field headings in the Field box. Note that when a function asks you to specify a field, that field must be either a series, multi-series or subtable field.
For more information about formulas, see Using formulas on page 141.

Chapter 11: Making an Axis plot 99
Changing the axis type in an Axis plot In an Axis plot, you can assign any type of field to an axis. How InspireData displays the axis depends on the data type of the field you assign. If you assign a text or true/false field to an axis, InspireData will create a subdivision for each unique value in the field you select. This is called a category axis. If you assign a number, date, time or datetime field to an axis, InspireData will set the minimum and maximum values of the axis based on the values in the field you select, then plot each icon precisely along that axis. This is called a continuous axis. You can convert a continuous axis into a range axis. Range axes are similar to continuous axes; however, instead of placing each icon precisely, InspireData will create groups of numbers in equal intervals, then arrange the records that fall into each category arbitrarily. Range and continuous axes can also be converted into category axes. To change the type of an axis in an Axis plot:
1. Click the Axis Type menu of the axis you want to change.
The Axis Type menu displays the currently selected axis type. For example, for a continuous axis, you would click the word Continuous.
2. Choose the axis type you want to change to.
Note: You cannot change the axis type for axes assigned to text or true/false fields.
Note: Using category or range axes, you can create a grid; using continuous axes, you can create a scatter plot. You can also create a hybrid of the two by using multiple axis types.
Changing the maximum and minimum values of a range axis
You can change the maximum and minimum values displayed in a range axis. This is especially useful when the data in your table contains many records that share a particularly low value for a given field with just a few that have much higher values in the same field (or vice versa). All records that fall below the minimum or exceed the maximum values you define are placed in the far left or right subdivisions, respectively. For example, if your plot contained data on the countries of the world, and the X axis was assigned to the total populations of those countries, almost all of the countries would end up on the far left side of the plot with the most populous few on the right. Since the countries on the left are so closely bunched up and there isn’t anything in the middle, this may not be very useful. Changing the maximum value of the axis will allow you to see the differences between the lesser-populated countries in much more detail because there is room for smaller subdivisions. To change the minimum value of a range axis:
1. Click the smallest number in the range axis you want to change.
2. Type the new minimum value, then click the Accept button.

100 InspireData™ User's Manual
To change the maximum value of a range axis:
1. Click the Max: button next to the range axis you want to change.
2. Type the new maximum value, then click the Accept button.
Note: To reset the options for a range axis, click the Reset button next to the axis you want to reset.
Changing the range step of a range axis Ranges axes are divided into even intervals. The size of the interval is called a range step. InspireData automatically calculates a range step to use based on how much room is available in the window. Occasionally you may need to adjust the size of the range step to increase or decrease the number of subdivisions on your range axis. For example, if you were plotting the ages of a group of people across the X Axis, the range step might be 2 or 3 years. If you wanted to see how many people were in their 20s, 30s, 40s, etc., you could set the range step to 10 years. To change the range step of a range axis:
1. Click the Step: button next to the range axis you want to change.
2. Type the new range step, then click the Accept button.
Note: To reset the options for a range axis, click the Reset button next to the axis you want to reset.
Changing the maximum and minimum values of a continuous axis
You can change the minimum and maximum values displayed in a range axis. This is useful when the data in your table contains a group of records that contain very similar values for a given field while other records have a much higher or lower value in the same field. For example, if your plot included data on the planets in the Solar system and one of the axes was assigned to the distance of each planet from the Sun, the closest planets to the Sun (Mercury, Venus, Earth and Mars) would end up on the far left side of the plot. Since their icons are plotted so close together, it is difficult to see the differences in their values. Changing the maximum value of the axis will allow you to see the differences between the closer planets in much more detail because there is more room for them to be plotted in. To change the minimum value of a continuous axis:
1. Click the smallest number in the continuous axis you want to change.
2. Type the new minimum value, then click the Accept button.

Chapter 11: Making an Axis plot 101
To change the minimum value of a continuous axis:
1. Click the smallest number in the continuous axis you want to change.
2. Type the new minimum value, then click the Accept button.
Note: To reset the options for a continuous axis, click the Reset button next to the axis you want to reset.
For information about changing the maximum and minimum values of a range axis, see Changing the maximum and minimum values of a range axis on page 93.
Creating a box plot in an Axis plot The box in a box plot is a special visual component that can be added to an Axis plot. A box plot visually represents the median, the range and the quartiles of a set of numbers. A box plot consists of: a box that encloses the interquartile range (the range in which the middle half of the data points fall), a line through the box indicates the median, and lines (known as “whiskers”) that extend to the extreme values of the data in a field.
To create a box plot:
1. Open the Axis plot you want to add a box to.
2. On the Plot menu, choose Box Plot.
Note: Box plots can only be applied when one of the axes in your plot is continuous. For more information, see Changing the axis type in an Axis plot on page 99. If only one axis is continuous, a box will appear in each category or range. If both axes are continuous, one box that can be read in both directions will appear.

102 InspireData™ User's Manual
Applying the IQR method to a box plot In some cases, you might prefer to use an alternative method for drawing the whiskers of a box plot called IQR, or “Interquartile range”. Rather than extending to the extremes of the data, the whiskers have a length that is proportional to—usually one and one half times—the interquartile range. (Interquartile range is the difference between the upper and lower quartiles.) To apply the IQR method to a box plot:
1. On the Plot menu, choose Box Plot Options...
2. Choose the IQR radio button.
3. If desired, change the multiplier by typing in the text box next to the IQR radio button.
4. Click the OK button.

Chapter 12: Making a Pie plot 103
Chapter 12: Making a Pie plot
A Pie plot divides the values within a field into wedges, then sizes those wedges proportionally to the number of records in each wedge. The more records in a wedge, the larger the percentage of the pie the wedge occupies. For example, if your plot included the musical preferences of a group of people, InspireData would display a wedge for each music type in your data set, with the most common genre in your data set assigned to the largest wedge, second most common to the second largest, and so on. You can display several Pie plots at the same time, side-by-side. Unlike Stack and Axis plots, Pie plots do not treat numbers as ranges. Each numerical value is treated as its own unique wedge.

104 InspireData™ User's Manual
Creating a Pie plot Pie plots are useful for quickly representing how many records contain a certain characteristic. To create a Pie plot:
1. In Plot View, click the Pie Plot button on the Toolbar.
Since no field is assigned yet, all of the icons will be in the pie but there will be no wedges.
2. Click on the Select Field menu at the top of the workspace, then choose the field you want to assign.
After you assign a field to the pie, the records will move into their proper categories. You can change what field is assigned to the pie at any time by clicking on the currently selected field name.
Note: If there are too many unique values for each to have its own wedge, the values that appear least often will be combined into an Other wedge.
Displaying multiple pies in a Pie plot Sometimes you may need to divide the data in your pie into multiple categories. Displaying multiple pies allow you to do this by adding one or two axes to your plot. For example, if your plot included information on the hair and eye color of a group of people, you could assign eye color to the pies and hair color to the X axis to display the percentage of eye colors for each hair color. The number of pies that appear is determined by the size of your document window. To display multiple pies in a Pie plot:
1. In Plot View, click the Pie Plot button on the Toolbar.
2. Click the Pie Plot Options button in the lower-left corner of the workspace and choose horizontal (second choice), vertical (third choice) or grid (fourth choice).
3. Click on the Select Field menu for each axis and choose the field you want to assign to the pies.
4. Click on the Axis Label for each axis and choose the field you want to assign.

Chapter 13: Plotting series and multi-series fields 105
Chapter 13: Plotting series and multi-series fields
Because of their unique structure, series and multi-series fields can create special plots called series-based plots. These plots allow you to plot the data contained within one subfield of a series or multi-series field, then easily move to the other subfields.
For example, if your table had a series field that recorded the height of a group of plants using a series column for each day a measurement was taken, you could create a time graph that plots the growth of your plants over the course of your experiment.
InspireData can even automatically animate the icons so that you can see how your data changes from subfield to subfield. You can plot series or multi-series fields in Venn, Stack, Axis or Pie plots.
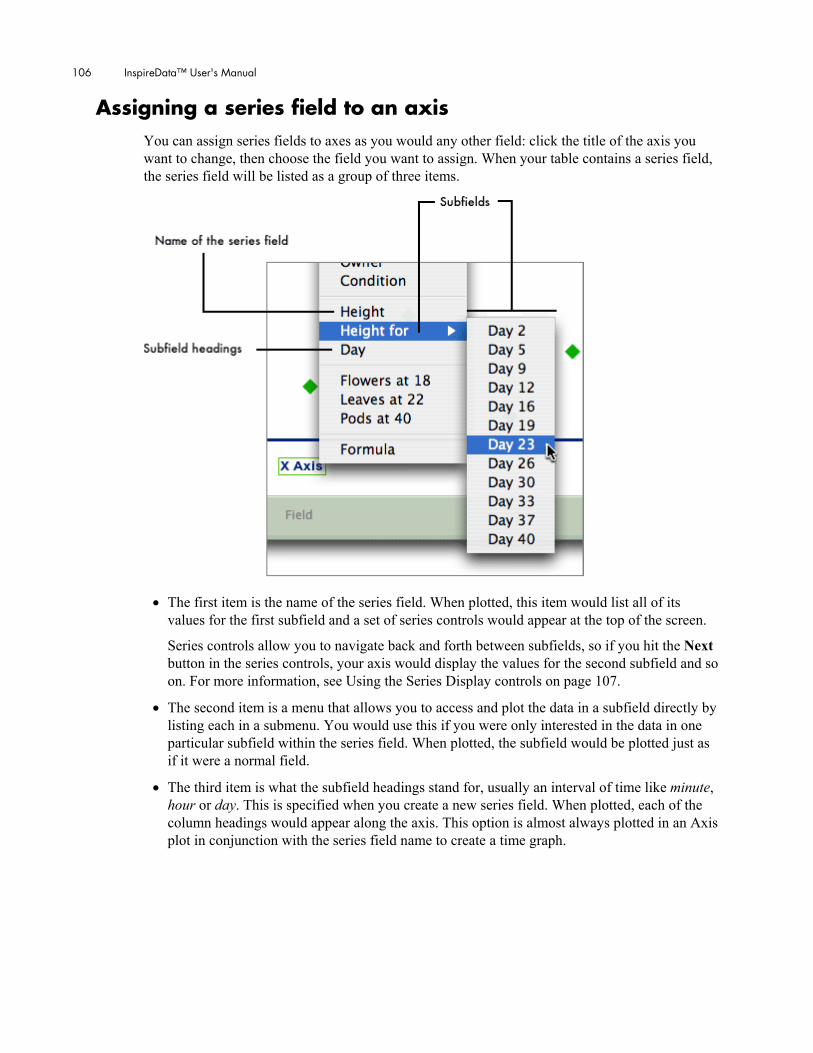
106 InspireData™ User's Manual
Assigning a series field to an axis You can assign series fields to axes as you would any other field: click the title of the axis you want to change, then choose the field you want to assign. When your table contains a series field, the series field will be listed as a group of three items.
• The first item is the name of the series field. When plotted, this item would list all of its values for the first subfield and a set of series controls would appear at the top of the screen.
Series controls allow you to navigate back and forth between subfields, so if you hit the Next button in the series controls, your axis would display the values for the second subfield and so on. For more information, see Using the Series Display controls on page 107.
• The second item is a menu that allows you to access and plot the data in a subfield directly by listing each in a submenu. You would use this if you were only interested in the data in one particular subfield within the series field. When plotted, the subfield would be plotted just as if it were a normal field.
• The third item is what the subfield headings stand for, usually an interval of time like minute, hour or day. This is specified when you create a new series field. When plotted, each of the column headings would appear along the axis. This option is almost always plotted in an Axis plot in conjunction with the series field name to create a time graph.

Chapter 13: Plotting series and multi-series fields 107
Using the Series Display controls The Series Display controls appear whenever a series field is assigned to an axis or region in your plot. These controls allow you to display the various subfields in your series field. Series playback controls are especially useful when used with time graphs, as they allow you to easily animate or scroll back and forth through the data so that you can see how your data changes over time.
Creating a time graph using Instant Plot A time graph—a special kind of Axis plot—is a powerful tool that enables you to explore data that changes over time. These time graphs can be animated to see how the values in a group of records changes, enabling you to see correlations that you might miss otherwise.
For example, if you wanted your table to record the height of a group of plants every three days, you would create a series field called height with a subfield for each day you took a measurement. You could then plot the measurement (height in this case) on the Y axis and the interval (day) on the X axis, creating a timeline that you can easily move back and forth through.

108 InspireData™ User's Manual
To create a time graph using Instant Plot:
1. Create or open a table that contains a series field.
2. Switch to Plot View.
3. Click the Axis Plot button on the Toolbar.
4. Click the Axis plot options button in the lower-left corner of the workspace.
5. Choose Instant Plot from the menu that appears.
Next to the words Instant Plot, InspireData will list the attributes it will plot against, such as Height by Day. If your table contains more than one series field or a multi-series field, you will see an Instant Plot option for each possible combination of variables.
When you choose Instant Plot, your time graph will begin to animate from the first interval to the last on the X axis while InspireData plots how your data changes from interval to interval on the Y axis. As this happens, InspireData will also draw lines to show the progression of your data over time.
A set of series playback controls will appear at the top of the screen, allowing you to easily move back and forth within your time graph. For more information, see Using the Series Display controls on page 107.
Note: You can create time graphs manually by assigning the name of the series field to the Y axis and the interval to the X axis. For more information, see Assigning a series field to an axis on page 106. You can also approximate a time graph using a parallel Stack plot. For more information, see Making a Stack plot on page 88.
Displaying individual lines in a time graph When you create a time graph using the Instant Plot feature, individual lines are turned on by default. Individual lines allow you to see the values of the subfields preceding the one you have currently displayed. To display individual lines in a time graph:
• On your time graph, click the Plot Options button in the lower-left corner of the workspace and choose Individual Lines.
To turn off individual lines, choose No Lines from the Plot Options menu.
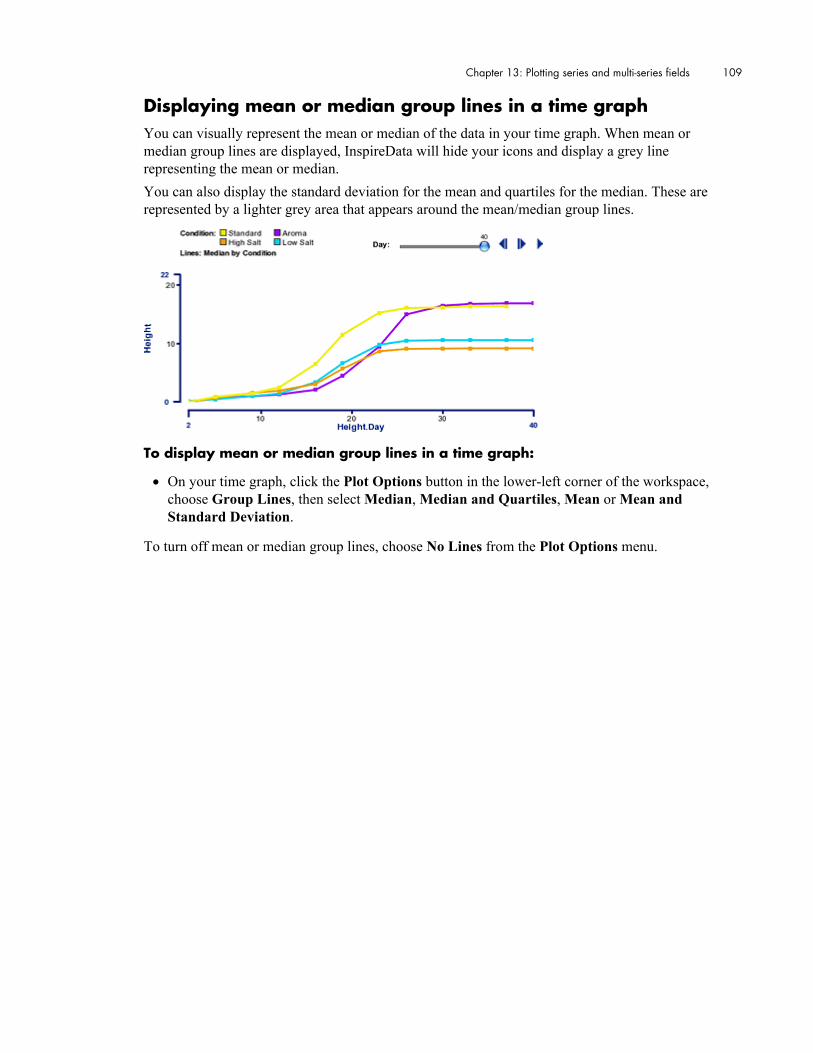
Chapter 13: Plotting series and multi-series fields 109
Displaying mean or median group lines in a time graph You can visually represent the mean or median of the data in your time graph. When mean or median group lines are displayed, InspireData will hide your icons and display a grey line representing the mean or median. You can also display the standard deviation for the mean and quartiles for the median. These are represented by a lighter grey area that appears around the mean/median group lines.
To display mean or median group lines in a time graph:
• On your time graph, click the Plot Options button in the lower-left corner of the workspace, choose Group Lines, then select Median, Median and Quartiles, Mean or Mean and Standard Deviation.
To turn off mean or median group lines, choose No Lines from the Plot Options menu.
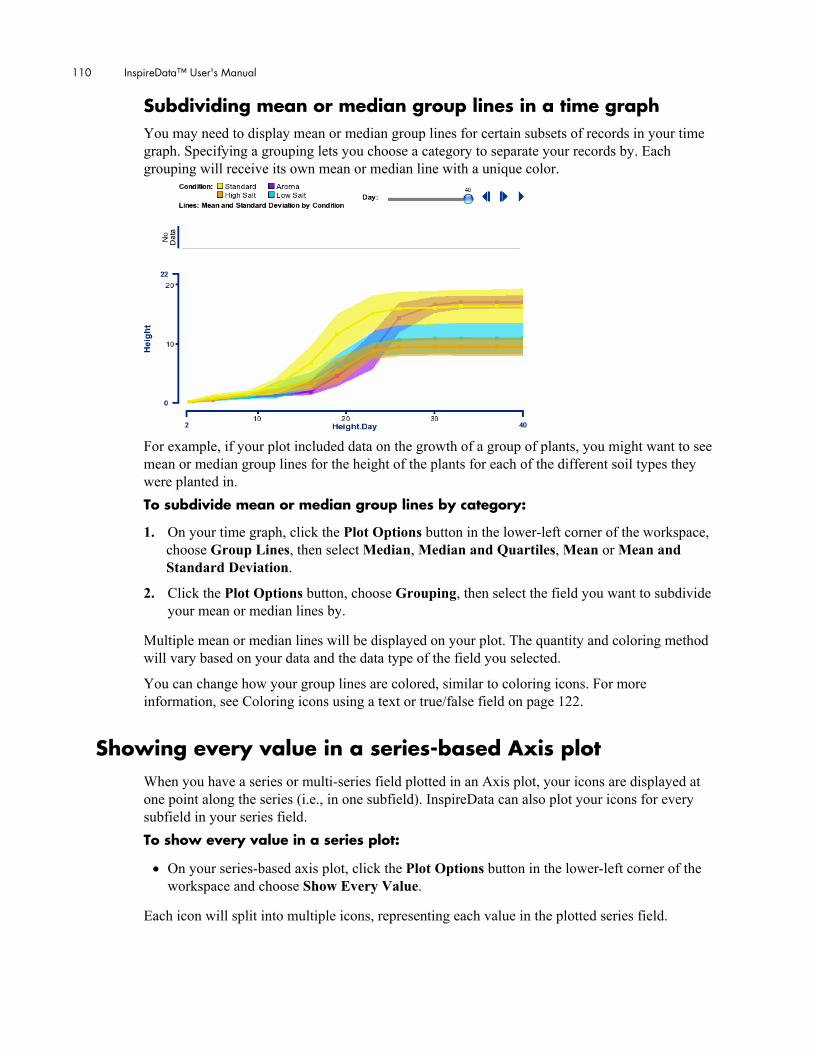
110 InspireData™ User's Manual
Subdividing mean or median group lines in a time graph You may need to display mean or median group lines for certain subsets of records in your time graph. Specifying a grouping lets you choose a category to separate your records by. Each grouping will receive its own mean or median line with a unique color.
For example, if your plot included data on the growth of a group of plants, you might want to see mean or median group lines for the height of the plants for each of the different soil types they were planted in. To subdivide mean or median group lines by category:
1. On your time graph, click the Plot Options button in the lower-left corner of the workspace, choose Group Lines, then select Median, Median and Quartiles, Mean or Mean and Standard Deviation.
2. Click the Plot Options button, choose Grouping, then select the field you want to subdivide your mean or median lines by.
Multiple mean or median lines will be displayed on your plot. The quantity and coloring method will vary based on your data and the data type of the field you selected.
You can change how your group lines are colored, similar to coloring icons. For more information, see Coloring icons using a text or true/false field on page 122.
Showing every value in a series-based Axis plot When you have a series or multi-series field plotted in an Axis plot, your icons are displayed at one point along the series (i.e., in one subfield). InspireData can also plot your icons for every subfield in your series field. To show every value in a series plot:
• On your series-based axis plot, click the Plot Options button in the lower-left corner of the workspace and choose Show Every Value.
Each icon will split into multiple icons, representing each value in the plotted series field.

Chapter 14: Working with plots 111
Chapter 14: Working with plots InspireData contains many useful tools to help you navigate and customize your plot.
Viewing previously created plots with the Back and Forward buttons
InspireData allows you to browse back and forth through plots you’ve created, just as you would with web pages in a web browser. The Back and Forward buttons are useful when you forget to save a particularly good plot to a slide, or when you make a change to your plot that produces less useful correlations or unexpected results. To view previously created plots with the Back and Forward buttons:
1. Click the Back button on the Toolbar until you reach the plot you want.
2. If you go too far back, click the Forward button on the Toolbar.
When you view a previously created slide and make major changes to your plots, the Forward history will be cleared so that InspireData can record the changes you’ve just made. Be sure to create slides of the plots you want to keep before making any changes to a previous plot.
The following types of changes are recorded: • Changing plot types • Changing the fields being plotted • Changing comparison values in Venn plots • Changing axis type • Changing axis options • Turning Compute on or off • Changing the Compute options • Changing icon size • Changing the time position in a series plot
The following types will not be recorded: • Changing markings (box, color, label) • Changing line graph features on series plots • Editing notes
Note: InspireData will clear a document’s back and forward history when you close the document. To permanently save your plots, create a slide. For more information, see Capturing a slide on page 128.
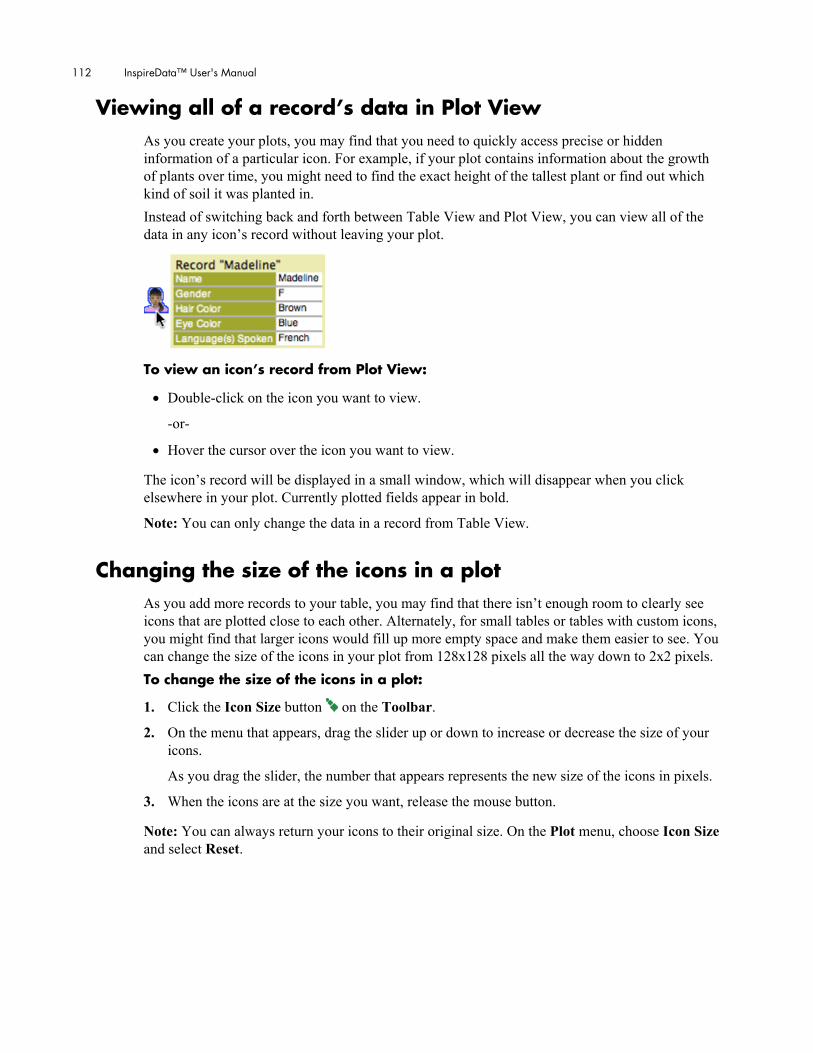
112 InspireData™ User's Manual
Viewing all of a record’s data in Plot View As you create your plots, you may find that you need to quickly access precise or hidden information of a particular icon. For example, if your plot contains information about the growth of plants over time, you might need to find the exact height of the tallest plant or find out which kind of soil it was planted in. Instead of switching back and forth between Table View and Plot View, you can view all of the data in any icon’s record without leaving your plot.
To view an icon’s record from Plot View:
• Double-click on the icon you want to view.
-or-
• Hover the cursor over the icon you want to view.
The icon’s record will be displayed in a small window, which will disappear when you click elsewhere in your plot. Currently plotted fields appear in bold.
Note: You can only change the data in a record from Table View.
Changing the size of the icons in a plot As you add more records to your table, you may find that there isn’t enough room to clearly see icons that are plotted close to each other. Alternately, for small tables or tables with custom icons, you might find that larger icons would fill up more empty space and make them easier to see. You can change the size of the icons in your plot from 128x128 pixels all the way down to 2x2 pixels. To change the size of the icons in a plot:
1. Click the Icon Size button on the Toolbar.
2. On the menu that appears, drag the slider up or down to increase or decrease the size of your icons.
As you drag the slider, the number that appears represents the new size of the icons in pixels.
3. When the icons are at the size you want, release the mouse button.
Note: You can always return your icons to their original size. On the Plot menu, choose Icon Size and select Reset.

Chapter 14: Working with plots 113
Selecting items in Plot View
Selecting icons in Plot View Selecting icons or regions in Plot View enables you to use some of InspireData’s advanced features such as marking, zooming in, labeling individual icons and more. To select an icon in Plot View:
1. Click the icon you want to select.
When icons are selected, a blue border appears around them.
2. To select additional icons, hold the Shift key and click the other icons you want to select.
To deselect a single icon, hold the Shift key and click the icon you want to deselect. To deselect all icons, click on the workspace.
Note: The icons you select will remain selected, even if you switch plot types or reassign axes. If you switch to Table View, the records of the icons you selected will remain selected.
Selecting regions of a plot Venn, Stack, Pie and some Axis plots arrange icons into regions. When a region is selected, its background turns light purple. To select a region:
1. Click the region you want to select.
-or-
If you want to select multiple regions that are next to each other, click and drag to select the regions.
2. To select additional regions, hold the Shift key, then click the other regions you want to select.
To deselect a single region, hold the Shift key and click the region you want to deselect. To deselect all regions, click on the workspace.
Note: If you have an icon selected, holding the Shift key and clicking on a region will select the icons in the region you clicked on.
Selecting an area of a continuous axis You can select any portion of a continuous axis in an Axis plot. To select an area of a continuous axis:
1. Click and drag around the area you want to select.
2. To select additional areas, hold the Shift key, then drag around the other regions you want to select.

114 InspireData™ User's Manual
Selecting a category or range in Plot View You can select an entire category or range (or, for a continuous axis, the entire area perpendicular to the axis) by clicking in the narrow margin between the plot and the axes.
To select a category or range:
• Click the narrow margin between the plot and the axis next to the category or range you want to select.
Note: To select a perpendicular area of a continuous axis, click and drag until the area you want to select is selected. To select multiple categories or ranges, click and drag until the items you want to select are selected.
Hiding specific icons in Plot View You can focus in on a subset of icons on a plot, hiding the others. This is useful when you want to look at a specific set of records without the distraction of irrelevant data. For example, if your plot included data on a group of dogs, and you wanted to look at the records for just one particular breed, you could show only the records of that breed and hide all rest. You could then continue to change plot types, assign axes, etc. until you restore the hidden icons. For more information, see Zooming out or restoring hidden icons on page 116.

Chapter 14: Working with plots 115
Zooming in on selected icons in a plot You can zoom in on a subset of selected icons or selected regions in a plot. Any icons that aren’t selected or lie in an unselected region will be hidden. To zoom in on a subset of data in a plot:
1. In Plot View, select the set of icons or the region you want to zoom in on.
2. On the Plot menu, choose Zoom In.
-or-
Right-click (Windows) or Control-click (Macintosh) anywhere on the workspace and choose Zoom In.
Your plot will now display only those records you selected and hide the others.
For more information on selecting, see Selecting items in Plot View on page 113.
Note: To zoom out, choose View All on the Plot menu.
Hiding or excluding selected icons in a plot Similar to zooming in, you can exclude a subset of selected icons or selected regions in a plot. Any icons that aren’t selected or lie in an unselected region will remain showing. To hide or exclude selected icons in a plot:
1. In Plot View, select the set of icons or the region you want to hide or exclude.
2. On the Plot menu, choose Exclude Selected Icons.
-or-
Right-click (Windows) or Control-click (Macintosh) anywhere on the workspace and choose Exclude Selected Icons.
The icons you selected will be hidden.
For more information on selecting, see Selecting items in Plot View on page 113.
Note: To zoom out, choose View All on the Plot menu.
Hiding icons using a formula You can exclude a subset of your icons using formulas. The result is similar to zooming in. To hide icons using a formula:
1. On the Plot menu, choose View Constraint...
2. Enter your formula, then click the OK button.
The icons that fall outside the parameters of your formula become hidden. For more information, see Using formulas on page 141.
Note: To restore hidden icons, choose View All on the Plot menu.
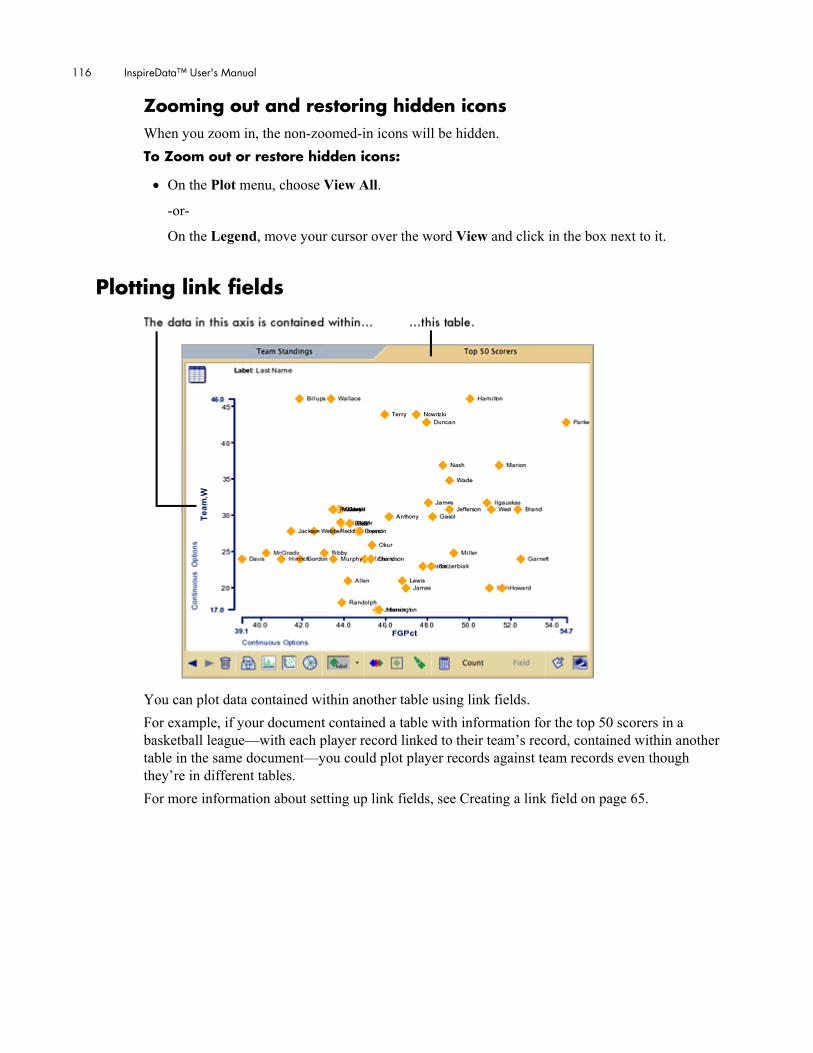
116 InspireData™ User's Manual
Zooming out and restoring hidden icons When you zoom in, the non-zoomed-in icons will be hidden. To Zoom out or restore hidden icons:
• On the Plot menu, choose View All.
-or-
On the Legend, move your cursor over the word View and click in the box next to it.
Plotting link fields
You can plot data contained within another table using link fields. For example, if your document contained a table with information for the top 50 scorers in a basketball league—with each player record linked to their team’s record, contained within another table in the same document—you could plot player records against team records even though they’re in different tables. For more information about setting up link fields, see Creating a link field on page 65.

Chapter 14: Working with plots 117
Clearing a plot Sometimes you may want to start a plot over from scratch. For example, if your current plot contains Venn loops, formulas, color and labels, and you want to make a very simple plot, instead of turning off each feature individually, you can use the Clear tool to clear all settings. To clear a plot:
• On the Toolbar, click the Clear button .
Note: If you accidentally clear your plot, click the Back button on the Toolbar.
About No Data areas When a record contains no data for a field that has been plotted, that record’s icon will move into a special No Data area. In Venn, Pie and single-axis Stack plots, the No Data area is located to the right of the plot. In an Axis, mirror Stack or parallel Stack plot, there are two No Data areas because these plots have two axes. A record could have data for one of the axes, but not for the other. When this happens, the icon will move into the No Data area of the axis it lacks data for, but will still be plotted along the axis it does have data for.
For example, if your plot included data about the age and weight of a group of people, you could assign age to the X axis and weight to the Y axis. If a particular record lists a person’s age, but not their weight, the icon would be located in the Y axis’ No Data area, but still be correctly plotted against the X axis. The No Data area for the Y axis is located above the plot; the No Data area for the X Axis is to the right of the plot.
118 InspireData™ User's Manual
Chapter 15: Coloring, marking and annotating plots
InspireData provides a variety of useful tools that will help you enhance, present, explore and increase your understanding of the plots you’ve created.
Creating a plot title You can create a title for each plot you create. Plot titles are especially useful when you are creating slide shows. To create a plot title:
1. On the Plot menu, choose Plot Title...
2. Type the title of your plot, then click the Accept button to save your changes.
The title appears at the top of the screen.
Creating notes in Plot View You can annotate your plot by using notes. A note can be used to leave yourself a reminder or as captions for others to read when you print or create a slide show. To create a note in Plot View:
1. Click the Note button in the Toolbar.
The notes area appears at the bottom of your screen.
2. Type your note, then click anywhere on the workspace.
Each of the five plot types (Venn, Stack, Axis, Pie and Free) will maintain their own separate notes. For example, if you create a note for your Axis plot, then switch to the Venn plot type, your notes area will be blank, allowing you to type a new note for that plot.
To hide your note, click on the Note button in the Toolbar again. The Notes area will be hidden, but the text of your note will be preserved.
Note: Notes are saved along with your document. However, if you view a slide, your note will be overwritten with the note for the slide. To permanently save your note, you should save it to a slide. For more information, see Capturing a slide on page 128 and Making changes to a captured slide on page 129. If you accidentally overwrite a slide, use the Back button to retrieve it. For more information, see Viewing previously created plots with the Back and Forward buttons on page 111.

Chapter 15: Coloring, marking and annotating plots 119
Labeling and marking icons InspireData provides several tools to add visual information to your plots such as labeling, coloring by field and marking individual icons. These can help you identify individual records and represent data that would otherwise be hidden.
Labeling icons in Plot View Labels appear as text next to each icon in your plot and can be assigned to display the value of any field in your table. To label the icons in Plot View:
• Click the Label button on the Toolbar to turn labels on.
InspireData displays the first field in your table by default when labels are first turned on. To assign a different field to the icons, click the Label Options button and choose the field you want to display.
Note: To turn labeling off, click the Label button in the Toolbar again.

120 InspireData™ User's Manual
Labeling selected icons in Plot View You can label a single icon or a specific subset of icons by selecting them. For more information about selecting, see Selecting items in Plot View on page 113. To label selected icons in Plot View:
1. Select the icons you want to label.
2. On the Plot menu, choose Label Selected Icons.
Individual icons can also be unlabeled in a similar fashion. To unlabel an icon, select it, then choose Unlabel Selected Icons from the Plot menu.
Note: Even though individual icons can be labeled, all labels must still display the same field. To assign a field to the icons, click the Label Options button and choose the field you want to display.
Marking icons You can mark an individual icon or set of icons, which is useful when you want to keep track of a particular record or group of records as you change your plots.
To mark an icon:
1. Select the icon or icons you want to mark by clicking on it.
2. Click the Mark button on the Toolbar.
A red square will appear around marked icons. Marked icons will remain marked even if you switch plot types of reassign axes.
To turn marking off, select the icon, then click the Mark button again.
Changing the color of the box around a marked icon You can use a unique color to mark a selected icon or change the color of the box of an icon that has already been marked. To change the color of the box around a marked icon:
1. Select the icon or icons you want to change.
2. Click and hold the Mark button on the Toolbar and choose the color you want to use.
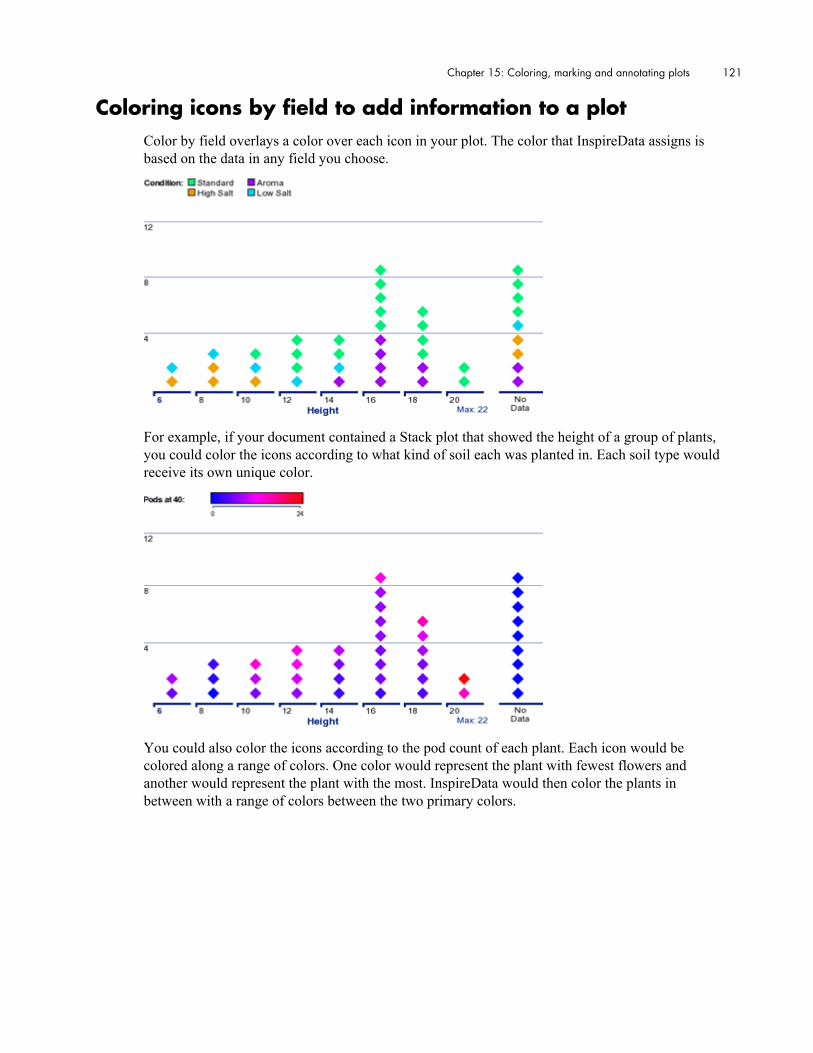
Chapter 15: Coloring, marking and annotating plots 121
Coloring icons by field to add information to a plot Color by field overlays a color over each icon in your plot. The color that InspireData assigns is based on the data in any field you choose.
For example, if your document contained a Stack plot that showed the height of a group of plants, you could color the icons according to what kind of soil each was planted in. Each soil type would receive its own unique color.
You could also color the icons according to the pod count of each plant. Each icon would be colored along a range of colors. One color would represent the plant with fewest flowers and another would represent the plant with the most. InspireData would then color the plants in between with a range of colors between the two primary colors.
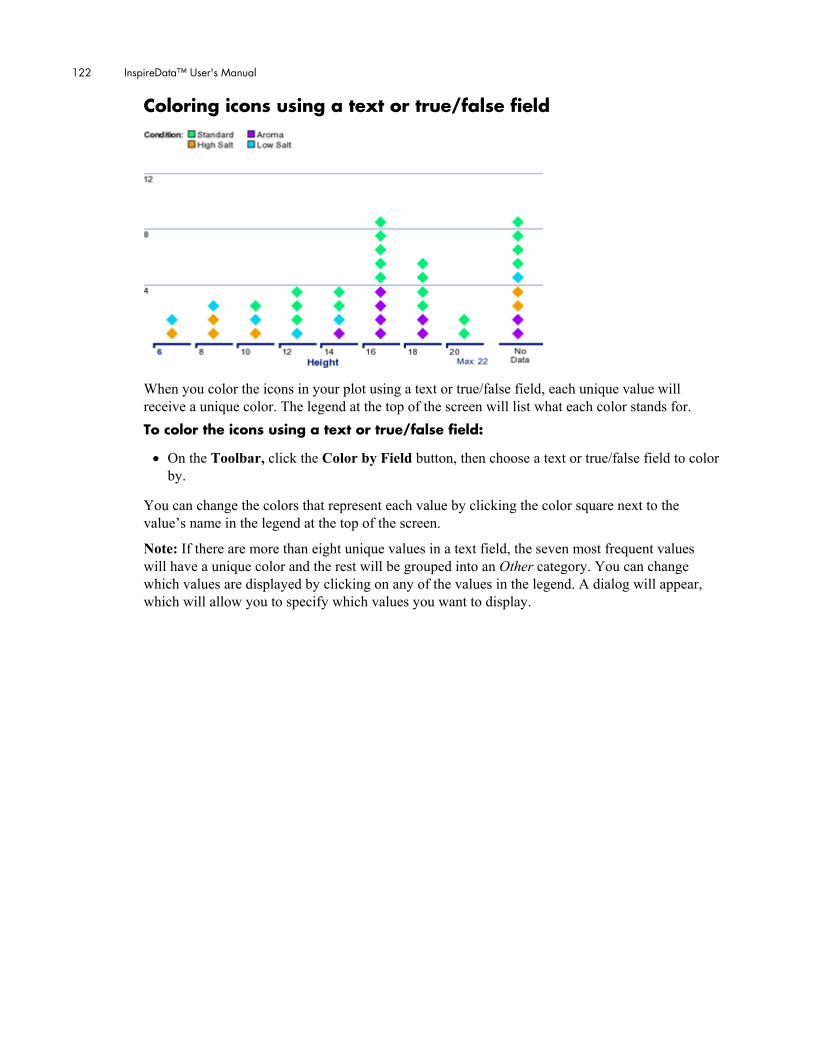
122 InspireData™ User's Manual
Coloring icons using a text or true/false field
When you color the icons in your plot using a text or true/false field, each unique value will receive a unique color. The legend at the top of the screen will list what each color stands for. To color the icons using a text or true/false field:
• On the Toolbar, click the Color by Field button, then choose a text or true/false field to color by.
You can change the colors that represent each value by clicking the color square next to the value’s name in the legend at the top of the screen.
Note: If there are more than eight unique values in a text field, the seven most frequent values will have a unique color and the rest will be grouped into an Other category. You can change which values are displayed by clicking on any of the values in the legend. A dialog will appear, which will allow you to specify which values you want to display.

Chapter 15: Coloring, marking and annotating plots 123
Coloring icons using a number, date, time or datetime field
If you select a number, date, time or datetime field, each icon will will be colored along a range of colors based on its value. The Legend at the top of the screen will display the range of colors and list the high and low values of the primary colors on the range. The record with the lowest value for the field you select will be colored with the leftmost color on the range, and the highest will be colored with the rightmost. The records in between will be assigned a color along the range based on their values. To color the icons using a text or number, date or time field:
• On the Toolbar, click the Color by Field button, then choose a number, date, time or datetime field to color by.
You can change the hue of the range of colors that represent your values by clicking on the color range in the Legend at the top of the screen. You can also swap the high and low colors by selecting Flip from the same menu.
You can set the minimum and maximum values of the colors by clicking the low and high numbers in the Legend underneath the range.
Note: You can also color using a formula. The results of the formula must produce a numerical result. For more information on using formulas, see Using formulas on page 141.

124 InspireData™ User's Manual
Changing the coloring scheme of a plot You can customize the colors used to represent your data, which can be useful when you need to clearly differentiate one set of records or lines from another or when you want to use a range of colors that better suits the data you are representing. To change the coloring scheme for icons colored using a text or true/false field:
1. On the Legend, locate the value whose color you want to change, then click the colored square next to it.
2. Select a new color from the menu that appears.
To change the coloring scheme for icons colored using a text or number, date, time or datetime field:
1. On the Legend, click the range of colors.
2. Select a new range of colors from the menu that appears.
Note: You can also swap the high and low colors of a range by clicking on the range of colors in the Legend and selecting Flip.
Changing the coloring method of a plot When your plot is colored using a number, date, time or datetime field, you can change the way InspireData treats those values by changing the coloring scheme. To change the coloring scheme of a plot:
1. Click the Color by Field button on the Toolbar and choose a number, date, time or datetime field to color by.
2. Click the name of the field you selected in the Legend at the top of the screen.
3. Choose Scheme, then select Category, Range or Continuous.
The category scheme will assign a color to the 7 most populous values and combine the rest in an Other category. You can manually set the values displayed by clicking on any of squares next to the values in the legend.
The range scheme will divide the numbers in your field into equally spaced intervals, then assign a color for each. You can manually set the values displayed by clicking on any of the values in the legend.
The continuous scheme will use a range of colors; the record with the lowest value will be colored with the leftmost color on the range, and the highest will be colored with the rightmost. The records in between will be assigned a color along the range based on their values.
Chapter 15: Coloring, marking and annotating plots 125
Coloring by formula You can color the icons based on the results of a formula. If the formula result is a true/false statement, the coloring will be categorical. If the formula results in numerical values, the coloring will be continuous. To color the icons using a formula:
1. Click the Color by Field button on the Toolbar and choose Formula.
2. Complete the formula, then click the OK button.
For more information, see Using Formulas on page 141.
Turning coloring off
• On the Toolbar, click the Color by Field button and choose No Coloring.
-or-
In the Legend, move your cursor over the field you are coloring by, then click the box to the left of the name.
Displaying mean and median data on a plot You can represent mean and median values visually in your Stack and Axis plots. On a continuous axis, the mean and median are shown as perpendicular lines that are plotted along the axis according to their value. On a range axis, the range in which the mean or median falls will be highlighted. The numerical value of the mean or median will be displayed near the line or highlight for both type of axes. To display mean and median data on a plot:
1. Click the Options button next to the axis you want to display mean or median data for.
2. Choose Show Mean or Show Median from the menu that appears.
Both the mean and the median can be displayed at the same time.
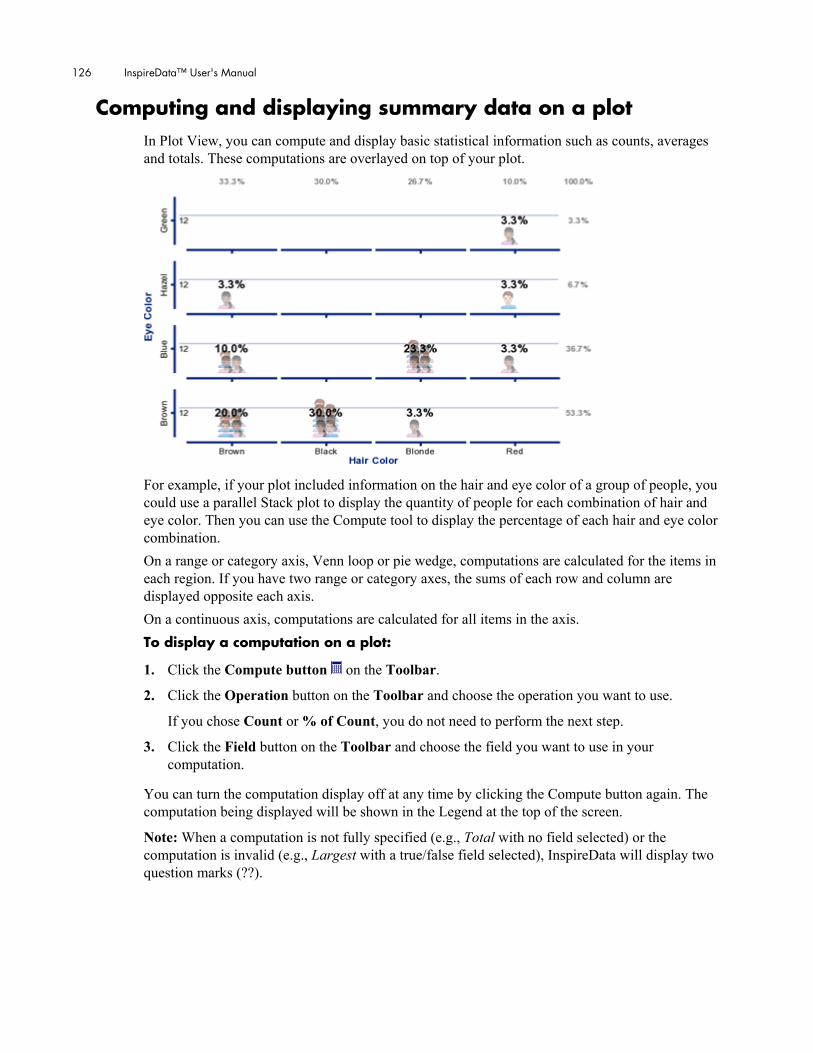
126 InspireData™ User's Manual
Computing and displaying summary data on a plot In Plot View, you can compute and display basic statistical information such as counts, averages and totals. These computations are overlayed on top of your plot.
For example, if your plot included information on the hair and eye color of a group of people, you could use a parallel Stack plot to display the quantity of people for each combination of hair and eye color. Then you can use the Compute tool to display the percentage of each hair and eye color combination. On a range or category axis, Venn loop or pie wedge, computations are calculated for the items in each region. If you have two range or category axes, the sums of each row and column are displayed opposite each axis. On a continuous axis, computations are calculated for all items in the axis. To display a computation on a plot:
1. Click the Compute button on the Toolbar.
2. Click the Operation button on the Toolbar and choose the operation you want to use.
If you chose Count or % of Count, you do not need to perform the next step.
3. Click the Field button on the Toolbar and choose the field you want to use in your computation.
You can turn the computation display off at any time by clicking the Compute button again. The computation being displayed will be shown in the Legend at the top of the screen.
Note: When a computation is not fully specified (e.g., Total with no field selected) or the computation is invalid (e.g., Largest with a true/false field selected), InspireData will display two question marks (??).
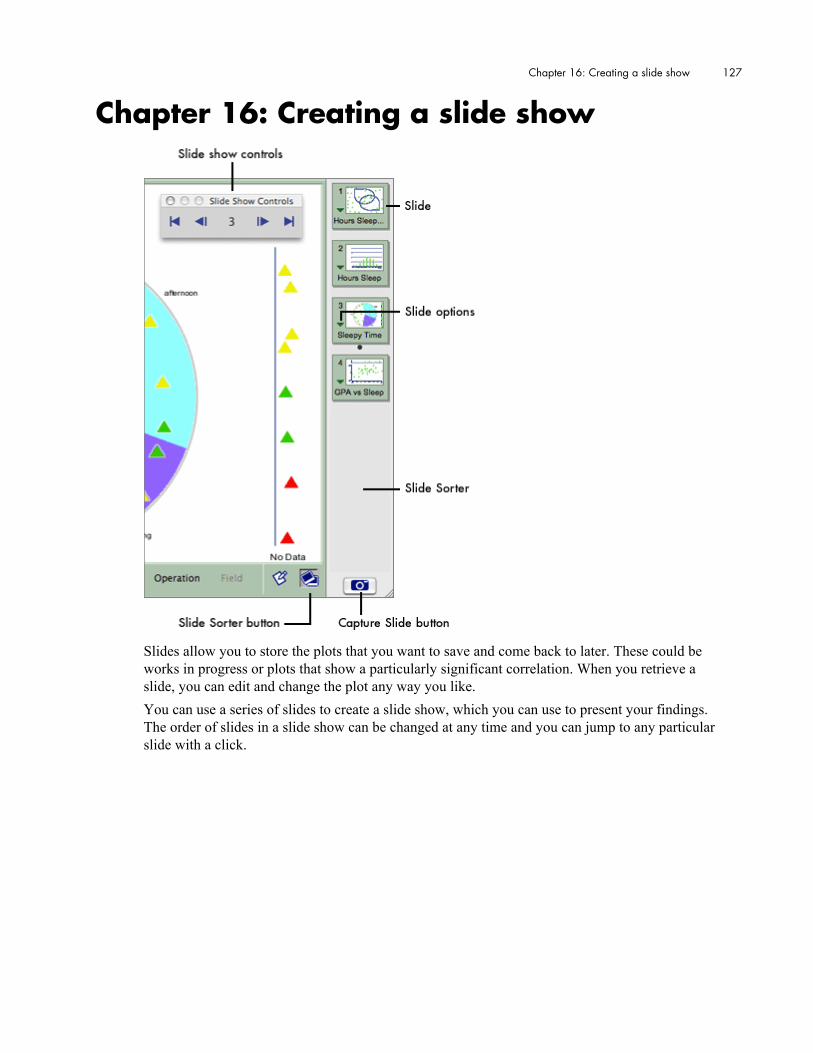
Chapter 16: Creating a slide show 127
Chapter 16: Creating a slide show
Slides allow you to store the plots that you want to save and come back to later. These could be works in progress or plots that show a particularly significant correlation. When you retrieve a slide, you can edit and change the plot any way you like. You can use a series of slides to create a slide show, which you can use to present your findings. The order of slides in a slide show can be changed at any time and you can jump to any particular slide with a click.

128 InspireData™ User's Manual
Opening the Slide Sorter The Slide Sorter displays miniature pictures of your plots called slides. Using the Slide Sorter, you can capture, title, retrieve and reorder your slides. To open the Slide Sorter:
• Click the Slide Sorter button in the Toolbar.
-or-
On the Slide Show menu, choose Open Slide Sorter.
Capturing a slide Capturing a slide allows you to save any plot and retrieve it at any time. Slides record the following information about your plot: plot type, axis assignments, notes, view constraints, labeling/coloring and the plot title. To capture a slide:
• Click the Capture Slide button on the Slide Sorter.
-or-
On Slide Show menu, choose Capture Slide.
Newly created slides appear at the bottom of the Slide Sorter.
Note: If you change or remove the data in Table View, the slide will use the updated data.
Note: If you are using category or range axes, the icons will still be plotted in their proper regions, though the exact placement of the icons within those regions may change slightly from when you capture the slide.
Viewing a captured slide You can view a captured slide at any time. Viewing a slide will override your current plot settings. To view a captured slide:
• In the Slide Sorter, click on the slide you want to view.
When you view a slide, you can continue to make changes to your plot. To restore a slide after making changes, either click on the slide again or choose Restore from the Slide Show menu.
Chapter 16: Creating a slide show 129
Renaming a slide InspireData automatically creates a name for new slides based on the fields assigned to axes on the plot, but you can rename at any time. To rename a slide:
1. In the Slide Sorter, click on the Slide Options button of the slide you want to rename.
2. Choose Rename Slide from the menu that appears.
3. Type the new name into the text box that appears, then click OK.
Renaming a slide does not change the title of the plot or the content or order of the slide in the Slide Sorter.
Reordering the slides in a slide show You can change the order of the slides in your slide show at any time. To reorder the slides in a slide show:
1. If the Slide Sorter isn’t already open, click the Slide Sorter button in the Toolbar to open it.
2. Click and drag the slide you want to move.
You can move the slide up and down the Slide Sorter. As you do, the other slides will make room for the slide you are dragging, indicating where the moved slide will be placed.
3. When the slide is in the place you want it, release the mouse button.
Making changes to a captured slide You can update a captured slide at any time after the slide has been captured. If you’ve added or edited a note since capturing your slide, you will probably want to update your slide; otherwise the changes will be lost. To make changes to a captured slide:
1. In the Slide Sorter, click on the slide you want to make changes to.
2. Make the changes to your plot.
3. Click the Slide Options button on the slide you want to update and choose Update.
-or-
On the Slide Show menu, choose Update.
Updating a captured slide will overwrite the slide’s previous settings. If you want to keep both your old slide and the changes you’ve made, create a new slide by clicking the Capture Slide button in the Slide Sorter.

130 InspireData™ User's Manual
Deleting a slide You can delete a slide at any time. To delete a slide:
1. If the Slide Sorter isn’t already open, click the Slide Sorter button in the Toolbar to open it.
2. Click the Slide Options button on the slide you want to delete and choose Delete.
-or-
On the Slide Show menu, choose Delete.
If you accidentally delete a slide, choose Undo from the Edit menu.
Note: To delete all of the slides in your document, choose Delete All Slides from the Slide Show menu.
Presenting a slide show When you have finished creating and modifying your slides, you can present them in order using a slide show. To present a slide show:
1. On the Slide Show menu, choose Start Slide Show.
When you start a slide show, InspireData goes to the first slide in the Slide Sorter and displays the Slide Show Controls.
2. Use the Slide Show Controls to navigate through the slides in your slide show.
Note: You can display the Slide Show controls at any time by choosing Show Slide Show Controls on the Slide Show menu. This enables you to start your slide show from any slide you wish.
Note: You can use the keyboard to navigate through your slides. For more information, see Using keyboard shortcuts on page 138.

Chapter 17: Managing, importing, exporting and printing documents 131
Chapter 17: Managing, importing, exporting and printing documents
Opening, closing and saving documents
Creating a new document
1. On the File menu, choose New...
The InspireData Starter screen will appear.
2. On the Starter, click the New button.
New documents always start in Table View.
Opening an existing document
1. On the File menu, choose Open...
2. Select the document you want to open, then click the Open button.
-or-
From the InspireData Starter screen, click the Open button.
132 InspireData™ User's Manual
Opening a database or example InspireData comes with over 60 databases and examples to help you get started. A database contains one or more tables filled with raw data about a certain subject, which you can explore in Plot View or add your own data to. An example is a database that also contains notes and slides of several plots to help you begin investigating the data more thoroughly. To open a database or example:
• On the InspireData Starter, click the Resources button. Double-click on a subject area and select the example or database you want to open.
-or-
On the File menu, choose Open Resource, point to a subject area and select the example or database you want to open.
Examples are noted with an Ex at the end of the filename. For example, the Dinosaurs database would be named Dinosaurs.idf, whereas the Dinosaurs example would be named Dinosaurs Ex.idf
Saving a document
1. On the File menu, choose Save.
2. Select the folder in which to save the document.
3. Enter a name for the document, then click Save.
Note: If you want to save an existing document to another location, choose Save As... from the File menu.
Closing a document
1. On the File menu, choose Close.
If you’ve made changes, InspireData will ask you if you want to save the changes.
2. Click the Yes or No button to save (or not save) your changes.
Saving a document with a different name
1. On the File menu, choose Save As.
2. Select the folder in which to save the document.
3. Enter a name for the document, then click Save.
Chapter 17: Managing, importing, exporting and printing documents 133
Importing data from other documents InspireData provides a variety of tools for importing data from other InspireData documents or documents created in other applications.
Importing a file created by another application You can import data from files created by another application such as Microsoft Excel. The documents to be imported must be saved in comma-separated or tab-separated format. To import a file created by another application:
1. On the File menu, choose Import...
2. Select the file you want to import, then click the Open button.
3. Click the Comma-separated text file or Tab-separated text file radio button, depending on the format of your imported document.
4. If you want the first row of data in your imported document to converted into the names of your field names, check the field names checkbox.
5. Choose whether you want to import the document as a new document, as a new table in the currently open document or append it to the currently open document by clicking the radio button next to each option.
6. When you are done choosing options, click the Finish button.
If the document does not import the way you expected it to, please ensure that you saved it as a comma- or tab-separated file from the other application.
Appending data from another InspireData document to a table You can add data from other InspireData documents to the end of your table. To append data from another InspireData document to a table:
1. Open the table you want to append data to.
2. On the Table menu, choose Append Data...
3. On the drop-down menu labeled Select a database, select a currently open document to append.
-or-
On the drop-down menu labeled Select a database, choose From file..., select the document you want to append, then click the Open button.
4. On the drop-down menu labeled Select a table, choose which table you want to append, then click the Next button.
5. Click the Finish button.
When you append a document, InspireData analyzes the field names of the table you are importing. If the name and data type of a field in the imported matches that of the document you are appending to, the imported data will be added to that field. Otherwise, non-matching fields will be appended to the right side of your table.

134 InspireData™ User's Manual
Copying and pasting data from another InspireData document or other applications Copying and pasting is the best way to import data from another InspireData document. You can also copy and paste data from other applications.
Creating new fields using copied data You can copy data from another InspireData table, document or a document created in another application such as Microsoft® Excel®, then paste it into your table. To create new fields using copied data:
1. Copy the data you want from the other table or application.
2. Select the InspireData document you want to paste into.
3. On the Edit menu, choose Paste Special, then select Add Fields to Table.
Pasted fields are added to the right side of your table. To paste a field into a specific place, select the field to the left of where you want the pasted field to be inserted before pasting.
Creating new records using copied data You can copy data from another InspireData table, document or a document created in another application such as Microsoft Excel, then paste it into your table. To create new records using copied data:
1. Copy the data you want from the other document application.
2. Select the InspireData document you want to paste into.
3. On the Edit menu, choose Paste Special, then select Append to Table.
Pasted records are usually added at the bottom of your table. However, if your table is sorted, the pasted records will appear in sorted order.
Reinterpreting the way copied data is pasted When copying data from another application, you may encounter unexpected results when you paste them into InspireData. If this happens, InspireData may be able to reinterpret the copied data to better fit with what you intended. To re-interpret the way copied data is pasted:
1. On the Edit menu, choose Clipboard and select Re-interpret...
2. Click the radio buttons to change how your copied data is interpreted.
As you change your options, the preview box at the bottom of the dialog will change to show you how the data will appear when pasted.
3. When you are finished making changes, click the OK button.
If the data is still not appearing the way you expected, try saving the document in the other application as a comma- or tab-separated text file, then importing it into InspireData. For more information, see Importing a file created by another application on page 133.
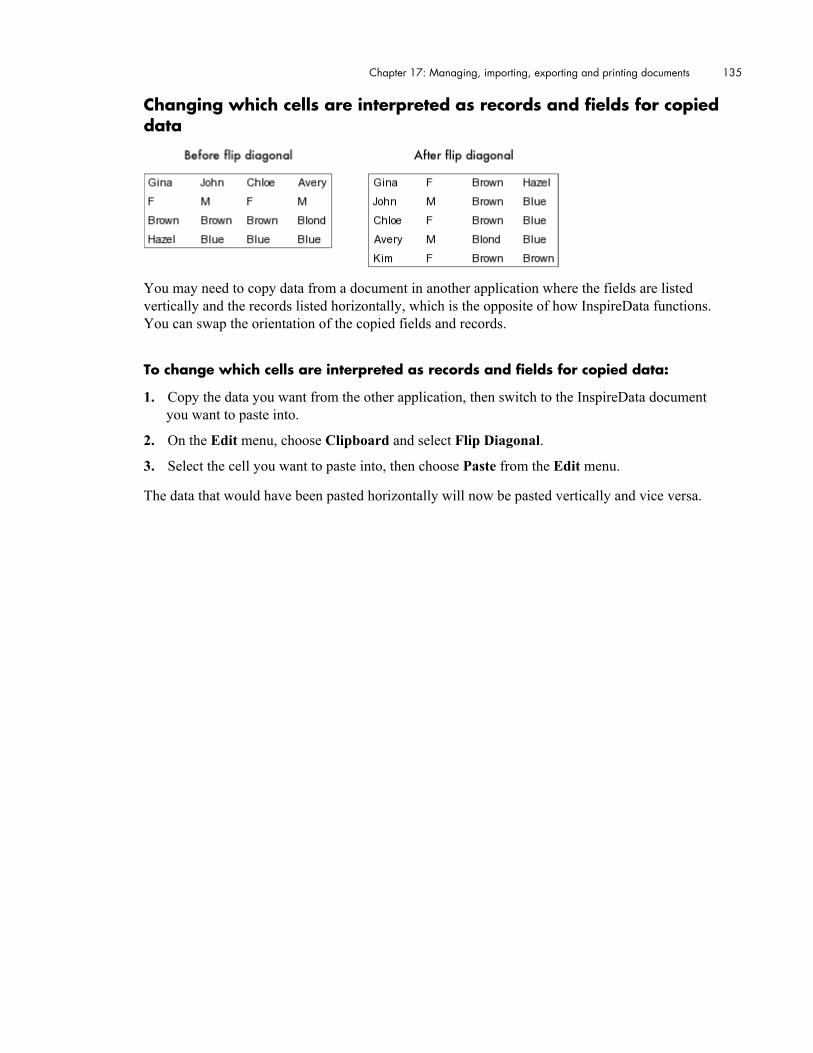
Chapter 17: Managing, importing, exporting and printing documents 135
Changing which cells are interpreted as records and fields for copied data
You may need to copy data from a document in another application where the fields are listed vertically and the records listed horizontally, which is the opposite of how InspireData functions. You can swap the orientation of the copied fields and records. To change which cells are interpreted as records and fields for copied data:
1. Copy the data you want from the other application, then switch to the InspireData document you want to paste into.
2. On the Edit menu, choose Clipboard and select Flip Diagonal.
3. Select the cell you want to paste into, then choose Paste from the Edit menu.
The data that would have been pasted horizontally will now be pasted vertically and vice versa.
136 InspireData™ User's Manual
Exporting documents
Exporting a table InspireData can export the data in a table as a comma- or tab-separated text file for use in other programs such as Microsoft Excel. To export a table:
1. On the File menu, choose Export Table...
2. Enter a name for the exported file.
3. Choose a file type to save as and click Save.
Note: If your table contains a subtable field, you may want to collapse it before exporting your table. For more information, see Expanding and collapsing a subtable on page 79.
Exporting a plot InspireData cannot save a plot as an image. However, you can copy your plots and paste them into an image editing application such as Microsoft Paint or Apple® Preview. To export a plot:
1. On the Edit menu, choose Copy.
2. Switch to your image editing application and create a new document.
3. Paste the image into your image editing application.
For more information on creating a new document, pasting and saving in your image application, please refer to that application’s documentation.
Chapter 17: Managing, importing, exporting and printing documents 137
Printing
Setting print options You can change the way documents are printed in the Page Setup dialog. To set print options:
1. Open the document you want to print.
2. On the File menu, choose Page Setup.
3. Make the changes you want, then click OK.
To change the options for your printer, click the Printer... button in the Page Setup dialog. The options you see will depend on the model of printer you have selected.
Printing a table or plot InspireData prints the document displayed on the screen. Tables with many fields or records may print on multiple pages. When this happens, InspireData will add a row and column number to the header of each page so that you can orient your pages correctly. Plots are sized to fit onto a single page. To print a table or plot:
1. Open the document you want to print.
2. On the File menu, choose Print...
3. The options in the Print dialog depend on the type of printer and printer software you’re using. In general, you will be able to specify the number of copies you want to print and a range of pages to print.
4. Click Print.
Note: To print a section of a plot, use the Zoom In, Exclude Selected Icons, or View Constraint commands on the plot menu. For more information, see Hiding specific icons in Plot View on page 114.
Size and memory limits On most computers, InspireData will perform well with tables containing up to 50 fields and 3,000 records. Documents can contain a maximum of 100 fields and 10,000 records, though large tables may cause slow performance on older systems. Tables with many structured fields such as series, multi-series and subtable fields may cause slow performance on some computers. Documents can contain a maximum of 500 series columns and 500 subrecords.

138 InspireData™ User's Manual
Chapter 18: Reference Using keyboard shortcuts
Keyboard shortcuts can save you time and make it easier to edit your documents. Some common commands, such as opening and closing documents are the same no matter what type of document you are working on. Other commands are available only for a based on whether you are in Table or Plot View. There are keyboard shortcuts for many of InspireData’s commands. The following are lists of keyboard shortcuts organized by the circumstances in which they are available:
Shortcuts for common commands To: Windows Macintosh
Open Starter screen Ctrl + N Command + N
Open existing document Ctrl + O Command + O
Close active window Ctrl + W Command + W
Save document Ctrl + S Command + S
Save document as... Ctrl + Shift + S Command + Shift + S
Print document Ctrl + P Command + P
Quit/Exit InspireData Ctrl + Q
Alt + F4
Command + Q
Undo Ctrl + Z Command + Z
Redo Ctrl + Shift + Z Command + Shift + Z
Cut Ctrl + X Command + X
Copy Ctrl + C Command + C
Paste Ctrl + V Command + V
Select all Ctrl + A Command + A
Clear Backspace or Delete Backspace or Delete
Help Ctrl + Shift + ? Command + Shift + ?

Chapter 18: Reference 139
Shortcuts for tables and data entry To: Windows Macintosh
Switch to Table View Ctrl + Shift + T Command + Shift + T
Add new table Ctrl + Shift + N Command + Shift + N
View table properties Ctrl + Alt + T Command + Shift + T
Move left one cell Left arrow Left arrow
Move right one cell Right arrow Right arrow
Move up one cell Up arrow Up arrow
Move down one cell Down arrow Down arrow
Move to the next cell Tab Tab
Move to the previous cell Shift + Tab Shift + Tab
Accept changes and move down
Enter Return
Add record Ctrl + R Cmd + R
Duplicate record Ctrl + D Cmd + D
Add field Ctrl + L Cmd + L
Shortcuts for plots To: Windows Macintosh
Switch to Plot View Ctrl + T Command + T
Show notes Ctrl + Shift + Y Command + Shift + Y
Label selected icon Ctrl + Alt + L Command + Alt + L
Increase icon size Ctrl + Shift + + Command + Shift + +
Decrease icon size Ctrl + - Command + -
Zoom in on selected icons Ctrl + Alt + Z Command + Alt + Z
Exclude (hide) selected icons Ctrl + Alt + E Command + Alt + E

140 InspireData™ User's Manual
Shortcuts for slide shows To: Windows Macintosh
View first slide Ctrl + Alt + Left arrow Command + Alt + Left arrow
View previous slide Ctrl + Left Arrow Command + Left Arrow
View next slide Ctrl + Right Arrow Command + Right Arrow
View last slide Ctrl + Alt + Right Arrow Command + Alt + Right Arrow
Capture slide Ctrl + E Command + E
Using shortcut menus Shortcut menus provide a list of commands pertaining to a screen region or selection. You can quickly carry out many of the commands in InspireData using a shortcut menu.
To display a shortcut menu:
• Click the right mouse button (Windows) or hold down the Control key (Macintosh) and click the mouse button.

Chapter 18: Reference 141
Using formulas You can define a field or axis using a formula. You can also use a formula with the Color by Field and Label tools.
Formula syntax Formulas in InspireData use an easy-to-follow syntax. The following are the rules for Formula syntax:
• In most cases, you can choose to use or not use a space between operators and variables in your formula. For example, both of the following are valid: ‘Field 1’ + ‘Field 2’ and ‘Field 1’+’Field 2’.
• When referring to a field whose heading contains spaces, use single quotes around that field name. For example: ‘Field 1’, ‘Global Population’, ‘Plant Growth’.
• When referring to a field, you can actually use just the first few characters of that field’s heading, as long as it provides enough information for InspireData to tell which field you want to use. For example, if your table contained fields named Category, Caterer and Cats, you could refer to those fields as Categ, Cater and Cats respectively.
• When referring to a series column in a series or multi-series field or a subfield in a subtable field, type the field heading, followed by the name of the series column or subfield in [square brackets]. For example, you would refer to the day 10 series column in the Height series field as: Height [10]
• When referring to a linked field or subfield in a subtable, type the field heading, followed by a period (.), followed by the name of the linked field or subfield. For example, you would refer to the ‘Distance’ subfield in the Moons subtable field as: Moons.Distance
• When a formula contains invalid syntax or if an operator or function is incomplete, an error message will appear beneath the Formula box and the OK button will be disabled in the Formula Editor. Once you complete your formula such that InspireData can produce a result, the message will disappear and the OK button will become available.

142 InspireData™ User's Manual
Formula operators InspireData provides a variety of operators for use in your formulas. Arithmetical operators
The following operators perform arithmetical operations on numbers or Number fields and produce a numerical result:
+ (Add) Add two numbers. Example: ‘Field 1’ + 10 add 10 to Field 1.
- (Subtract) Subtract two numbers. Example: ‘Field 1’ - 10 subtract 10 from Field 1.
* (Multiply) Multiply two numbers. Example: ‘Field 1’ * 10 multiply Field 1 by 10.
/ (Divide) Divide two numbers. Example: ‘Field 1’ / 10 divide Field 1 by 10.
^ (Exponent) Raise one number to the power of another Example: ‘Field 1’ ^ 3 raise Field 1 to the power of 3.
div (Divide integer) Divide the whole-number part of two numbers. Example: ‘Field 1’ div 10.6 divide Field 1 by 10.
mod (Modulo) Divide two numbers and return the remainder. Example: ‘Field 1’ modulo 10.6 return the remainder of Field 1 divided by 10.6.

Chapter 18: Reference 143
Comparison operators
The following operators perform comparison operations and produce a True/False result:
/= (Not equal)
Example: ‘Field 1’ /= 10 Is Field 1 not equal to 10?
< (Less than)
Example: ‘Field 1’ < 10 Is Field 1 less than 10?
<= (Less than or equal)
Example: ‘Field 1’ <= 10 Is Field 1 less than or equal to 10?
= (Equal)
Example: ‘Field 1’ = 10 Is Field 1 equal to 10?
> (Greater than)
Example: ‘Field 1’ > 10 Is Field 1 greater than 10?
>= (Greater than or equal)
Example: ‘Field 1’ >= 10 Is Field 1 greater than or equal to 10?
contains
Example: ‘Field 1’ contains “Blue” Does Field 1 contain the word blue? (Note that the specified value must be contained within quotes.)

144 InspireData™ User's Manual
Logical operators
The following operators perform logical operations for use with the conditional below:
and Example: if ‘Field 1’ < 10 and ‘Field 2’ > 4... If Field 1 is less than 10 AND Field 2 is greater than 4...
not Example: if ‘Field 1’ < 10 not ‘Field 2’ > 4... If Field 1 is less than 10, but Field 2 is NOT greater than 4...
or Example: if ‘Field 1’ or ‘Field 2’... If Field 1 is less than 10 or if Field 2 is greater than 4... Conditionals
You can use the following to build simple if, then statements: Example: if ‘Field 1’ > ‘Field 2’ then ‘Field 1’ * 2 else ‘Field 1’ / 2 If Field 1 is greater than Field 2, multiply Field 1 by 2. If not, divide Field 1 by 2.
if, then Example: if Field 1 = 10 then... If Field 1 equals 10, do the following...
if, then, else Example: if Field 1 = 10 then... ...else... If Field 1 equals 10, do the following... ...if it doesn’t, then do the following...

Chapter 18: Reference 145
Formula functions InspireData provides a variety of functions for use in your formulas. Mathematical functions
The following functions perform mathematical calculations on numbers or Number fields and produce a numerical result:
abs(number) Calculate the absolute value of a number. Example: abs(‘Field1’)
cos(number) Calculate the cosine of a number. Example: cos(‘Field1’)
ln (number) Calculate the natural logarithm (log base e) of a number. Example: ln(‘Field1’)
log (number [, base]) Calculate the logarithm of a number. Example: log(‘Field 1’,2)
max (number, number) Calculate the highest number of a set of fields. Example: max (‘Field 1’, ‘Field 2’); What is the highest value amongst Field 1 and Field 2?
min (number, number) Calculate the lowest number of a set of fields. Example: min (‘Field 1’, ‘Field 2’) What is the lowest value amongst Field 1 and Field 2?
round(number [, precision]) Round a number to the nearest precision. Example: round (‘Field 1’, 3) Round Field 1 to the nearest thousandth.
sin(number) Calculate the sine of a number. Example: sin(‘Field1’)
sqrt(number) Calculate the square root of a number. Example: sqrt(‘Field1’)
tan(number) Calculate the tangent of a number. Example: tan(‘Field1’)

146 InspireData™ User's Manual
String functions
The following operators perform operations on text fields: length(string) Count the number of characters in a string. Example: length(‘Field 1’); How many characters are in Field 1? concat(string, string, etc) Combine the text in a set of fields. Example: contcat(‘Field 1’,’Field 2’,’Field 3’); Merge the contents of Fields 1, 2 and 3. Logical functions
The following operators perform operations a field and produce a true/false result: valid(value) Check if a field contains a valid value. Example: valid(‘Field 1’); Does Field 1 contain any data or a valid value for its data type? Data type conversion functions
The following operators perform operations on text and number fields and produce a numerical result: date(value) Convert the value in a field to a date. Example: date(‘Field 1’) datetime(value) Convert the value in a field to a date and time. Example: datetime(‘Field 1’) text(value) Convert the value in a field to text. Example: text(‘Field 1’) time(value) Convert the value in a field to a time. Example: time(‘Field 1’)
Summary functions for structured fields
The following operators perform computations on series, multi-series and subtable fields and produce a numerical result: count(field) Count the number of subfields in a field. Example: count(‘Field 1’); How many subfields are in Field 1? largest(field) Finds the largest value in a field. Example: largest(‘Field 1’); What is the highest value in Field 1? smallest(field) Finds the smallest value in a field. Example: largest(‘Field 1’); What is the lowest value in Field 1? mean(field) Calculates the mean of a field. Example: mean(‘Field 1’). median(field) Calculates the median of a field. Example: mean(‘Field 1’). total(field) Adds all the values of a field. Example: mean(‘Field 1’).
Chapter 18: Reference 147
Database and example resources InspireData includes more than 60 built-in databases and examples grouped by curricular focus.
1. On the InspireData Starter screen, click Resources.
2. Select a curricular area and choose a database or example to open.
The following is a comprehensive list of the databases provided with InspireData: 100m Track Finals This data set shows the splits every 10 meters for the top four finishers in the men’s 100-m track final in the 1988 Olympics in Seoul, South Korea.
Agriculture Trends This data set captures the changing trends in agriculture, including the percentages of specific crops and livestock that were present on farms in the years 1900 and 1997.
Alligators This data set includes alligator data, including gender, length, weight and habitat.
American Community Survey The American Community Survey (ACS) is a nation-wide survey that collects population, social, economic and housing data. This data set contains selected social characteristics of the United States for the years 2000 to 2004.
Are You a Square This data set represents height and wingspan measurements taken on a class of elementary school-aged students.
Baseball Salaries This data set represents National League Baseball salaries in 2005.
Bean Box Experiment This is experimental data collected by dropping 10 beans into a box that has a shaded picture inside. The data shows how many beans landed in the shaded picture and how many did not land in the shaded picture, in order to determine the experimental probability that a single bean will land in the shaded area.
Cats This data set simulates a survey of cat characteristics, such as age, weight, body length, eye color and fur color.
Cell Division This data set represents the results of mitosis, a process of cell division that produces two daughter cells from a single parent cell. The data shows how many daughter cells will result from a single parent cell after 24 hours.
Cell Phone Plans This data set includes the minutes, charges and costs for three different cell phone plans.
Change Over Time This data set includes multiple examples of data indexed to time or sequential events.
Circle Game This fictional data simulates the results of a simple computer game that compares the reaction times of a student’s dominant hand vs. non-dominant hand.
City Climates This data set shows the average annual monthly temperature as it was recorded over a 30 year period (1971-2000) by the National Climatic Data Center.
Clay Boat Experiment This fictional experimental data represents the weight in pennies that student-designed clay boats can hold before sinking. The experiment is performed four times with a modified boat design for each trial.
Consumer Price Index From US Department of Labor, this data set collects the US city averages for the consumer price index for all urban consumers.
Cooling This data represents the temperature change over time as a beaker of water cools off.
Countries of the World This data set profiles 155 countries of the world, and includes information on population density and change over time, average life expectancy, literacy rates, GDP, imports, exports and government expenditures.
Defrost Time This data set shows defrost times in hours for turkeys that range in weight from 4 lbs to 24 lbs.
Dinosaurs This data set contains information, such as geographic locations, era, length, height, mass and diet, for many different kinds of dinosaurs.
Early Native Americans This data set contains statistics and background information on the characteristics of selected Native American groups or tribes.
Election Results This data set contains selected U.S. presidential election data, including popular and electoral college results, from 1876-2004.
Endangered Species This data set represents the number of endangered animals and plants per calendar year as of 12/31/2005.
Fish Counts This data set compiles yearly totals of fish counted passing over the Bonneville Lock and Dam from 1938 to 2002.
Friction Experiment This data was collected by rolling a cue ball through a set of photogates and measuring the distance from the gates to where the ball stopped.
Gasoline Prices This data set demonstrates average price trends of gasoline in the U.S. from 1977-2003.

148 InspireData™ User's Manual
Harmony This data set collects information on musical notes, including set note, solfege, high and low frequencies, and the frequency ratio.
Heating This data represents the temperature change over time as a pan of water is heated on a stove.
Heptathlon This data contains the results of the 2004 Olympics Women’s Heptathlon event.
Historical US Population This data set contains population and population density figures beginning with the first U.S. census in 1790 through 1900.
Human Cannonball This fictional data set represents the vertical height (in feet) and the horizontal distance (in feet) of a human being launched from a cannon.
Hurricanes This data set documents the tracking information for hurricanes in the North Atlantic Basin in 2003 and 2004.
Minimum Wage This data set, compiled from data on the U.S. Department of Labor web site, details the number of workers paid at or below the prevailing Federal minimum wage in 2002.
Motor Vehicle Safety This data set contains motor vehicle safety data for selected years from 1960-1985, and annual data from 1990-2003.
Music Survey This fictional data shows the kinds of answers you might get in a classroom music survey.
NBA Statistics This data contains statistics for teams and players in the NBA 2005-2006 season.
Oil Slick Spread This data set represents the spread of an oil slick over time.
Pendulum Experiment This data set shows the time it takes a pendulum to swing 10 times, and the corresponding weight and length of the pendulum used in each trial.
Periodic Table This data set collects information for each element represented in the periodic table, including its atomic number and weight, electron configuration, electronegativity and ionization potential.
Planets Advanced Geared for middle to high school students, this data set contains NASA planetary data, including orbital circumference, mass, volume, density, rotation period, rotational velocity, pressure and calculated escape velocity.
Planets Basic Aimed at elementary students, this data set contains planetary data from NASA, including the diameter, circumference, surface area, minimum and maximum surface temperature measurements for each planet.
Plant Growth This data set charts plant growth over time, as it is affected by various changes in growing conditions, such as low salt, high salt, and aromatherapy.
Produce Predictions This data set contains length and girth measurements for fruits and vegetables from the local produce market.
Roller Coasters This data set contains a variety of facts about roller coasters of the world including track material, largest drop, height, length and top speed.
Savings Account This data set represents the future value of a savings account with an initial deposit of $2600.00, no additional contributions, collecting 4% interest compounded four times annually for 30 years.
Seat Belt and Helmet Use This data set contains seat belt and motorcycle helmet use statistics for the years 1994 to 2004.
Shopping Cart Train This data set includes the number of carts in a shopping cart train and its resulting overall length.
Sleep in Mammals This data set includes statistics for body weight, brain weight, sleep cycle, life span and gestation period for several mammals.
Sleep Survey This fictional survey represents data—including hours of sleep, ease of waking up, sleepy time, alert time, size of breakfast and average GPA—you might collect from students in a classroom.
Slinky Experiment This data set was collected by hanging a slinky vertically and measuring its length. The number of coils allowed to hang is varied.
Soap Brands This data set presents information such as price and bubble diameter for several different soap brands.
Student Survey This fictional data set shows data, including hair and eye color, that you might collect from students in your classroom.
Time and Position This data set contains information such as average speed, time and acceleration for several experiments.
US Immigration Adapted from the U.S. Department of Homeland Security yearbook, this data set collects immigration to the United States statistics for the years 1820 to 2004.
US Unemployment Rates This data represents the fluctuations in the U.S. national unemployment rate from 1948 to 2004.
Video Game Survey This fictional data set shows the kinds of data you might collect in a classroom video game survey.
World Population Growth This data set presents the total mid-year population of the world with projections for population growth through 2050.
Chapter 18: Reference 149
Glossary axis Horizontal or vertical line along which icons can be plotted. Axes can be displayed as categories, ranges or continuously in Axis, Stack and Pie plot modes.
Axis plot
Plot mode that contains a vertical and horizontal axis.
category
Subdivision created when a category axis or range axis is present in a plot.
category axis
Axis that contains a subdivision for each unique value in a given field. Default axis type for text or true/false fields.
cell
The intersection of a field and a record in Table View.
clipboard
Area where your operating system stores copied data from InspireData or other applications.
data
Values contained within a record, field or table.
data type
Setting for a field that determines what kind of data can be entered. (e.g., numbers only, text and numbers, dates only, etc.)
database
InspireData document containing one or more tables of data based on a particular subject.
document
Generic name for a file created by InspireData.
example
InspireData document containing data, plots, slides and notes based on a particular subject.
field
Column in a table that determines what characteristic will be recorded for a particular cell in a record.
field type
Setting for a field that determines how the data in it is structured.
format
Setting for a field that determines how the data contained within it appears.
field heading
Title or name of a field.
icon
Customizable graphic representation of a record in Table and Plot View.
label
Textual representation in Plot View of the data in one field of a record.
list field
Field type that divides pieces of data using commas.
multi-series field
Field type that is divided into multiple columns and rows. Each record contains the same number of rows.
no Data
Area in Plot View where icons containing no data for a given field are plotted.
Note
Block of text that can be added to a field, record, table or plot.
Pie
Plot mode that places icons into wedges based on the quantity of values for a given field.

150 InspireData™ User's Manual
plot
Graphical representation of the data contained within a table.
Plot View
View in which plots can be created.
Questionnaire
Survey-style form that can be used to add records to a table.
range axis
Axis that is divided into equally spaced intervals based on the maximum and minimum values in a given field.
range step
Size of the interval used in the subdivisions of a range axis.
record
Row in a table where the data for each subject, object or entry in a table is stored.
region
Subdivision of a category or range axis, Venn loop or Pie wedge.
series column
Column contained within a series or multi-series field.
series field
Field type that is divided into multiple columns.
series playback controls
Controls that allow you to move between series columns when a series or multi-series field is plotted.
Slide
Object that can be used to store and retrieve the axis, notes and plot options of a plot.
Slide Show controls
Controls that allow you to switch between captured slides in Plot View.
sort
Order in which records appear in a table.
Stack
Plot mode that places icons into stacks determined by common values in a given field.
structured field
Generic term for a field type that can contain more than one piece of data: List, series, multi-series or subtable field.
subtable
Field type that is divided into multiple columns and rows. Each record can have a unique number of rows.
supercategory
Combination of two or more categories.
table
Grid that contains related data about a particular subject.
Table View
View in which tables can be created.
Toolbar
Horizontal bar containing tools for common functions in InspireData; appears at the top of the screen in Table View, appears at the bottom of the screen in Plot View.
value
Generic term for the data in a particular cell, record or field.
Venn
Plot mode that places icons into loops based on common values in a given field. zoom
Tool that focuses in on a set of records -and hides the others from view.

Index 151
Index A Add Field tool • 23 Add Record tool • 34 Axis
assigning a formula • 90 assigning a series field • 110 assigning in a Stack plot • 89 changing the range step • 94 maximum and minimum values • 93, 100 reassigning a field • 89 type • 91, 99
Axis plots • 18 box plot • 101 introduction • 18
B Back tool • 111
C Cell
clearing • 41 editing • 40 filling • 41 selecting • 39
Circle Game • 45 Clear tool • 117 Color
by field • 121, 122, 123 by formula • 125 changing for marked icons • 120 changing plot colors • 124 changing table colors • 37 turning off • 125
Color by Field tool • 121, 122 Compute tool • 126
D Data
entering • 40 importing • 133
Data Type converting • 27 date • 26 datetime • 27 formatting • 30
formula • 28, 141 number • 25 text • 26 time • 27 true/false • 26
Databases descriptions • 147 exporting • 136 importing • 133 opening • 147
Documents closing • 132 creating new • 131 exporting • 136 importing • 133, 134 opening • 131 saving • 132
F Fields
adding • 23, 34 copying • 33 data type • 25 deleting • 32 filling • 41 formatting • 25 pasting • 33, 34 renaming • 24 reordering • 33 resizing • 33 selecting • 23 using formulas • 28
Fill multiple fields • 41 multiple records • 42
Formulas functions • 145 operators • 142 syntax • 141
Forward tool • 111
G Glossary • 149
H History • 111
152 InspireData™ User's Manual
I Icon Editor • 56, 58, 61, 62 Icons
changing • 56, 62 changing default • 62 changing size • 112 coloring • 121 copying • 61 editing • 56, 58, 59, 61 excluding • 115 hiding • 115 importing • 60 labeling • 119 library • 60 marking • 120 pasting • 61 selecting in Plot View • 113
Importing • 133 InspireData
documentation • 9 InspireData Starter • 11, 147 quitting • 11 starting • 10
Instant Plot • 107
L Labels
Label tool • 119 showing and hiding • 120
Linked fields creating • 65 plotting • 116
M Mark tool • 120
N No Data • 117 Note
adding to a cell • 43 adding to a field • 32 adding to a plot • 118 adding to a record • 35
P Pie plots
introduction • 17 Plot View • 13
Plots Axis • 18 creating • 82 exporting • 136 Free • 84 Pie • 17 Stack • 16 title • 118 Toolbar • 83 uses of • 15 Venn • 15, 85
Printing • 137
Q Questionnaires
conducting a survey • 54 customizing • 50, 51, 52, 54 editing • 50, 51, 52, 54
R Records
adding • 34, 37 copying • 36 deleting • 36 duplicating • 36 entering data into • 39, 40 filling • 42 pasting • 36, 37 selecting • 35 sorting • 47 viewing from Plot View • 112
S Scatter graph • 19 Series and multi-series columns
adding • 73 deleting • 74 duplicating • 73 headings • 73, 74 moving out of a structured field • 81 renaming • 73 reordering • 74
Series and multi-series subfields adding • 75 changing the data type of • 77 deleting • 77 moving out of a structured field • 81 renaming • 76 reordering • 77

Index 153
selecting • 75 Shortcut keys • 138 Slide
capturing • 128 deleting • 130 editing • 129 renaming • 129 reordering • 129 Sorter • 128 updating • 129
Slide show creating • 127 editing • 129 presenting • 130
Slide Sorter • 128 Stack plots
axis type • 91 creating • 89 introduction • 16 mirror • 95 orientation • 94 parallel • 94 supercategories • 92
Structured fields choosing • 80 converting • 72, 81 list • 67, 68 multi-series • 71, 72 plotting • 107 series • 69 subtable • 78
Subtable fields adding a subfield • 78 adding a subrecord • 78 creating • 78 expanding and collapsing • 79
T Table View • 12 Tables
adding fields • 23 adding records • 34 copying • 37 duplicating • 64 exporting • 136 linking • 65, 66 multiple • 63 pasting • 37 properties • 37, 66
saving • 132 size and memory limits • 137 uses of • 14
Technical Support • 10 Time series
introduction • 19 plotting • 107 showing every value • 110
Timestamp • 46 Titles • 118 Toolbar
in Plot View • 82, 83 in Table View • 22
U Undo • 38, 58
V Venn plots
adding a loop • 87 creating • 86 defining a loop • 86 introduction • 15
Views Table View • 12
Z Zoom • 115, 116