INSOLUBLE TOMATO-FIBER EFFECT ON WHEAT DOUGH …
18
Ital. J. Food Sci., vol. 31, 2019 - 1 OPINION PAPER INSOLUBLE TOMATO-FIBER EFFECT ON WHEAT DOUGH RHEOLOGY AND COOKIES' QUALITY M. CHOUAIBI*, L. REZIG, A. BOUSSAID and S. HAMDI Food Preservation Laboratory, High Institute of Food Industry, 58 Alain Savary street, Elkhadra city, Tunis 1003, Tunisia *Corresponding author: Tel./Fax: +21671770399/+21671771192 E-mail address: [email protected] ABSTRACT Commercial insoluble tomato fiber (ITF) was incorporated in wheat-flour dough to prepare cookies at amounts of 2.50, 5, 7.50, and 10 %. It was demonstrated that all wheat dough samples exhibited non-Newtonian-thixotropic behaviors at shear rates from 0.001 to 1000 s-1. Besides, the oscillatory rheology analysis confirmed that the storage modulus predominated the loss one in the whole frequency range and increased significantly with the increase in the ITF concentration. Actually, the latter's incorporation from 0 to 10 % increased Farinograph water absorption, pasting temperature and peak consistency, and decreased dough stability, amylograph pasting viscosities and fermentation parameters of all tested wheat flours. Furthermore, the ITF addition was proven to affect the formed cookies, indicating a significant increase in the samples' breaking strength and decrease in their spread ratio. The total polyphenol contents of the formed cookies ranged from 86.98mgGAE/ 100 g to 376.02 GAE/g cookies. The ITF incorporation increased the antioxidant activities as measured by DPPH, ABTS and FRAP scavenging activities. Correlations between the analyzed parameters of the cookies' color and IC50 are statistically significant (p< 0.01), suggesting the possible use of ITF as an alternative source of bioactive compounds to improve the cookies' quality. Keywords: Insoluble tomato fiber, wheat flour, rheological properties, cookies, antioxidant activities, quality characteristics
Transcript of INSOLUBLE TOMATO-FIBER EFFECT ON WHEAT DOUGH …

Ital. J. Food Sci., vol. 31, 2019 - 1
OPINION PAPER
INSOLUBLE TOMATO-FIBER EFFECT ON WHEAT DOUGH RHEOLOGY AND COOKIES' QUALITY
M. CHOUAIBI*, L. REZIG, A. BOUSSAID and S. HAMDI Food Preservation Laboratory, High Institute of Food Industry, 58 Alain Savary street, Elkhadra city,
Tunis 1003, Tunisia *Corresponding author: Tel./Fax: +21671770399/+21671771192
E-mail address: [email protected]
ABSTRACT Commercial insoluble tomato fiber (ITF) was incorporated in wheat-flour dough to prepare cookies at amounts of 2.50, 5, 7.50, and 10 %. It was demonstrated that all wheat dough samples exhibited non-Newtonian-thixotropic behaviors at shear rates from 0.001 to 1000 s-1. Besides, the oscillatory rheology analysis confirmed that the storage modulus predominated the loss one in the whole frequency range and increased significantly with the increase in the ITF concentration. Actually, the latter's incorporation from 0 to 10 % increased Farinograph water absorption, pasting temperature and peak consistency, and decreased dough stability, amylograph pasting viscosities and fermentation parameters of all tested wheat flours. Furthermore, the ITF addition was proven to affect the formed cookies, indicating a significant increase in the samples' breaking strength and decrease in their spread ratio. The total polyphenol contents of the formed cookies ranged from 86.98mgGAE/ 100 g to 376.02 GAE/g cookies. The ITF incorporation increased the antioxidant activities as measured by DPPH, ABTS and FRAP scavenging activities. Correlations between the analyzed parameters of the cookies' color and IC50 are statistically significant (p< 0.01), suggesting the possible use of ITF as an alternative source of bioactive compounds to improve the cookies' quality.
Keywords: Insoluble tomato fiber, wheat flour, rheological properties, cookies, antioxidant activities, quality characteristics

Ital. J. Food Sci., vol. 31, 2019 - 2
1. INTRODUCTION Every year, millions of tons of tomatoes are processed with a residue waste being considered as a good source for food supplements, such as insoluble dietary fibers (IDF), fats, proteins and bioactive compounds, namely lycopene and polyphenols (KAUR et al., 2008). IDF from by-products, whose chemical constituents are chiefly non-starch polysaccharides, namely cellulose, arabinoxylans and β-glucan, is not commonly incorporated in food products due to its adverse effects on food quality, like sensory effects and functionality (AHMED et al., 2013). Nowadays, many research works have revealed that IDF is beneficial to human health. Indeed, the ingestion of insoluble fiber from fruits and vegetables could significantly reduce the plasmatic concentration of cholesterol, implying a decrease in the risk of cardiovascular disease, colon cancer, diabetes and obesity (SLAVIN, 2013). The European Prospective Investigation into Cancer and Nutrition (EPIC) has shown 40% reduction of colorectal cancer risk when consuming more than 30 g of fiber per day (SUMCZYNSKI et al., 2015). Actually, the Food and Nutrition Board recommends 38 g/day for dietary fiber intake (SUMCZYNSKI et al., 2015). Tomato fiber is a by-product of tomato processing industry with high content of IDF (71.82 %), soluble dietary fiber (14.33 %), protein (13.30 %), lipid (6.01 %) and ash (3.01) (NAVARRO-GONZALEZ et al., 2011). Some sugars, as glucose, xylose and galactose are present in tomato residue fiber (GARCIA-HERRERA et al., 2010). The latter is reported to comprise mainly cellulose (75%), hemicelluloses (15%) and pectin (10%) (HUA et al., 2017). Since it is rich in bioactive compounds, namely polyphenols and lycopene, it could be used in the development of functional food formulations (NAVARRO-GONZALEZ et al., 2011). Cookies and biscuits can be supplemented with dietary fibers from various sources, wheat bran, inulin carob fiber and many other biopolymers such as galactomannans, pectins and β-glucan (MILDNER-SZKUDLARZ et al., 2013). The incorporation of dietary fiber into wheat flour interacts directly with the structural elements of three dimensional gluten networks, disrupts the starch gluten matrix and finally changes the mechanical properties of blended dough during mixing, fermentation and baking (LIU et al., 2017; MARTINEZ et al., 2014; AHMED et al., 2013). Since there is no published data on cookies formulations containing ITF, to our knowledge, this study is the first to examine the effect of ITF incorporation on both physicochemical and rheological wheat dough, and the quality characteristics of the formulated cookies. The obtained results would contribute to better valorize the ITF in the cereal-based foods and support product authenticity. 2. MATERIALS AND METHODS 2.1. Materials The samples of commercial wheat flour produced by “Minoterie Soukra de Tunis”, Tunisia” were studied for proximate composition. ITF was supplied by “Conservas Vegetales de Extremadura” (CONESA), Extremadura, Spain, and packaged in vacuum bags until the samples were opened for analysis. The ITF proximate composition: water content 6.22 g/100 g, protein 0.93 g/100 g, dietary fiber 91.27 g/100 g, lipid 1.01 g/100 g, ash 0.57 g/100 g), ITF 79.82 g/100g and soluble dietary fiber 11.45 g/100g. Wheat dough samples were packed in low-density polyethylene bags, and then stored for analysis at different ITF concentrations.

Ital. J. Food Sci., vol. 31, 2019 - 3
2.2. Proximate composition analyses Water, protein, lipid and ash contents were determined according to the approved AOAC method (AOAC, 1990). Dietary soluble and insoluble fiber contents were identified according to the method of PROSKY et al. (1998). Total carbohydrate content was estimated by mean-value difference: 100− (% water +% protein+% ash + % lipid+% total fibres). The assessment of wet and dry gluten contents, and gluten index was performed by Glutomatic (Perten Instruments, Hägersten, Sweden) according to the AACC method (AACC, 2000). Wheat flour was substituted by ITF at different concentrations (g/100 g) to make a dough blend. Both wheat flour and ITF was premixed in dry condition using a mixer with a spiral blade, typically used for dough mixing. The wheat dough samples were prepared by mixing different blends in Farinograph at a consistency of 500 UB at 30°C. The wheat flour sample without TIF was considered as control. 2.3. Rheological properties of wheat dough 2.3.1 Rheological measurements The rheological properties of prepared dough samples were determined using a strain/stress controlled Rheometer (Thermo-Haake, Rheostress 1, Germany) equipped with a temperature-control unit (Thermo-Haake, Karlsruhe K15 Germany). The Rheometer had a cone-plate configuration with a 35-mm cone radius and a 0.14-mm gap between the cone and plate. Measurements were conducted in the shear rate range of 0.001 to 1000 s-1 at constant temperature (20°C). Twenty-five data points were recorded at 10 s intervals during the shearing. Each measurement was replicated seven times on the same sample with two repetitions. Experimental data were fitted to Herschel-Bulkley and power-law (Ostwald) equations (1) and (2), respectively: σ = σ! + 𝐾𝛾! (1) σ = Kγ! (2) Where σ is the shear stress (Pa), K is the consistency coefficient (Pa.sn), γ is the shear rate (s-1), σ0 is the yield stress and n is the flow behavior index (dimensionless). The thixotropic hysteresis loop area was computed as the difference between the area under the up-flow and the down-flow curve using RheoWin v.2.93 (Haake, Germany) software. 2.3.2 Dough viscoelasticity Using a parallel plate system (4 cm dia.) at a 500-mm gap, the dynamic rheological measurements were conducted with a Rheometer (AR 1000, TA Instruments, New Castle, DE, USA). Dynamic shear data were obtained from frequency sweeps over the range of 0.1-100 rad/s. The strain value was obtained in the linear viscoelastic region at 1.5 % strain, and the frequency-sweep tests were performed at 20°C. To obtain the experimental data and to calculate the elastic (G’) and viscous moduli (G’’), data analysis software (version VI. 1.76) was used. Aiming to relax the samples before taking the dynamic shear rheological measurements, all samples were allowed a5-min rest at the initial temperatures. These rheological measurements were performed in triplicate.

Ital. J. Food Sci., vol. 31, 2019 - 4
2.3.3 Farinograph, alveograph and visco-amylograph tests The ITF effect on dough rheology was determined by Farinograph alveograph and visco-amylograph tests according to AACC method (AACC, 2000). 2.4. Fermentation parameter determination Fermentation parameters were assessed by the Rheofermentometer F3 (Tripette and Renaud, France) according to the supplier’s specifications. The fermentation parameters of dough development were determined as follows: maximum dough fermentation height (Hm) and the time at which dough reaches maximum height (T1). The measured gas parameters were the volume of gas produced throughout fermentation (VT), the gas retained in the dough at the end of the assay (VR), and the loss volume of gas (VL) in both milliliters (mL). All assays were performed in triplicate, and the average values were adopted. 2.5. Formulation of cookies 2.5.1 Cookie preparation Cookies were prepared from the wheat flour (WF) and other ingredients such as shortenings, sugar, salt and sodium bicarbonate. Composite flours, ITF and other dry ingredients (sodium bicarbonate, sugar and salt) were mingled together in a bowl and shortenings were added, then mixed in a Hobart mixer for 6 min to obtain creamy dough. The specified amount of water was added gradually during continuous mixing until slightly firm dough was obtained. A hundred of baked cookies each weighing approximately 13.4 g were obtained for each recipe. Kneaded dough was manually rolled into sheets of required thickness and cut into round shapes, using a 5-cm diameter and 1-cm high biscuit cutter. Cookies were baked in batches at 195±2.0°C for 20 min. Baked cookies were cooled to room temperature (22±1.0°C) and stored in polyethylene bags until analysis. 2.5.2 Color determination The color parameters (L*, a* and b*) of the prepared wheat flours and formulated cookies were assessed using a CR-300 colorimeter (Konica Minolta Sensing, Inc., Osaka, Japan). Color intensity was measured and expressed using the CIE L* a∗ b* coordinate system, where L* represents color lightness, a∗ characterizes red (positive value) and green (negative value) colors. The parameter b∗ indicates yellow (positive value) and blue (negative value) colors. The above analysis was realized in 20 replicates. 2.5.3 Physical parameters The cookies' diameter was measured by laying six cookies edge to edge with the help of a scale, rotating them through 90◦, remeasuring them and then taking the average value. The cookies' thickness was measured by stacking five samples one on top of the other and taking the average value. The spread ratio was estimated as diameter/thickness.
Ital. J. Food Sci., vol. 31, 2019 - 5
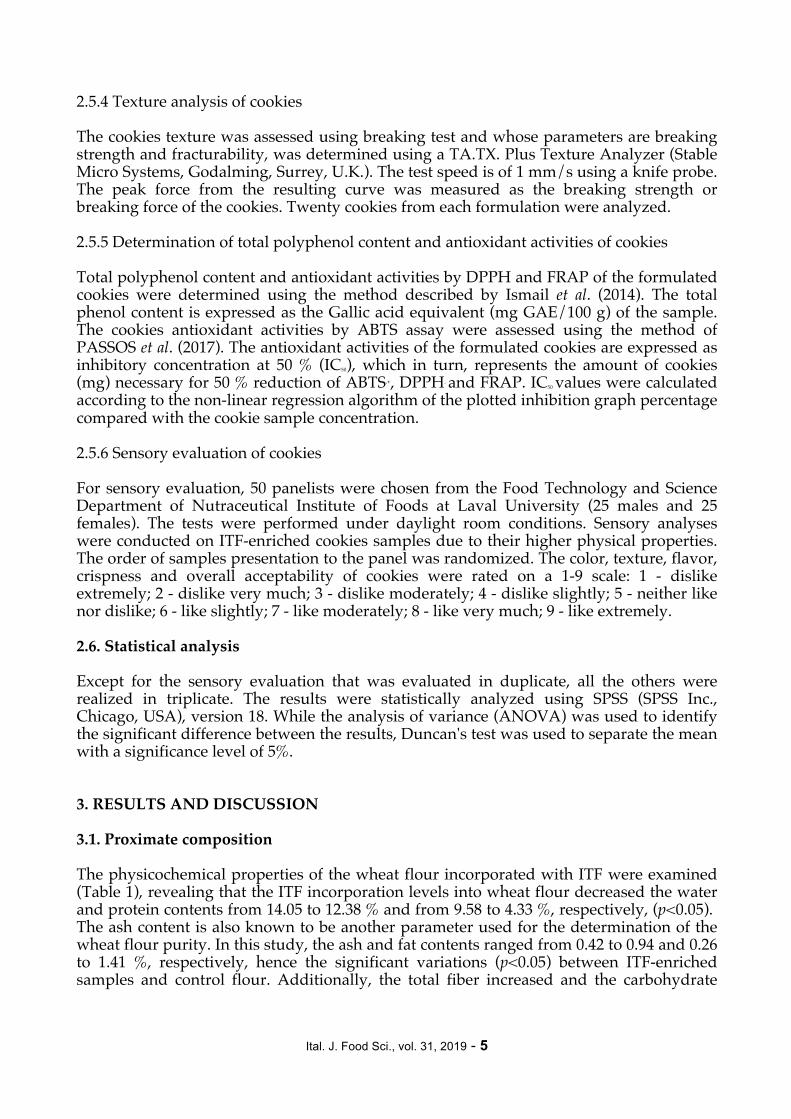
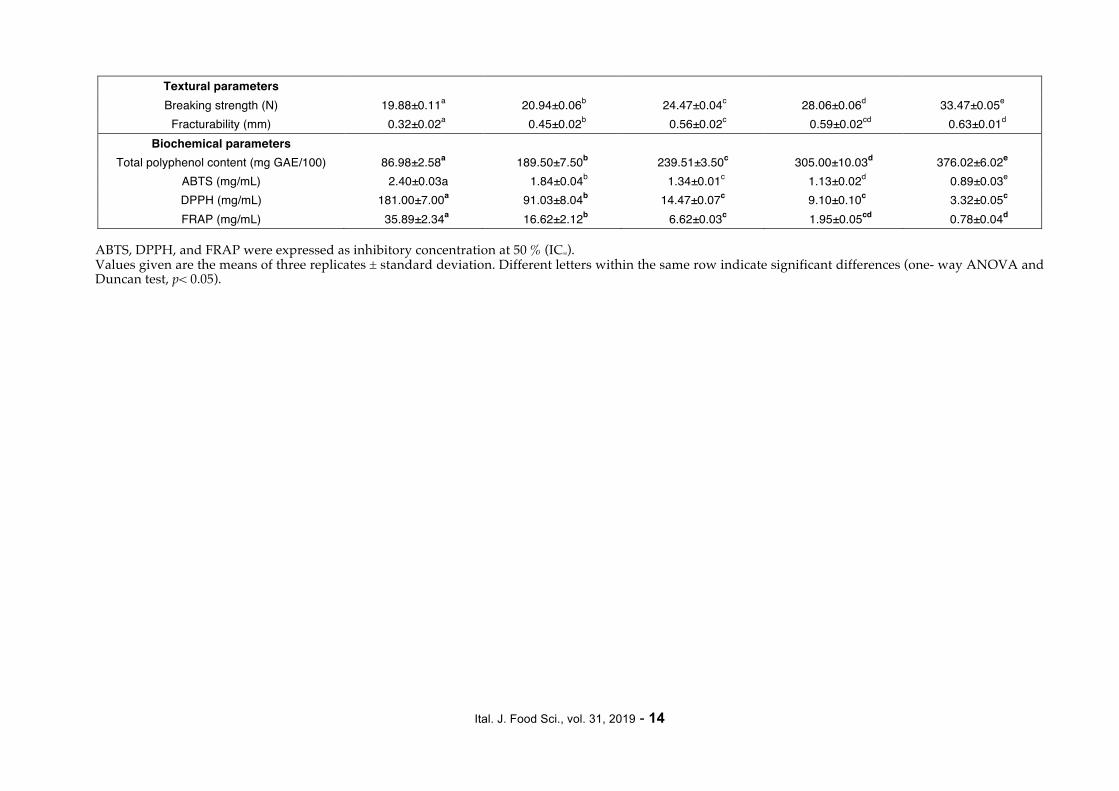
2.5.4 Texture analysis of cookies The cookies texture was assessed using breaking test and whose parameters are breaking strength and fracturability, was determined using a TA.TX. Plus Texture Analyzer (Stable Micro Systems, Godalming, Surrey, U.K.). The test speed is of 1 mm/s using a knife probe. The peak force from the resulting curve was measured as the breaking strength or breaking force of the cookies. Twenty cookies from each formulation were analyzed. 2.5.5 Determination of total polyphenol content and antioxidant activities of cookies Total polyphenol content and antioxidant activities by DPPH and FRAP of the formulated cookies were determined using the method described by Ismail et al. (2014). The total phenol content is expressed as the Gallic acid equivalent (mg GAE/100 g) of the sample. The cookies antioxidant activities by ABTS assay were assessed using the method of PASSOS et al. (2017). The antioxidant activities of the formulated cookies are expressed as inhibitory concentration at 50 % (IC50), which in turn, represents the amount of cookies (mg) necessary for 50 % reduction of ABTS.+, DPPH. and FRAP. IC50 values were calculated according to the non-linear regression algorithm of the plotted inhibition graph percentage compared with the cookie sample concentration. 2.5.6 Sensory evaluation of cookies For sensory evaluation, 50 panelists were chosen from the Food Technology and Science Department of Nutraceutical Institute of Foods at Laval University (25 males and 25 females). The tests were performed under daylight room conditions. Sensory analyses were conducted on ITF-enriched cookies samples due to their higher physical properties. The order of samples presentation to the panel was randomized. The color, texture, flavor, crispness and overall acceptability of cookies were rated on a 1-9 scale: 1 - dislike extremely; 2 - dislike very much; 3 - dislike moderately; 4 - dislike slightly; 5 - neither like nor dislike; 6 - like slightly; 7 - like moderately; 8 - like very much; 9 - like extremely. 2.6. Statistical analysis Except for the sensory evaluation that was evaluated in duplicate, all the others were realized in triplicate. The results were statistically analyzed using SPSS (SPSS Inc., Chicago, USA), version 18. While the analysis of variance (ANOVA) was used to identify the significant difference between the results, Duncan's test was used to separate the mean with a significance level of 5%. 3. RESULTS AND DISCUSSION 3.1. Proximate composition The physicochemical properties of the wheat flour incorporated with ITF were examined (Table 1), revealing that the ITF incorporation levels into wheat flour decreased the water and protein contents from 14.05 to 12.38 % and from 9.58 to 4.33 %, respectively, (p<0.05). The ash content is also known to be another parameter used for the determination of the wheat flour purity. In this study, the ash and fat contents ranged from 0.42 to 0.94 and 0.26 to 1.41 %, respectively, hence the significant variations (p<0.05) between ITF-enriched samples and control flour. Additionally, the total fiber increased and the carbohydrate

Ital. J. Food Sci., vol. 31, 2019 - 6
contents decreased substantially with the increase in ITF from 0 to 10 % (p<0.05) depending on the ITF's concentration. Likewise, wet and dry gluten contents decreased from 28.20 to 22.56 % and from 12.48 to 9.98 %, respectively, with ITF incorporation (p>0.05), which is the same with the gluten index values (p<0.05). Furthermore, the results demonstrated that dry gluten content decreased significantly with the incorporation of 2.5 % ITF, due to reduction of protein content in the tested wheat flours. The ITF incorporation will compete for water during the dough making process, thus making the dough thicker, which in turn may ‘work’ the gluten network more to enable an enhanced water uptake. Further ITF incorporation would out-compete gluten for the available water and make the gluten network less able to take up water, hence reducing the water binding capacity beyond the ITF incorporation in wheat flour. Table 1. Chemical composition, gluten analysis and color parameters of wheat flour containing insoluble tomato fibre.
ITF concentration (g/100 g) Control 2.5 5 7.5 10
Chemical composition Water 14.05±0.03a 13.63±0.03b 13.22±0.02c 12.80±0.02d 12.38±0.02e Protein 9.58±0.05a 6.77±0.04b 5.95±0.05c 5.14±0.03d 4.33±0.02e
Ash 0.42±0.02a 0.55±0.01b 0.68±0.01c 0.71±0.01d 0.74±0.01e Lipids 0.26±0.01a 0.55±0.01b 0.84±0.01c 0.92±0.01d 0.94±0.01d
Insoluble fiber 3.54±0.05a 10.21±0.04b 11.87±0.03c 14.54±0.02d 18.20±0.02e Soluble fiber 6.75±0.05a 7.08±0.10ab 7.41±0.14bc 7.73±0.20cd 8.06±0.24d Total fibers 10.20±0.01a 17.29±0.05b 19.28±0.11bc 22.27±0.17d 26.26±0.23e
Total carbohydrates 65.40±1.05a 61.21±0.38ab 60.03±0.80bc 58.16±1.24cd 55.35±1.67d Gluten analysis
Wet gluten 28.20±0.03a 26.79±0.02b 25.38±0.02c 23.97±0.02d 22.56±0.03e Gluten Index 86.86±0.08a 82.51±0.07b 78.17±0.07c 73.84±0.06d 69.48±0.06e
Dry gluten 12.48±0.02a 11.86±0.02b 11.23±0.01c 10.61±0.03d 9.98±0.02e Color parameters
L* 95.34±0.04a 93.69±0.03b 92.04±0.03c 90.40±0.04d 88.75±0.03e a* -0.74±0.02a -0.36±0.02b 1.20±0.01c 4.38±0.02d 6.75±0.01e b* 12.78±0.04a 16.27±0.03b 19.67±0.02c 23.27±0.03d 26.76±0.03e
Chemical composition and gluten analysis were expressed as %. Values given are the means of three replicates ± standard deviation. Different letters within the same row indicate significant differences (one- way ANOVA and Duncan test, p< 0.05). Table 1 lists CIELAB color parameters (L*, a*, and b*) for different wheat flour samples incorporated with ITF, indicating the considerable impact of ITF incorporation on these parameters. Briefly, the lightness value (L*) of the whole-wheat flour was 95.34, which drastically dropped to 88.75 for the highest ITF content (10 %). Nevertheless, a* value for the whole wheat flour sample was -0.74, which increased significantly, about 4 to 9 times after ITF incorporation with the highest value of 6.75 for the sample with the highest ITF amount. The yellowness parameter (+b*) increased significantly as ITF amount increased. The increase in color values a* and b* in wheat flour samples could be attributed to the

Ital. J. Food Sci., vol. 31, 2019 - 7
creation of more surface areas that possibly increase color intensity as reported by AHMED and AL-ATTAR (2015). 3.2. Rheological properties of formulated wheat dough 3.2.1 Flow behavior All formulated dough samples enriched with ITF exhibited non-Newtonian behavior at shear rates from 0.001 to 1000 s-1 at 20°C (Fig. 1).
A
B
Shear rate (1/s)
0 200 400 600 800 1000 1200
Shea
r stre
ss (P
a)
0
500
1000
1500
2000
2500
10 % ITF7.5 % ITF5 % ITF2.5 % ITFControl
Shear rate (1/s)
0 200 400 600 800 1000 1200
Shea
r stre
ss (P
a)
0
500
1000
1500
2000
2500
Control10 % ITF

Ital. J. Food Sci., vol. 31, 2019 - 8
C
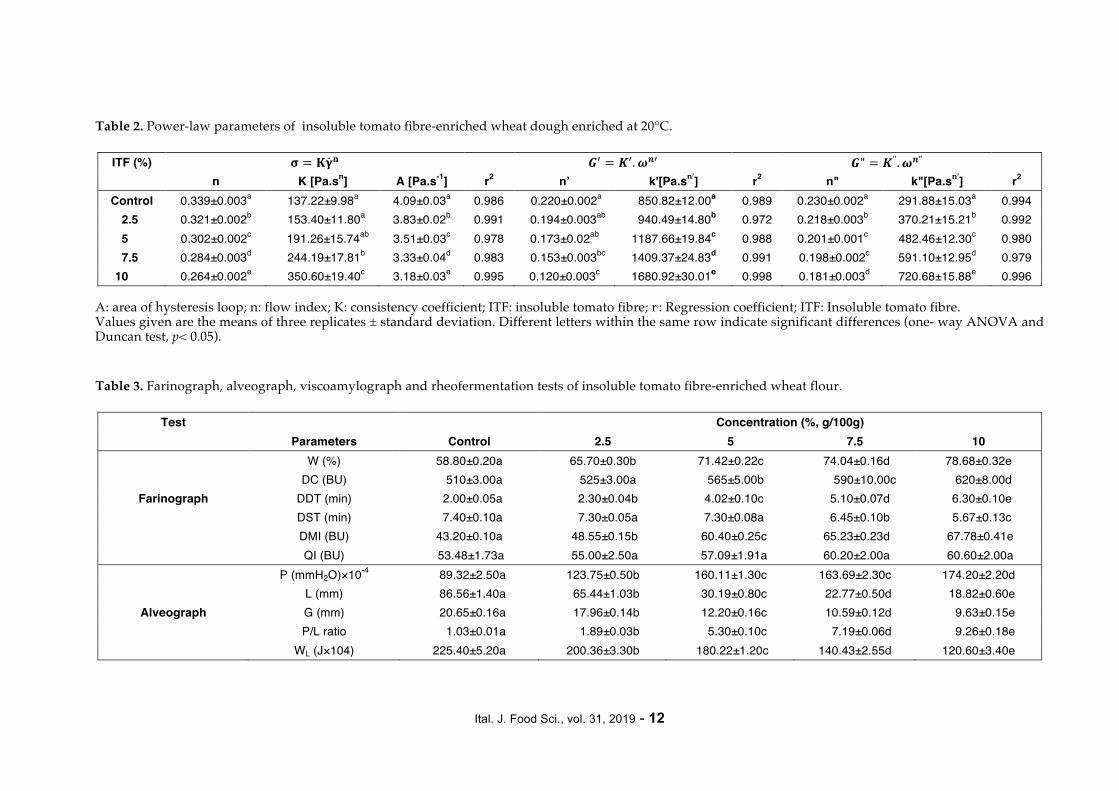
D Figure 1. Shear stress versus shear rate (A). Flow curves with a controlled shear rate measured by increasing (forward measurements) and decreasing shear rate (backward measurements) (B). Variation of storage (C) and loss modulus (D) with angular frequency (ω) for insoluble tomato fibre-enriched wheat dough at 20°C. There is a nonlinear relationship between shear stress (σ) and shear rate (γ), which is in good agreement with the findings of GUADARAMA-LEZAM et al. (2016). The power-law and Herschel-Bulkley models were used to characterize the flow curves of the formulated dough samples. Based on the regression coefficient values (R2), the power-law was found to be a better-fit model for flow curves (R2> 0.99), and only the rheological parameters of this model were determined in this study (Table 2). Furthermore, flow behavior index values (n), at different ITF amounts, were in the range of 0.339-0.264 and significant differences between all wheat dough samples (p<0.05) were noted. Indeed, the flow plot of the shear stress against shear rate of the investigated dough showed a flow index (n) less than 1 (thinning fluid), indicating that the flow behavior of the examined samples can be described by following a non- Newtonian profile. Consequently, all values are less than 1, which further confirms the pseudoplastic behavior of the whole ITF-enriched dough.
Angular Frequency (rad/s)
0,1 1 10 100 1000
Elas
tic m
odulu
s G
' (Pa
)
100
1000
10000
10 % ITF7.5 % ITF5 % ITF2.5 % ITFControl
Angular frequency (rad/s)
0,1 1 10 100 1000
Visc
ous m
odulu
s G' (P
a)
100
1000
10000
10 % TIF7.5 % TIF5 % TIF2.5 % TIFControl

Ital. J. Food Sci., vol. 31, 2019 - 9
The obtained results also showed that the flow index (n) decreased with the increase in ITF concentration. Actually, the consistency coefficient (K) indicates the viscous nature of a matter. Yet, the consistency values (K) of the whole-wheat flour suspension within the studied concentration domain were in the range of 137.22-350.60 Pa·sn. The higher consistency values of the formulated dough resulted from the antiplasticizing effect of sugars against water. Another reason for the non-Newtonian pseudoplastic flow behavior of samples emanates from the presence of high-molecular-weight macromolecules as fibers, gluten, sugars and starch. MARTINEZ et al. (2014) have confirmed that the addition of insoluble fibers increases dough consistency due to the insoluble fibers’ effect on the internal structure of wheat doughs. Figure 1B shows the flow curves of control and wheat dough at 10 % of ITF. Shear stress measurements at increasing and decreasing shear rates from 0.001 to 1000 s-1 gave hysteresis loops. The hysteresis area (A) was determined and illustrated in Table 2, confirming that its values decreased with the increase in ITF concentration. However, significant variations with ITF concentration exist in all tested samples (p<0.05). The hysteresis loops indicate a time dependency of the wheat dough rheological properties. This thixotropic behavior is observed with concentrated suspensions and macromolecular solutions due to structural breakdown happening in the specimen during the rheological test. 3.2.2 Viscoelastic behavior The oscillatory spectra of the formulated dough samples displayed viscoelastic properties (Figs. C-D). The characteristic slopes of the double-logarithmic plots of the storage and loss modulus (G’ and G”) vs angular frequency were quite similar. In this case, the elastic modulus was significantly high and different from the viscous one throughout the covered frequency range. All examined dough samples exhibited higher storage modulus (G’) values than those of G”, thus confirming the elastic behavior of the dough samples and indicating that both moduli values increased with the increase of the angular frequency and ITF concentration. These results are comparable with those found by AHMED et al. (2013), GUADARRAMA-LEZAMA et al. (2016), who have proven that wheat dough was characterized by a solid-like behavior. Indeed, they suggested that the increase of mechanical properties is due to limited plasticization effect and the presence of fiber nanoparticles. The experimental data was fitted with power-law models, described as follows: 𝐺!(𝜔) = 𝐾!.𝜔!! (3) 𝐺"(𝜔) = 𝐾".𝜔!" (4) Where G’ is an elastic modulus (Pa), G” is a loss modulus (Pa), ω is an angular frequency (rad/s), and k’, k”, n’ and n” are the experimental constants. Table 2 presents the power-law parameters of the elastic and viscous moduli (k’ and k”) of the tested samples undergoing an increase with the increase of ITF concentration. In all cases, the k’ values were higher than those of k”, and increased significantly with the rise in the ITF level in the wheat dough, (from 850.82 to 1680.92 and from 291.88 to 720.68 Pa, respectively). In the same vein, BENGTSSON et al. (2011) found that the ITF increase led to the increase of G’ and G”. Thus, the highest k’ and k’’ values were observed for dough sample with 10 % of ITF. The exponents n’ and n” were then found to decrease from 0.22 to 0.12 and from 0.23 to 0.181, respectively. Besides, no significant variations in exponent values at high levels of ITF (p>0.05) were noticed.

Ital. J. Food Sci., vol. 31, 2019 - 10
3.2.3 Farinograph properties The use of elevated ITF concentration in the wheat flour increased significantly the Farinograph water absorption (WA), dough consistency (DC) and dough development time (DDT) (p<0.05) (Table 2). While the increase in WA may be due to the presence of protein, fiber and resistant starch contents, the increase in the DDT showed a delay in the hydration and gluten development in the presence of these macromolecules. Obviously, variations in WA depend on the protein content, the chemical structure and porosity of ITF, the association between molecules and the particle sizes (THEBAUDIN et al., 1997). Recently, WANG et al. (2002) have demonstrated that the variations in WA is mainly attributed to the greater number of hydroxyl group existing in the fiber structure, allowing more water interaction through hydrogen bonding. These results are in accordance with those found in the literature (MIS et al., 2012; AHMED et al., 2013). Dough stability time is an indicator of the flour strength, with higher values, indicating stronger doughs, which shows that the different ITF amounts modify the DDT (p<0.05). The use of ITF improved significantly the dough stability compared with control flour (p< 0.05), which could be explained by higher interactions among ITF, water and gluten. Furthermore, mixing dough could release water to the dough matrix, causing a quick reduction in dough consistency, and therefore a reduction in DDT (MAJZOOBI et al., 2011). The mixing tolerance index (MTI) of ITF-enriched dough decreased considerably, with the increase in concentration from 0 to 10 % of ITF. Table 3 shows that control and wheat dough enriched with 2.5 % of ITF has a better dough mixing tolerance with a lower value than the other samples. The increase in mixing tolerance index upon ITF addition is probably due to the dilution of gluten protein with the fibers, which may be explicated by the interaction between fiber and gluten influencing the dough mixing properties (AHMED et al., 2013). However, quality index (QI) insignificantly increased from 53.48 to 60.60 BU by the ITF addition as a function of increasing rate substitution (p>0.05). AHMED et al. (2013) suggested that the quality index increase emanates from the interaction between gluten and fiber. 3.2.4 Alveographic properties Table 3 lists the alveographic parameters of dough with and without ITF, proving that its incorporation caused an increase in the tenacity (P) and decrease in the extensibility (L), and consequently in the swelling index (G) of the formulated wheat dough (p<0.05). After the ITF addition, the configuration curve ratio (P/L) increased and the alveograph strength decreased. This may be due, at least partly, to the reduction in the gluten content caused by the presence of other components, as proteins, fibers, lipids and non-gluten-forming proteins, which interfere with gluten formation. It can be concluded that the protein existing in the ITF might have instigated partial disruption of the gluten network, causing change in the equilibrium of elasticity and extensibility properties of the whole wheat flour dough. The obtained results also corroborated significant differences between control and ITF-enriched dough in term of the deformation energy (W) (p < 0.05). These results are clearly in conformity with those obtained by BOUBAKER et al. (2016). Yet, many studies, as WANG et al. (2002), reported that commercial fibers' incorporation greatly improved the development of wheat protein behavior. They also stated that the fibres 'incorporation induced a decrease of the proteolytic degradation, being practically neutralized by inulin.

Ital. J. Food Sci., vol. 31, 2019 - 11
3.2.5 Visco-amylograph properties To determine the ITF incorporation effect on wheat flour-water interaction in cookies dough, a rapid viscoanaylzer (RVA) was used, revealing that ITF significantly diminished the pasting viscosities (peak, breakdown, final, and setback viscosities) (p<0.05). Similarly, the values of the peak paste viscosity of the formulated dough decreased significantly from 1285.56 to 450.44 cP, which was explained probably by their association with high protein amount. Thus, the tomato protein is estimated to form complexes with starch granule surface, preventing the release of exudates and lowering the peak viscosity. However, the pasting temperature increased from 86.20 to 90.75°C in flour blends (p<0.05), which, according to Martinez et al. (2014), might be related to delay or restricted starch swelling. Actually, the amylose leaching and lower pasting viscosities are indications of reduced starch available for gelatinization. Therefore, the ITF addition is proven to significantly diminish the degree of breakdown from 0.60 (control) to 0.25 (flour at 10 % of TIF), showing increased resistance of the swollen starch granule to rupture after cooking as reported by SOZER et al. (2014). 3.3. Fermentation parameters The fermentation parameters of the ITF-enriched wheat dough were assessed by the rheofermentometer, Table 3. The maximum dough height (Hm) decreased dramatically from 69.17 to 30.84 mm, with the ITF addition, regardless of its concentration (p<0.05). However, no significant difference between samples containing 7.5 and 10 % of ITF (p> 0.05) was observed. Similar results were obtained by MARTINEZ et al. (2014) and LIU et al. (2017) who discovered that the addition of insoluble fibers led to the decrease of the maximum dough height. Nevertheless, the time required to reach the maximum dough height decreased from 2.95 to 1.30 h with the increase in ITF concentration (p<0.05), demonstrating substantial differences in the time of reaching the maximum height between wheat flour samples. Besides, the CO2 production, retention and loss volumes were also determined. Indeed, although the ITF incorporation decreased the CO2
production and retention volumes, it increased its loss volume (p<0.05). These results accord well with those found by MARTINEZ et al. (2014), who added different fibers to the wheat flour, proving that the influence differs with the type of fiber used. They suggested that insoluble fibers with larger particles can create points to split the structure, thus enabling gas to escape, affirming the assumption that ITF incorporation to wheat flour decreased gas holding capacity. However, CORREA et al. (2014) have hypothesized that the addition of hydrocolloids could form hydrophilic complexes with protein or starch, which further changed the viscoelasticity and influenced the fermentation character. 3.4. Properties of formulated cookies 3.4.1 Physical properties Table 4 summarizes the physical parameters of the analyzed cookies by substituting wheat flour with ITF from 0 to 10% levels. As the ITF concentration increased, the diameter of cookies (D) decreased from 53.94 to 51.83 mm, but no significant variations were found between cookies with 5 and 7.5 % of ITF. The thickness of cookies (E) increased, confirming the dilution of gluten as reported by AJILA et al. (2008). The differences in diameter and thickness are revealed in the spread ratio (D/E), consistently decreasing from 5.17 to 4.02 with ITF levels increase (p<0.05).
Ital. J. Food Sci., vol. 31, 2019 - 12
Table 2. Power-law parameters of insoluble tomato fibre-enriched wheat dough enriched at 20°C.
ITF (%) 𝛔 = 𝐊𝛄𝐧 𝑮! = 𝑲!.𝝎𝒏! 𝑮" = 𝑲".𝝎𝒏" n K [Pa.sn] A [Pa.s-1] r2 n’ k'[Pa.sn’] r2 n" k"[Pa.sn’] r2 Control 0.339±0.003a 137.22±9.98a 4.09±0.03a 0.986 0.220±0.002a 850.82±12.00a 0.989 0.230±0.002a 291.88±15.03a 0.994
2.5 0.321±0.002b 153.40±11.80a 3.83±0.02b 0.991 0.194±0.003ab 940.49±14.80b 0.972 0.218±0.003b 370.21±15.21b 0.992 5 0.302±0.002c 191.26±15.74ab 3.51±0.03c 0.978 0.173±0.02ab 1187.66±19.84c 0.988 0.201±0.001c 482.46±12.30c 0.980 7.5 0.284±0.003d 244.19±17.81b 3.33±0.04d 0.983 0.153±0.003bc 1409.37±24.83d 0.991 0.198±0.002c 591.10±12.95d 0.979 10 0.264±0.002e 350.60±19.40c 3.18±0.03e 0.995 0.120±0.003c 1680.92±30.01e 0.998 0.181±0.003d 720.68±15.88e 0.996
A: area of hysteresis loop; n: flow index; K: consistency coefficient; ITF: insoluble tomato fibre; r2: Regression coefficient; ITF: Insoluble tomato fibre. Values given are the means of three replicates ± standard deviation. Different letters within the same row indicate significant differences (one- way ANOVA and Duncan test, p< 0.05). Table 3. Farinograph, alveograph, viscoamylograph and rheofermentation tests of insoluble tomato fibre-enriched wheat flour.
Test Concentration (%, g/100g) Parameters Control 2.5 5 7.5 10 W (%) 58.80±0.20a 65.70±0.30b 71.42±0.22c 74.04±0.16d 78.68±0.32e DC (BU) 510±3.00a 525±3.00a 565±5.00b 590±10.00c 620±8.00d
Farinograph DDT (min) 2.00±0.05a 2.30±0.04b 4.02±0.10c 5.10±0.07d 6.30±0.10e DST (min) 7.40±0.10a 7.30±0.05a 7.30±0.08a 6.45±0.10b 5.67±0.13c DMI (BU) 43.20±0.10a 48.55±0.15b 60.40±0.25c 65.23±0.23d 67.78±0.41e QI (BU) 53.48±1.73a 55.00±2.50a 57.09±1.91a 60.20±2.00a 60.60±2.00a P (mmH2O)×10-4 89.32±2.50a 123.75±0.50b 160.11±1.30c 163.69±2.30c 174.20±2.20d L (mm) 86.56±1.40a 65.44±1.03b 30.19±0.80c 22.77±0.50d 18.82±0.60e
Alveograph G (mm) 20.65±0.16a 17.96±0.14b 12.20±0.16c 10.59±0.12d 9.63±0.15e P/L ratio 1.03±0.01a 1.89±0.03b 5.30±0.10c 7.19±0.06d 9.26±0.18e WL (J×104) 225.40±5.20a 200.36±3.30b 180.22±1.20c 140.43±2.55d 120.60±3.40e

Ital. J. Food Sci., vol. 31, 2019 - 13
PV (cP) 1285.56±5.70a 1179.25±4.80a 813.60±4.81b 550.02±2.98c 450.44±5.56d HPV (cP) 771.34±3.66a 553.33±4.67b 341.71±2.80c 154.00±3.02d 112.61±1.80e
Viscoamylograph FV (cP) 1421.63±7.70a 1149.11±9.89b 842.91±6.09c 605.81±5.90d 514.11±3.89e SV (cP) 650.30±4.04a 595.78±5.22b 500.20±3.29c 451.81±2.90d 401.50±5.69e PT (°C) 86.20±0.02a 87.36±0.06b 87.93±0.04c 88.46±0.06d 90.75±0.05e BD 0.60±0.00a 0.49±0.00b 0.42±0.00c 0.28±0.00d 0.25±0.00e Hm (mm) 69.17±2.33a 41.23±1.23b 36.89±0.50c 32.76±1.01d 30.84±1.02d T1 (h) 2.95±0.05a 2.52±0.03b 1.83±0.02c 1.47±0.03d 1.30±0.03e
Rheoermentator VT (mL) 1720.27±19.73a 1680.60±14.40ab 1651.04±14.96bc 1644.3±11.93bc 1610.30±7.85c VR (mL) 1440.06±25.10a 1372.82±18.00ab 1314.10±24.95b 1234.28±15.89c 1144.45±13.70d VL (mL) 280.21±1.27a 307.78±1.40b 336.94±4.95c 410.09±3.97d 465.70±5.85e
ITF: insoluble tomato fibre; W: water absorption; DC: Dough consistency; DDT: dough development time; DST: dough stability time; DS: degree of softening; QI: Quality index; P: tenacity (mmH2O); L: dough extensibility; G: swelling index; P/L: configuration curve ratio; WL: deformation energy; PV: pasting viscosity; HPV: hot pasting viscosity; FV: final viscosity; SV: setback viscosity; PT: pasting temperature; DB: degree of breakdown; VT: total volume of dioxide carbon; VR: retention volume of carbon dioxide; VL: loss volume of carbon dioxide. Values given are the means of three replicates ± standard deviation. Different letters within the same row indicate significant differences (one- way ANOVA and Duncan test, p< 0.05). Table 4. Physical, colour, textural and biochemical parameters of insoluble tomato fibre-enriched cookies.
ITF concentration (g/100 g) Parameters Control 2.5 5 7.5 10
Physical parameters Diameter (mm) 53.94±0.06a 53.17±0.03b 52.20±0.10c 52.06±0.06c 51.83±0.03d Thickness (mm) 10.43±0.17a 11.24±0.15b 11.67±0.25c 12.22±0.25c 12.91±0.15d
Spread ratio 5.17±0.08a 4.73±0.06b 4.47±0.10bc 4.26±0.09cd 4.02±0.04d Color parameters
L* 75.79±0.09a 70.51±0.06b 66.17±0.03c 63.64±0.05d 62.36±0.04e a* 3.22±0.01a 3.94±0.01b 4.17±0.02c 4.91±0.01d 5.43±0.02e b* 27.72±0.03a 31.45±0.05b 35.58±0.02c 38.76±0.03d 39.68±0.01e
Ital. J. Food Sci., vol. 31, 2019 - 14
Textural parameters Breaking strength (N) 19.88±0.11a 20.94±0.06b 24.47±0.04c 28.06±0.06d 33.47±0.05e
Fracturability (mm) 0.32±0.02a 0.45±0.02b 0.56±0.02c 0.59±0.02cd 0.63±0.01d Biochemical parameters
Total polyphenol content (mg GAE/100) 86.98±2.58a 189.50±7.50b 239.51±3.50c 305.00±10.03d 376.02±6.02e ABTS (mg/mL) 2.40±0.03a 1.84±0.04b 1.34±0.01c 1.13±0.02d 0.89±0.03e DPPH (mg/mL) 181.00±7.00a 91.03±8.04b 14.47±0.07c 9.10±0.10c 3.32±0.05c FRAP (mg/mL) 35.89±2.34a 16.62±2.12b 6.62±0.03c 1.95±0.05cd 0.78±0.04d
ABTS, DPPH, and FRAP were expressed as inhibitory concentration at 50 % (IC50). Values given are the means of three replicates ± standard deviation. Different letters within the same row indicate significant differences (one- way ANOVA and Duncan test, p< 0.05).

Ital. J. Food Sci., vol. 31, 2019 - 15
However, the decrease in the spread ratio of ITF-fortified cookies is probably attributed both to the fact that the composite flour increased water absorption, and the absence of free water in the cookie dough. SHARMA et al. (2016) mentioned that the decrease in the spread ratio of germinated flour blend cookies may be due to the enzymatic degradation of the starch and protein into smaller sugars and peptides, resulting in the increase of hydrophilic nature within cookies. Table 4 shows that cookies became darker (lower L* values), more reddish (higher a* values) and more yellowish (higher b* values) than control cookies with the increase in ITF amount. The lightness (L) also decreased proportionally with the increase of the ITF amount, reflecting the darkening of the cookies. This color change was confirmed by cookies photos (Fig. 2). The decrease of lightness is probably due to the high protein and free sugar contents may accelerate the Maillard reaction and therefore change the color of the products. As suggested by MILDNER-SZKUDLARZ et al. (2013), cookies color depends mainly on their ingredients because the temperature is not high enough for Maillard and caramelization reactions. The ITF’s color values may affect the color of cookies’ crust. The 10 % level of ITF presented more yellowish crust color than control cookies (Fig. 2).
Figure 2. Photos of formulated cookies at different levels of insoluble tomato fibre. The breaking strength values of formulated cookies with different ITF concentration are illustrated in Table 4, which reveals that the breaking force value increased with the increase in ITF concentration ranging from 19.88 to 34.47 N. Meanwhile, the results showed that there are significant variations in cookies' hardness among all cookies samples (p<0.05) (Table 4). The increase in breaking force may be due to the increase in cookies thickness, which gives physical strength to the cookies structure. Yet, higher positive correlation was found between ITF concentration and breaking strength (r = 0.965, p<0.05), which is in perfect accordance with the study of NASIR et al. (2010) who found a positive correlation between the concentration of vegetable flours and cereal foods. Besides, the results showed that the ITF incorporation decreased the cookies' fracturabilities (p<0.05), revealing a negative correlation between thickness and fracturability of the formulated cookies (r=-0.96, p<0.05). 3.4.2 Total polyphenols and antioxidant activities of cookies The results of the total polyphenol content and antioxidant activities are shown in Table 4. The total polyphenol content of cookies, with 2.5 to 10 % ITF, increased significantly compared to the control cookies, i.e., it increased in parallel with ITF supplementation level. While highly negative correlation was found between lightness (L*) parameter and the total polyphenol content (r =-0.977, p< 0.01), positive correlations between a* and b*

Ital. J. Food Sci., vol. 31, 2019 - 16
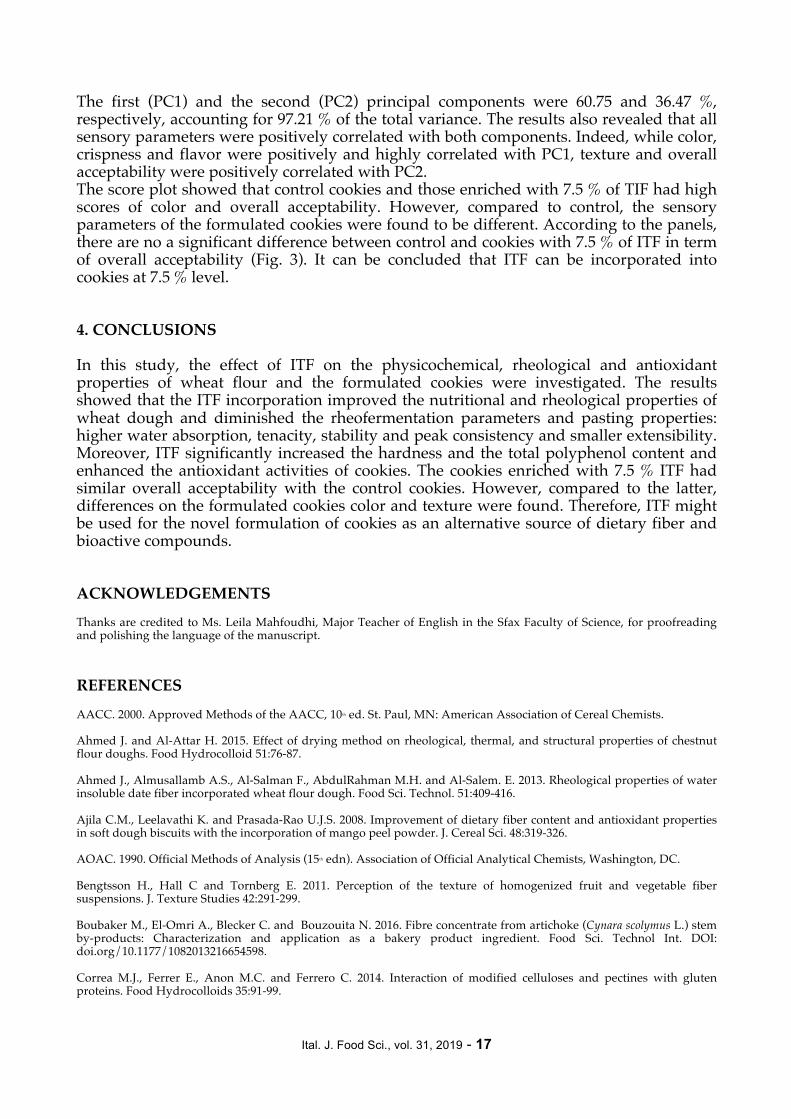
parameters and total polyphenol content of cookies (r=0.994, p<0.01and r=0.982, p<0.01, respectively). To characterize the antioxidant potential of the formulated ITF-enriched cookies, DPPH, FRAP and ABTS radical scavenging activities were determined, Table 4. Actually, all IC50values of antioxidant tests decreased with the ITF increase, and significant differences between all cookies samples were found (p<0.05). Comparing the activities, the highest one was ABTS followed by those of FRAP and DPPH, whose relationship with the Maillard reaction products (e.g., color parameters) was identified by a multivariate analysis to find the possible correlations among measured variables. High correlations were found between the total polyphenol content and antioxidant activities (IC50) (r =-0.982 (ABTS); r=-0.919 (DPPH); r=-0.940 (FRAP), p< 0.01). Correlations between antioxidant activities (IC50) and lightness (L*) (r =-0.998 (ABTS); r=-0.977 (DPPH); r=-0.985 (FRAP), p< 0.01) were also detected. This implies that the amount and type of polyphenolic substances in cookies are variable, depending mainly on the ITF incorporation level. The baking can further increase the antioxidant activities, and the formation of dark color pigment due to Maillard browning during baking process can increase the antioxidant properties of the cookies. These findings were confirmed with the high correlations between the lightness and inhibitory concentrations (IC50), which are similar to those obtained by MICHALSKA et al. (2008). The latter indicated that Maillard reaction products possess cookies' antioxidant activities at elevated temperature, which are in turn in good agreement with the studies of MISAN et al. (2011) and AGILA et al. (2008). At a 10 % ITF incorporation, the content of polyphenols were 4 times higher than control cookies. 3.4.3 Sensory evaluation The score results of sensory evaluation of the tested cookies are illustrated in Fig. 3.
Figure 3. Principal component analysis plot of data from sensory evaluation of insoluble tomato fibre-enriched cookies. ● ITF concentration; ■ Sensory parameters
Control
2.5 % ITF 5 % ITF
7.5 % ITF
10 % ITF ColorFlavour
Texture Overallacceptabili
ty
Crispness
-3
-2
-1
0
1
2
3
4
-5 -4 -3 -2 -1 0 1 2 3 4 5
F2(3
6,47%)
F1(60,75%)
Biplot(axesF1andF2:97,21%)
Ital. J. Food Sci., vol. 31, 2019 - 17
The first (PC1) and the second (PC2) principal components were 60.75 and 36.47 %, respectively, accounting for 97.21 % of the total variance. The results also revealed that all sensory parameters were positively correlated with both components. Indeed, while color, crispness and flavor were positively and highly correlated with PC1, texture and overall acceptability were positively correlated with PC2. The score plot showed that control cookies and those enriched with 7.5 % of TIF had high scores of color and overall acceptability. However, compared to control, the sensory parameters of the formulated cookies were found to be different. According to the panels, there are no a significant difference between control and cookies with 7.5 % of ITF in term of overall acceptability (Fig. 3). It can be concluded that ITF can be incorporated into cookies at 7.5 % level. 4. CONCLUSIONS In this study, the effect of ITF on the physicochemical, rheological and antioxidant properties of wheat flour and the formulated cookies were investigated. The results showed that the ITF incorporation improved the nutritional and rheological properties of wheat dough and diminished the rheofermentation parameters and pasting properties: higher water absorption, tenacity, stability and peak consistency and smaller extensibility. Moreover, ITF significantly increased the hardness and the total polyphenol content and enhanced the antioxidant activities of cookies. The cookies enriched with 7.5 % ITF had similar overall acceptability with the control cookies. However, compared to the latter, differences on the formulated cookies color and texture were found. Therefore, ITF might be used for the novel formulation of cookies as an alternative source of dietary fiber and bioactive compounds. ACKNOWLEDGEMENTS Thanks are credited to Ms. Leila Mahfoudhi, Major Teacher of English in the Sfax Faculty of Science, for proofreading and polishing the language of the manuscript. REFERENCES AACC. 2000. Approved Methods of the AACC, 10th ed. St. Paul, MN: American Association of Cereal Chemists. Ahmed J. and Al-Attar H. 2015. Effect of drying method on rheological, thermal, and structural properties of chestnut flour doughs. Food Hydrocolloid 51:76-87. Ahmed J., Almusallamb A.S., Al-Salman F., AbdulRahman M.H. and Al-Salem. E. 2013. Rheological properties of water insoluble date fiber incorporated wheat flour dough. Food Sci. Technol. 51:409-416. Ajila C.M., Leelavathi K. and Prasada-Rao U.J.S. 2008. Improvement of dietary fiber content and antioxidant properties in soft dough biscuits with the incorporation of mango peel powder. J. Cereal Sci. 48:319-326. AOAC. 1990. Official Methods of Analysis (15th edn). Association of Official Analytical Chemists, Washington, DC. Bengtsson H., Hall C and Tornberg E. 2011. Perception of the texture of homogenized fruit and vegetable fiber suspensions. J. Texture Studies 42:291-299. Boubaker M., El-Omri A., Blecker C. and Bouzouita N. 2016. Fibre concentrate from artichoke (Cynara scolymus L.) stem by-products: Characterization and application as a bakery product ingredient. Food Sci. Technol Int. DOI: doi.org/10.1177/1082013216654598. Correa M.J., Ferrer E., Anon M.C. and Ferrero C. 2014. Interaction of modified celluloses and pectines with gluten proteins. Food Hydrocolloids 35:91-99.

Ital. J. Food Sci., vol. 31, 2019 - 18
García Herrera P., Sánchez-Mata M.C. and Cámara M. 2010. Nutritional characterization of tomato fiber as a useful ingredient for food industry. Innov. Food Sci. Emerg. Technol. 11:707-711. Guadarrama-Lezama A.Y., Carillo-Navas H., Vernon-Carter E.J. and Alverez-Ramirez J. 2016. Rheological and thermal properties of dough and textural and microstructural features of bread obtained from nixtamalized corn/ wheat flour blens. J. Cereal Sci. 69:158-165. Hua X., Xu S., Wang M., Chen Y., Yang H. and Yang R. 2017. Effects of high-speed homogenization and high-pressure homogenization on structure of tomato residue fibers. Food Chem. 232:443-449. Ismail T., Akhtar S., Riaz M. and Ismail A. 2014. Effect of pomegranate peel supplementation on nutritional, organoleptic and stability properties of cookies. Int. J. Food Sci. Nutr. 65:661-666. Kaur D., Wani A.A., Oberoi D.P.S. and Sogi D. S.2008. Effect of extraction conditions on lycopene extractions from tomato processing waste skin using response surface methodology. Food Chem. 108:711-718. Liu X., Mu T., Yamul K.D., Sun H., Zhang M., Chen J., Fauconner M.L. and Andrea P.V. 2017. Evaluation of different hydrocolloids to improve dough rheological properties and bread quality of potato-wheat flour. J. Food Sci. Technol. DOI:doi.org/10.1007/s13197-017-2591-y. Majzoobi M., Sariri Ghavi F., Farahnaky A., Jamalian J. and Mesbahi G. 2011. Effect of tomato pomace powder on the physicochemical properties of flat bread (Barbari Bread). J. Food Process. Preserv. 35:247-256. Martinez M.M., Diaz A. and Gomez M. 2014. Effect of different microstructural features of soluble and insoluble fibres on gluten-free dough rheology and bread-making. J. Food Eng. 142:49-56. Mildner-Szkudlarz S., Bajerska J., Zawirska-Wojtasiak R. and Gorecka D. 2013. White grape pomace as a source of dietary fibre and polyphenols and its effect on physical and nutraceutical characteristics of wheat biscuits. J. Sci. Food. Agric. 93:389-395. Mis A. 2011. Interpretation of mechanical spectra of carob fibre and oat wholemeal-enriched wheat dough using non-linear regressions models. J. Food Eng. 102:369-379. Misan A., Mimica-Dukic N., Sakac M., Mandic A., Sedej I., Simurina O. and Tumbas, V. 2011. Antioxidant activity of medicinal plant extract in cookies. J. Food Sci. 76:C1239-C1244. Nasir M., Siddiq M., Ravi R., HarteJ B., Dolan K.D. and Butt. M.S. 2008. Physical quality characteristics and sensory evaluation of cookies made with added defatted maize germ flour. J. Food Qual. 33:72-84. Navarro-González I., García-Valverde V., García-Alonso H. and Periago, M. J. 2011. Chemical profile, functional and antioxidant properties of tomato peel fiber. Food Res. Int. 44:1528-1535. Passos C.P., Kukurova K., Basil E., Fernandes, P.A.R. Nto A. and Nunes F.M. 2017. Instant coffee as a source of antioxidant-rich and sugar-free coloured compounds for use in bakery: Application in biscuits. Food Chem. 231:114-121. Prosky L., Asp Nils Georg Scheizer F.T., DeVries W.J. and Fruda I. 1998. Determination of insoluble, soluble, and total dietary fiber in food products: Interlaboratory study. J AOAC. 71:1071-1023. Sharma S., Saxena D.C. and Riar C.S.2016. Nutritional, sensory and in vitro antioxidant characteristics of gluten free cookies prepared from flour blends of minor millets. J. Cereal Sci. 72:153-161. Slavin J. 2013. Fiber and prebiotics: Mechanism and health benefits: A review. Nutrients. 5:1417-1435. Sumczynski D., Bubelova Z. and Fisera M. 2015. Determination of chemical, insoluble dietary fibre, neutral-detergent fibre and in vitro digestibility in rice types commercialized in Czech markets. J. Food Compos. Anal. 40:8-13. Sozer N., Cicerelli L., Heinio R.L. and Poutanen K.2014. Effect of wheat bran addition on in vitro starch digestibility, physicochemical and sensory properties of biscuits. J. Cereal Sci. 64:1-9. Thebaudin J.Y., Lefebvre A.C., Harrington M., Bourgeois C.M. 1997. Dietary fibers: nutritional and technological interest. Trends Food Sci. Technol. 8(2):41-48. Wang J.S., Rosell C.M. and de Barber C.B. 2002. Effect of the addition of different fibers on wheat dough performance and bread quality. Food Chem. 79(2):221-226.
Paper Received March 26, 2018 Accepted August 20, 2018