Insights US Agency mortgage- backed securities (MBS) Agency Mortgage Backed...ftserussell.com 2 A...
24
Insights US Agency mortgage- backed securities (MBS) A foreign investor’s perspective ftserussell.com November 2019 US Mortgage-backed securities market Introduction and overview Generally speaking, a mortgage is a loan made to a household or firm to finance the purchase of a home, land or any other real estate, and conceptually has existed for centuries. The process of transforming these individual loans into marketable securities is called securitization (also viewed by market participants as a form of transformation of illiquid assets into liquid securities) and involves a number of institutions. For example, Bank A originates mortgage loans to borrowers, including underwriting, funding and servicing. These US residential mortgages are then bought by Freddie Mac (Agency), which bundles them into a pool and sells them to a “bankruptcy-remote” special-purpose vehicle (SPV). The SPV issues MBS backed by this pool of loans and sells them to pension funds, asset managers and other investors. Executive summary The objective of this paper is to explore the US mortgage-backed securities market from the perspective of a foreign investor. We pay particular attention to the US Agency MBS segment, owing to its size, liquidity, return and risk characteristics. First, we focus on the key defining feature of MBS, prepayment optionality, and what it means for investors. Second, we review other important characteristics of US Agency MBS, including their performance versus other asset classes, and the role MBS can play in the construction of fixed-income and multi-asset portfolios. Third, we examine the ownership structure of US Agency MBS to assess the role of foreign investors in this market, its evolution and current trends. Finally, we seek to explain why foreign investors hold a relatively small share of the US Agency MBS market (15%) compared to domestic investors.
Transcript of Insights US Agency mortgage- backed securities (MBS) Agency Mortgage Backed...ftserussell.com 2 A...
Insights
US Agency mortgage- backed securities (MBS) A foreign investor’s perspective
ftserussell.com November 2019
US Mortgage-backed securities market Introduction and overview
Generally speaking, a mortgage is a loan made to a household or firm to finance
the purchase of a home, land or any other real estate, and conceptually has
existed for centuries. The process of transforming these individual loans into
marketable securities is called securitization (also viewed by market participants
as a form of transformation of illiquid assets into liquid securities) and involves a
number of institutions.
For example, Bank A originates mortgage loans to borrowers, including
underwriting, funding and servicing. These US residential mortgages are then
bought by Freddie Mac (Agency), which bundles them into a pool and sells
them to a “bankruptcy-remote” special-purpose vehicle (SPV). The SPV
issues MBS backed by this pool of loans and sells them to pension funds,
asset managers and other investors.
Executive summary The objective of this paper is to explore the US mortgage-backed securities
market from the perspective of a foreign investor. We pay particular attention to
the US Agency MBS segment, owing to its size, liquidity, return and risk
characteristics.
First, we focus on the key defining feature of MBS, prepayment optionality,
and what it means for investors. Second, we review other important
characteristics of US Agency MBS, including their performance versus other
asset classes, and the role MBS can play in the construction of fixed-income
and multi-asset portfolios.
Third, we examine the ownership structure of US Agency MBS to assess the
role of foreign investors in this market, its evolution and current trends. Finally,
we seek to explain why foreign investors hold a relatively small share of the US
Agency MBS market (15%) compared to domestic investors.
ftserussell.com 2
A mortgage-backed security is an instrument that represents an ownership in a
pool of mortgages and, more importantly, where cashflows depend on the
underlying pool of mortgages.
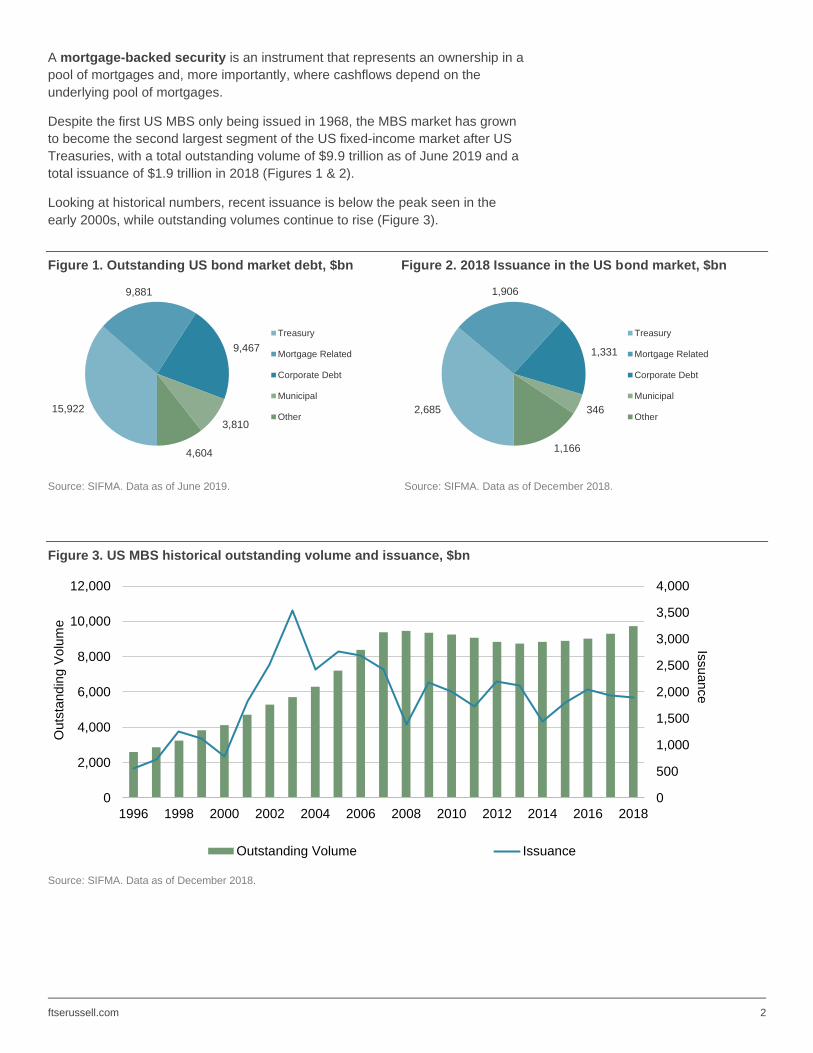
Despite the first US MBS only being issued in 1968, the MBS market has grown
to become the second largest segment of the US fixed-income market after US
Treasuries, with a total outstanding volume of $9.9 trillion as of June 2019 and a
total issuance of $1.9 trillion in 2018 (Figures 1 & 2).
Looking at historical numbers, recent issuance is below the peak seen in the
early 2000s, while outstanding volumes continue to rise (Figure 3).
Figure 1. Outstanding US bond market debt, $bn Figure 2. 2018 Issuance in the US bond market, $bn
Source: SIFMA. Data as of June 2019. Source: SIFMA. Data as of December 2018.
Figure 3. US MBS historical outstanding volume and issuance, $bn
Source: SIFMA. Data as of December 2018.
15,922
9,881
9,467
3,810
4,604
Treasury
Mortgage Related
Corporate Debt
Municipal
Other2,685
1,906
1,331
346
1,166
Treasury
Mortgage Related
Corporate Debt
Municipal
Other
0
500
1,000
1,500
2,000
2,500
3,000
3,500
4,000
0
2,000
4,000
6,000
8,000
10,000
12,000
1996 1998 2000 2002 2004 2006 2008 2010 2012 2014 2016 2018
Issuance
Outs
tandin
g V
olu
me
Outstanding Volume Issuance
ftserussell.com 3
Main types of US MBS
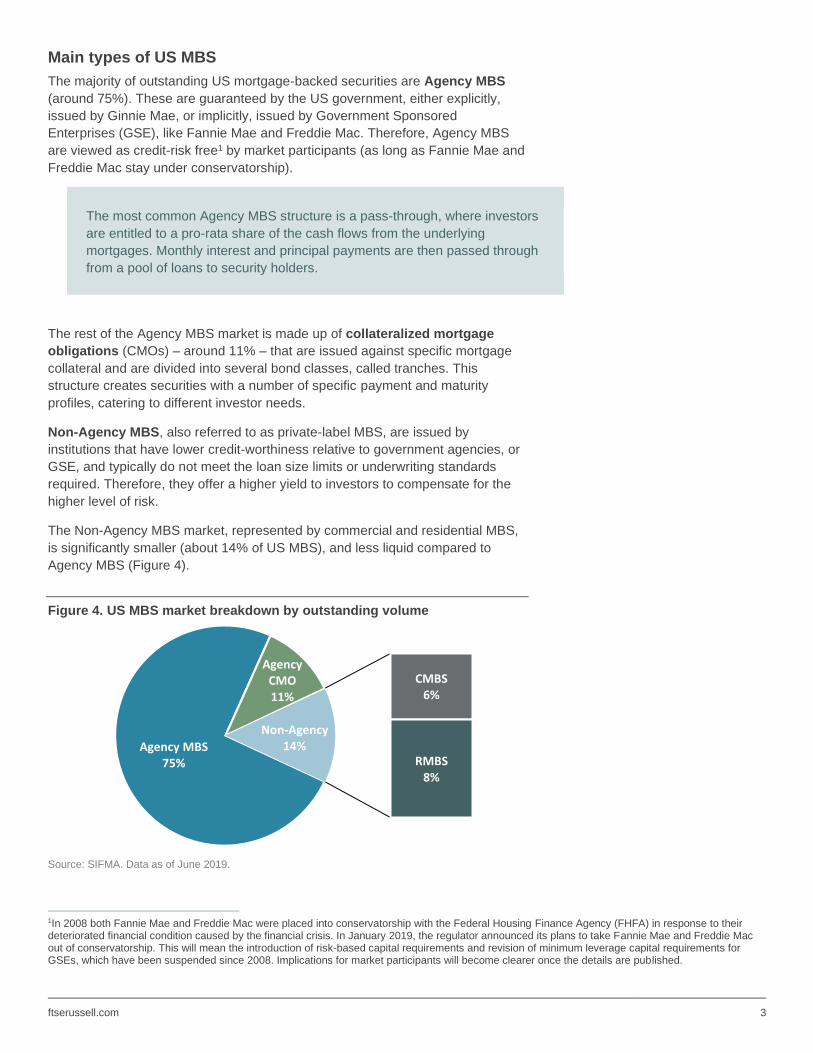
The majority of outstanding US mortgage-backed securities are Agency MBS
(around 75%). These are guaranteed by the US government, either explicitly,
issued by Ginnie Mae, or implicitly, issued by Government Sponsored
Enterprises (GSE), like Fannie Mae and Freddie Mac. Therefore, Agency MBS
are viewed as credit-risk free1 by market participants (as long as Fannie Mae and
Freddie Mac stay under conservatorship).
The most common Agency MBS structure is a pass-through, where investors
are entitled to a pro-rata share of the cash flows from the underlying
mortgages. Monthly interest and principal payments are then passed through
from a pool of loans to security holders.
The rest of the Agency MBS market is made up of collateralized mortgage
obligations (CMOs) – around 11% – that are issued against specific mortgage
collateral and are divided into several bond classes, called tranches. This
structure creates securities with a number of specific payment and maturity
profiles, catering to different investor needs.
Non-Agency MBS, also referred to as private-label MBS, are issued by
institutions that have lower credit-worthiness relative to government agencies, or
GSE, and typically do not meet the loan size limits or underwriting standards
required. Therefore, they offer a higher yield to investors to compensate for the
higher level of risk.
The Non-Agency MBS market, represented by commercial and residential MBS,
is significantly smaller (about 14% of US MBS), and less liquid compared to
Agency MBS (Figure 4).
Figure 4. US MBS market breakdown by outstanding volume
Source: SIFMA. Data as of June 2019.
1In 2008 both Fannie Mae and Freddie Mac were placed into conservatorship with the Federal Housing Finance Agency (FHFA) in response to their deteriorated financial condition caused by the financial crisis. In January 2019, the regulator announced its plans to take Fannie Mae and Freddie Mac out of conservatorship. This will mean the introduction of risk-based capital requirements and revision of minimum leverage capital requirements for GSEs, which have been suspended since 2008. Implications for market participants will become clearer once the details are published.
Agency MBS75%
Agency CMO11%
CMBS6%
RMBS8%
Non-Agency14%
ftserussell.com 4
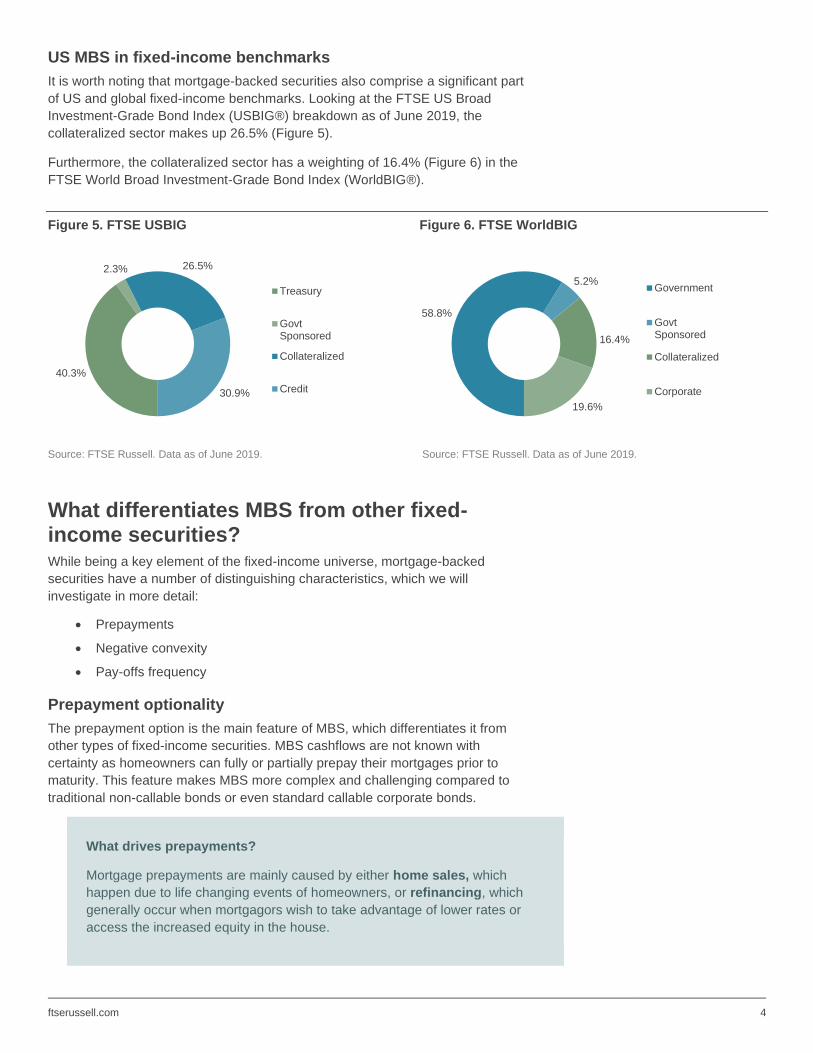
US MBS in fixed-income benchmarks
It is worth noting that mortgage-backed securities also comprise a significant part
of US and global fixed-income benchmarks. Looking at the FTSE US Broad
Investment-Grade Bond Index (USBIG®) breakdown as of June 2019, the
collateralized sector makes up 26.5% (Figure 5).
Furthermore, the collateralized sector has a weighting of 16.4% (Figure 6) in the
FTSE World Broad Investment-Grade Bond Index (WorldBIG®).
Figure 5. FTSE USBIG Figure 6. FTSE WorldBIG
Source: FTSE Russell. Data as of June 2019. Source: FTSE Russell. Data as of June 2019.
What differentiates MBS from other fixed-income securities? While being a key element of the fixed-income universe, mortgage-backed
securities have a number of distinguishing characteristics, which we will
investigate in more detail:
• Prepayments
• Negative convexity
• Pay-offs frequency
Prepayment optionality
The prepayment option is the main feature of MBS, which differentiates it from
other types of fixed-income securities. MBS cashflows are not known with
certainty as homeowners can fully or partially prepay their mortgages prior to
maturity. This feature makes MBS more complex and challenging compared to
traditional non-callable bonds or even standard callable corporate bonds.
What drives prepayments?
Mortgage prepayments are mainly caused by either home sales, which
happen due to life changing events of homeowners, or refinancing, which
generally occur when mortgagors wish to take advantage of lower rates or
access the increased equity in the house.
40.3%
2.3% 26.5%
30.9%
Treasury
GovtSponsored
Collateralized
Credit
58.8%
5.2%
16.4%
19.6%
Government
GovtSponsored
Collateralized
Corporate
ftserussell.com 5
A smaller proportion of prepayments is driven by defaults, curtailments and
full payoffs. Defaults occur when borrowers stop making payments on their
mortgage obligations. As for curtailments and full payoffs, the former
happens when homeowners pay more than scheduled monthly to build up
equity faster, while the latter means they pay their mortgages off completely
(this typically happens if loans have a small remaining balance)2.
What does the prepayment option (or call option) mean for investors? For the
majority of MBS securities, it is an extra risk dependent on interest rates shifts.
Therefore, they have a more pronounced duration uncertainty as illustrated below:
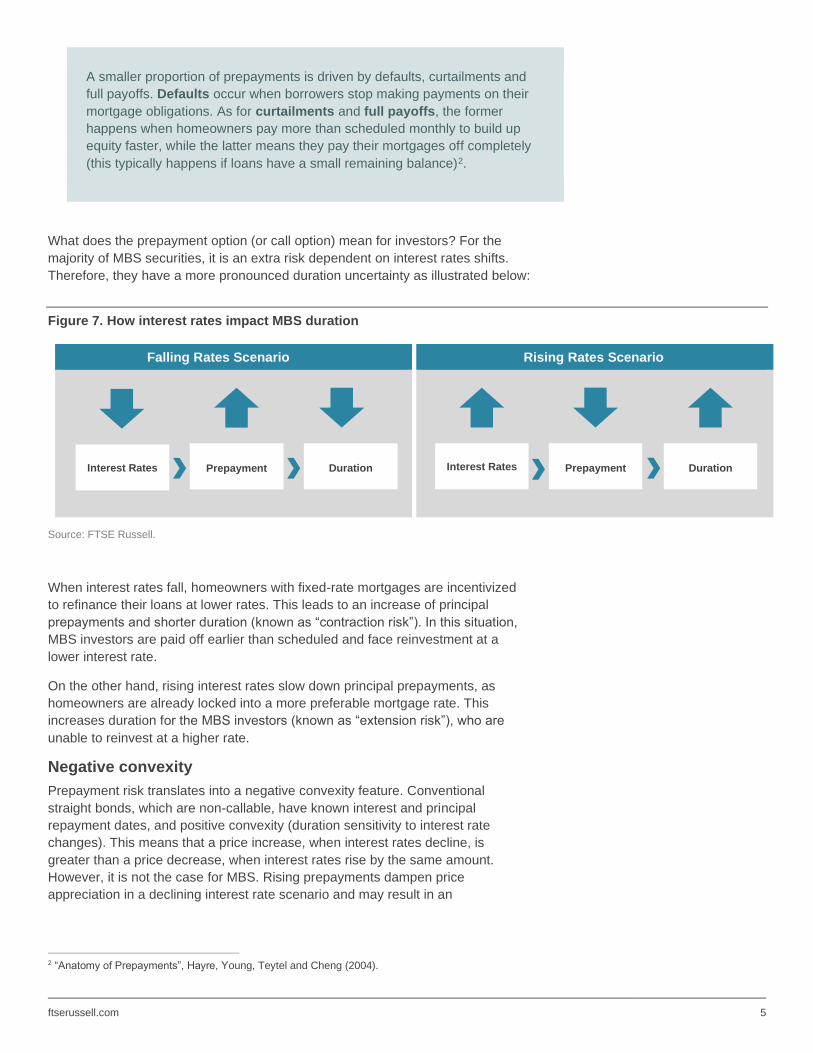
Figure 7. How interest rates impact MBS duration
Falling Rates Scenario Rising Rates Scenario
Source: FTSE Russell.
When interest rates fall, homeowners with fixed-rate mortgages are incentivized
to refinance their loans at lower rates. This leads to an increase of principal
prepayments and shorter duration (known as “contraction risk”). In this situation,
MBS investors are paid off earlier than scheduled and face reinvestment at a
lower interest rate.
On the other hand, rising interest rates slow down principal prepayments, as
homeowners are already locked into a more preferable mortgage rate. This
increases duration for the MBS investors (known as “extension risk”), who are
unable to reinvest at a higher rate.
Negative convexity
Prepayment risk translates into a negative convexity feature. Conventional
straight bonds, which are non-callable, have known interest and principal
repayment dates, and positive convexity (duration sensitivity to interest rate
changes). This means that a price increase, when interest rates decline, is
greater than a price decrease, when interest rates rise by the same amount.
However, it is not the case for MBS. Rising prepayments dampen price
appreciation in a declining interest rate scenario and may result in an
2 “Anatomy of Prepayments”, Hayre, Young, Teytel and Cheng (2004).
Interest Rates Prepayment Duration Prepayment Duration Interest Rates
ftserussell.com 6
underperformance versus a non-callable fixed-income instrument, such as a
comparable US Treasury (due to negative convexity).
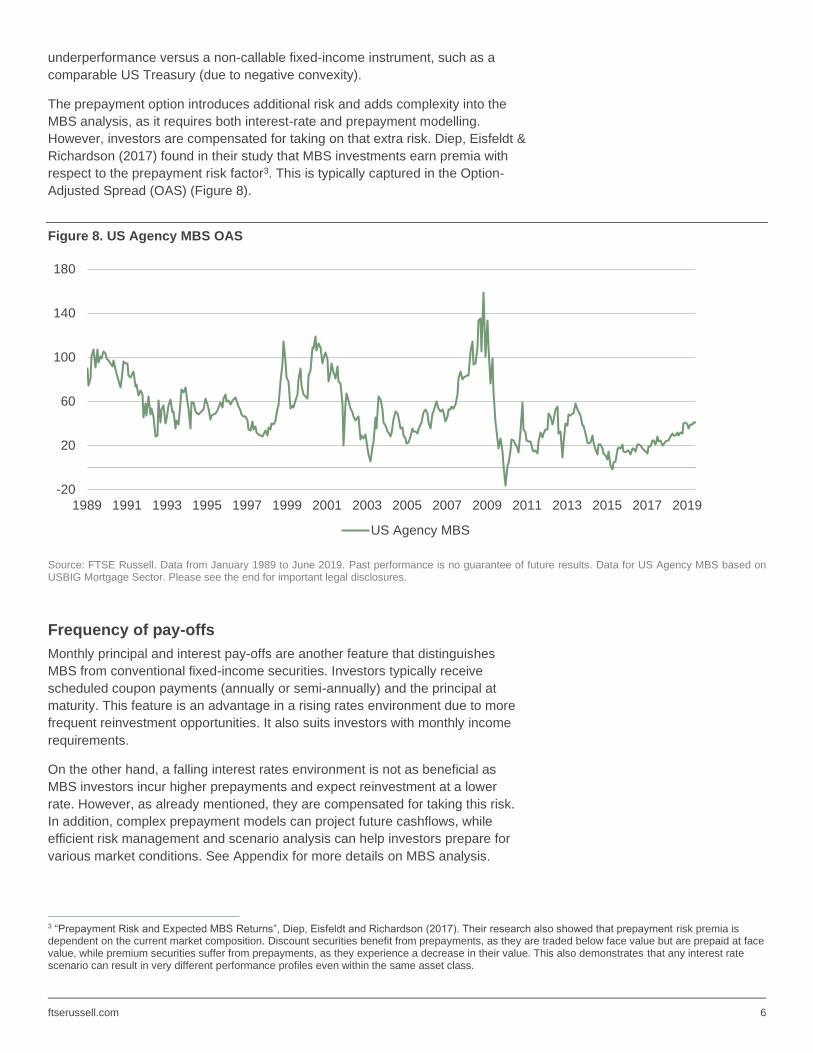
The prepayment option introduces additional risk and adds complexity into the
MBS analysis, as it requires both interest-rate and prepayment modelling.
However, investors are compensated for taking on that extra risk. Diep, Eisfeldt &
Richardson (2017) found in their study that MBS investments earn premia with
respect to the prepayment risk factor3. This is typically captured in the Option-
Adjusted Spread (OAS) (Figure 8).
Figure 8. US Agency MBS OAS
Source: FTSE Russell. Data from January 1989 to June 2019. Past performance is no guarantee of future results. Data for US Agency MBS based on USBIG Mortgage Sector. Please see the end for important legal disclosures.
Frequency of pay-offs
Monthly principal and interest pay-offs are another feature that distinguishes
MBS from conventional fixed-income securities. Investors typically receive
scheduled coupon payments (annually or semi-annually) and the principal at
maturity. This feature is an advantage in a rising rates environment due to more
frequent reinvestment opportunities. It also suits investors with monthly income
requirements.
On the other hand, a falling interest rates environment is not as beneficial as
MBS investors incur higher prepayments and expect reinvestment at a lower
rate. However, as already mentioned, they are compensated for taking this risk.
In addition, complex prepayment models can project future cashflows, while
efficient risk management and scenario analysis can help investors prepare for
various market conditions. See Appendix for more details on MBS analysis.
3 “Prepayment Risk and Expected MBS Returns”, Diep, Eisfeldt and Richardson (2017). Their research also showed that prepayment risk premia is dependent on the current market composition. Discount securities benefit from prepayments, as they are traded below face value but are prepaid at face value, while premium securities suffer from prepayments, as they experience a decrease in their value. This also demonstrates that any interest rate scenario can result in very different performance profiles even within the same asset class.
-20
20
60
100
140
180
1989 1991 1993 1995 1997 1999 2001 2003 2005 2007 2009 2011 2013 2015 2017 2019
US Agency MBS
ftserussell.com 7
Possible benefits from investing in MBS Apart from these unique characteristics, US Agency MBS may be attractive for
investors from a portfolio construction perspective due to the following features:
• Liquidity
• Yield
• Risk-adjusted performance
• Correlation
• Strong performance during the global financial crisis
• Behaviour in various interest-rate environments
• Security selection
Liquidity
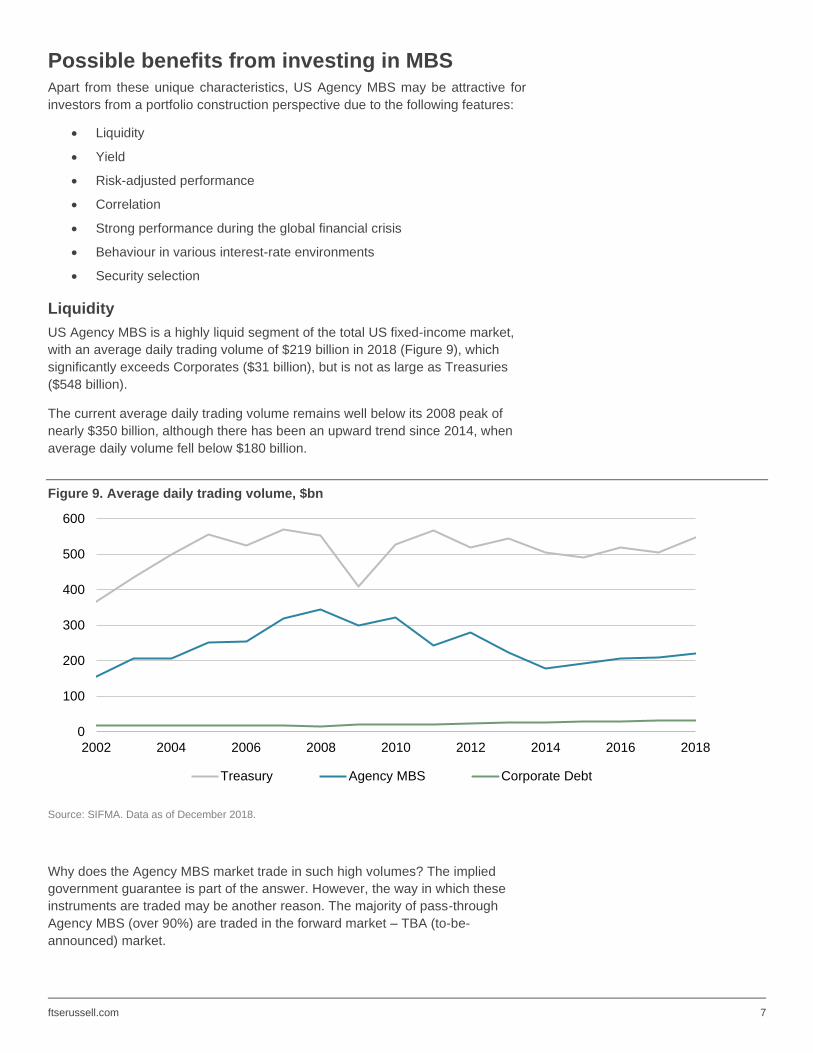
US Agency MBS is a highly liquid segment of the total US fixed-income market,
with an average daily trading volume of $219 billion in 2018 (Figure 9), which
significantly exceeds Corporates ($31 billion), but is not as large as Treasuries
($548 billion).
The current average daily trading volume remains well below its 2008 peak of
nearly $350 billion, although there has been an upward trend since 2014, when
average daily volume fell below $180 billion.
Figure 9. Average daily trading volume, $bn
Source: SIFMA. Data as of December 2018.
Why does the Agency MBS market trade in such high volumes? The implied
government guarantee is part of the answer. However, the way in which these
instruments are traded may be another reason. The majority of pass-through
Agency MBS (over 90%) are traded in the forward market – TBA (to-be-
announced) market.
0
100
200
300
400
500
600
2002 2004 2006 2008 2010 2012 2014 2016 2018
Treasury Agency MBS Corporate Debt
ftserussell.com 8
In a TBA market, the seller agrees to a sales price today and commits to the
delivery of securities with predefined characteristics (issuer, maturity, coupon,
par amount, settlement date) in a few months’ time.
Trading is consolidated into a handful of TBA contracts, typically across 30yr,
20yr and 15yr maturities, and three or four coupons. This process makes the
Agency MBS market more homogenous and liquid compared to Corporates,
and results in large average trade sizes and narrow bid-ask spreads.
TBA trading helps investors in a few ways:
• It simplifies analytical and risk management challenges, as it is easier to
analyse parameters of the TBA contract rather than value each individual
security;
• The TBA market has evolved into a funding and hedging mechanism –
the dollar roll – where TBAs are bought for a specific settlement date and
simultaneously sold for a later settlement. This transaction provides
financing, similar to a repo, or can be used for hedging the price risk.
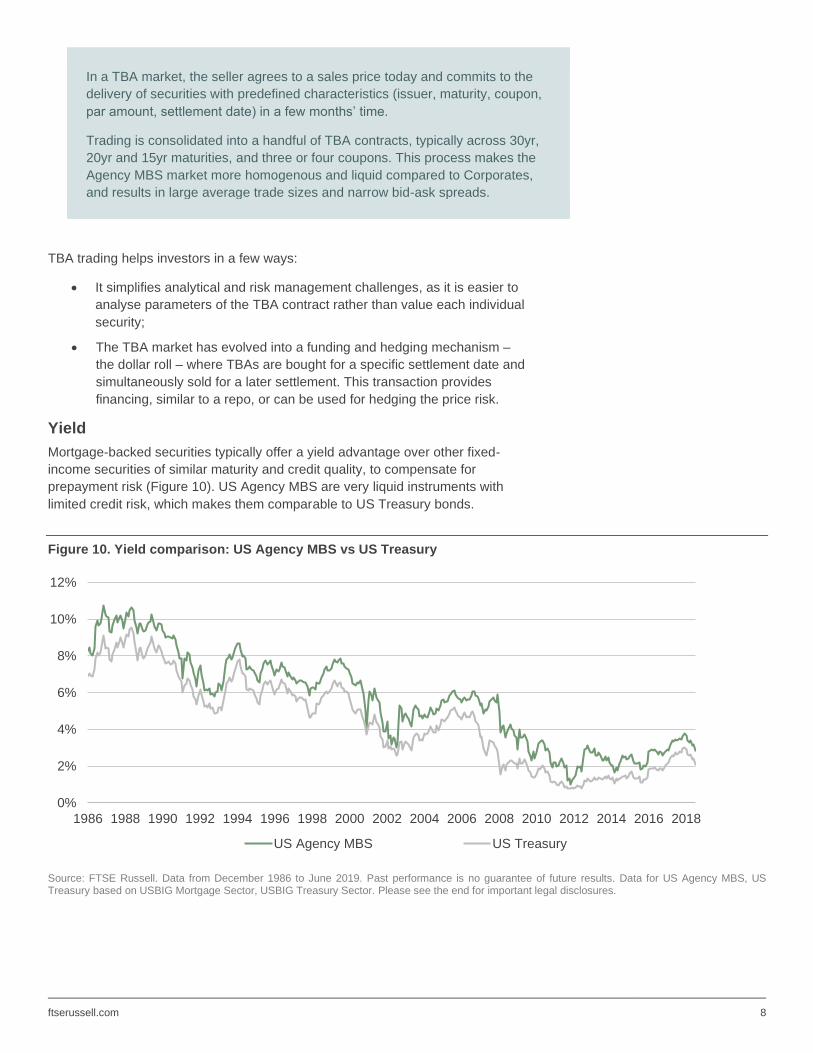
Yield
Mortgage-backed securities typically offer a yield advantage over other fixed-
income securities of similar maturity and credit quality, to compensate for
prepayment risk (Figure 10). US Agency MBS are very liquid instruments with
limited credit risk, which makes them comparable to US Treasury bonds.
Figure 10. Yield comparison: US Agency MBS vs US Treasury
Source: FTSE Russell. Data from December 1986 to June 2019. Past performance is no guarantee of future results. Data for US Agency MBS, US Treasury based on USBIG Mortgage Sector, USBIG Treasury Sector. Please see the end for important legal disclosures.
0%
2%
4%
6%
8%
10%
12%
1986 1988 1990 1992 1994 1996 1998 2000 2002 2004 2006 2008 2010 2012 2014 2016 2018
US Agency MBS US Treasury
ftserussell.com 9
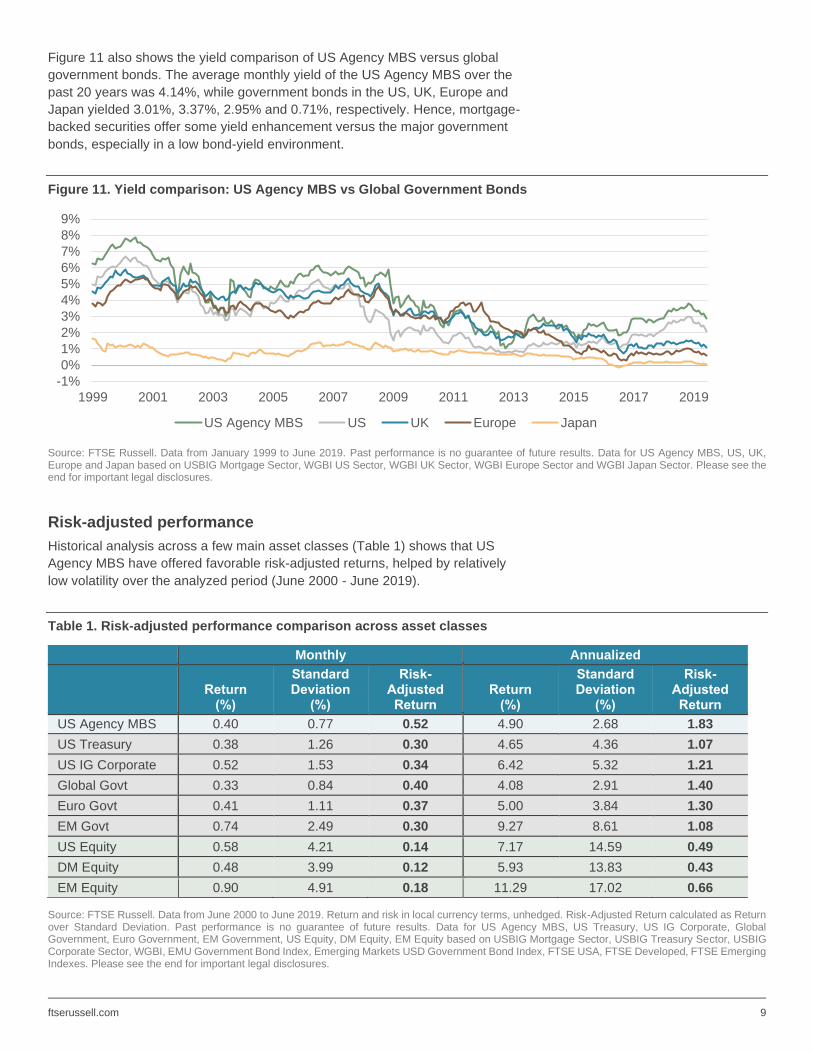
Figure 11 also shows the yield comparison of US Agency MBS versus global
government bonds. The average monthly yield of the US Agency MBS over the
past 20 years was 4.14%, while government bonds in the US, UK, Europe and
Japan yielded 3.01%, 3.37%, 2.95% and 0.71%, respectively. Hence, mortgage-
backed securities offer some yield enhancement versus the major government
bonds, especially in a low bond-yield environment.
Figure 11. Yield comparison: US Agency MBS vs Global Government Bonds
Source: FTSE Russell. Data from January 1999 to June 2019. Past performance is no guarantee of future results. Data for US Agency MBS, US, UK, Europe and Japan based on USBIG Mortgage Sector, WGBI US Sector, WGBI UK Sector, WGBI Europe Sector and WGBI Japan Sector. Please see the end for important legal disclosures.
Risk-adjusted performance
Historical analysis across a few main asset classes (Table 1) shows that US
Agency MBS have offered favorable risk-adjusted returns, helped by relatively
low volatility over the analyzed period (June 2000 - June 2019).
Table 1. Risk-adjusted performance comparison across asset classes
Monthly Annualized
Return
(%)
Standard Deviation
(%)
Risk-Adjusted Return
Return (%)
Standard Deviation
(%)
Risk-Adjusted Return
US Agency MBS 0.40 0.77 0.52 4.90 2.68 1.83
US Treasury 0.38 1.26 0.30 4.65 4.36 1.07
US IG Corporate 0.52 1.53 0.34 6.42 5.32 1.21
Global Govt 0.33 0.84 0.40 4.08 2.91 1.40
Euro Govt 0.41 1.11 0.37 5.00 3.84 1.30
EM Govt 0.74 2.49 0.30 9.27 8.61 1.08
US Equity 0.58 4.21 0.14 7.17 14.59 0.49
DM Equity 0.48 3.99 0.12 5.93 13.83 0.43
EM Equity 0.90 4.91 0.18 11.29 17.02 0.66
Source: FTSE Russell. Data from June 2000 to June 2019. Return and risk in local currency terms, unhedged. Risk-Adjusted Return calculated as Return over Standard Deviation. Past performance is no guarantee of future results. Data for US Agency MBS, US Treasury, US IG Corporate, Global Government, Euro Government, EM Government, US Equity, DM Equity, EM Equity based on USBIG Mortgage Sector, USBIG Treasury Sector, USBIG Corporate Sector, WGBI, EMU Government Bond Index, Emerging Markets USD Government Bond Index, FTSE USA, FTSE Developed, FTSE Emerging Indexes. Please see the end for important legal disclosures.
-1%
0%
1%
2%
3%
4%
5%
6%
7%
8%
9%
1999 2001 2003 2005 2007 2009 2011 2013 2015 2017 2019
US Agency MBS US UK Europe Japan
ftserussell.com 10
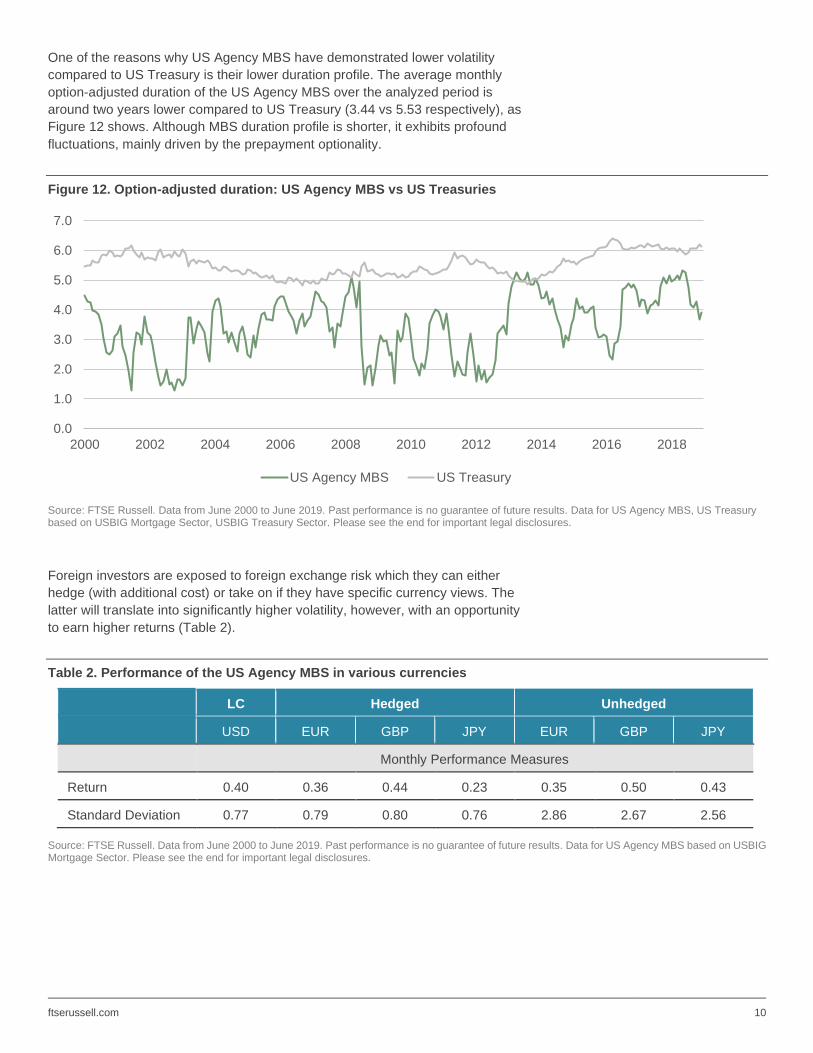
One of the reasons why US Agency MBS have demonstrated lower volatility
compared to US Treasury is their lower duration profile. The average monthly
option-adjusted duration of the US Agency MBS over the analyzed period is
around two years lower compared to US Treasury (3.44 vs 5.53 respectively), as
Figure 12 shows. Although MBS duration profile is shorter, it exhibits profound
fluctuations, mainly driven by the prepayment optionality.
Figure 12. Option-adjusted duration: US Agency MBS vs US Treasuries
Source: FTSE Russell. Data from June 2000 to June 2019. Past performance is no guarantee of future results. Data for US Agency MBS, US Treasury based on USBIG Mortgage Sector, USBIG Treasury Sector. Please see the end for important legal disclosures.
Foreign investors are exposed to foreign exchange risk which they can either
hedge (with additional cost) or take on if they have specific currency views. The
latter will translate into significantly higher volatility, however, with an opportunity
to earn higher returns (Table 2).
Table 2. Performance of the US Agency MBS in various currencies
LC Hedged Unhedged
USD EUR GBP JPY EUR GBP JPY
Monthly Performance Measures
Return 0.40 0.36 0.44 0.23 0.35 0.50 0.43
Standard Deviation 0.77 0.79 0.80 0.76 2.86 2.67 2.56
Source: FTSE Russell. Data from June 2000 to June 2019. Past performance is no guarantee of future results. Data for US Agency MBS based on USBIG Mortgage Sector. Please see the end for important legal disclosures.
0.0
1.0
2.0
3.0
4.0
5.0
6.0
7.0
2000 2002 2004 2006 2008 2010 2012 2014 2016 2018
US Agency MBS US Treasury
ftserussell.com 11
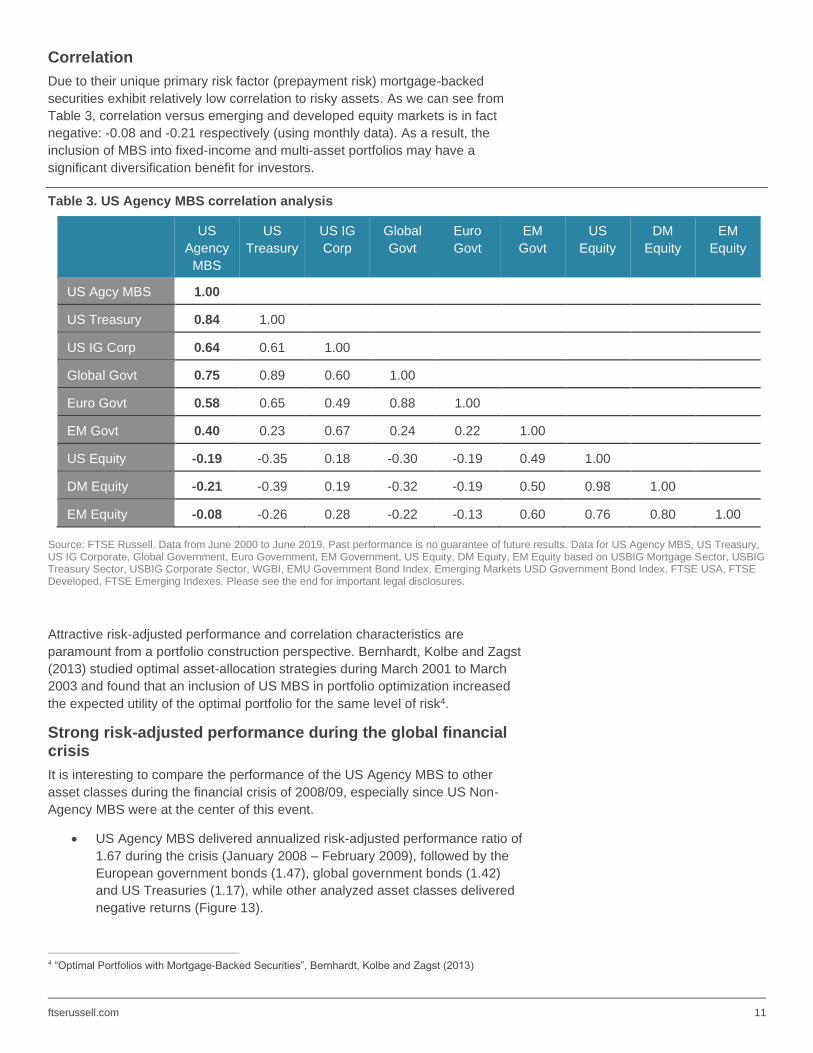
Correlation
Due to their unique primary risk factor (prepayment risk) mortgage-backed
securities exhibit relatively low correlation to risky assets. As we can see from
Table 3, correlation versus emerging and developed equity markets is in fact
negative: -0.08 and -0.21 respectively (using monthly data). As a result, the
inclusion of MBS into fixed-income and multi-asset portfolios may have a
significant diversification benefit for investors.
Table 3. US Agency MBS correlation analysis
US
Agency
MBS
US
Treasury
US IG
Corp
Global
Govt
Euro
Govt
EM
Govt
US
Equity
DM
Equity
EM
Equity
US Agcy MBS 1.00
US Treasury 0.84 1.00
US IG Corp 0.64 0.61 1.00
Global Govt 0.75 0.89 0.60 1.00
Euro Govt 0.58 0.65 0.49 0.88 1.00
EM Govt 0.40 0.23 0.67 0.24 0.22 1.00
US Equity -0.19 -0.35 0.18 -0.30 -0.19 0.49 1.00
DM Equity -0.21 -0.39 0.19 -0.32 -0.19 0.50 0.98 1.00
EM Equity -0.08 -0.26 0.28 -0.22 -0.13 0.60 0.76 0.80 1.00
Source: FTSE Russell. Data from June 2000 to June 2019. Past performance is no guarantee of future results. Data for US Agency MBS, US Treasury, US IG Corporate, Global Government, Euro Government, EM Government, US Equity, DM Equity, EM Equity based on USBIG Mortgage Sector, USBIG Treasury Sector, USBIG Corporate Sector, WGBI, EMU Government Bond Index, Emerging Markets USD Government Bond Index, FTSE USA, FTSE Developed, FTSE Emerging Indexes. Please see the end for important legal disclosures.
Attractive risk-adjusted performance and correlation characteristics are
paramount from a portfolio construction perspective. Bernhardt, Kolbe and Zagst
(2013) studied optimal asset-allocation strategies during March 2001 to March
2003 and found that an inclusion of US MBS in portfolio optimization increased
the expected utility of the optimal portfolio for the same level of risk4.
Strong risk-adjusted performance during the global financial crisis
It is interesting to compare the performance of the US Agency MBS to other
asset classes during the financial crisis of 2008/09, especially since US Non-
Agency MBS were at the center of this event.
• US Agency MBS delivered annualized risk-adjusted performance ratio of
1.67 during the crisis (January 2008 – February 2009), followed by the
European government bonds (1.47), global government bonds (1.42)
and US Treasuries (1.17), while other analyzed asset classes delivered
negative returns (Figure 13).
4 “Optimal Portfolios with Mortgage-Backed Securities”, Bernhardt, Kolbe and Zagst (2013)
ftserussell.com 12
• Performance of the US Agency MBS was also the strongest before the
crisis (June 2000 – December 2007) and marginally outperformed by US
IG Corporate after the crisis (March 2009 - May 2019).
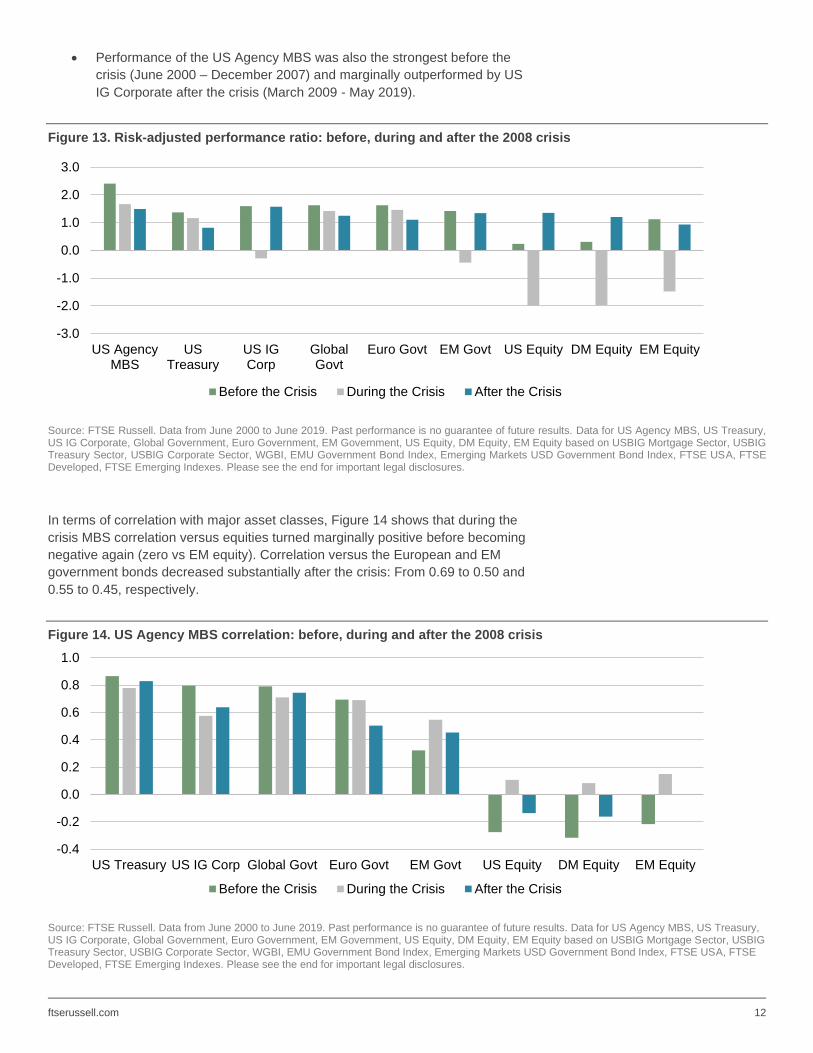
Figure 13. Risk-adjusted performance ratio: before, during and after the 2008 crisis
Source: FTSE Russell. Data from June 2000 to June 2019. Past performance is no guarantee of future results. Data for US Agency MBS, US Treasury, US IG Corporate, Global Government, Euro Government, EM Government, US Equity, DM Equity, EM Equity based on USBIG Mortgage Sector, USBIG Treasury Sector, USBIG Corporate Sector, WGBI, EMU Government Bond Index, Emerging Markets USD Government Bond Index, FTSE USA, FTSE Developed, FTSE Emerging Indexes. Please see the end for important legal disclosures.
In terms of correlation with major asset classes, Figure 14 shows that during the
crisis MBS correlation versus equities turned marginally positive before becoming
negative again (zero vs EM equity). Correlation versus the European and EM
government bonds decreased substantially after the crisis: From 0.69 to 0.50 and
0.55 to 0.45, respectively.
Figure 14. US Agency MBS correlation: before, during and after the 2008 crisis
Source: FTSE Russell. Data from June 2000 to June 2019. Past performance is no guarantee of future results. Data for US Agency MBS, US Treasury, US IG Corporate, Global Government, Euro Government, EM Government, US Equity, DM Equity, EM Equity based on USBIG Mortgage Sector, USBIG Treasury Sector, USBIG Corporate Sector, WGBI, EMU Government Bond Index, Emerging Markets USD Government Bond Index, FTSE USA, FTSE Developed, FTSE Emerging Indexes. Please see the end for important legal disclosures.
-3.0
-2.0
-1.0
0.0
1.0
2.0
3.0
US AgencyMBS
USTreasury
US IGCorp
GlobalGovt
Euro Govt EM Govt US Equity DM Equity EM Equity
Before the Crisis During the Crisis After the Crisis
-0.4
-0.2
0.0
0.2
0.4
0.6
0.8
1.0
US Treasury US IG Corp Global Govt Euro Govt EM Govt US Equity DM Equity EM Equity
Before the Crisis During the Crisis After the Crisis
ftserussell.com 13
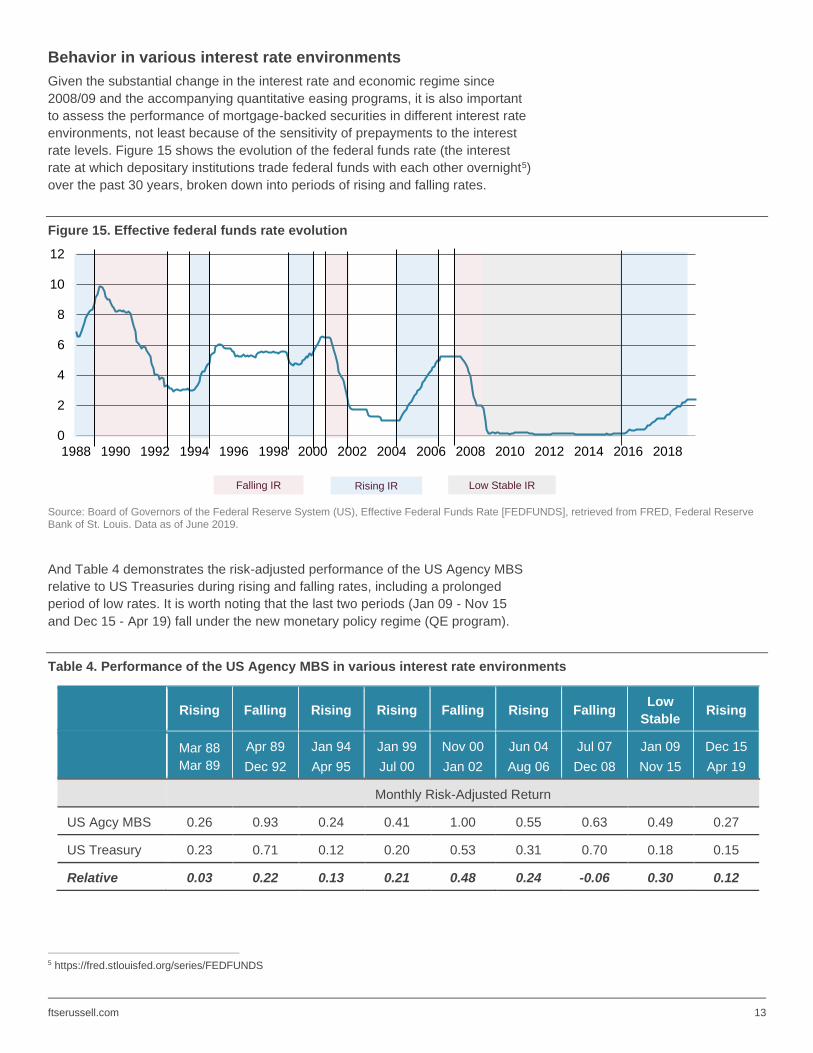
Behavior in various interest rate environments
Given the substantial change in the interest rate and economic regime since
2008/09 and the accompanying quantitative easing programs, it is also important
to assess the performance of mortgage-backed securities in different interest rate
environments, not least because of the sensitivity of prepayments to the interest
rate levels. Figure 15 shows the evolution of the federal funds rate (the interest
rate at which depositary institutions trade federal funds with each other overnight5)
over the past 30 years, broken down into periods of rising and falling rates.
Figure 15. Effective federal funds rate evolution
Source: Board of Governors of the Federal Reserve System (US), Effective Federal Funds Rate [FEDFUNDS], retrieved from FRED, Federal Reserve Bank of St. Louis. Data as of June 2019.
And Table 4 demonstrates the risk-adjusted performance of the US Agency MBS
relative to US Treasuries during rising and falling rates, including a prolonged
period of low rates. It is worth noting that the last two periods (Jan 09 - Nov 15
and Dec 15 - Apr 19) fall under the new monetary policy regime (QE program).
Table 4. Performance of the US Agency MBS in various interest rate environments
Rising Falling Rising Rising Falling Rising Falling
Low
Stable Rising
Mar 88
Mar 89
Apr 89
Dec 92
Jan 94
Apr 95
Jan 99
Jul 00
Nov 00
Jan 02
Jun 04
Aug 06
Jul 07
Dec 08
Jan 09
Nov 15
Dec 15
Apr 19
Monthly Risk-Adjusted Return
US Agcy MBS 0.26 0.93 0.24 0.41 1.00 0.55 0.63 0.49 0.27
US Treasury 0.23 0.71 0.12 0.20 0.53 0.31 0.70 0.18 0.15
Relative 0.03 0.22 0.13 0.21 0.48 0.24 -0.06 0.30 0.12
5 https://fred.stlouisfed.org/series/FEDFUNDS
0
2
4
6
8
10
12
1988 1990 1992 1994 1996 1998 2000 2002 2004 2006 2008 2010 2012 2014 2016 2018
Rising IRFalling IR Low Stable IR
ftserussell.com 14
Source: FTSE Russell. Data from March 1988 to June 2019. Return and risk in local currency terms, unhedged. Risk-Adjusted Return calculated as Return over Standard Deviation. Past performance is no guarantee of future results. Data for US Agency MBS, US Treasury based on USBIG Mortgage Sector, USBIG Treasury Sector. Please see the end for important legal disclosures.
• US Agency MBS outperformed Treasuries in most regimes.
• The strongest performance was from November 2000 to January 2002,
when the federal funds rate fell sharply from over 6% to under 2% and
the US Agency MBS delivering relative monthly risk-adjusted
performance of 0.48.
• The second strongest period was during very low but stable interest rate
environment from January 2009 to November 2015, with relative risk-
adjusted performance of 0.30.
• And the only period of underperformance versus US Treasuries was July
2007 – December 2008, when the federal funds rate fell from over 5%
down to just above 0%, resulting in -0.06 relative risk-adjusted
performance.
Security selection
Another feature of the mortgage-backed securities market is its depth and
breadth, which makes it attractive for active managers from a security selection
point of view. Various types of MBS instruments (like CMOs and CRTs), as well
as market dislocation and arbitrage opportunities, give active managers the
flexibility to express their views and exploit opportunities.
The CMO market developed in the 1980s brought a whole new range of
instruments to investors – fixed and floating-rate CMO bonds, various maturity
and prepayment profiles, planned amortization class (PAC) bonds, which
essentially remove prepayment risk and provide stable cash flows, targeted
amortization class (TAC) bonds, which offer one-sided protection (either against
contraction or extension risk), principal only (PO) and interest only (IO) tranches.
For example, sequential-pay structure gives investors an opportunity to buy
the short, intermediate or long-term cashflows of the underlying collateral.
Investors with a greater appetite for yields can purchase support tranches,
while those averse to prepayment risk can buy targeted amortization classes
or planned amortization classes, which reduce call risk or protect from call
and extension respectively.
More recently (in 2013), Credit Risk Transfer (CRT) securities have been
introduced, which shift a portion of the credit risk away from the GSEs (Fannie
Mae and Freddie Mac) to private investors. These securities involve
senior/subordinate structure and offer exposure to various tranches with very
distinct risk and return profiles. The CRT program has become very popular, as it
gives investors an opportunity to gain exposure to residential mortgage credit
risk. Moreover, it created a market for pricing and trading this risk.
ftserussell.com 15
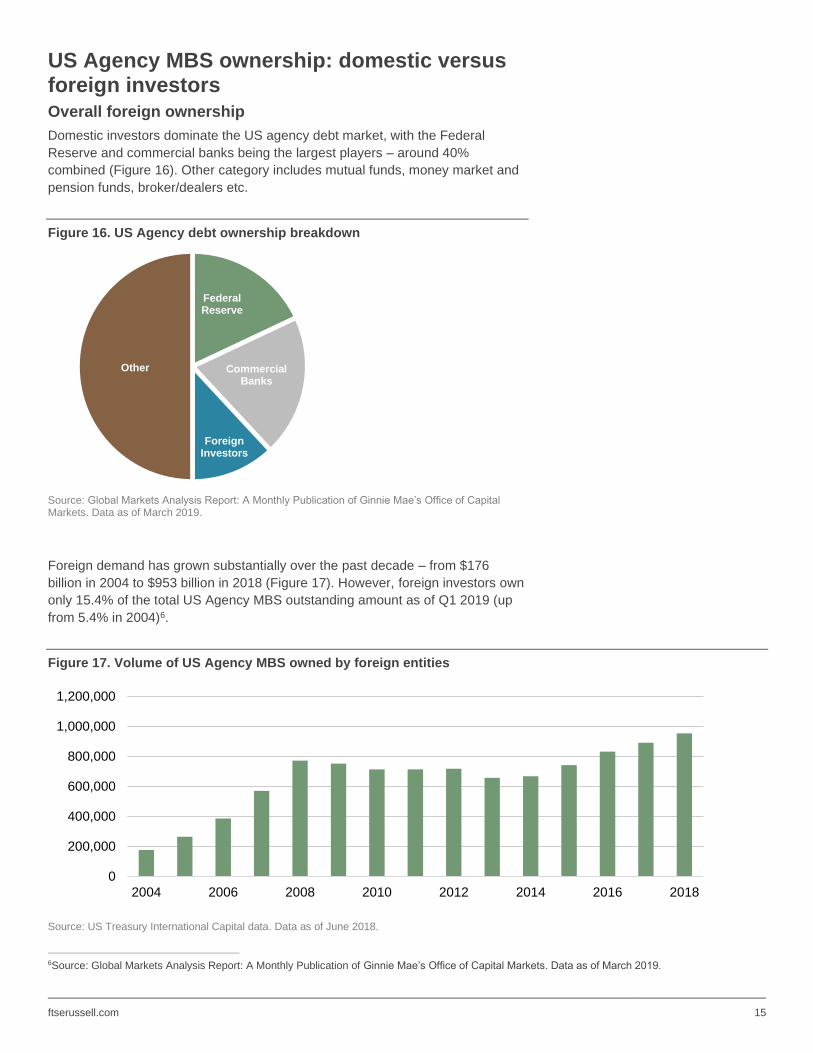
US Agency MBS ownership: domestic versus foreign investors Overall foreign ownership
Domestic investors dominate the US agency debt market, with the Federal
Reserve and commercial banks being the largest players – around 40%
combined (Figure 16). Other category includes mutual funds, money market and
pension funds, broker/dealers etc.
Figure 16. US Agency debt ownership breakdown
Source: Global Markets Analysis Report: A Monthly Publication of Ginnie Mae’s Office of Capital Markets. Data as of March 2019.
Foreign demand has grown substantially over the past decade – from $176
billion in 2004 to $953 billion in 2018 (Figure 17). However, foreign investors own
only 15.4% of the total US Agency MBS outstanding amount as of Q1 2019 (up
from 5.4% in 2004)6.
Figure 17. Volume of US Agency MBS owned by foreign entities
Source: US Treasury International Capital data. Data as of June 2018.
6Source: Global Markets Analysis Report: A Monthly Publication of Ginnie Mae’s Office of Capital Markets. Data as of March 2019.
Federal Reserve
Commercial Banks
Foreign Investors
Other
0
200,000
400,000
600,000
800,000
1,000,000
1,200,000
2004 2006 2008 2010 2012 2014 2016 2018
ftserussell.com 16
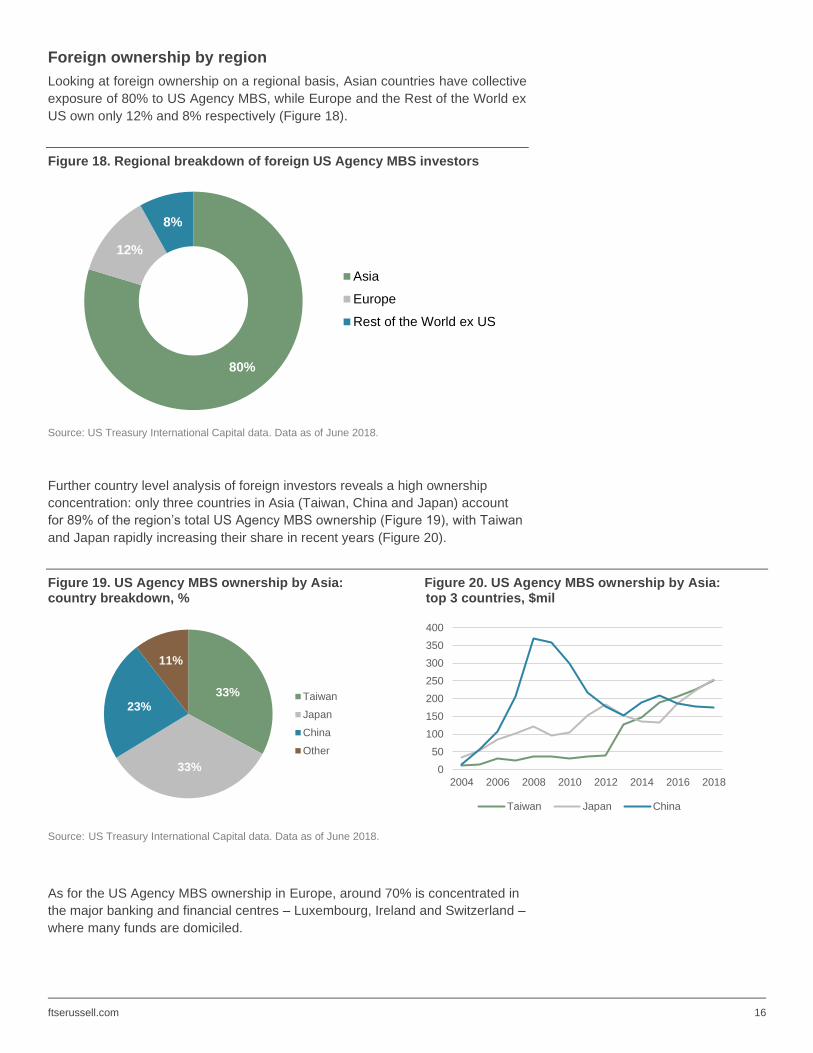
Foreign ownership by region
Looking at foreign ownership on a regional basis, Asian countries have collective
exposure of 80% to US Agency MBS, while Europe and the Rest of the World ex
US own only 12% and 8% respectively (Figure 18).
Figure 18. Regional breakdown of foreign US Agency MBS investors
Source: US Treasury International Capital data. Data as of June 2018.
Further country level analysis of foreign investors reveals a high ownership
concentration: only three countries in Asia (Taiwan, China and Japan) account
for 89% of the region’s total US Agency MBS ownership (Figure 19), with Taiwan
and Japan rapidly increasing their share in recent years (Figure 20).
Figure 19. US Agency MBS ownership by Asia: Figure 20. US Agency MBS ownership by Asia: country breakdown, % top 3 countries, $mil
Source: US Treasury International Capital data. Data as of June 2018.
As for the US Agency MBS ownership in Europe, around 70% is concentrated in
the major banking and financial centres – Luxembourg, Ireland and Switzerland –
where many funds are domiciled.
80%
12%
8%
Asia
Europe
Rest of the World ex US
33%
33%
23%
11%
Taiwan
Japan
China
Other
0
50
100
150
200
250
300
350
400
2004 2006 2008 2010 2012 2014 2016 2018
Taiwan Japan China
ftserussell.com 17
Dominance of Asian investors has not always been the case. In 2003, Europe
accounted for 46% of the overall foreign ownership, followed by the Rest of the
World ex US (29%) and then Asia (25%). However, over the past decade, Asian
economies have significantly increased their demand for foreign assets (including
US Agency MBS), helped by rising current account balances and growing
foreign-exchange reserves.
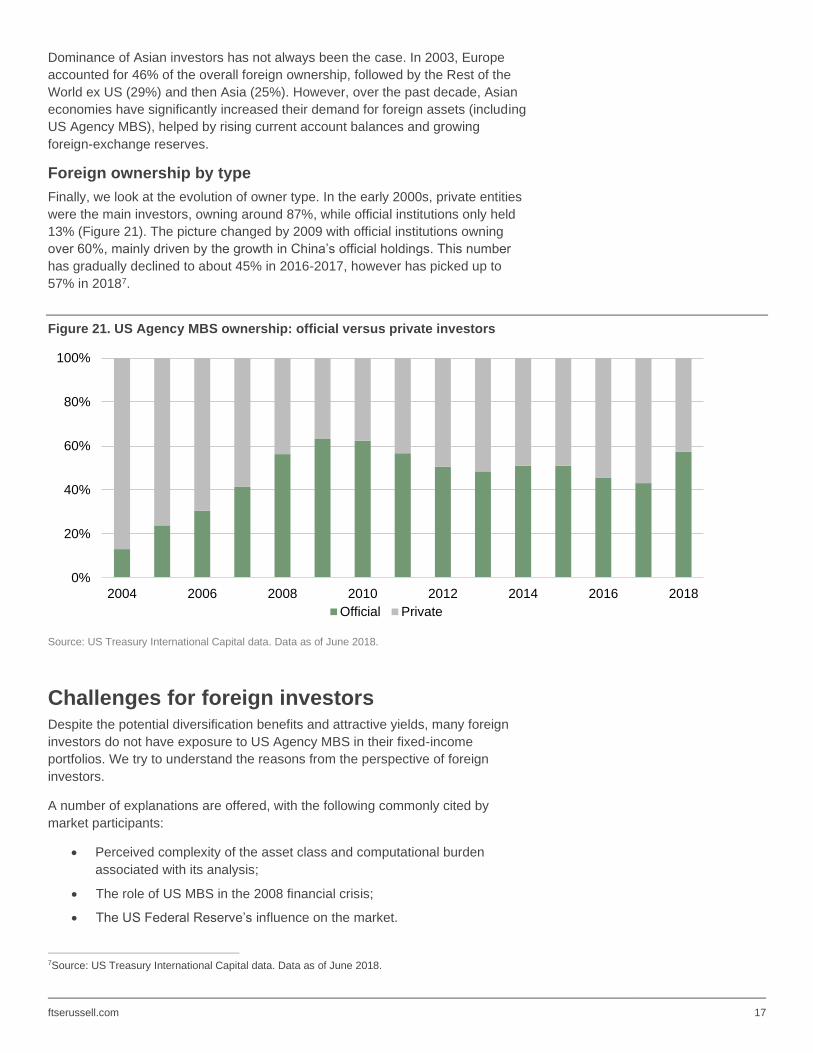
Foreign ownership by type
Finally, we look at the evolution of owner type. In the early 2000s, private entities
were the main investors, owning around 87%, while official institutions only held
13% (Figure 21). The picture changed by 2009 with official institutions owning
over 60%, mainly driven by the growth in China’s official holdings. This number
has gradually declined to about 45% in 2016-2017, however has picked up to
57% in 20187.
Figure 21. US Agency MBS ownership: official versus private investors
Source: US Treasury International Capital data. Data as of June 2018.
Challenges for foreign investors Despite the potential diversification benefits and attractive yields, many foreign
investors do not have exposure to US Agency MBS in their fixed-income
portfolios. We try to understand the reasons from the perspective of foreign
investors.
A number of explanations are offered, with the following commonly cited by
market participants:
• Perceived complexity of the asset class and computational burden
associated with its analysis;
• The role of US MBS in the 2008 financial crisis;
• The US Federal Reserve’s influence on the market.
7Source: US Treasury International Capital data. Data as of June 2018.
0%
20%
40%
60%
80%
100%
2004 2006 2008 2010 2012 2014 2016 2018
Official Private
ftserussell.com 18
Perceived complexity and computational burden
In an early study of the MBS market in 1987, Christiansen and Elebash assessed
investors’ attitude towards mortgage-backed securities, mainly focusing on
pension funds. According to this survey, the majority of investors chose not to
invest in MBS instruments due to their perceived complexity, in particular
because of their indefinite maturities and lack of call protection8.
The MBS market has become a very large segment of the fixed-income universe.
However, there is a low uptake by international investors for exactly the same
reasons. The lack of familiarity with the asset class and its unique characteristics
add to the problem.
The computational burden associated with the inclusion of mortgage-backed
securities into portfolio optimization processes, their valuation and risk
management, all introduce extra challenges. This requires wide security
coverage; complex interest-rate and prepayment models, accounting for interest-
rate evolution and cash-flow uncertainty embedded into MBS; and a powerful
calculation engine that will produce meaningful analytics on large portfolios.
Firms with a global presence tend to manage their US Agency MBS exposure
in the US-based offices, due to easier access to the local market’s expertise
and information.
Often, US Agency MBS exposure is implemented via TBAs, which
substantially reduces computational burden and in-depth analytical needs.
Yield Book, a well-known and widely used analytical platform backed by decades
of experience and expertise in the mortgage-backed securities space, offers a
solution to this problem. The option-adjusted model provides investors with an in-
depth analysis across various types of MBS, based on robust term structure and
prepayment models, which will consider all possible interest rates scenarios and
their implications.
A comprehensive set of analytics, produced by Yield Book models, can then be
applied to inform the investment decision making process and efficient risk
management.
The role of US MBS in the global financial crisis
More recently, the role of mortgage-backed securities in the financial crisis of
2008 appears to have created a negative perception of the asset class as a
whole. This is despite the fact that the primary catalyst was actually the Non-
Agency Residential Mortgage-Backed Securities (RMBS) segment, backed by
lower credit-quality mortgages, that collapsed with deteriorating economy and
housing market conditions. Spreads widened alike for both Agency MBS and
Non-Agency RMBS, but the effect on the former was much more modest. As a
result, investment returns of Agency MBS continued to grow from 2008, while the
Non-Agency RMBS segment suffered until late 20099.
8 “A Note On the Attitude of Pension Fund Investment Managers towards Mortgage-Backed Securities,” Christiansen and Elebash (1987) 9 “The Handbook of Mortgage-Backed Securities,” Fabozzi (2016)
ftserussell.com 19
Notwithstanding this, significant effort has been put into reshaping the US
securitized market over the past 10 years. Post-crisis investigation revealed a
number of areas, which require improvements and tighter regulations, including
greater insight into the process of securitization of loan pools, alignment of
incentives among various parties involved, MBS valuation challenges in stressed
market conditions and the role of credit rating agencies.
The Dodd-Frank Act was passed by the US Congress in 2010 to improve
market transparency and due diligence analysis, and limit potential conflict of
interests by putting restrictions on participants of the securitization process.
In 2014, the SEC published Regulation AB-II and introduced greater disclosure
requirements into the private-label market, aimed at providing more
transparency to investors.
Moreover, the Single Security initiative went live in June 2019, aimed at
introducing a Universal Mortgage-Backed Security (UMBS) and combining the
TBA markets of the GSEs. It is an important change, which is establishing a
single and even more liquid market for Fannie Mae and Freddie Mac securities,
with standardized disclosures and structures.
The Fed’s influence on the market
In addition, some investors are concerned about the US Federal Reserve’s
influence on the MBS market over the past decade, as a result of the US Fed’s
quantitative easing (QE) program put in place after the crisis to stimulate
economic activity.
The Fed purchased $1.25 trillion worth of Agency MBS between January
2009 and March 2010, which grew to nearly $1.8 trillion in the following years,
making the Fed one of the main players in the market.
In October 2017, the Fed began the process of balance-sheet normalization
program by reducing its monthly reinvestment into Agency MBS, with the final
goal of refraining from any reinvestment activity. This program, expected to result
in increased market supply, posed a number question: “How will the market
respond to this action?” and “How will the asset class perform in this situation?”
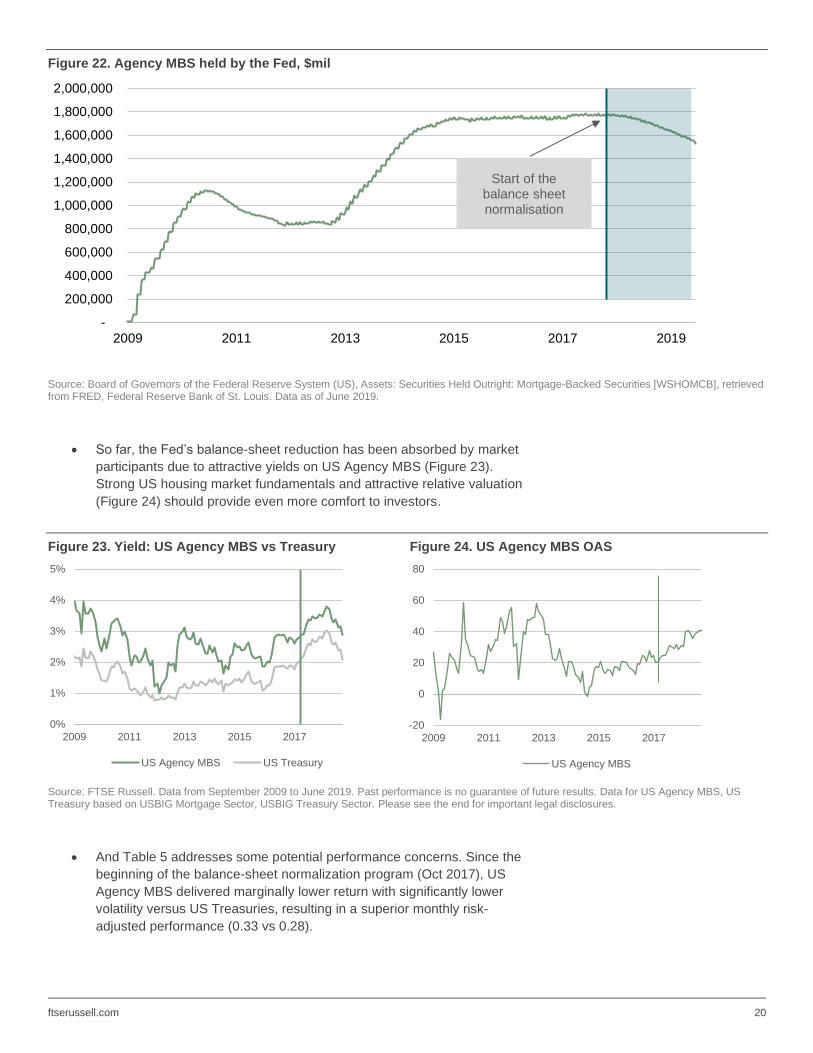
• Since the beginning of this program, the Federal Reserve has been
implementing the balance-sheet normalization in a gradual way, with
Figure 22 demonstrating a smooth decrease of the Fed’s Agency MBS
holdings since October 201710.
10 At the conclusion of its July 2019 meeting, the FOMC noted that it would conclude the reduction of its aggregate securities holdings in the System Open Market Account in August, two months earlier than previously indicated.
ftserussell.com 20
Figure 22. Agency MBS held by the Fed, $mil
Source: Board of Governors of the Federal Reserve System (US), Assets: Securities Held Outright: Mortgage-Backed Securities [WSHOMCB], retrieved from FRED, Federal Reserve Bank of St. Louis. Data as of June 2019.
• So far, the Fed’s balance-sheet reduction has been absorbed by market
participants due to attractive yields on US Agency MBS (Figure 23).
Strong US housing market fundamentals and attractive relative valuation
(Figure 24) should provide even more comfort to investors.
Figure 23. Yield: US Agency MBS vs Treasury Figure 24. US Agency MBS OAS
Source: FTSE Russell. Data from September 2009 to June 2019. Past performance is no guarantee of future results. Data for US Agency MBS, US Treasury based on USBIG Mortgage Sector, USBIG Treasury Sector. Please see the end for important legal disclosures.
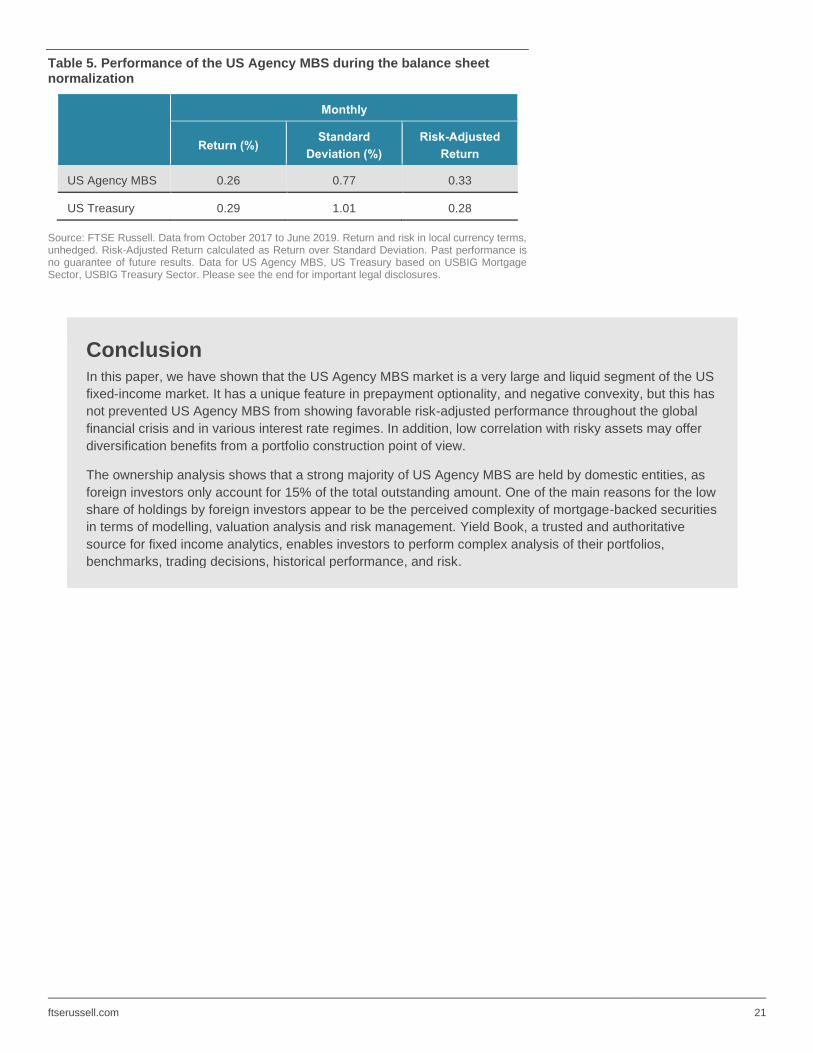
• And Table 5 addresses some potential performance concerns. Since the
beginning of the balance-sheet normalization program (Oct 2017), US
Agency MBS delivered marginally lower return with significantly lower
volatility versus US Treasuries, resulting in a superior monthly risk-
adjusted performance (0.33 vs 0.28).
-
200,000
400,000
600,000
800,000
1,000,000
1,200,000
1,400,000
1,600,000
1,800,000
2,000,000
2009 2011 2013 2015 2017 2019
Start of the balance sheet normalisation
0%
1%
2%
3%
4%
5%
2009 2011 2013 2015 2017
US Agency MBS US Treasury
-20
0
20
40
60
80
2009 2011 2013 2015 2017
US Agency MBS
ftserussell.com 21
Table 5. Performance of the US Agency MBS during the balance sheet normalization
Monthly
Return (%) Standard
Deviation (%)
Risk-Adjusted
Return
US Agency MBS 0.26 0.77 0.33
US Treasury 0.29 1.01 0.28
Source: FTSE Russell. Data from October 2017 to June 2019. Return and risk in local currency terms, unhedged. Risk-Adjusted Return calculated as Return over Standard Deviation. Past performance is no guarantee of future results. Data for US Agency MBS, US Treasury based on USBIG Mortgage Sector, USBIG Treasury Sector. Please see the end for important legal disclosures.
Conclusion In this paper, we have shown that the US Agency MBS market is a very large and liquid segment of the US
fixed-income market. It has a unique feature in prepayment optionality, and negative convexity, but this has
not prevented US Agency MBS from showing favorable risk-adjusted performance throughout the global
financial crisis and in various interest rate regimes. In addition, low correlation with risky assets may offer
diversification benefits from a portfolio construction point of view.
The ownership analysis shows that a strong majority of US Agency MBS are held by domestic entities, as
foreign investors only account for 15% of the total outstanding amount. One of the main reasons for the low
share of holdings by foreign investors appear to be the perceived complexity of mortgage-backed securities
in terms of modelling, valuation analysis and risk management. Yield Book, a trusted and authoritative
source for fixed income analytics, enables investors to perform complex analysis of their portfolios,
benchmarks, trading decisions, historical performance, and risk.
ftserussell.com 22
Appendix MBS analysis
The prepayment optionality of mortgage-backed securities requires a modelling
approach, capable of capturing the dynamic nature of all inputs and their
behavior in various environments.
Option-Adjusted Analysis, pioneered by Salomon Brothers in 1989, has
become an essential risk-analytic tool for MBS investors. OAS is similar to that
commonly applied to corporate bonds, but also accounts for the variability and
optionality of prepayments.
To understand the OAS of an MBS security, there are three essential steps:
1. A term-structure model is chosen to describe the evolution of interest
rates over time and simulate hundreds of hypothetical interest-rate paths,
including short-term and long-term rates. Short-term rates are important
for discounting, while long-term rates are important for prepayment
analysis.
2. A prepayment model is applied to every interest-rate path to project
prepayments and aggregated to describe the cash flows of the
mortgage-backed security.
3. The present values of the cash flows are calculated for each interest rate
path, using short-term forward rates plus an option-adjusted spread. This
option-adjusted spread is calculated through a number of iterations, as a
value which solves for the average of all present values of the MBS
equally to its market price.
Prepayment projections are extremely important for mortgage-backed security
valuation and analysis. These also depend on a number of factors, such as
interest-rate and macroeconomic environments, borrowers’ characteristics
(demographics, credit scores) and mortgage-specific features (coupon, loan type
and age, etc). With so many input variables, the prepayment model needs to be
flexible to capture the time-varying nature of key inputs and, at the same time, be
based on consistent fundamental assumptions, which can be applied across
mortgage types and borrower demographics.
A comprehensive prepayment model should be able to recognize various sources
of prepayments and their contributions to the overall prepayment rate. This leads
to a modelling framework where each prepayment type is modelled separately and
subsequently aggregated into the total projected prepayment rate. This approach
is beneficial, as it can be applied to all mortgage types across different regions and
countries, and it accounts for the dynamic nature of key input parameters.
The prepayment model, developed by Salomon Brothers in the 1980s, was the
first prepayment model in the industry, and has since become the market-wide
standard in MBS valuation. This type of models is used by the major US Broker
Dealers to support their mortgage trading, daily risk management and regulatory
reporting.
ftserussell.com 23
References Bernhardt, E., A. Kolbe and R. Zagst, 2013, Optimal Portfolios with Mortgage-
Backed Securities, The Journal of Real Estate Portfolio Management, Vol. 19,
No. 2, 121-136
Christiansen, W. A. and C. C. Elebash, 1987, A Note On the Attitude of Pension
Fund Investment Managers towards Mortgage-Backed Securities, The Journal of
Real Estate Research, Vol. 2, No. 1, 83-92
Diep P, A. L. Eisfeldt and S. Richardson, 2017, Prepayment Risk and Expected
MBS Returns, NBER Working Paper No. 22851
Fabozzi F. J., 2012, The Handbook of Fixed Income Securities, (McGraw-Hill,
New York)
Fabozzi F. J., 2016, The Handbook of Mortgage-Backed Securities, (Oxford
University Press)
Hayre, L. S. and R. Young, 2004, Guide to Mortgage-Backed Securities,
(Citigroup)
Hayre, L. S., R. Young, M. Teytel and K. Cheng, 2004, Anatomy of Prepayments,
(Citigroup)
Vickery J. and J. Wright, 2013, TBA Trading and Liquidity in the Agency MBS
Market, FRBNY Economic Policy Review
Zarkhin, M. and B. Rose, 2006, Introduction to CMOs and Mortgage Derivatives,
(Citigroup)
Sources Federal Housing Finance Agency website: www.fhfa.gov
FRED Economic Data website: https://fred.stlouisfed.org
Ginnie Mae Global Markets Analysis Report, August 2019
Securities Industry and Financial Markets Association (SIFMA) website:
www.sifma.org
U.S. Department of the Treasury website: https://home.treasury.gov
ftserussell.com 24
About FTSE Russell
FTSE Russell is a leading global provider of benchmarks, analytics and data solutions with multi-asset capabilities,
offering a precise view of the markets relevant to any investment process. For over 30 years, leading asset owners, asset
managers, ETF providers and investment banks have chosen FTSE Russell indexes to benchmark their investment
performance and create investment funds, ETFs, structured products and index-based derivatives. FTSE Russell indexes
also provide clients with tools for performance benchmarking, asset allocation, investment strategy analysis and risk
management.
About Yield Book
Yield Book by FTSE Russell is a trusted and authoritative source for fixed income analytics that enables market makers
and institutional investors to perform complex analysis of their portfolios, benchmarks, trading decisions, historical
performance, and risk. Yield Book products offer analytical insight into an extensive range of financial products in the fixed
income space including governments, agencies, corporates, high yield, emerging markets, mortgages, ABS, CMBS,
CMOs, and derivatives. The platform utilizes dedicated centralized servers that help ensure reliable, prompt data delivery.
For more information, contact us at [email protected] or visit our website: yieldbook.com
Americas
+1 646 989 2200
EMEA
+44 20 7334 8963
Asia-Pacific
Hong Kong +852 2164 3333
Tokyo +81 3 4563 6346
Taipei +866 2 8726 9778
© 2019 London Stock Exchange Group plc and its applicable group undertakings (the “LSE Group”). The LSE Group includes (1) FTSE International
Limited (“FTSE”), (2) Frank Russell Company (“Russell”), (3) FTSE Global Debt Capital Markets Inc. and FTSE Global Debt Capital Markets Limited
(together, “FTSE Canada”), (4) MTSNext Limited (“MTSNext”), (5) Mergent, Inc. (“Mergent”), (6) FTSE Fixed Income LLC (“FTSE FI”) and (7) The
Yield Book Inc (“YB”). All rights reserved.
FTSE Russell® is a trading name of FTSE, Russell, FTSE Canada, MTSNext, Mergent, FTSE FI, YB. “FTSE®”, “Russell®”, “FTSE Russell®”, “MTS®”,
“FTSE4Good®”, “ICB®”, “Mergent®”, “The Yield Book®” and all other trademarks and service marks used herein (whether registered or unregistered)
are trademarks and/or service marks owned or licensed by the applicable member of the LSE Group or their respective licensors and are owned, or
used under licence, by FTSE, Russell, MTSNext, FTSE Canada, Mergent, FTSE FI, YB. FTSE International Limited is authorised and regulated by
the Financial Conduct Authority as a benchmark administrator.
All information is provided for information purposes only. All information and data contained in this publication is obtained by the LSE Group, from
sources believed by it to be accurate and reliable. Because of the possibility of human and mechanical error as well as other factors, however, such
information and data is provided "as is" without warranty of any kind. No member of the LSE Group nor their respective directors, officers, employees,
partners or licensors make any claim, prediction, warranty or representation whatsoever, expressly or impliedly, either as to the accuracy, timeliness,
completeness, merchantability of any information or of results to be obtained from the use of the FTSE Russell Products or the fitness or suitability of
the FTSE Russell Products for any particular purpose to which they might be put. Any representation of historical data accessible through FTSE
Russell Products is provided for information purposes only and is not a reliable indicator of future performance.
No responsibility or liability can be accepted by any member of the LSE Group nor their respective directors, officers, employees, partners or licensors
for (a) any loss or damage in whole or in part caused by, resulting from, or relating to any error (negligent or otherwise) or other circumstance involved
in procuring, collecting, compiling, interpreting, analysing, editing, transcribing, transmitting, communicating or delivering any such information or data
or from use of this document or links to this document or (b) any direct, indirect, special, consequential or incidental damages whatsoever, even if any
member of the LSE Group is advised in advance of the possibility of such damages, resulting from the use of, or inability to use, such information.
No member of the LSE Group nor their respective directors, officers, employees, partners or licensors provide investment advice and nothing
contained in this document or accessible through FTSE Russell Products, including statistical data and industry reports, should be taken as
constituting financial or investment advice or a financial promotion.
Past performance is no guarantee of future results. Charts and graphs are provided for illustrative purposes only. Index returns shown may not
represent the results of the actual trading of investable assets. Certain returns shown may reflect back-tested performance. All performance presented
prior to the index inception date is back-tested performance. Back-tested performance is not actual performance, but is hypothetical. The back-test
calculations are based on the same methodology that was in effect when the index was officially launched. However, back- tested data may reflect the
application of the index methodology with the benefit of hindsight, and the historic calculations of an index may change from month to month based on
revisions to the underlying economic data used in the calculation of the index.
This publication may contain forward-looking assessments. These are based upon a number of assumptions concerning future conditions that
ultimately may prove to be inaccurate. Such forward-looking assessments are subject to risks and uncertainties and may be affected by various factors
that may cause actual results to differ materially. No member of the LSE Group nor their licensors assume any duty to and do not undertake to update
forward-looking assessments.
No part of this information may be reproduced, stored in a retrieval system or transmitted in any form or by any means, electronic, mechanical,
photocopying, recording or otherwise, without prior written permission of the applicable member of the LSE Group. Use and distribution of the LSE
Group data requires a licence from FTSE, Russell, FTSE Canada, MTSNext, Mergent, FTSE FI, YB and/or their respective licensors.