Insights on sysbench and custom benchmarks• both SQL and NoSQL (MongoDB, Tarantool) ... migrate to...
22
Insights on sysbench and custom benchmarks Alexey Kopytov, Martín Arrieta
Transcript of Insights on sysbench and custom benchmarks• both SQL and NoSQL (MongoDB, Tarantool) ... migrate to...
Insights on sysbench and custom benchmarks
Alexey Kopytov, Martín Arrieta
Agenda
• what is sysbench? • new features in recent and upcoming
releases • live demo!
Lead Database Consultant at Pythian,
Open Source enthusiast, developer by hobby.
sysbench maintainer since 2004. In the past: MySQL,
Percona Server, XtraBackup, XtraDB Cluster developer.
Who are we?

What is sysbench?
load generation tool
• MySQL / PostgreSQL • filesystem / disk
• CPU • RAM
extensible with Lua scripts
Default targets:

What is sysbench?easy to install and setup:$ apt -y install sysbench $ sysbench oltp_read_write prepare $ sysbench oltp_read_write run
used by:
• leading MySQL performance experts • QA teams • myself

Tstart = get_time()
do_something()
Tdelta = get_time() − Tstart
+ + i > MAX?
aggregate()
workload
What all benchmarks do
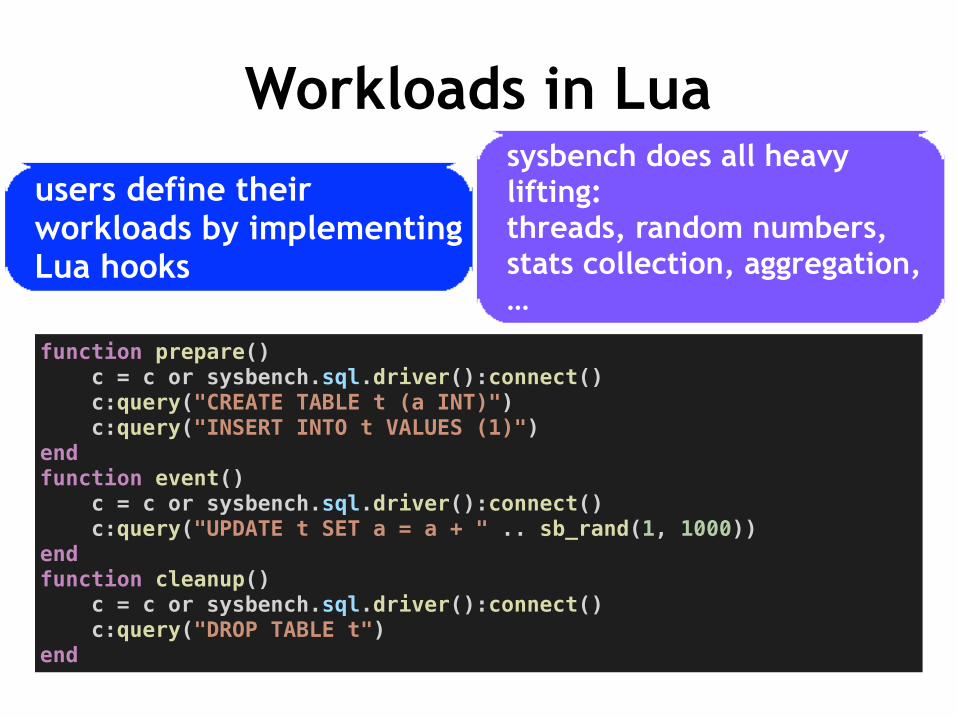
Workloads in Lua
users define their workloads by implementing Lua hooks
sysbench does all heavy lifting: threads, random numbers, stats collection, aggregation, …
function prepare() c = c or sysbench.sql.driver():connect() c:query("CREATE TABLE t (a INT)") c:query("INSERT INTO t VALUES (1)") end function event() c = c or sysbench.sql.driver():connect() c:query("UPDATE t SET a = a + " .. sb_rand(1, 1000)) end function cleanup() c = c or sysbench.sql.driver():connect() c:query("DROP TABLE t") end

Why Lua?
the "speed queen" of dynamic languages
designed to be embedded into C/C++ applications
simple and elegant, but powerful
LuaJIT = minimal overhead + FFI library
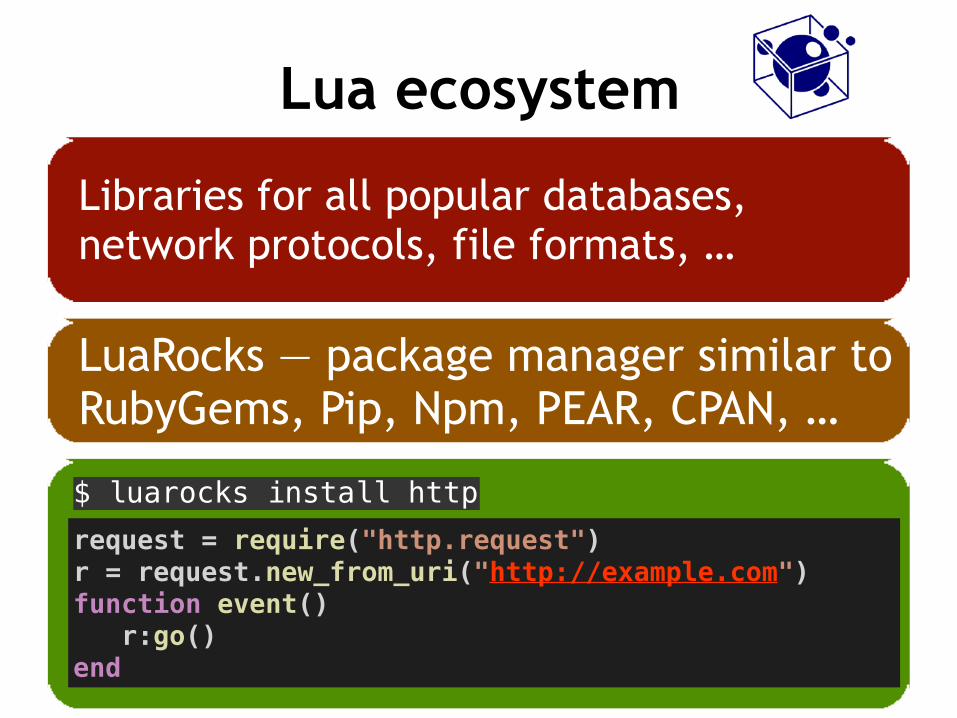
Lua ecosystem
Libraries for all popular databases, network protocols, file formats, …
$ luarocks install httprequest = require("http.request") r = request.new_from_uri("http://example.com") function event() r:go() end
LuaRocks — package manager similar to RubyGems, Pip, Npm, PEAR, CPAN, …
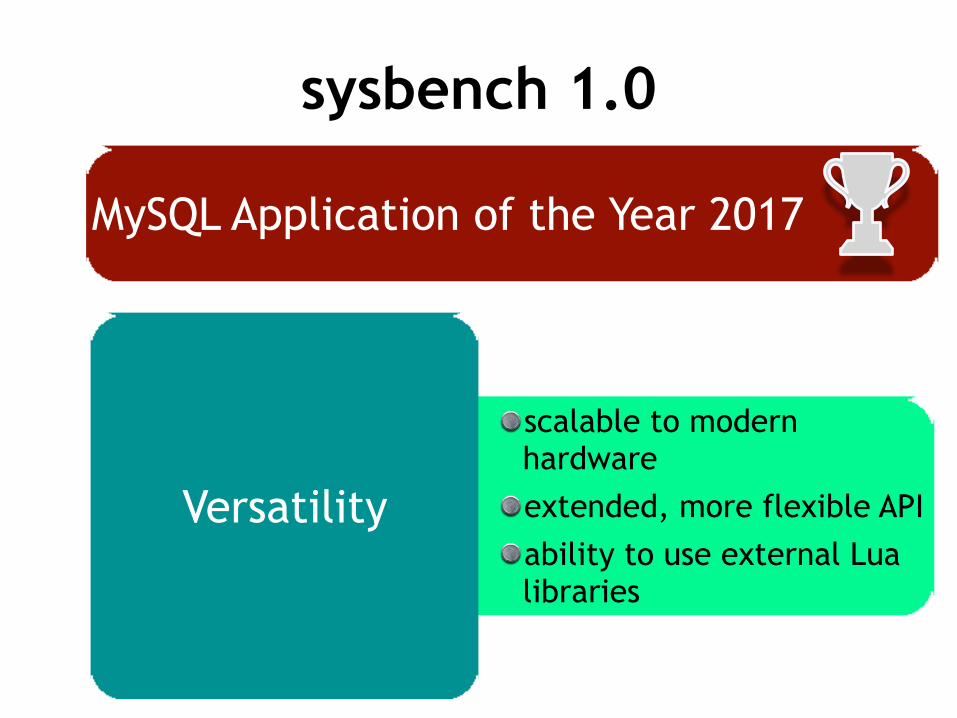
sysbench 1.0
scalable to modern hardware extended, more flexible API ability to use external Lua libraries
Versatility
MySQL Application of the Year 2017
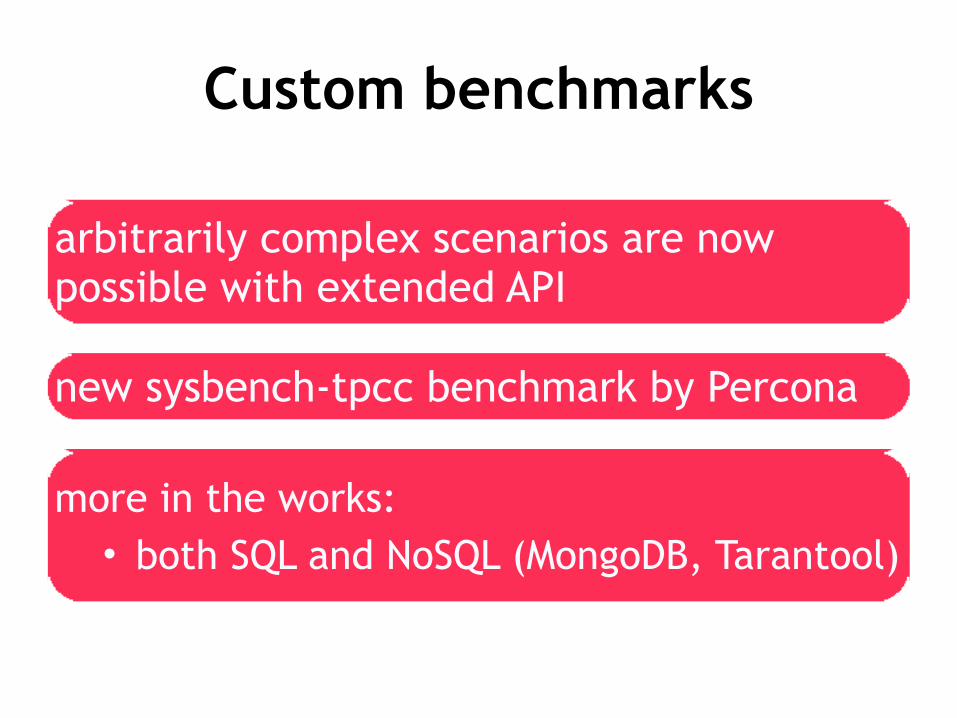
Custom benchmarks
arbitrarily complex scenarios are now possible with extended API
new sysbench-tpcc benchmark by Percona
more in the works: • both SQL and NoSQL (MongoDB, Tarantool)
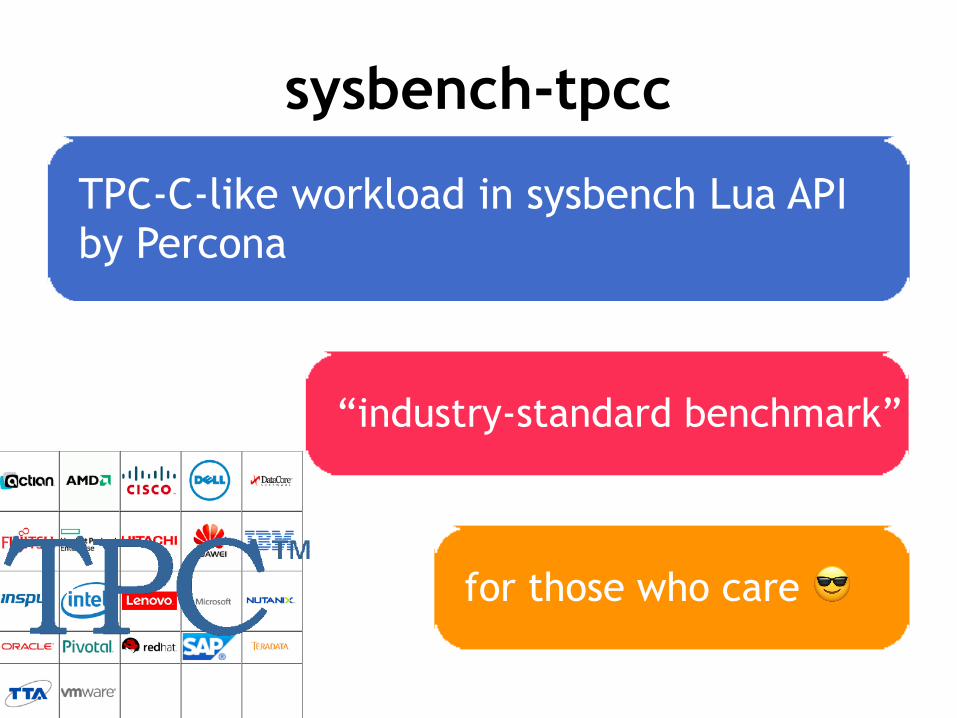
sysbench-tpcc
“industry-standard benchmark”
TPC-C-like workload in sysbench Lua API by Percona
for those who care 😎

Why implement your own benchmark?
No benchmark is perfect
Simulating your specific applications/workload will give more relevant results
Can benchmark any part of the stack (SQL/HTTP/application servers or microbenchmarks)

Microbenchmark examplesyscall.lua
ffi.cdef("long syscall(long, long, long, long);") function event() ffi.C.syscall(0, 0, 0, 0) end
$ sysbench syscall.lua run
Running the test with following options: Number of threads: 1 Initializing random number generator from current time
Initializing worker threads...
Threads started!
Throughput: events/s (eps): 5046112.7918 time elapsed: 10.0002s total number of events: 50462252

load doubles during holiday season
move database to new hardware / cloud instance
change this configuration parameter
upgrade database version
migrate to another DB vendor

sysbench tuneautomated OS/hardware tuning for stable, consistent and reproducible results
$ sysbench tune list
mysqlbench Tune system for MySQL benchmarks
$ sysbench tune apply --profile=mysqlbench
Applying profile mysqlbench... vm.swappiness = 1 net.ipv4.tcp_max_syn_backlog = 4096 net.core.somaxconn = 4096 kernel.sched_autogroup_enabled = 0 kernel.sched_min_granularity_ns = 5000000 kernel.numa_balancing = 0 kernel.randomize_va_space = 0 . . .
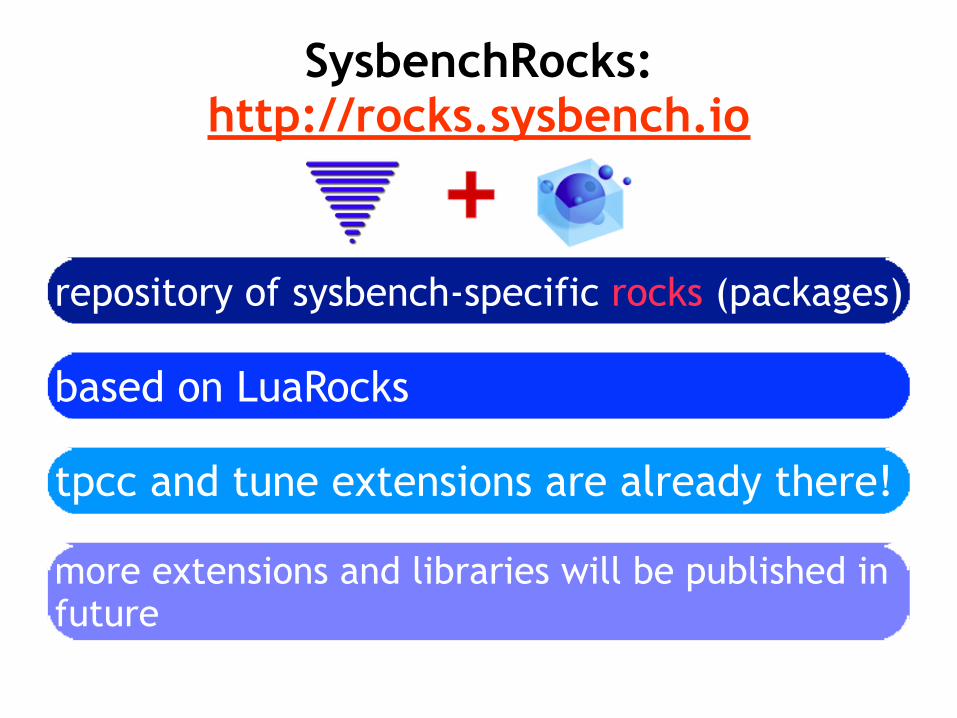
SysbenchRocks: http://rocks.sysbench.io
based on LuaRocks
tpcc and tune extensions are already there!
more extensions and libraries will be published in future
repository of sysbench-specific rocks (packages)
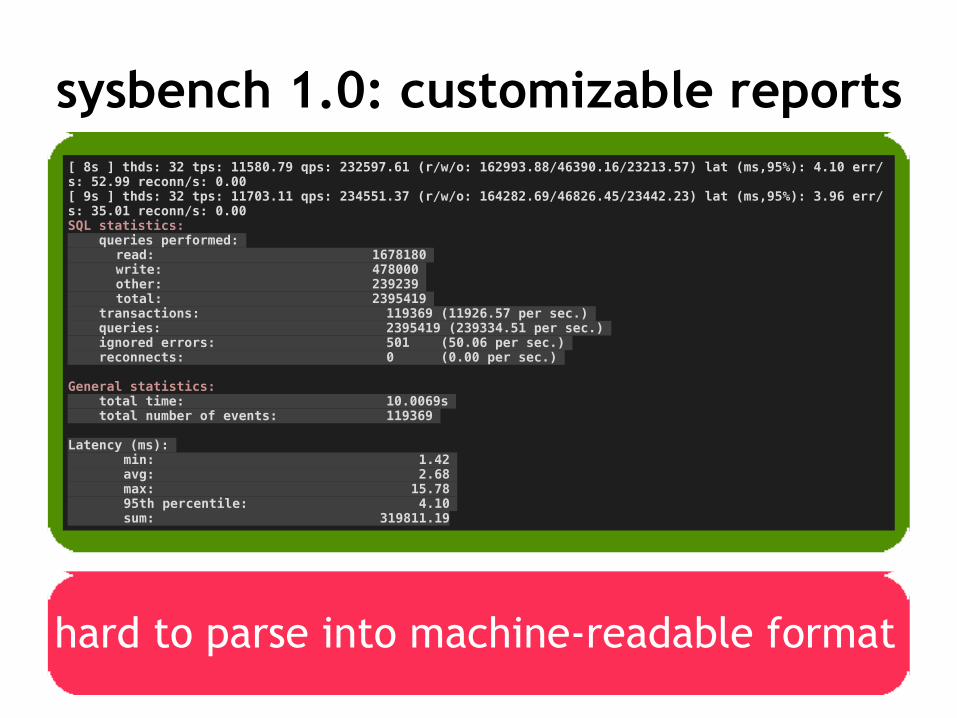
sysbench 1.0: customizable reports[ 8s ] thds: 32 tps: 11580.79 qps: 232597.61 (r/w/o: 162993.88/46390.16/23213.57) lat (ms,95%): 4.10 err/s: 52.99 reconn/s: 0.00 [ 9s ] thds: 32 tps: 11703.11 qps: 234551.37 (r/w/o: 164282.69/46826.45/23442.23) lat (ms,95%): 3.96 err/s: 35.01 reconn/s: 0.00 SQL statistics: queries performed: read: 1678180 write: 478000 other: 239239 total: 2395419 transactions: 119369 (11926.57 per sec.) queries: 2395419 (239334.51 per sec.) ignored errors: 501 (50.06 per sec.) reconnects: 0 (0.00 per sec.)
General statistics: total time: 10.0069s total number of events: 119369
Latency (ms): min: 1.42 avg: 2.68 max: 15.78 95th percentile: 4.10 sum: 319811.19
hard to parse into machine-readable format
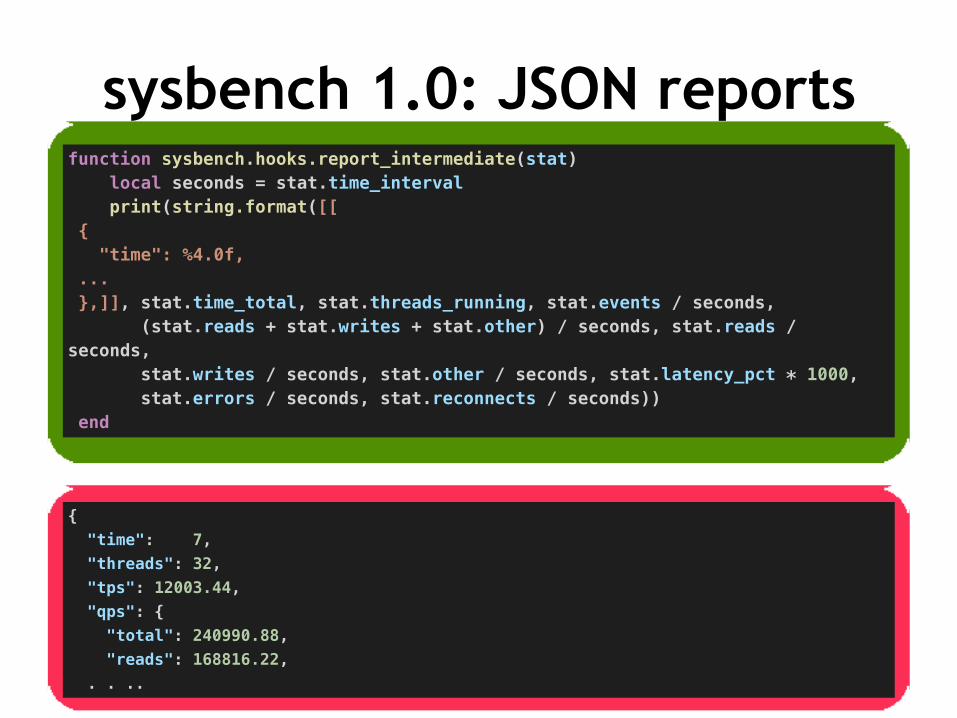
sysbench 1.0: JSON reportsfunction sysbench.hooks.report_intermediate(stat) local seconds = stat.time_interval print(string.format([[ { "time": %4.0f, ... },]], stat.time_total, stat.threads_running, stat.events / seconds, (stat.reads + stat.writes + stat.other) / seconds, stat.reads / seconds, stat.writes / seconds, stat.other / seconds, stat.latency_pct * 1000, stat.errors / seconds, stat.reconnects / seconds)) end
{ "time": 7, "threads": 32, "tps": 12003.44, "qps": { "total": 240990.88, "reads": 168816.22, . . ..
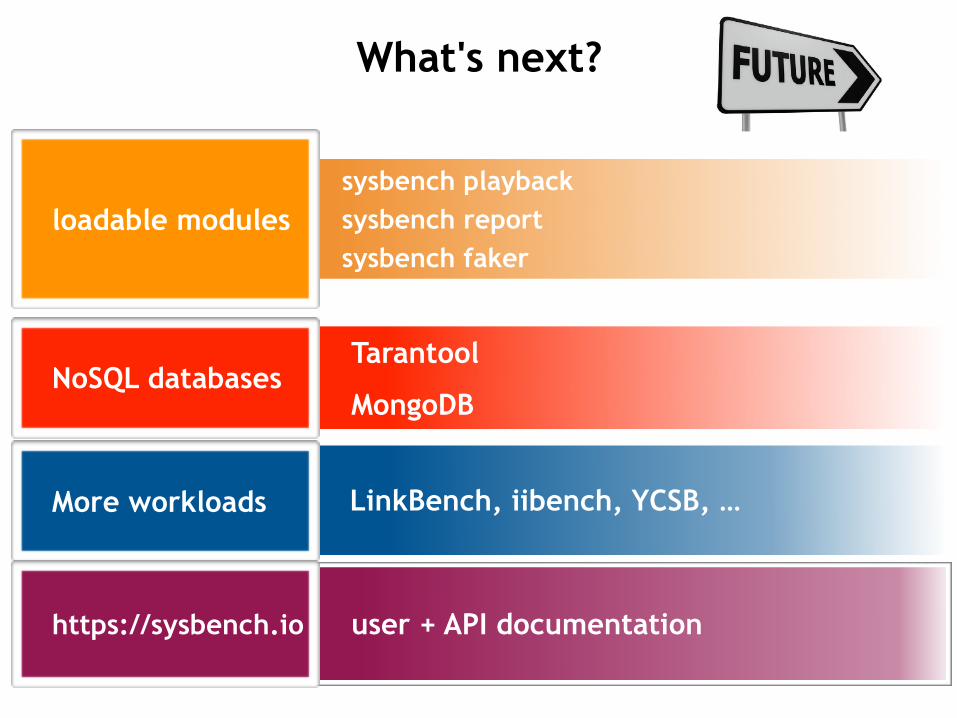
LinkBench, iibench, YCSB, …More workloads
What's next?
sysbench fakersysbench reportsysbench playback
MongoDB
TarantoolNoSQL databases
loadable modules
user + API documentationhttps://sysbench.io
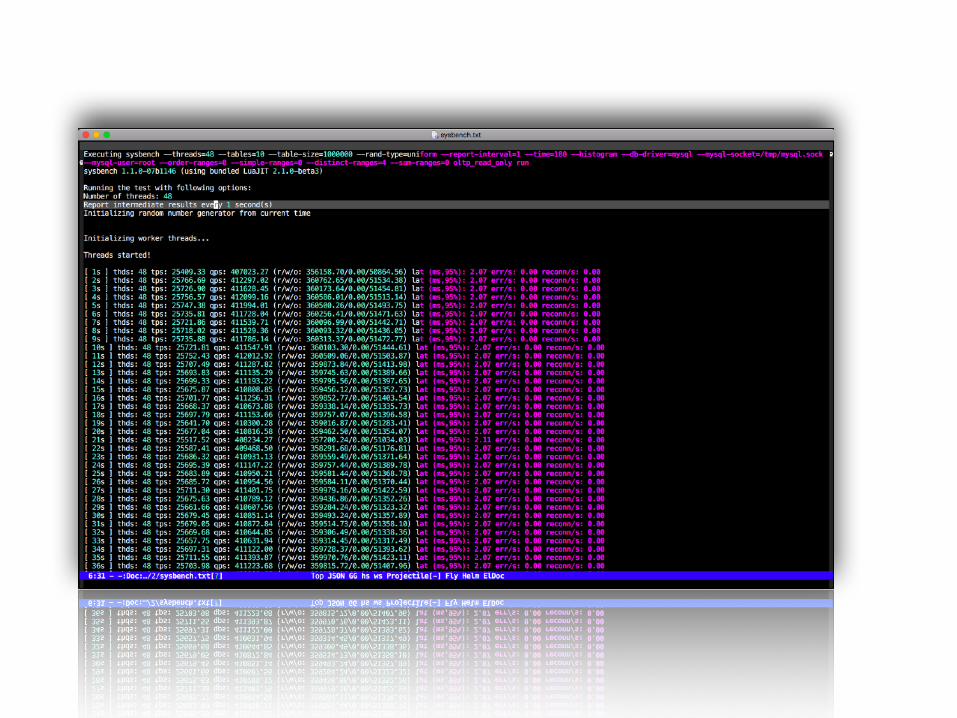
Live Demo!
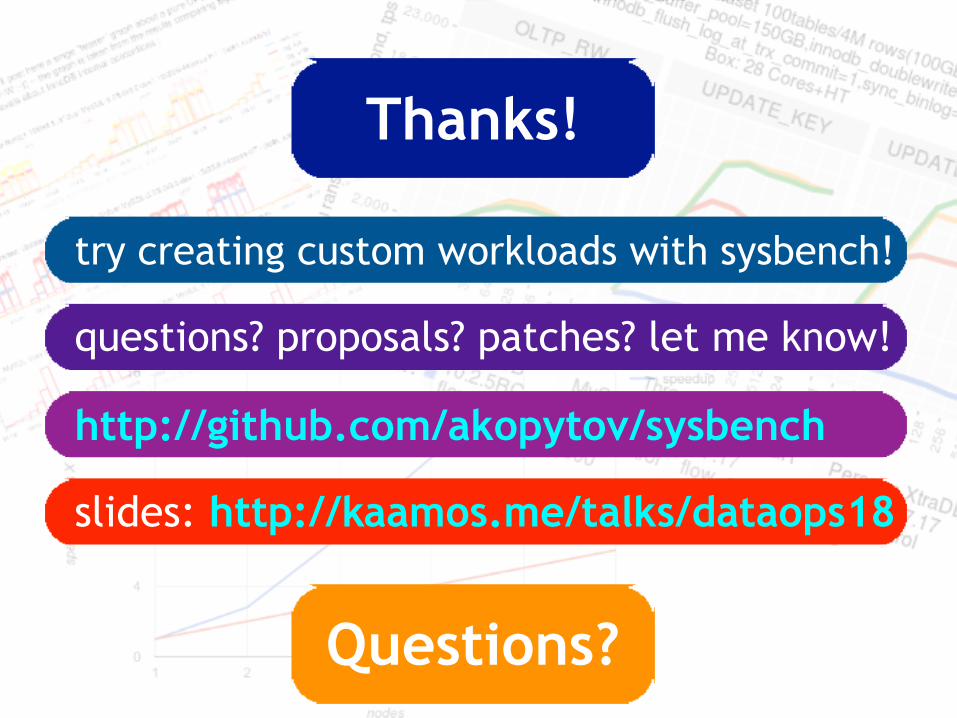
Thanks!
questions? proposals? patches? let me know!
http://github.com/akopytov/sysbench
slides: http://kaamos.me/talks/dataops18
try creating custom workloads with sysbench!
Questions?