Insights into brain microstructure from the T2 distribution
11
Insights into brain microstructure from the T 2 distribution Alex MacKay a,b, 4 , Cornelia Laule a , Irene Vavasour a , Thorarin Bjarnason b,1 , Shannon Kolind b , Burkhard M7dler c a Department of Radiology, University of British Columbia, Vancouver, BC, Canada b Department of Physics and Astronomy, University of British Columbia, Vancouver, BC, Canada c Philips Medical Systems, Vancouver, British Columbia, BC, Canada Received 2 December 2005; accepted 2 December 2005 Abstract T 2 weighting is particularly sensitive, but notoriously unspecific, to a wide range of brain pathologies. However, careful measurement and analysis of the T 2 decay curve from brain tissue promise to provide much improved pathological specificity. In vivo T 2 measurement requires accurate 180 pulses and appropriate manipulation of stimulated echoes; the most common approach is to acquire multiple echoes from a single slice. The T 2 distribution, a plot of component amplitude as a function of T 2 , can be estimated using an algorithm capable of fitting a multi-exponential T 2 decay with no a priori assumptions about the number of exponential components. T 2 distributions from normal brain show peaks from myelin water, intra/extracellular water and cerebral spinal fluid; they can be used to provide estimates of total water content (total area under the T 2 distribution) and myelin water fraction (MWF, fractional area under the myelin water peak), a measure believed to be related to myelin content. Experiments on bovine brain suggest that magnetization exchange between water pools plays a minor role in the T 2 distribution. Different white matter structures have different MWFs. In normal white matter (NWM), MWF is not correlated with the magnetization transfer ratio (MTR) or the diffusion tensor fractional anisotropy (FA); hence it provides unique information about brain microstructure. Normal-appearing white matter (NAWM) in multiple sclerosis (MS) brain possesses a higher water content and lower MWF than controls, consistent with histopathological findings. Multiple sclerosis lesions demonstrate great heterogeneity in MWF, presumably due to varying myelin contents of these focal regions of pathology. Subjects with schizophrenia were found to have significantly reduced MWF in the minor forceps and genu of the corpus callosum when compared to controls, suggesting that reduced frontal lobe myelination plays a role in schizophrenia. In normal controls, frontal lobe myelination was positively correlated with both age and education; this result was not observed in subjects with schizophrenia. A strong correlation between MWF and the optical density from the luxol fast blue histological stain for myelin was observed in formalin- fixed brain, supporting the use of the MWF as an in vivo myelin marker. D 2006 Elsevier Inc. All rights reserved. Keywords: Brain microstructure; Myelin water fraction; T 2 Distribution 1. Introduction T 2 plays a role in almost every aspect of medical magnetic resonance. From the early days, it was clear that clinical T 2 -weighted images were exquisitely sensitive to brain pathology, giving rise to much optimism that T 2 relaxation would lead to pathological specificity. However, in spite of a great deal of research, pathological specificity from T 2 was not realised [1] for a number of reasons; the most important being that conventional MRI techniques like proton density, T 1 and T 2 weighting are qualitative in a clinical setting. The most specific MR techniques are tuned solely to study the spin species of interest. For example, in 1 H MR spectroscopy the signals from individual brain metabolites ( b 0.1% of the total signal) can be measured by using water suppression and taking advantage of the chemical shift. In fMRI, the signal from capillary blood (approximately 4% of 0730-725X/$ – see front matter D 2006 Elsevier Inc. All rights reserved. doi:10.1016/j.mri.2005.12.037 4 Corresponding author. Department of Physics and Astronomy, University of British Columbia, Vancouver, Canada V6T 1Z1. E-mail address: [email protected] (A. MacKay). 1 Currently at the Department of Electrical Engineering, University of Calgary, Calgary, Alberta, Canada. Magnetic Resonance Imaging 24 (2006) 515 – 525
-
Upload
alex-mackay -
Category
Documents
-
view
226 -
download
1
Transcript of Insights into brain microstructure from the T2 distribution
Magnetic Resonance Im
Insights into brain microstructure from the T2 distribution
Alex MacKaya,b,4, Cornelia Laulea, Irene Vavasoura, Thorarin Bjarnasonb,1,
Shannon Kolindb, Burkhard M7dlercaDepartment of Radiology, University of British Columbia, Vancouver, BC, Canada
bDepartment of Physics and Astronomy, University of British Columbia, Vancouver, BC, CanadacPhilips Medical Systems, Vancouver, British Columbia, BC, Canada
Received 2 December 2005; accepted 2 December 2005
Abstract
T2 weighting is particularly sensitive, but notoriously unspecific, to a wide range of brain pathologies. However, careful measurement and
analysis of the T2 decay curve from brain tissue promise to provide much improved pathological specificity. In vivo T2 measurement requires
accurate 180 pulses and appropriate manipulation of stimulated echoes; the most common approach is to acquire multiple echoes from a
single slice. The T2 distribution, a plot of component amplitude as a function of T2, can be estimated using an algorithm capable of fitting a
multi-exponential T2 decay with no a priori assumptions about the number of exponential components. T2 distributions from normal brain
show peaks from myelin water, intra/extracellular water and cerebral spinal fluid; they can be used to provide estimates of total water content
(total area under the T2 distribution) and myelin water fraction (MWF, fractional area under the myelin water peak), a measure believed to be
related to myelin content. Experiments on bovine brain suggest that magnetization exchange between water pools plays a minor role in the T2
distribution.
Different white matter structures have different MWFs. In normal white matter (NWM), MWF is not correlated with the magnetization
transfer ratio (MTR) or the diffusion tensor fractional anisotropy (FA); hence it provides unique information about brain microstructure.
Normal-appearing white matter (NAWM) in multiple sclerosis (MS) brain possesses a higher water content and lower MWF than controls,
consistent with histopathological findings. Multiple sclerosis lesions demonstrate great heterogeneity in MWF, presumably due to varying
myelin contents of these focal regions of pathology. Subjects with schizophrenia were found to have significantly reduced MWF in the minor
forceps and genu of the corpus callosum when compared to controls, suggesting that reduced frontal lobe myelination plays a role in
schizophrenia. In normal controls, frontal lobe myelination was positively correlated with both age and education; this result was not
observed in subjects with schizophrenia.
A strong correlation between MWF and the optical density from the luxol fast blue histological stain for myelin was observed in formalin-
fixed brain, supporting the use of the MWF as an in vivo myelin marker.
D 2006 Elsevier Inc. All rights reserved.
Keywords: Brain microstructure; Myelin water fraction; T2 Distribution
1. Introduction
T2 plays a role in almost every aspect of medical
magnetic resonance. From the early days, it was clear that
clinical T2-weighted images were exquisitely sensitive to
brain pathology, giving rise to much optimism that T2
0730-725X/$ – see front matter D 2006 Elsevier Inc. All rights reserved.
doi:10.1016/j.mri.2005.12.037
4 Corresponding author. Department of Physics and Astronomy,
University of British Columbia, Vancouver, Canada V6T 1Z1.
E-mail address: [email protected] (A. MacKay).1 Currently at the Department of Electrical Engineering, University of
Calgary, Calgary, Alberta, Canada.
relaxation would lead to pathological specificity. However,
in spite of a great deal of research, pathological specificity
from T2 was not realised [1] for a number of reasons; the
most important being that conventional MRI techniques like
proton density, T1 and T2 weighting are qualitative in a
clinical setting.
The most specific MR techniques are tuned solely to
study the spin species of interest. For example, in 1H MR
spectroscopy the signals from individual brain metabolites
(b0.1% of the total signal) can be measured by using water
suppression and taking advantage of the chemical shift. In
fMRI, the signal from capillary blood (approximately 4% of
aging 24 (2006) 515–525
A. MacKay et al. / Magnetic Resonance Imaging 24 (2006) 515–525516
the grey matter volume) can be separated from that of other
tissue water by virtue of changes in blood T2* caused by
oxygenation changes.
The total 1H magnetic resonance signal from brain
includes contributions from protons in water as well as
nonaqueous protons in molecules such as lipids, proteins
and nucleic acids. The signal of water in tissue has T2 times
longer than 10 ms, while the nonaqueous proton signal
decays to zero in less than 100 As due to large unaveraged
dipolar couplings between adjacent protons [2–4]. Conse-
quently, it is relatively easy to measure the MR signal from
water in brain with no contamination from the fast decaying
nonaqueous tissue signal.
Pure water has a T2 of about 3 s. Water in brain
undergoes much faster T2 relaxation rates; the degree of T2
shortening depending on interactions between water and
nonaqueous tissue. A homogeneous volume, such as a glass
of pure water, gives rise to monoexponential T2 relaxation.
However, brain tissue is inhomogeneous, not only at the
grey/white matter spatial level of 1 to 100 mm, but also at
the cellular spatial level on the order of 1 to 10 Am.
Furthermore, due to Brownian motion, water moves several
micrometers each millisecond due to self-diffusion.
Pathological changes observed in neurodegenerative
diseases include edema (increased intra- or extracellular
water), blood–brain barrier breakdown (tight junction
leakage), inflammation (proliferation of inflammatory cells),
demyelination (breakdown of the myelin sheath), gliosis
(proliferation of glial cells) and axonal loss (breakdown of
the axon). The extent to which these pathologies can be
distinguished by MRI depends upon whether they have a
unique impact on the proton NMR signal; if these
pathological changes affect the organisation of nonaqueous
molecules in cellular structures, water T2 relaxation should
also be affected. It is therefore very challenging to relate T2
relaxation directly to brain microstructure. A model for T2
relaxation in brain must take into account both tissue
architecture and the extent of water diffusion over the
relevant timescales.
This review discusses how in vivo T2 relaxation can
provide specific information about brain anatomy and
pathology. There is particular emphasis on T2 relaxation
pulse sequences and analysis techniques, on the interpreta-
tion of T2 components as water reservoirs, as well as
comparisons with results from other nonconventional MR
techniques. Results are presented from normal volunteers
and people with multiple sclerosis (MS) and schizophrenia.
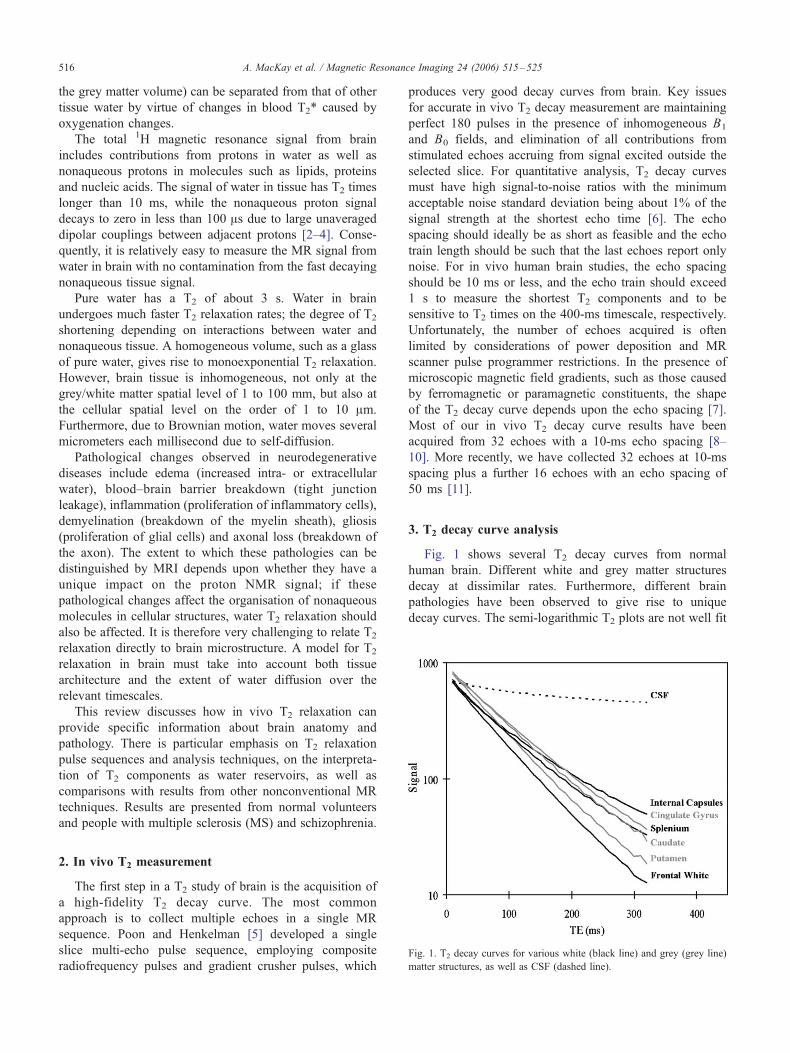
Fig. 1. T2 decay curves for various white (black line) and grey (grey line)
matter structures, as well as CSF (dashed line).
2. In vivo T2 measurement
The first step in a T2 study of brain is the acquisition of
a high-fidelity T2 decay curve. The most common
approach is to collect multiple echoes in a single MR
sequence. Poon and Henkelman [5] developed a single
slice multi-echo pulse sequence, employing composite
radiofrequency pulses and gradient crusher pulses, which
produces very good decay curves from brain. Key issues
for accurate in vivo T2 decay measurement are maintaining
perfect 180 pulses in the presence of inhomogeneous B1
and B0 fields, and elimination of all contributions from
stimulated echoes accruing from signal excited outside the
selected slice. For quantitative analysis, T2 decay curves
must have high signal-to-noise ratios with the minimum
acceptable noise standard deviation being about 1% of the
signal strength at the shortest echo time [6]. The echo
spacing should ideally be as short as feasible and the echo
train length should be such that the last echoes report only
noise. For in vivo human brain studies, the echo spacing
should be 10 ms or less, and the echo train should exceed
1 s to measure the shortest T2 components and to be
sensitive to T2 times on the 400-ms timescale, respectively.
Unfortunately, the number of echoes acquired is often
limited by considerations of power deposition and MR
scanner pulse programmer restrictions. In the presence of
microscopic magnetic field gradients, such as those caused
by ferromagnetic or paramagnetic constituents, the shape
of the T2 decay curve depends upon the echo spacing [7].
Most of our in vivo T2 decay curve results have been
acquired from 32 echoes with a 10-ms echo spacing [8–
10]. More recently, we have collected 32 echoes at 10-ms
spacing plus a further 16 echoes with an echo spacing of
50 ms [11].
3. T2 decay curve analysis
Fig. 1 shows several T2 decay curves from normal
human brain. Different white and grey matter structures
decay at dissimilar rates. Furthermore, different brain
pathologies have been observed to give rise to unique
decay curves. The semi-logarithmic T2 plots are not well fit
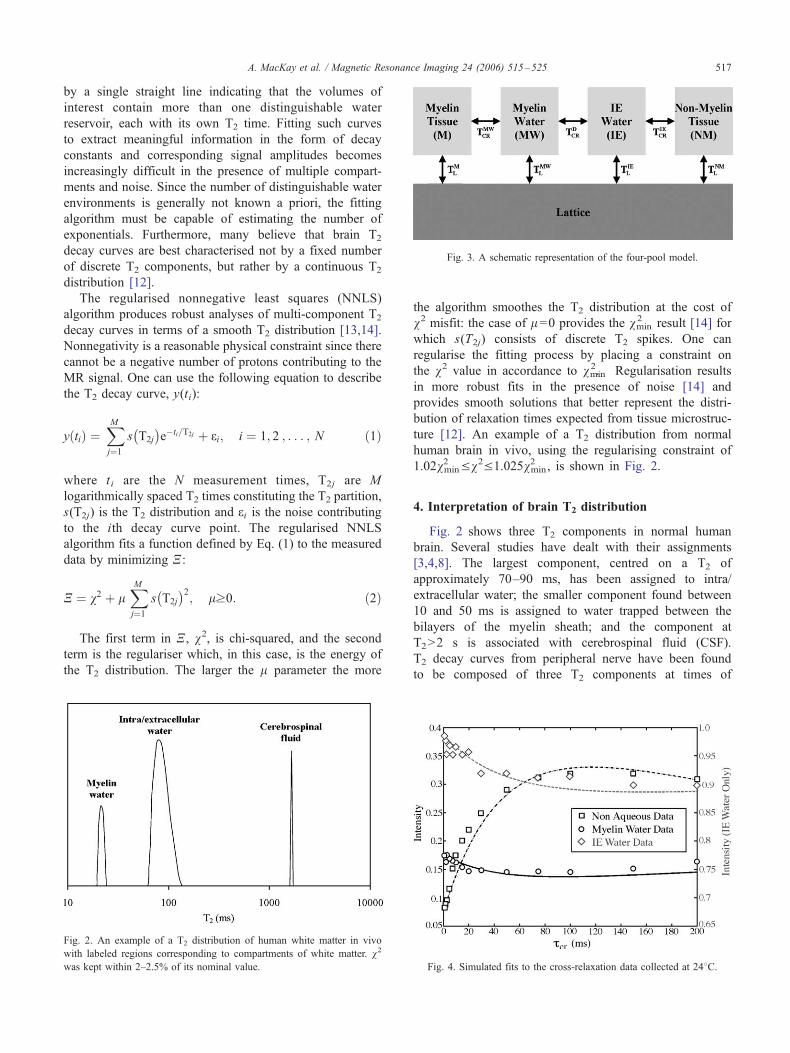
Fig. 3. A schematic representation of the four-pool model.
A. MacKay et al. / Magnetic Resonance Imaging 24 (2006) 515–525 517
by a single straight line indicating that the volumes of
interest contain more than one distinguishable water
reservoir, each with its own T2 time. Fitting such curves
to extract meaningful information in the form of decay
constants and corresponding signal amplitudes becomes
increasingly difficult in the presence of multiple compart-
ments and noise. Since the number of distinguishable water
environments is generally not known a priori, the fitting
algorithm must be capable of estimating the number of
exponentials. Furthermore, many believe that brain T2
decay curves are best characterised not by a fixed number
of discrete T2 components, but rather by a continuous T2
distribution [12].
The regularised nonnegative least squares (NNLS)
algorithm produces robust analyses of multi-component T2
decay curves in terms of a smooth T2 distribution [13,14].
Nonnegativity is a reasonable physical constraint since there
cannot be a negative number of protons contributing to the
MR signal. One can use the following equation to describe
the T2 decay curve, y(ti):
y tið Þ ¼XM
j¼1
s T2j
� �e�ti=T2j þ Ei; i ¼ 1; 2 ; : : : ; N ð1Þ
where t i are the N measurement times, T2j are M
logarithmically spaced T2 times constituting the T2 partition,
s(T2j) is the T2 distribution and Ei is the noise contributing
to the ith decay curve point. The regularised NNLS
algorithm fits a function defined by Eq. (1) to the measured
data by minimizing N:
N ¼ v2 þ lXM
j¼1
s T2j
� �2; lz0: ð2Þ
The first term in N, v2, is chi-squared, and the second
term is the regulariser which, in this case, is the energy of
the T2 distribution. The larger the l parameter the more
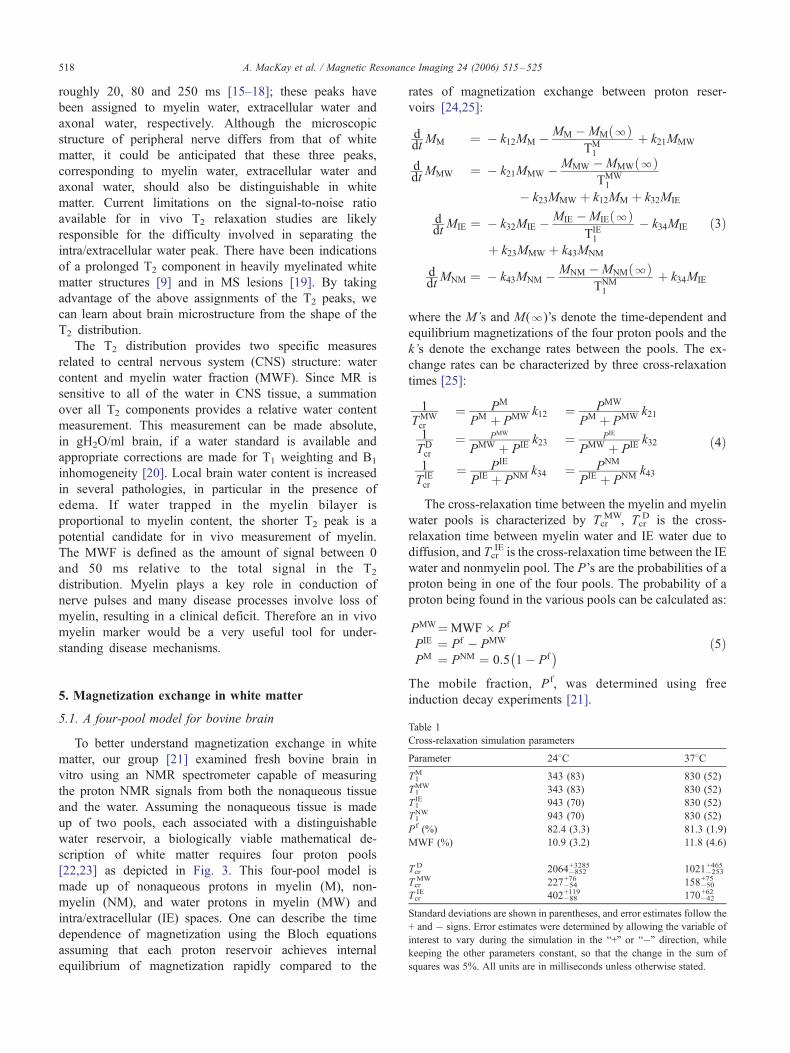
Fig. 2. An example of a T2 distribution of human white matter in vivo
with labeled regions corresponding to compartments of white matter. v2
was kept within 2–2.5% of its nominal value.
the algorithm smoothes the T2 distribution at the cost of
v2 misfit: the case of l=0 provides the vmin2 result [14] for
which s(T2j) consists of discrete T2 spikes. One can
regularise the fitting process by placing a constraint on
the v2 value in accordance to vmin2. Regularisation results
in more robust fits in the presence of noise [14] and
provides smooth solutions that better represent the distri-
bution of relaxation times expected from tissue microstruc-
ture [12]. An example of a T2 distribution from normal
human brain in vivo, using the regularising constraint of
1.02vmin2 Vv2V1.025vmin
2 , is shown in Fig. 2.
4. Interpretation of brain T2 distribution
Fig. 2 shows three T2 components in normal human
brain. Several studies have dealt with their assignments
[3,4,8]. The largest component, centred on a T2 of
approximately 70–90 ms, has been assigned to intra/
extracellular water; the smaller component found between
10 and 50 ms is assigned to water trapped between the
bilayers of the myelin sheath; and the component at
T2N2 s is associated with cerebrospinal fluid (CSF).
T2 decay curves from peripheral nerve have been found
to be composed of three T2 components at times of
Fig. 4. Simulated fits to the cross-relaxation data collected at 248C.
A. MacKay et al. / Magnetic Resonance Imaging 24 (2006) 515–525518
roughly 20, 80 and 250 ms [15–18]; these peaks have
been assigned to myelin water, extracellular water and
axonal water, respectively. Although the microscopic
structure of peripheral nerve differs from that of white
matter, it could be anticipated that these three peaks,
corresponding to myelin water, extracellular water and
axonal water, should also be distinguishable in white
matter. Current limitations on the signal-to-noise ratio
available for in vivo T2 relaxation studies are likely
responsible for the difficulty involved in separating the
intra/extracellular water peak. There have been indications
of a prolonged T2 component in heavily myelinated white
matter structures [9] and in MS lesions [19]. By taking
advantage of the above assignments of the T2 peaks, we
can learn about brain microstructure from the shape of the
T2 distribution.
The T2 distribution provides two specific measures
related to central nervous system (CNS) structure: water
content and myelin water fraction (MWF). Since MR is
sensitive to all of the water in CNS tissue, a summation
over all T2 components provides a relative water content
measurement. This measurement can be made absolute,
in gH2O/ml brain, if a water standard is available and
appropriate corrections are made for T1 weighting and B1
inhomogeneity [20]. Local brain water content is increased
in several pathologies, in particular in the presence of
edema. If water trapped in the myelin bilayer is
proportional to myelin content, the shorter T2 peak is a
potential candidate for in vivo measurement of myelin.
The MWF is defined as the amount of signal between 0
and 50 ms relative to the total signal in the T2
distribution. Myelin plays a key role in conduction of
nerve pulses and many disease processes involve loss of
myelin, resulting in a clinical deficit. Therefore an in vivo
myelin marker would be a very useful tool for under-
standing disease mechanisms.
Table 1
Cross-relaxation simulation parameters
Parameter 248C 378C
T1M 343 (83) 830 (52)
T1MW 343 (83) 830 (52)
T1IE 943 (70) 830 (52)
T1NW 943 (70) 830 (52)
Pf (%) 82.4 (3.3) 81.3 (1.9)
MWF (%) 10.9 (3.2) 11.8 (4.6)
TcrD 2064�852
+3285 1021�253+465
TcrMW 227�54
+76 158�50+75
TcrIE 402�88
+119 170�42+62
Standard deviations are shown in parentheses, and error estimates follow the
+ and � signs. Error estimates were determined by allowing the variable of
interest to vary during the simulation in the b+Q or b�Q direction, whilekeeping the other parameters constant, so that the change in the sum of
squares was 5%. All units are in milliseconds unless otherwise stated.
5. Magnetization exchange in white matter
5.1. A four-pool model for bovine brain
To better understand magnetization exchange in white
matter, our group [21] examined fresh bovine brain in
vitro using an NMR spectrometer capable of measuring
the proton NMR signals from both the nonaqueous tissue
and the water. Assuming the nonaqueous tissue is made
up of two pools, each associated with a distinguishable
water reservoir, a biologically viable mathematical de-
scription of white matter requires four proton pools
[22,23] as depicted in Fig. 3. This four-pool model is
made up of nonaqueous protons in myelin (M), non-
myelin (NM), and water protons in myelin (MW) and
intra/extracellular (IE) spaces. One can describe the time
dependence of magnetization using the Bloch equations
assuming that each proton reservoir achieves internal
equilibrium of magnetization rapidly compared to the
rates of magnetization exchange between proton reser-
voirs [24,25]:
ddt
MM ¼ � k12MM � MM �MM lð ÞTM1
þ k21MMW
ddt
MMW ¼ � k21MMW � MMW �MMW lð ÞTMW1
� k23MMW þ k12MM þ k32MIE
ddt
MIE ¼ � k32MIE � MIE �MIE lð ÞTIE1
� k34MIE
þ k23MMW þ k43MNM
ddt
MNM ¼ � k43MNM � MNM �MNM lð ÞTNM1
þ k34MIE
ð3Þ
where the M’s and M(l)’s denote the time-dependent and
equilibrium magnetizations of the four proton pools and the
k’s denote the exchange rates between the pools. The ex-
change rates can be characterized by three cross-relaxation
times [25]:
1TMWcr
¼ PM
PM þ PMW k12 ¼ PMW
PM þ PMW k21
1TDcr
¼ PMW
PMW þ PIE k23 ¼ PIE
PMW þ PIE k32
1T IEcr
¼ PIE
PIE þ PNM k34 ¼ PNM
PIE þ PNM k43
ð4Þ
The cross-relaxation time between the myelin and myelin
water pools is characterized by TcrMW, Tcr
D is the cross-
relaxation time between myelin water and IE water due to
diffusion, and TcrIE is the cross-relaxation time between the IE
water and nonmyelin pool. The P’s are the probabilities of a
proton being in one of the four pools. The probability of a
proton being found in the various pools can be calculated as:
PMW¼MWF � Pf
PIE ¼ Pf � PMW
PM ¼ PNM ¼ 0:5 1� Pf�� ð5Þ
The mobile fraction, P f, was determined using free
induction decay experiments [21].
ig. 6. Relation between diffusion fractional anisotropy and MWF in
ormal white matter. A significant correlation is seen (R2= .6), although
ecific brain regions systematically fall outside the linear relationship.
ig. 7. Relation between MTR and MWF in normal white matter. The poor
orrelation is quantified by a low R2 (.05).
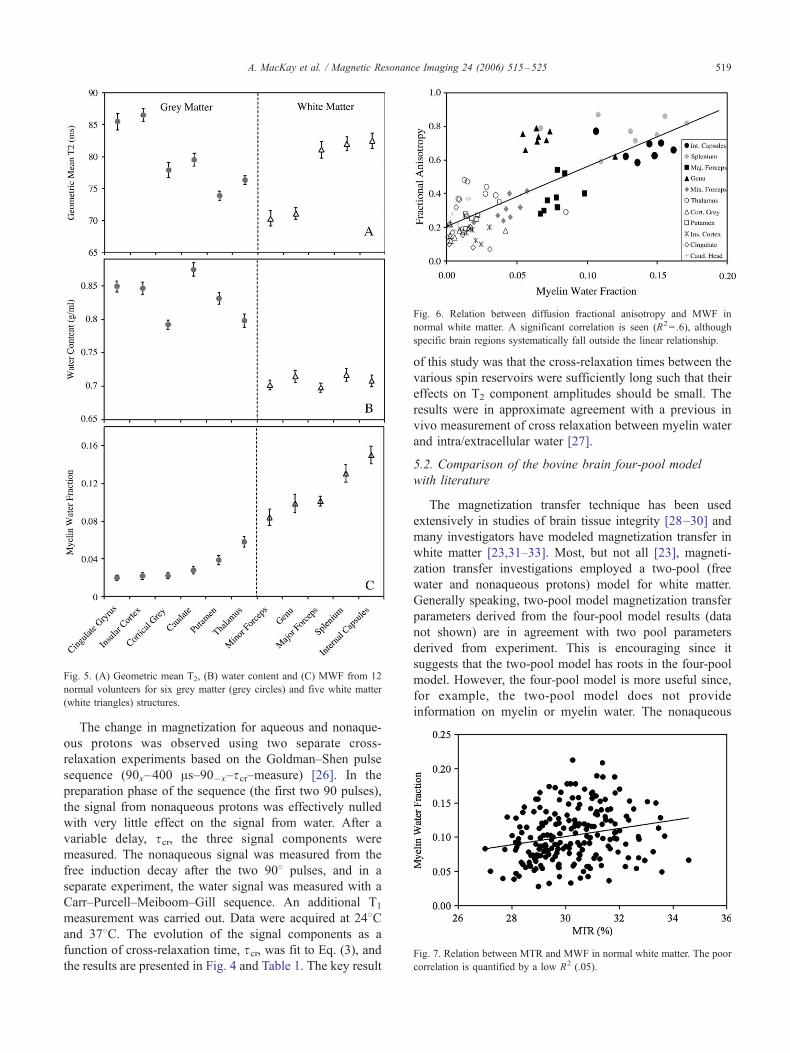
Fig. 5. (A) Geometric mean T2, (B) water content and (C) MWF from 12
normal volunteers for six grey matter (grey circles) and five white matter
(white triangles) structures.
A. MacKay et al. / Magnetic Resonance Imaging 24 (2006) 515–525 519
The change in magnetization for aqueous and nonaque-
ous protons was observed using two separate cross-
relaxation experiments based on the Goldman–Shen pulse
sequence (90x–400 As–90�x–scr–measure) [26]. In the
preparation phase of the sequence (the first two 90 pulses),
the signal from nonaqueous protons was effectively nulled
with very little effect on the signal from water. After a
variable delay, scr, the three signal components were
measured. The nonaqueous signal was measured from the
free induction decay after the two 908 pulses, and in a
separate experiment, the water signal was measured with a
Carr–Purcell–Meiboom–Gill sequence. An additional T1
measurement was carried out. Data were acquired at 248Cand 378C. The evolution of the signal components as a
function of cross-relaxation time, scr, was fit to Eq. (3), and
the results are presented in Fig. 4 and Table 1. The key result
F
n
sp
of this study was that the cross-relaxation times between the
various spin reservoirs were sufficiently long such that their
effects on T2 component amplitudes should be small. The
results were in approximate agreement with a previous in
vivo measurement of cross relaxation between myelin water
and intra/extracellular water [27].
5.2. Comparison of the bovine brain four-pool model
with literature
The magnetization transfer technique has been used
extensively in studies of brain tissue integrity [28–30] and
many investigators have modeled magnetization transfer in
white matter [23,31–33]. Most, but not all [23], magneti-
zation transfer investigations employed a two-pool (free
water and nonaqueous protons) model for white matter.
Generally speaking, two-pool model magnetization transfer
parameters derived from the four-pool model results (data
not shown) are in agreement with two pool parameters
derived from experiment. This is encouraging since it
suggests that the two-pool model has roots in the four-pool
model. However, the four-pool model is more useful since,
for example, the two-pool model does not provide
information on myelin or myelin water. The nonaqueous
F
c
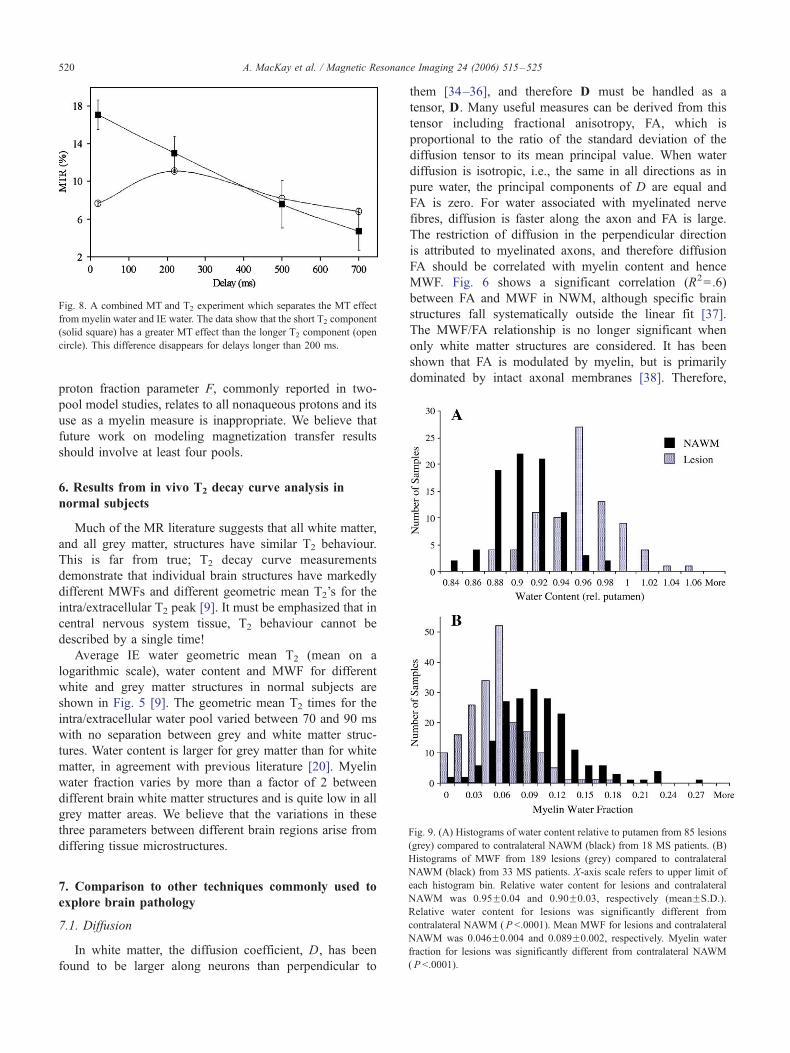
Fig. 8. A combined MT and T2 experiment which separates the MT effect
from myelin water and IE water. The data show that the short T2 component
(solid square) has a greater MT effect than the longer T2 component (open
circle). This difference disappears for delays longer than 200 ms.
Fig. 9. (A) Histograms of water content relative to putamen from 85 lesions
(grey) compared to contralateral NAWM (black) from 18 MS patients. (B)
A. MacKay et al. / Magnetic Resonance Imaging 24 (2006) 515–525520
proton fraction parameter F, commonly reported in two-
pool model studies, relates to all nonaqueous protons and its
use as a myelin measure is inappropriate. We believe that
future work on modeling magnetization transfer results
should involve at least four pools.
6. Results from in vivo T2 decay curve analysis in
normal subjects
Much of the MR literature suggests that all white matter,
and all grey matter, structures have similar T2 behaviour.
This is far from true; T2 decay curve measurements
demonstrate that individual brain structures have markedly
different MWFs and different geometric mean T2’s for the
intra/extracellular T2 peak [9]. It must be emphasized that in
central nervous system tissue, T2 behaviour cannot be
described by a single time!
Average IE water geometric mean T2 (mean on a
logarithmic scale), water content and MWF for different
white and grey matter structures in normal subjects are
shown in Fig. 5 [9]. The geometric mean T2 times for the
intra/extracellular water pool varied between 70 and 90 ms
with no separation between grey and white matter struc-
tures. Water content is larger for grey matter than for white
matter, in agreement with previous literature [20]. Myelin
water fraction varies by more than a factor of 2 between
different brain white matter structures and is quite low in all
grey matter areas. We believe that the variations in these
three parameters between different brain regions arise from
differing tissue microstructures.
Histograms of MWF from 189 lesions (grey) compared to contralateralNAWM (black) from 33 MS patients. X-axis scale refers to upper limit of
each histogram bin. Relative water content for lesions and contralateral
NAWM was 0.95F0.04 and 0.90F0.03, respectively (meanFS.D.).
Relative water content for lesions was significantly different from
contralateral NAWM ( P b.0001). Mean MWF for lesions and contralateral
NAWM was 0.046F0.004 and 0.089F0.002, respectively. Myelin water
fraction for lesions was significantly different from contralateral NAWM
( P b.0001).
7. Comparison to other techniques commonly used to
explore brain pathology
7.1. Diffusion
In white matter, the diffusion coefficient, D, has been
found to be larger along neurons than perpendicular to
them [34–36], and therefore D must be handled as a
tensor, D. Many useful measures can be derived from this
tensor including fractional anisotropy, FA, which is
proportional to the ratio of the standard deviation of the
diffusion tensor to its mean principal value. When water
diffusion is isotropic, i.e., the same in all directions as in
pure water, the principal components of D are equal and
FA is zero. For water associated with myelinated nerve
fibres, diffusion is faster along the axon and FA is large.
The restriction of diffusion in the perpendicular direction
is attributed to myelinated axons, and therefore diffusion
FA should be correlated with myelin content and hence
MWF. Fig. 6 shows a significant correlation (R2=.6)
between FA and MWF in NWM, although specific brain
structures fall systematically outside the linear fit [37].
The MWF/FA relationship is no longer significant when
only white matter structures are considered. It has been
shown that FA is modulated by myelin, but is primarily
dominated by intact axonal membranes [38]. Therefore,
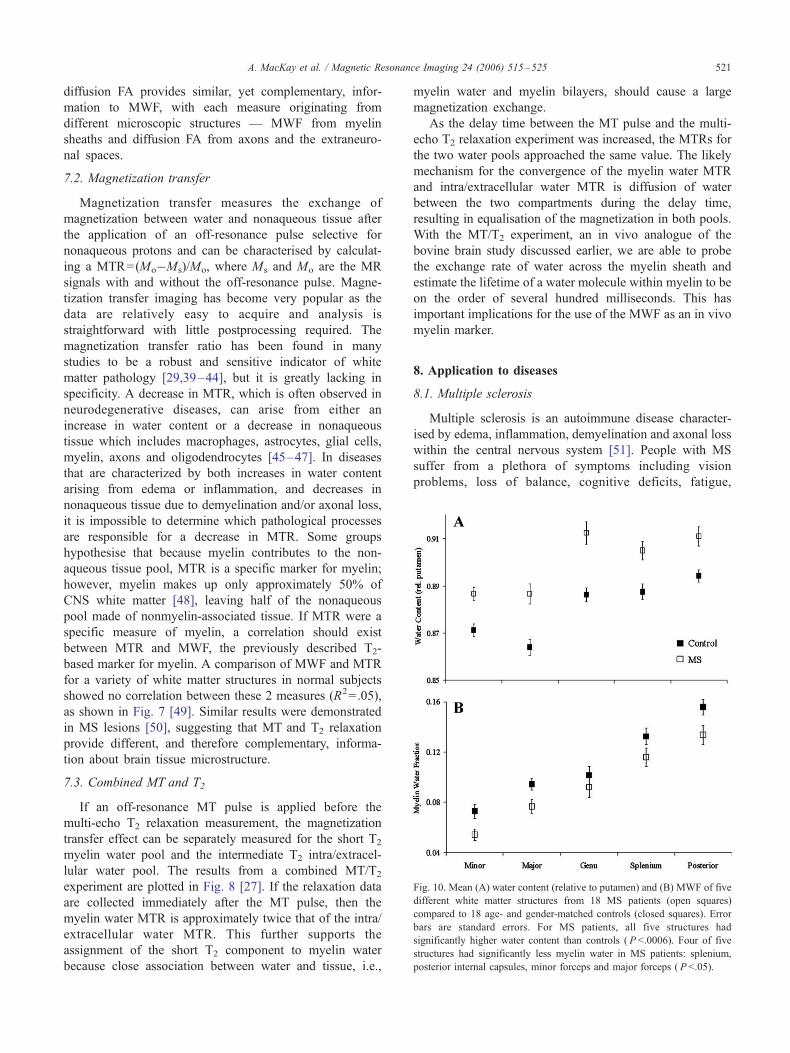
ig. 10. Mean (A) water content (relative to putamen) and (B) MWF of five
ifferent white matter structures from 18 MS patients (open squares)
ompared to 18 age- and gender-matched controls (closed squares). Error
ars are standard errors. For MS patients, all five structures had
gnificantly higher water content than controls ( P b.0006). Four of five
ructures had significantly less myelin water in MS patients: splenium,
posterior internal capsules, minor forceps and major forceps ( P b.05).
A. MacKay et al. / Magnetic Resonance Imaging 24 (2006) 515–525 521
diffusion FA provides similar, yet complementary, infor-
mation to MWF, with each measure originating from
different microscopic structures — MWF from myelin
sheaths and diffusion FA from axons and the extraneuro-
nal spaces.
7.2. Magnetization transfer
Magnetization transfer measures the exchange of
magnetization between water and nonaqueous tissue after
the application of an off-resonance pulse selective for
nonaqueous protons and can be characterised by calculat-
ing a MTR=(Mo�Ms)/Mo, where Ms and Mo are the MR
signals with and without the off-resonance pulse. Magne-
tization transfer imaging has become very popular as the
data are relatively easy to acquire and analysis is
straightforward with little postprocessing required. The
magnetization transfer ratio has been found in many
studies to be a robust and sensitive indicator of white
matter pathology [29,39–44], but it is greatly lacking in
specificity. A decrease in MTR, which is often observed in
neurodegenerative diseases, can arise from either an
increase in water content or a decrease in nonaqueous
tissue which includes macrophages, astrocytes, glial cells,
myelin, axons and oligodendrocytes [45–47]. In diseases
that are characterized by both increases in water content
arising from edema or inflammation, and decreases in
nonaqueous tissue due to demyelination and/or axonal loss,
it is impossible to determine which pathological processes
are responsible for a decrease in MTR. Some groups
hypothesise that because myelin contributes to the non-
aqueous tissue pool, MTR is a specific marker for myelin;
however, myelin makes up only approximately 50% of
CNS white matter [48], leaving half of the nonaqueous
pool made of nonmyelin-associated tissue. If MTR were a
specific measure of myelin, a correlation should exist
between MTR and MWF, the previously described T2-
based marker for myelin. A comparison of MWF and MTR
for a variety of white matter structures in normal subjects
showed no correlation between these 2 measures (R2=.05),
as shown in Fig. 7 [49]. Similar results were demonstrated
in MS lesions [50], suggesting that MT and T2 relaxation
provide different, and therefore complementary, informa-
tion about brain tissue microstructure.
7.3. Combined MT and T2
If an off-resonance MT pulse is applied before the
multi-echo T2 relaxation measurement, the magnetization
transfer effect can be separately measured for the short T2
myelin water pool and the intermediate T2 intra/extracel-
lular water pool. The results from a combined MT/T2
experiment are plotted in Fig. 8 [27]. If the relaxation data
are collected immediately after the MT pulse, then the
myelin water MTR is approximately twice that of the intra/
extracellular water MTR. This further supports the
assignment of the short T2 component to myelin water
because close association between water and tissue, i.e.,
myelin water and myelin bilayers, should cause a large
magnetization exchange.
As the delay time between the MT pulse and the multi-
echo T2 relaxation experiment was increased, the MTRs for
the two water pools approached the same value. The likely
mechanism for the convergence of the myelin water MTR
and intra/extracellular water MTR is diffusion of water
between the two compartments during the delay time,
resulting in equalisation of the magnetization in both pools.
With the MT/T2 experiment, an in vivo analogue of the
bovine brain study discussed earlier, we are able to probe
the exchange rate of water across the myelin sheath and
estimate the lifetime of a water molecule within myelin to be
on the order of several hundred milliseconds. This has
important implications for the use of the MWF as an in vivo
myelin marker.
8. Application to diseases
8.1. Multiple sclerosis
Multiple sclerosis is an autoimmune disease character-
ised by edema, inflammation, demyelination and axonal loss
within the central nervous system [51]. People with MS
suffer from a plethora of symptoms including vision
problems, loss of balance, cognitive deficits, fatigue,
F
d
c
b
si
st
A. MacKay et al. / Magnetic Resonance Imaging 24 (2006) 515–525522
tremors and paralysis. The unpredictable nature and
drastically varying disease course from person to person
with MS make this disease particularly difficult to deal with,
both from an emotional and physical standpoint. Although
MS was first described over 100 years ago [52], the
mechanisms governing clinical evolution and disease
progression and their relationship to pathological character-
istics are still poorly understood.
Over the past two decades, magnetic resonance imaging
has become a powerful diagnostic tool for MS. Clinical MR
images of MS brain and spinal cord can easily visualise focal
areas of the disease known as lesions. Lesions can appear
and disappear, although they typically increase in number
and volume as the disease progresses. Many pharmaceutical
companies use changes in MRI measures such as burden of
disease (lesion load) as primary outcome measures, and
while conventional MRI provides some information about
the disease process of MS, little correlation has been found
between total lesion volume and measures of clinical
disability [53–56]. This dissociation suggests that there is
ongoing active disease within areas that appear either
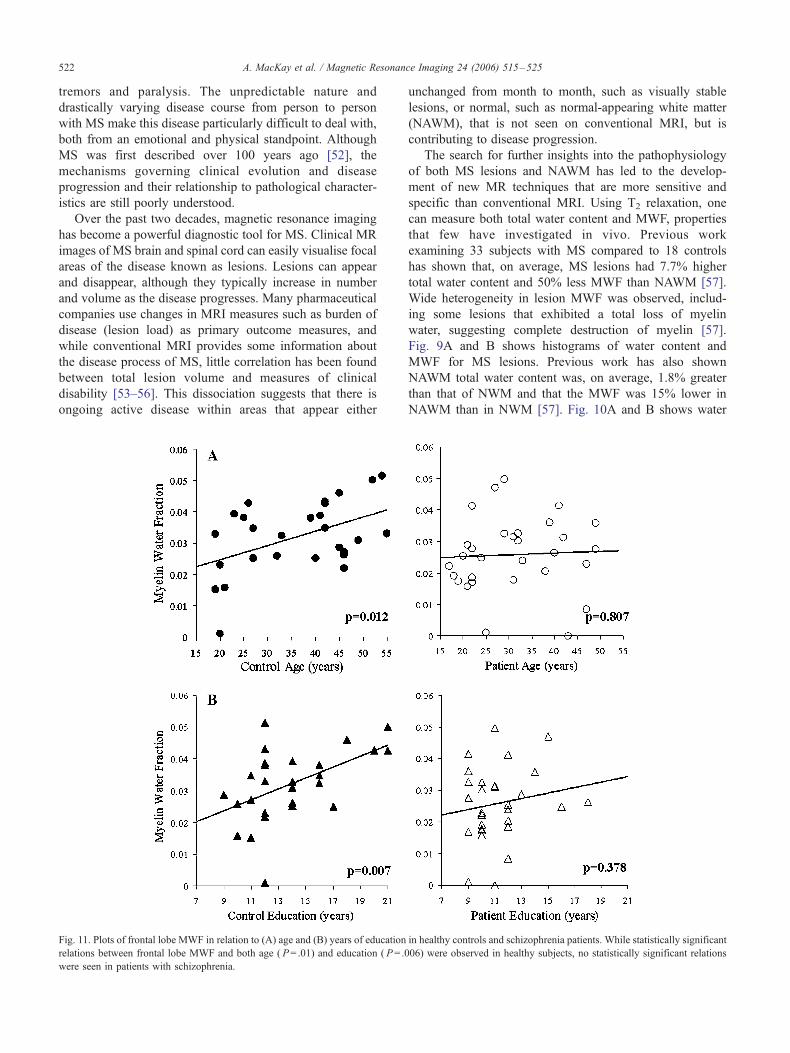
Fig. 11. Plots of frontal lobe MWF in relation to (A) age and (B) years of education
relations between frontal lobe MWF and both age ( P= .01) and education ( P= .0
were seen in patients with schizophrenia.
unchanged from month to month, such as visually stable
lesions, or normal, such as normal-appearing white matter
(NAWM), that is not seen on conventional MRI, but is
contributing to disease progression.
The search for further insights into the pathophysiology
of both MS lesions and NAWM has led to the develop-
ment of new MR techniques that are more sensitive and
specific than conventional MRI. Using T2 relaxation, one
can measure both total water content and MWF, properties
that few have investigated in vivo. Previous work
examining 33 subjects with MS compared to 18 controls
has shown that, on average, MS lesions had 7.7% higher
total water content and 50% less MWF than NAWM [57].
Wide heterogeneity in lesion MWF was observed, includ-
ing some lesions that exhibited a total loss of myelin
water, suggesting complete destruction of myelin [57].
Fig. 9A and B shows histograms of water content and
MWF for MS lesions. Previous work has also shown
NAWM total water content was, on average, 1.8% greater
than that of NWM and that the MWF was 15% lower in
NAWM than in NWM [57]. Fig. 10A and B shows water
in healthy controls and schizophrenia patients. While statistically significant
06) were observed in healthy subjects, no statistically significant relations
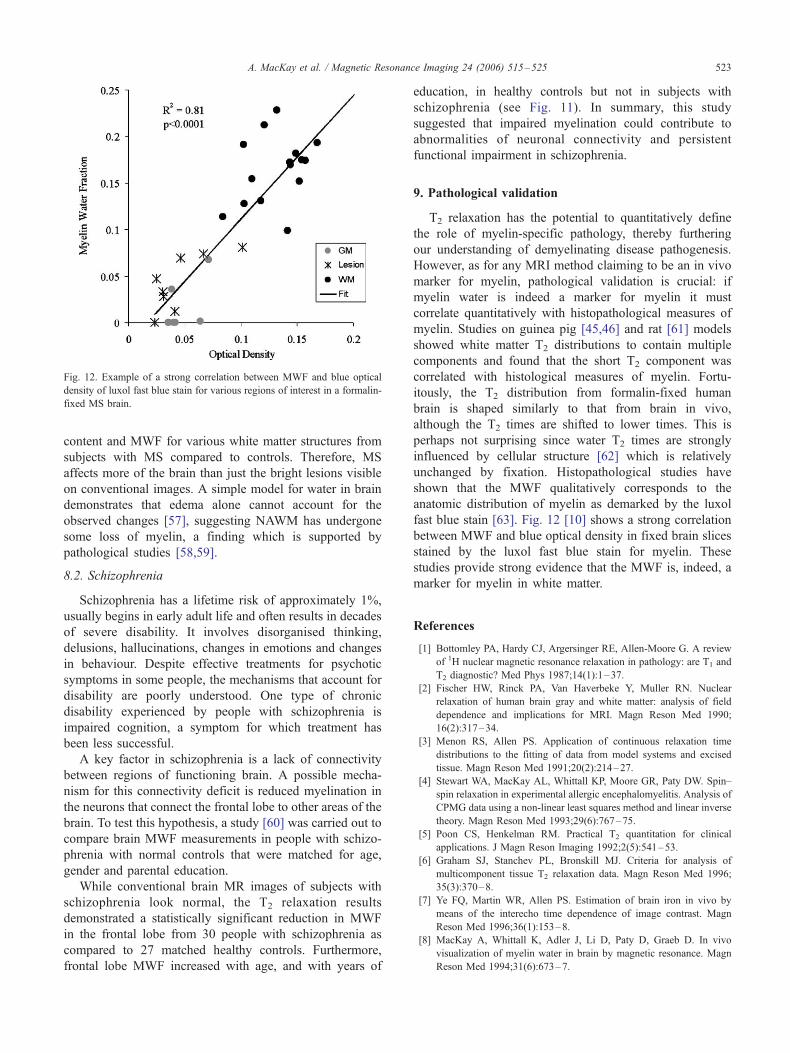
Fig. 12. Example of a strong correlation between MWF and blue optical
density of luxol fast blue stain for various regions of interest in a formalin-
fixed MS brain.
A. MacKay et al. / Magnetic Resonance Imaging 24 (2006) 515–525 523
content and MWF for various white matter structures from
subjects with MS compared to controls. Therefore, MS
affects more of the brain than just the bright lesions visible
on conventional images. A simple model for water in brain
demonstrates that edema alone cannot account for the
observed changes [57], suggesting NAWM has undergone
some loss of myelin, a finding which is supported by
pathological studies [58,59].
8.2. Schizophrenia
Schizophrenia has a lifetime risk of approximately 1%,
usually begins in early adult life and often results in decades
of severe disability. It involves disorganised thinking,
delusions, hallucinations, changes in emotions and changes
in behaviour. Despite effective treatments for psychotic
symptoms in some people, the mechanisms that account for
disability are poorly understood. One type of chronic
disability experienced by people with schizophrenia is
impaired cognition, a symptom for which treatment has
been less successful.
A key factor in schizophrenia is a lack of connectivity
between regions of functioning brain. A possible mecha-
nism for this connectivity deficit is reduced myelination in
the neurons that connect the frontal lobe to other areas of the
brain. To test this hypothesis, a study [60] was carried out to
compare brain MWF measurements in people with schizo-
phrenia with normal controls that were matched for age,
gender and parental education.
While conventional brain MR images of subjects with
schizophrenia look normal, the T2 relaxation results
demonstrated a statistically significant reduction in MWF
in the frontal lobe from 30 people with schizophrenia as
compared to 27 matched healthy controls. Furthermore,
frontal lobe MWF increased with age, and with years of
education, in healthy controls but not in subjects with
schizophrenia (see Fig. 11). In summary, this study
suggested that impaired myelination could contribute to
abnormalities of neuronal connectivity and persistent
functional impairment in schizophrenia.
9. Pathological validation
T2 relaxation has the potential to quantitatively define
the role of myelin-specific pathology, thereby furthering
our understanding of demyelinating disease pathogenesis.
However, as for any MRI method claiming to be an in vivo
marker for myelin, pathological validation is crucial: if
myelin water is indeed a marker for myelin it must
correlate quantitatively with histopathological measures of
myelin. Studies on guinea pig [45,46] and rat [61] models
showed white matter T2 distributions to contain multiple
components and found that the short T2 component was
correlated with histological measures of myelin. Fortu-
itously, the T2 distribution from formalin-fixed human
brain is shaped similarly to that from brain in vivo,
although the T2 times are shifted to lower times. This is
perhaps not surprising since water T2 times are strongly
influenced by cellular structure [62] which is relatively
unchanged by fixation. Histopathological studies have
shown that the MWF qualitatively corresponds to the
anatomic distribution of myelin as demarked by the luxol
fast blue stain [63]. Fig. 12 [10] shows a strong correlation
between MWF and blue optical density in fixed brain slices
stained by the luxol fast blue stain for myelin. These
studies provide strong evidence that the MWF is, indeed, a
marker for myelin in white matter.
References
[1] Bottomley PA, Hardy CJ, Argersinger RE, Allen-Moore G. A review
of 1H nuclear magnetic resonance relaxation in pathology: are T1 and
T2 diagnostic? Med Phys 1987;14(1):1–37.
[2] Fischer HW, Rinck PA, Van Haverbeke Y, Muller RN. Nuclear
relaxation of human brain gray and white matter: analysis of field
dependence and implications for MRI. Magn Reson Med 1990;
16(2):317–34.
[3] Menon RS, Allen PS. Application of continuous relaxation time
distributions to the fitting of data from model systems and excised
tissue. Magn Reson Med 1991;20(2):214–27.
[4] Stewart WA, MacKay AL, Whittall KP, Moore GR, Paty DW. Spin–
spin relaxation in experimental allergic encephalomyelitis. Analysis of
CPMG data using a non-linear least squares method and linear inverse
theory. Magn Reson Med 1993;29(6):767–75.
[5] Poon CS, Henkelman RM. Practical T2 quantitation for clinical
applications. J Magn Reson Imaging 1992;2(5):541–53.
[6] Graham SJ, Stanchev PL, Bronskill MJ. Criteria for analysis of
multicomponent tissue T2 relaxation data. Magn Reson Med 1996;
35(3):370–8.
[7] Ye FQ, Martin WR, Allen PS. Estimation of brain iron in vivo by
means of the interecho time dependence of image contrast. Magn
Reson Med 1996;36(1):153–8.
[8] MacKay A, Whittall K, Adler J, Li D, Paty D, Graeb D. In vivo
visualization of myelin water in brain by magnetic resonance. Magn
Reson Med 1994;31(6):673–7.
A. MacKay et al. / Magnetic Resonance Imaging 24 (2006) 515–525524
[9] Whittall KP, MacKay AL, Graeb DA, Nugent RA, Li DK, Paty DW.
In vivo measurement of T2 distributions and water contents in normal
human brain. Magn Reson Med 1997;37(1):34–43.
[10] Laule C, Leung E, Li DKB, Traboulsee T, Oger J, Paty DW, et al.
Myelin water imaging in multiple sclerosis: quantitative correlations
with histopathology. Mult Scler 2003;(Suppl 1):S35.
[11] Skinner M, Whittall KP, MacKay AL. Effect of variable echo spacing
in multi-echo sequences for resolving long T2 components in multiple
sclerosis. Proceedings of the annual meeting of the International
Society for Magnetic Resonance in Medicine; 2001; Glasgow,
Scotland, 2001. p. 904.
[12] Kroeker RM, Henkelman RM. Analysis of biological NMR relaxation
data with continuous distributions of relaxation times. J Magn Reson
1986;69:218–35.
[13] Lawson CL, Hanson RJ. Solving least squares problems. Englewood
Cliffs, NJ7 Prentice-Hall; 1974.
[14] Whittall KP, MacKay AL. Quantitative interpretation of NMR
relaxation data. J Magn Reson 1989;84:64–71.
[15] Vasilescu V, Katona E, Simplaceanu V, Demco D. Water compart-
ments in the myelinated nerve: III. Pulsed NMR results. Experientia
1978;34(11):1443–4.
[16] Peled S, Cory DG, Raymond SA, Kirschner DA, Jolesz FA. Water
diffusion, T(2), and compartmentation in frog sciatic nerve. Magn
Reson Med 1999;42(5):911–8.
[17] Does MD, Snyder RE. T2 relaxation of peripheral nerve measured in
vivo. Magn Reson Imaging 1995;13(4):575–80.
[18] Wachowicz K, Snyder RE. Assignment of the T(2) components of
amphibian peripheral nerve to their microanatomical compartments.
Magn Reson Med 2002;47(2):239–45.
[19] Helms G. Volume correction for edema in single-volume proton MR
spectroscopy of contrast-enhancing multiple sclerosis lesions. Magn
Reson Med 2001;46(2):256–63.
[20] Tofts PS. Quantitative magnetic resonance methods. London7 Elsev-
ier; 2004.
[21] Bjarnason T, Vavasour I, Chia C, MacKay A. Characterization of the
NMR behaviour of white matter in bovine brain. Magn Reson Med
2005;54(5):1072–81.
[22] Vavasour IM, Magnetic resonance of human and bovine brain
[Doctoral]. Vancouver: University of British Columbia, 1998
[23] Stanisz GJ, Kecojevic A, Bronskill MJ, Henkelman RM. Character-
izing white matter with magnetization transfer and T(2). Magn Reson
Med 1999;42(6):1128–36.
[24] Zimmerman JR, Brittin WE. Nuclear magnetic resonance studies in
multiple phase systems: lifetime of a water molecule in an adsorbing
phase of silica gel. J Chem Phys 1957;61:1328–33.
[25] Edzes HT, Samulski ET. The measurement of cross relaxation effects
in the proton NMR spin-lattice relaxation of water in biolo-
gical system: hydrated collagen and muscle. J Magn Reson 1978;31:
207–209.
[26] Goldman M, Shen L. Spin–spin relaxation in LaF3. Phys Rev 1966;
(144):321–31.
[27] Vavasour IM, Whittall KP, Li DK, MacKay AL. Different magneti-
zation transfer effects exhibited by the short and long T(2)
components in human brain. Magn Reson Med 2000;44(6):860–6.
[28] Wolff SD, Balaban RS. Magnetization transfer contrast (MTC) and
tissue water proton relaxation in vivo. Magn Reson Med 1989;10(1):
135–44.
[29] Dousset V, Gayou A, Brochet B, Caille JM. Early structural changes
in acute MS lesions assessed by serial magnetization transfer studies.
Neurology 1998;51(4):1150–5.
[30] Filippi M, Dousset V, McFarland HF, Miller DH, Grossman RI. Role
of magnetic resonance imaging in the diagnosis and monitoring of
multiple sclerosis: consensus report of the White Matter Study Group.
J Magn Reson Imaging 2002;15(5):499–504.
[31] Henkelman RM, Huang X, Xiang QS, Stanisz GJ, Swanson SD,
Bronskill MJ. Quantitative interpretation of magnetization transfer.
Magn Reson Med 1993;29(6):759–66.
[32] Morrison C, Henkelman RM. A model for magnetization transfer in
tissues. Magn Reson Med 1995;33(4):475–82.
[33] Sled JG, Pike GB. Quantitative imaging of magnetization transfer
exchange and relaxation properties in vivo using MRI. Magn Reson
Med 2001;46(5):923–31.
[34] Moseley ME, Cohen Y, Kucharczyk J, Mintorovitch J, Asgari HS,
Wendland MF, et al. Diffusion-weighted MR imaging of anisotropic
water diffusion in cat central nervous system. Radiology 1990;176(2):
439–45.
[35] Moseley ME, Kucharczyk J, Asgari HS, Norman D. Anisotropy in
diffusion-weighted MRI. Magn Reson Med 1991;19(2):321–6.
[36] Chenevert TL, Brunberg JA, Pipe JG. Anisotropic diffusion in human
white matter: demonstration with MR techniques in vivo [comment]
Radiology 1990;177(2):401–5.
[37] Maedler B, Whittall KP, MacKay AL. Correlation of multicomponent
T2-relaxation data with diffusion tensor anisotropy measures in human
brain. Proceedings of the annual meeting of the International Society
of Magnetic Resonance in Medicine; 2002; Honolulu, Hawaii; 2002.
p. 1188.
[38] Beaulieu C. The basis of anisotropic water diffusion in the nervous
system — a technical review. NMR Biomed 2002;15(7–8):435–55.
[39] Brex PA, Leary SM, Plant GT, Thompson AJ, Miller DH.
Magnetization transfer imaging in patients with clinically isolated
syndromes suggestive of multiple sclerosis. Am J Neuroradiol
2001;22(5):947–51.
[40] FilippiM, CampiA, Dousset V, Baratti C,Martinelli V, Canal N, et al. A
magnetization transfer imaging study of normal-appearing white matter
in multiple sclerosis. Neurology 1995;45(3 Pt 1):478–82.
[41] Catalaa I, Grossman RI, Kolson DL, Udupa JK, Nyul LG, Wei L,
et al. Multiple sclerosis: magnetization transfer histogram analysis
of segmented normal-appearing white matter. Radiology 2000;
216(2):351–5.
[42] Cercignani M, Bozzali M, Iannucci G, Comi G, Filippi M. Magnet-
isation transfer ratio and mean diffusivity of normal appearing white
and grey matter from patients with multiple sclerosis. J Neurol
Neurosurg Psychiatry 2001;70(3):311–7.
[43] Laule C, Vavasour IM, Whittall KP, Oger J, Paty DW, Li DK, et al.
Evolution of focal and diffuse magnetisation transfer abnormalities in
multiple sclerosis. J Neurol 2003;250(8):924–31.
[44] Leary SM, Silver NC, Stevenson VL, Barker GJ, Miller DH,
Thompson AJ. Magnetisation transfer of normal appearing white
matter in primary progressive multiple sclerosis. Mult Scler 1999;
5(5):313–316.
[45] Gareau PJ, Rutt BK, Bowen CV, Karlik SJ, Mitchell JR. In vivo
measurements of multi-component T2 relaxation behaviour in guinea
pig brain. Magn Reson Imaging 1999;17(9):1319–25.
[46] Gareau PJ, Rutt BK, Karlik SJ, Mitchell JR. Magnetization transfer
and multicomponent T2 relaxation measurements with histopathologic
correlation in an experimental model of MS. J Magn Reson Imaging
2000;11(6):586–95.
[47] Dousset V, Brochet B, Vital A, Gross C, Benazzouz A, Boullerne A,
et al. Lysolecithin-induced demyelination in primates: preliminary in
vivo study with MR and magnetization transfer. Am J Neuroradiol
1995;16(2):225–31.
[48] Norton W, Cammer W. Isolation and characterization of myelin. In:
Morell P, editor. Myelin, 2nd ed. New York7 Plenum; 1984. p. 147–95.
[49] Laule C, Vavasour IM, Paty D, Li DKB, Arnold DL, MacKay AL.
Correlation between magnetization transfer ratio and myelin water
content in normal white matter and MS lesions. Proceedings of the
annual meeting of the International Society for Magnetic Resonance
in Medicine. 2002; Honolulu, Hawaii; 2002. p. 182.
[50] Vavasour IM, Whittall KP, MacKay AL, Li DK, Vorobeychik G, Paty
DW. A comparison between magnetization transfer ratios and myelin
water percentages in normals and multiple sclerosis patients. Magn
Reson Med 1998;40(5):763–8.
[51] Keegan BM, Noseworthy JH. Multiple sclerosis. Annu Rev Med
2002;53:285–302.
A. MacKay et al. / Magnetic Resonance Imaging 24 (2006) 515–525 525
[52] Charcot JM. Histologie de la sclerose en plaques. Gaz Hopit Civils
Milit 1868;41:554, 557, 566.
[53] Paty DW, Li DK. Interferon beta-1b is effective in relapsing-remitting
multiple sclerosis: II. MRI analysis results of a multicenter,
randomized, double-blind, placebo-controlled trial. UBC MS/MRI
Study Group and the IFNB Multiple Sclerosis Study Group.
Neurology 1993;43(4):662–7.
[54] Anonymous. Interferon beta-1b in the treatment of multiple sclerosis:
final outcome of the randomized controlled trial. The IFNB Multiple
Sclerosis Study Group and The University of British Columbia MS/
MRI Analysis Group. Neurology 1995;45(7):1277–85.
[55] Gasperini C, Horsfield MA, Thorpe JW, Kidd D, Barker GJ, Tofts PS,
et al. Macroscopic and microscopic assessments of disease burden by
MRI in multiple sclerosis: relationship to clinical parameters. J Magn
Reson Imaging 1996;6(4):580–4.
[56] Thompson AJ, Miller D, Youl B, MacManus D, Moore S, Kingsley D,
et al. Serial gadolinium-enhanced MRI in relapsing/remitting multiple
sclerosis of varying disease duration. Neurology 1992;42(1):60–3.
[57] Laule C, Vavasour IM, Moore GRW, Oger J, Li DKB, Paty DW, et al.
Water content and myelin water fraction in multiple sclerosis: a T2
relaxation study. J Neurol 2004;251(3):284–93.
[58] Allen IV, Glover G, Anderson R. Abnormalities in the macroscopi-
cally normal white matter in cases of mild or spinal multiple sclerosis
(MS). Acta Neuropathol Suppl 1981;7:176–8.
[59] Itoyama Y, Sternberger NH, Webster HD, Quarles RH, Cohen SR,
Richardson Jr EP. Immunocytochemical observations on the distribu-
tion of myelin-associated glycoprotein and myelin basic protein in
multiple sclerosis lesions. Ann Neurol 1980;7(2):167–77.
[60] Flynn SW, Lang DJ, Mackay AL, Goghari V, Vavasour IM, Whittall
KP, et al. Abnormalities of myelination in schizophrenia detected in
vivo with MRI, and post-mortem with analysis of oligodendrocyte
proteins. Mol Psychiatry 2003;8(9):811–20.
[61] Webb S, Munro CA, Midha R, Stanisz GJ. Is multicomponent T2 a
good measure of myelin content in peripheral nerve? Magn Reson
Med 2003;49(4):638–45.
[62] Araujo C, MacKay AL, Whittall KP, Hailey JRT. A diffusion model
for spin–spin relaxation of compartmentalized water in wood. J Magn
Reson 1993;101:248–61.
[63] Moore GRW, Leung E, MacKay AL, Vavasour IM, Whittall KP,
Cover KS, et al. A pathology-MRI study of the short-T2 component in
formalin-fixed multiple sclerosis brain. Neurology 2000;55(10):
1506–10.