
Insights from Collective Threat Intelligence - Webroot from Collective Threat Intelligence ......
24
APRIL 2015 Insights from Collective Threat Intelligence During 2014, Webroot encountered tens of millions of instances of malware and potentially unwanted applications (PUAs), monitored billions of IP addresses and URLs, analyzed millions of new and updated mobile apps for malicious behavior, and studied major malware trends based on data from millions of endpoints. This report contains insights, analysis, and information on how collective threat intelligence can protect organizations from sophisticated attacks.
Transcript of Insights from Collective Threat Intelligence - Webroot from Collective Threat Intelligence ......

APRIL 2015
Insights from Collective Threat Intelligence
During 2014, Webroot encountered tens of millions of instances of malware and potentially unwanted applications (PUAs), monitored billions of IP addresses and URLs, analyzed millions of new and updated mobile apps for malicious behavior, and studied major malware trends based on data from millions of endpoints. This report contains insights, analysis, and information on how collective threat intelligence can protect organizations from sophisticated attacks.

2
Foreword . . . . . . . . . . . . . . . . . . . . . . . . . . . . . . . . . . . . . . . . . . . . . . . . . . . . . . . . . . . . . . . . . . . . . . . . . . . . . . . . . . . . . . . . . . . . . . . . . . . . 3
Introduction . . . . . . . . . . . . . . . . . . . . . . . . . . . . . . . . . . . . . . . . . . . . . . . . . . . . . . . . . . . . . . . . . . . . . . . . . . . . . . . . . . . . . . . . . . . . . . . . . 4
HowBrightCloudThreatIntelligenceisCaptured,Analyzed,Classified,CorrelatedandPublished
85,000 Net New Malicious IPs are Launched Every Day . . . . . . . . . . . . . . . . . . . . . . . . . . . . . . . . . . . . . . . . . . . . . . . . . . . 7
WebrootBrightCloudIPReputation
KeyFindingsonIPs
Less than 55% of all URLs are Trustworthy . . . . . . . . . . . . . . . . . . . . . . . . . . . . . . . . . . . . . . . . . . . . . . . . . . . . . . . . . . . . . . .10
WebrootBrightCloudWebClassificationandWebReputation
KeyFindingsonURLs
30% of Internet Users Access Phishing Sites . . . . . . . . . . . . . . . . . . . . . . . . . . . . . . . . . . . . . . . . . . . . . . . . . . . . . . . . . . . . .14
WebrootBrightCloudReal-TimeAnti-Phishing
KeyFindingsonPhishing
15% of New Files are Malicious Executables . . . . . . . . . . . . . . . . . . . . . . . . . . . . . . . . . . . . . . . . . . . . . . . . . . . . . . . . . . . . . .17
WebrootBrightCloudFileReputation
Key Findings on Files
Only 28% of Mobile Apps are Trustworthy or Benign . . . . . . . . . . . . . . . . . . . . . . . . . . . . . . . . . . . . . . . . . . . . . . . . . . . . . .19
WebrootBrightCloudMobileAppReputation
KeyFindingsonMobileApps
Conclusion . . . . . . . . . . . . . . . . . . . . . . . . . . . . . . . . . . . . . . . . . . . . . . . . . . . . . . . . . . . . . . . . . . . . . . . . . . . . . . . . . . . . . . . . . . . . . . . . .23
CONTENTS

3
Each of these organizations had some form of security infrastructure. But if this is the case, to what can we attribute these breaches? A likely contributing factor is dependence on outdated security practices. They likely also lacked suitable insight and intelligence into today’s dynamic threat landscape, the ability to block previously unseen attacks, and the tools to minimize time-to-detection for breaches that had gone unnoticed.
At Webroot, we believe that it is essential for IT departments, users and others to have access to up-to-date intelligence on threats to their systems and endpoints of all types. Threats are constantly changing, so security controls must adapt accordingly. These security controls include being aware of the latest malicious IPs, the types of websites that are most often impersonated in phishing attacks, and the categories of apps that are most likely to be malicious.
Real-time, contextual, and predictive threat intelligence that spans the spectrum of attack vectors is a critical component to implementing a defense-in-depth strategy to take on today’s cybercriminals, giving companies the edge they need to combat both new and known threats.
FOREWORD Hal Lonas,Chief Technology OfficerWebroot, Inc.
Webroot has seen a continued
rise in the number of malicious
URLs, IP addresses, malware, and
mobile applications, used to enable
cybercriminals to steal data, disrupt
services, or cause other harm. With
more breaches at major retailers,
financial institutions and technology
companies in the headlines and
scores of other, smaller breaches in
2014, the trend shows no signs of
slowing down.

4
The Webroot® 2015 Threat Brief provides an overview of the threats against a
wide range of organizations and individuals during 2014. It is based on analysis of
threat intelligence metrics automatically captured, analyzed and correlated across
threat vectors by BrightCloud, a Big Data security engine that acts as the backbone
for all Webroot endpoint solutions and threat intelligence services.
During 2014, BrightCloud found tens of millions of instances of malware and
potentially unwanted applications (PUAs), monitored billions of IP addresses and
URLs, analyzed millions of new and updated mobile apps for malicious behavior, and
studied major malware trends based on data from millions of endpoints.
This report also contains supplementary insights from the Webroot Threat Research team, and includes:
Analysis of IP addresses
associated with malicious activity
Details on the classification and reputation of URLs
Phishing detection statistics
Insights into malware and
potentially unwanted applications
Information on mobile app security for Android devices
INTRODUCTION

5
How BrightCloud Threat Intelligence is Captured, Analyzed, Classified, Correlated and Published
Figure 1: BrightCloud
Partner End Users Protected (27 Million)
Collective Threat Intelligence
Webroot endpoint and threat intelligence solutions are all powered by BrightCloud, which was purpose-built as a revolutionary approach to next-generation threat protection. BrightCloud integrates billions of pieces of information from millions of sensors to create the world’s largest malware detection net. The next-generation threat
intelligence produced is available to Webroot partners through BrightCloud® Threat Intelligence Services for proactive protection for their customers against both known and never-before-seen attacks. These services cover URL classification and reputation, IP reputation, file reputation, anti-phishing, and mobile security.

6
Its powerful, real-time threat analysis engine has enabled Webroot to pull insights together from across the internet landscape for this threat brief. The massive data processing capacity, coupled with Webroot’s proprietary implementation of the most advanced machine learning technology available and a powerful contextual analysis engine, has enabled Webroot to:
In addition, Webroot has mapped all of this data across vectors, linking URLs, IPs, files, and mobile applications to each other to provide greater insight and accuracy, and enabling predictive risk scoring based on those relationships. For example, a URL may seem benign when examined independently, but may be connected to malicious IPs, files, and/or mobile apps, which would affect its reputation score within the Webroot system.
While this system is primarily used to keep ahead of the exponential proliferation of threats facing companies and end users today, the Webroot team has analyzed data from this system to develop an overarching view of the threat landscape.
20+Billion URLs
600+Million Domains
4+Billion IP Addresses
7+Billion File Behavior Records
15+Million Mobile Apps
10+Million Connected Sensors
Accurately monitor the entire IPv4 space and in-use IPv6 addresses and continuously update a dynamic list of approximately 12 million malicious IP addresses
Classify and score over 95% of the internet on a daily basis and detect phishing sites in real time
Categorize millions of files that are seen across millions of Webroot customer endpoints
Monitor1
Classify
Categorize
Assess the risk of millions of mobile apps (over 7 million new and updated in 2014)
Assess
3
2 4

7
One of the most effective methods to prevent attacks is by blocking activity from IP addresses that are known to have malicious intent. Webroot continuously monitors and maintains a database of over 4 billion IP addresses, from which a subset of high-risk IP addresses is updated for customers and made available to Webroot partners every five minutes, or as often as they would prefer. This frequency is necessary to identify the latest threats and provide protection against them. Frequent reassessment of IP threats is also necessary, for example, as infected hosts are cleaned and remediated, making them benign again, and as hosts change IP addresses.
BrightCloud analyzes and correlates data across numerous dimensions to create a predictive risk score, which falls into one of five rating bands ranging from trustworthy to malicious. The BrightCloud® IP Reputation Index provides scores ranging from 1 to 100, with tiers split into Trustworthy, Low Risk, Moderate Risk, Suspicious, and High Risk. Numerically lower, i.e. higher risk, scores indicate an IP is more likely to be or become bad, and are monitored at a greater frequency than trustworthy IPs.
01-20High Risk
These are high risk IP addresses. There is a high predictive risk that these IPs will deliver attacks – such as malicious payloads, DoS attacks, or others – to your infrastructure and endpoints.
21-40Suspicious
These are suspicious IPs. There is a higher than average predictive risk that these IPs will deliver attacks to your infrastructure and endpoints.
41-60Moderate Risk
These are generally benign IPs, but have exhibited some potential risk characteristics. There is some predictive risk that these IPs will deliver attacks to your infrastructure and endpoints.
61-80Low Risk
These are benign IPs, and rarely exhibit characteristics that expose your infrastructure and endpoints to security risks. There is a low predictive risk of attack.
81-100Trustworthy
These are clean IPs that have not been tied to a security risk. There is a very low predictive risk that your infrastructure and endpoints will be exposed to attack.
Figure 2: BrightCloud IP Reputation Index
net new malicious IPs are launched every day.
Webroot BrightCloud IP Reputation

8
Key Findings on IPs
Webroot’s dynamic list of known malicious IP addresses contains approximately 12 million IPs at any given time. On a daily basis, approximately 36% of these addresses are dropped from the list, and this percentage remains relatively consistent throughout the year. Malware designers and other attackers know that an IP address is only useful for attack-launching or attack-control purposes until it is detected as malicious. Because blacklisting can occur within minutes of the appearance of new malicious activity for an IP address, attackers must change hosts and IP addresses frequently. However, because the Webroot IP blacklist is constantly updated, these changes are rapidly detected and mitigated, minimizing the window of opportunity for attackers.
While most IP addresses on the blacklist drop off and don’t reappear, there is a core set of IP addresses that resurface repeatedly on the blacklist. In particular, the top 10,000 malicious IP addresses are reused quite often, on average dropping off and reappearing on the blacklist nearly four times a month. Webroot also adds
many IP addresses that weren’t previously malicious to the blacklist. Throughout 2014, the average number of net new IP addresses added per day was over 85,000. This reinforces the importance of using an IP blacklist that is consistently updated in near real time to enable security teams to proactively block threat actors behind those IPs, such as stopping spam and distributed denial of service (DDoS) traffic by limiting the exposure to dangerous or risky IPs. As an example, a highly security conscious bank may choose to block anything with a score lower than 80, while others may choose to accept traffic from IPs with scores higher than 60 as long as the site being accessed is affiliated with a partner.
Malicious IP addresses come from all over the world, but are concentrated in certain countries and regions. The United States accounts for over 30% of malicious IP addresses, followed by China and Russia, per Figure 3 (below). In fact, half of malicious IP addresses are based in Asia.
31% United States
China
Russian Federation
South Korea
Vietnam
Ukraine
Germany
Australia
Chile
Netherlands
23%
10%
8%
4%
4%
2%
1%
1%
1%
Figure 3: Top 10 Threat IP Origin Countries

9
Another interesting finding from the malicious IP address data involves threat types, such as spam sources, scanners, proxies, web attacks, phishing, and others. Based on the types of malicious activity that each IP address is involved in, it is categorized as having a primary threat type. Spam sources make up the vast majority of all malicious IPs by threat type—approximately 90%. These threats are typically very short-lived, often existing
for only hours or even minutes, but by using current blacklists, organizations can successfully stop spam and related botnets by blocking the associated IP addresses.
Figure 4 shows the percentage of malicious IPs by threat type, excluding the predominant spam/botnet sources type. Scanners make up roughly half of the remaining threats, with proxies following closely behind.
Proxy 41% Scanners 51%
Web Attacks 6% Other 2%
Figure 4: Malicious IPs by threat type in 2014, excluding spam sources

10
Webroot regularly classifies and monitors the reputations of over 20 billion URLs, and makes that
intelligence available through the BrightCloud® Web Classification Service and the BrightCloud®
Web Reputation Service.
The Webroot BrightCloud Web Classification Service offers up-to-date and accurate website
intelligence across 83 site security categories to help enterprises secure users against online
threats, control internet usage, and ensure compliance by implementing sensible web access
policies. Similar to the IP Reputation Service, the BrightCloud® Web Reputation Service utilizes a
five-tiered scoring system to assess the risk of a specific URL based on its site history, age, rank,
location, networks, links, and real-time performance, as well as other contextual and behavioral
trends. This website security check adds a layer of real-time protection to web defenses by
accurately assessing the risk posed when opening a URL, independent of its category.
At this time, the BrightCloud analysis engine classifies and scores over 2,500 URLs per second
with much higher accuracy rates than can be achieved by human analysts. This speed and
accuracy allows for a unique perspective into the online world.
Webroot BrightCloud Web Classification and Web Reputation
of all URLs are trustworthy.
11
Key Findings on URLs
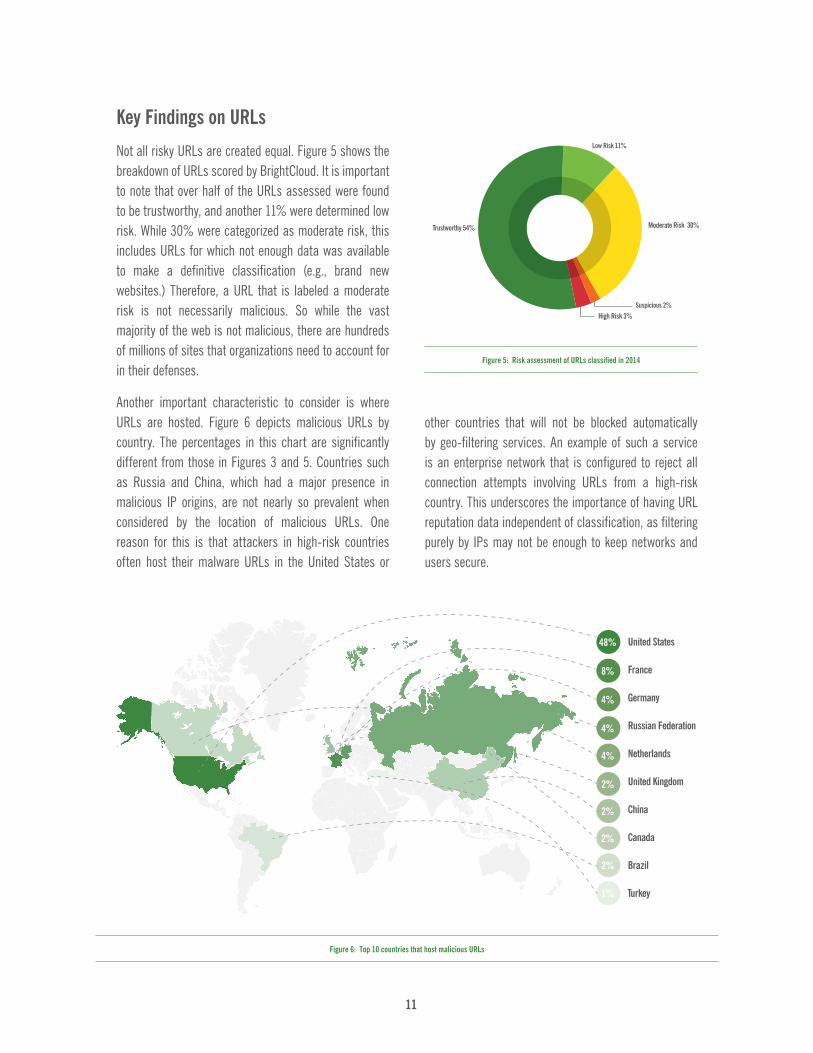
Not all risky URLs are created equal. Figure 5 shows the breakdown of URLs scored by BrightCloud. It is important to note that over half of the URLs assessed were found to be trustworthy, and another 11% were determined low risk. While 30% were categorized as moderate risk, this includes URLs for which not enough data was available to make a definitive classification (e.g., brand new websites.) Therefore, a URL that is labeled a moderate risk is not necessarily malicious. So while the vast majority of the web is not malicious, there are hundreds of millions of sites that organizations need to account for in their defenses.
Another important characteristic to consider is where URLs are hosted. Figure 6 depicts malicious URLs by country. The percentages in this chart are significantly different from those in Figures 3 and 5. Countries such as Russia and China, which had a major presence in malicious IP origins, are not nearly so prevalent when considered by the location of malicious URLs. One reason for this is that attackers in high-risk countries often host their malware URLs in the United States or
other countries that will not be blocked automatically by geo-filtering services. An example of such a service is an enterprise network that is configured to reject all connection attempts involving URLs from a high-risk country. This underscores the importance of having URL reputation data independent of classification, as filtering purely by IPs may not be enough to keep networks and users secure.
48%
Figure 6: Top 10 countries that host malicious URLs
United States
France
Germany
Russian Federation
Netherlands
United Kingdom
China
Canada
Brazil
Turkey
8%
4%
4%
4%
2%
2%
2%
2%
1%
Figure 5: Risk assessment of URLs classified in 2014
Trustworthy 54%
Low Risk 11%
Moderate Risk 30%
High Risk 3%Suspicious 2%

12
Figure 7: Top 15 Suspicious to High Risk website categories, excluding Malicious categories
100%
90%
80%
70%
60%
50%
40%
30%
20%
10%
0%
Online G
reeting C
ards
Dynamically Generated Content
Marijuana
Transla
tion
Web-based Email
Personal Storage
Abused Drugs
Motor Vehicles
Computer & In
ternet Security
Image a
nd Video Search
Social Networking
Individual Stock A
dvice &
Tools
Questionable
Peer to Peer
Recreation & Hobbies
All Categorie
s
High Risk Suspicious Moderate Risk Low Risk Trustworthy
To further analyze this data, Webroot looked at the 83 categories that are used to classify URLs, such as content delivery networks, online greeting cards, and translation services. The BrightCloud Web Classification Service includes six categories of high-risk URLs, which are known spam URLs, malware sites, phishing, proxy avoidance and anonymizers, spyware/adware, and botnets. Excluding those categories, Figure 7 shows the top 15 categories in terms of high risk and suspicious activity, and their relative distributions of suspicious, moderate risk, low risk, and trustworthy URLs. These are sites that may have been compromised and not remediated, or have been correlated to other malicious URLs, IP addresses, files, or mobile apps.
Users and networks need to be kept safe from hundreds-of-millions of malicious websites.
Online Greeting card websites have the highest likelihood of being suspicious, followed by Dynamically Generated Content sites, which is, typically, a highly trustworthy category. Computer and Internet Security sites have a disproportionately high percentage of high risk URLs, as they include references to security analysis that mentions malicious URLs and related content, and may even include links for legitimate reasons, such as security blogs. Please note that the All Categories designation is an average across all 83 categories, including the malicious categories mentioned earlier, accounting for the relatively high risk score.

13
In Figure 8 (below), the left column shows the top 10 most commonly visited URL categories, while the right column reflects the top 10 suspicious to high-risk URL categories. Naturally, URLs in malicious categories pose the most risk. When excluding those malicious categories, the greatest percentage of suspicious to high risk URLs are Business and Economy, Society, Shopping, Travel, and Health and Medicine.
Conversely, some categories that might be assumed suspicious or unwanted due to their nature are relatively reputable when compared to average scores. An example is URLs tied to the Cheating category, for which nearly 85% are Trustworthy or Low Risk, as compared to the average for all URLs of 65%. Other such categories include Hate and Racism (82% Trustworthy or Low Risk), Gross (81%), Violence (77%), Illegal (67%), Adult and Pornography (65%), and Nudity (65%). While enterprises—and households, for that matter—may not want their users to visit these types of sites, access and limitations thereof must be based on reliable classifications, as reputation scores alone cannot cover these sites based on preference.
A list of categories used by Webroot can be found at www.brightcloud.com.
Figure 8: Breakdown of top 10 URL Categories in 2014
Attackers in high-risk countries are hosting malicious sites in more trustworthy countries.
Business and Economy 21.2%
Society 12.8%
Travel 6.4%
Adult and Pornography 5.7%
Shopping 5.4%
Personal sites and Blogs 4.8%
Entertainment and Arts 4.0%
Health and Medicine 2.7%
Computer and Internet Info 2.5%
News and Media 2.3%
1
2
3
4
5
6
7
8
9
10
Top 10 Categories for URLs Top 10 Categories Suspicious to High Risk URLs
Spam URLs 30.9%
Malware Sites 13.7%
Business and Economy 7.8%
Proxy Avoidance and Anonymizers 6.7%
Phishing and Other Frauds 6.4%
Society 5.1%
Shopping 5.1%
Travel 2.7%
Health and Medicine 1.8%
Entertainment and Arts 1.8%
1
2
3
4
5
6
7
8
9
10

14
of internet users access phishing sites.
The Webroot BrightCloud® Real-Time Anti-Phishing Service provides time-of-need analysis of
sites to automatically determine whether they are phishing sites within milliseconds. Real-time
analysis is critical with phishing sites because they are often only online for a few hours, or
until a threshold of visits has been reached. While static blacklists will never be sufficient for
dynamic phishing protection, real-time detection can protect against websites that are only a
few seconds old.
The BrightCloud Real-Time Anti-Phishing Service is used by security vendors to protect their
clients and get phishing sites taken down. In 2014 Webroot added additional language support
and conducted a phased roll-out of real-time anti-phishing to the Webroot SecureAnywhere™
protection suite for endpoints. With the additional inputs, the average number of phishing sites
detected by Webroot saw a significant increase in starting in the last quarter of 2014. Accordingly,
data presented in this section covers the time period between October and December 2014.
Webroot BrightCloud Real-Time Anti-Phishing

15
During the final three months of 2014, approximately 2.5% of Webroot customers experienced a first contact with a zero-day phishing site each month. All subsequent contact attempts by Webroot customers were automatically blocked. While 2.5% is not a significant number in itself, when extrapolated over the course of a year it yields a 30% chance of a user falling for a phishing attack that involves a fraudulent zero-day URL. This indicates how important it is to have real-time anti-phishing security controls in place to prevent such attacks from succeeding.
As expected, phishing attacks surge during certain times of the year or when major world events occur. For example, there was a major spike in the data when the Charlie Hebdo tragedy occurred in early 2015. Additionally, during the last week of December 2014, there was a 50%+ increase in phishing activity when compared with the rest of the quarter, most likely due to the holiday season; it is assumed that this is related to the anticipated addition of new devices and device users.
Figure 9: Weekly unique phishing URLs from October to December 2014
60,000
50,000
40,000
30,000
20,000
10,000
0
11/5/14 11/12/14 11/19/14 11/26/14 12/3/14 12/10/14 12/17/14 12/24/14 12/31/14 1/7/15
There is a 30% chance of internet users falling for a zero-day phishing attack in the course of a year.
Key Findings on Phishing

16
Examining zero-day phishing data to discover which types of websites are being targeted yields interesting results. Webroot inspected data from the top 60 companies impersonated by phishing sites in 2014. Figure 10 (right) shows that financial services and technology companies were nearly even when it came to the total number of phishing sites.
While the distribution of phishing sites may be similar among technology companies and financial institutions, the number of companies within each category that are being attacked is not. Figure 11 (right) demonstrates that over 80% of the companies impersonated were financial institutions. However, there are many more phishing attempts per technology company than per financial institution. On average there are nearly 900 phishing attempts detected per financial institution, but over 9,000 attempts detected per technology company.
Within these categories, the following are the top 5 impersonated companies within the technology space and financial institutions, pulled from the top 60 targets examined.
Figure 11: Percentage of companies impersonated by phishing sites
Figure 10: Percentage of phishing sites by industry category
Technology 55.6% Financial 44.3%
Shipping .2%
Technology 14.5%
Financial 82.3%
Shipping 3.2%
When evaluating phishing sites by country, the United States is by far the largest host of phishing sites, with over 75% of sites being within its borders. This can be accounted for, in part, due to the larger percentage of Webroot customers being in the United States. Additionally, phishing attacks often target victims based on economic standing, so they typically focus on more developed nations, providing a higher return on investment for attackers.
Google 35.6%
Apple 23.8%
Yahoo 18.6%
Facebook 13.3%
Dropbox 6.6%
Other notables: Microsoft, Blizzard, and Adobe
1
2
3
4
5
Top 5 Technology Company Phishing Targets Top 5 Financial Institution Phishing Targets
PayPal 52.2%
Wells Fargo 17.9%
Bank of America 12.2%
Chase 4.6%
Lloyd’s Bank 4.5%
Other notables: NatWest, Royal Bank of Canada, Navy Federal
1
2
3
4
5
Figure 12: Top 5 impersonated companies within the technology and financial institution categories
17
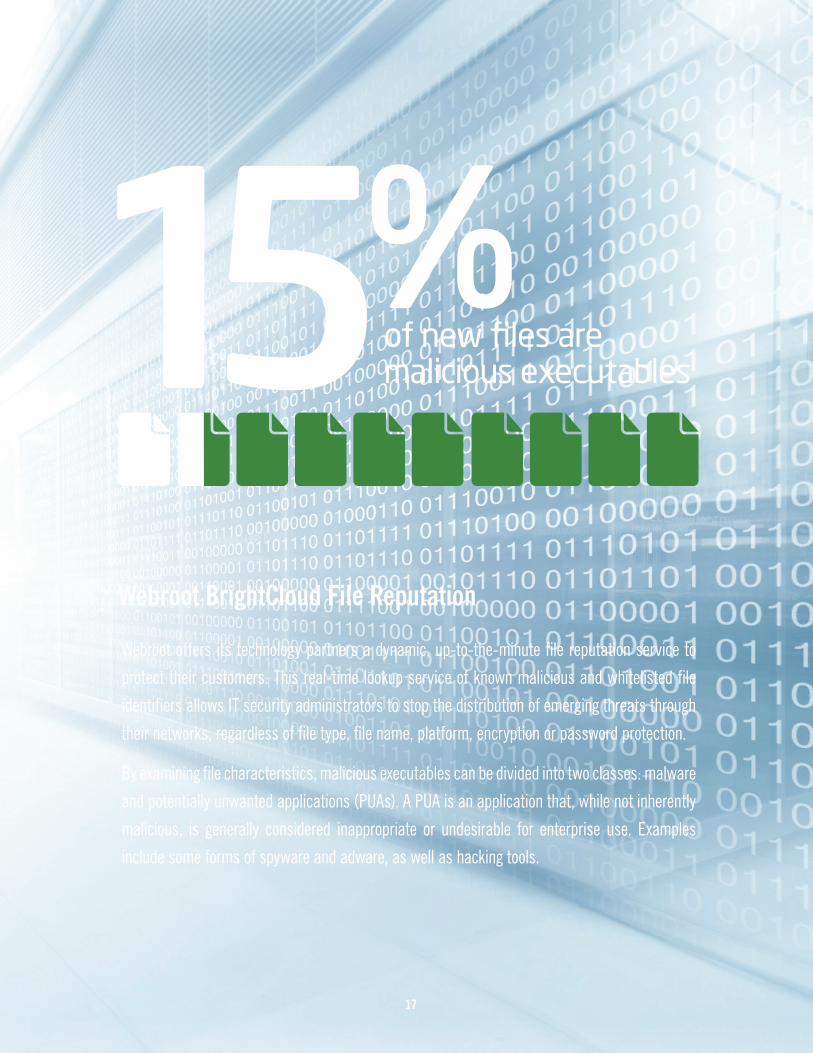
Webroot offers its technology partners a dynamic, up-to-the-minute file reputation service to
protect their customers. This real-time lookup service of known malicious and whitelisted file
identifiers allows IT security administrators to stop the distribution of emerging threats through
their networks, regardless of file type, file name, platform, encryption or password protection.
By examining file characteristics, malicious executables can be divided into two classes: malware
and potentially unwanted applications (PUAs). A PUA is an application that, while not inherently
malicious, is generally considered inappropriate or undesirable for enterprise use. Examples
include some forms of spyware and adware, as well as hacking tools.
Webroot BrightCloud File Reputation
of new files are malicious executables

18
Hundreds of millions of unique executable files were seen by Webroot for the first time in 2014. Of these files, approximately 3.4% were determined to be malware, and 12% were identified as PUAs.
On average, each Webroot user encountered 1.3 new, unique instances of malware, and 4.6 new, unique instances of PUAs during 2014. This shows how rapidly executable threats are emerging and how highly customized and targeted they are, based on the sheer number of unique instances of malware and PUAs.
Besides their volume, what’s interesting about malware and PUAs is how different they are in terms of variations. In 2014, Webroot detected an average of almost 700 file instances per malware family, but an average of nearly 30,000 file instances per PUA family. This corresponds to the identification of over 14,000 malware families and just over 1,000 PUA families. What this means is that a kind of malware is spread to far fewer users than a kind of PUA. This may be due to PUAs not being detected and blocked in many environments because of their questionable, but not necessarily malicious, nature.
In addition to these high-level encounter statistics, 2014 saw significant growth in both volume and complexity of crypto ransomware. In total, there were 15 unique families discovered and hundreds of variants, including widely prevalent CTB/Critroni and Cryptowall 3.0. Each family introduced new innovative social engineering techniques and complexity to the encryption process. Tactics included using Twitter to list those who paid the ransom, impersonating decryption tools as a vector for infection, offering one free file decryption to prove recovery is possible, and targeting gamers and game mods to further motivate a ransom payment.
2014 also brought an increase in innovative techniques to infect PCs. Most notable was the discovery of Poweliks, a Windows registry exploit capable of persisting and delivering new malware to an infected PC. What made Poweliks so powerful is that it was fully contained in the registry and did not require a file component to deliver a new infection. While Poweliks did not make the news until August of 2014, largely due to its delivery of crypto ransomware, Webroot first identified and began protecting its customers against this infection in March of 2014. Analysis of earlier examples revealed two additional techniques for applying the registry exploit, with the final version using Windows PowerShell.
Figure 13: Simplified breakdown of file reputation categories in 2014
Other 85%
Malware 3%
PUAs 12%
Key Findings on Files

19
The BrightCloud® Mobile App Reputation Service helps vendors who provide mobile management
and security solutions address the new security vulnerabilities that mobility creates. The service
continuously analyzes applications from app stores and other online sources, identifying threats
and allowing IT security admins to restrict access to applications based on individual polices and
risk tolerance, to deliver safe and compliant applications to their users.
Webroot has streamlined the process of analysis to provide concise classification and other
information on mobile apps. A six-tiered classification enables Webroot partners to implement
effective mobile app usage policies. This provides flexibility for partners to decide how to use the
app information and adapt it for specific management requirements.
Webroot BrightCloud Mobile App Reputation
of Mobile Apps are Trustworthy or Benign
ONLY
20
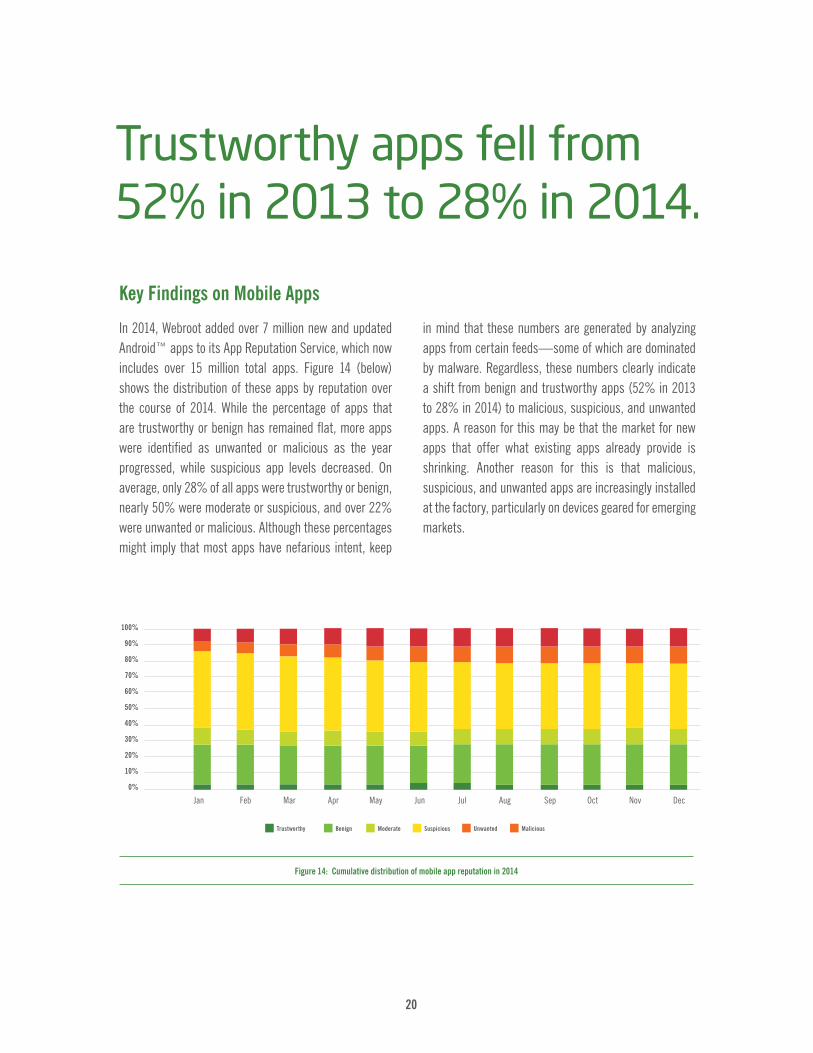
In 2014, Webroot added over 7 million new and updated Android™ apps to its App Reputation Service, which now includes over 15 million total apps. Figure 14 (below) shows the distribution of these apps by reputation over the course of 2014. While the percentage of apps that are trustworthy or benign has remained flat, more apps were identified as unwanted or malicious as the year progressed, while suspicious app levels decreased. On average, only 28% of all apps were trustworthy or benign, nearly 50% were moderate or suspicious, and over 22% were unwanted or malicious. Although these percentages might imply that most apps have nefarious intent, keep
in mind that these numbers are generated by analyzing apps from certain feeds—some of which are dominated by malware. Regardless, these numbers clearly indicate a shift from benign and trustworthy apps (52% in 2013 to 28% in 2014) to malicious, suspicious, and unwanted apps. A reason for this may be that the market for new apps that offer what existing apps already provide is shrinking. Another reason for this is that malicious, suspicious, and unwanted apps are increasingly installed at the factory, particularly on devices geared for emerging markets.
Key Findings on Mobile Apps
100%
90%
80%
70%
60%
50%
40%
30%
20%
10%
0%
Jan Feb Mar Apr May Jun Jul Aug Sep Oct Nov Dec
Trustworthy Benign Moderate Suspicious Unwanted Malicious
Figure 14: Cumulative distribution of mobile app reputation in 2014
Trustworthy apps fell from 52% in 2013 to 28% in 2014.

21
Figure 15 (below) shows the relative frequency of types of threats within the malicious category, including adware, PUAs, rootkits, spyware, system monitors, Trojans and worms. Trojans make up the vast majority of malicious threats, averaging 77% for 2014. Trojans are a very broad category that includes SMS infections, which are the largest family of malicious Android apps, and fake installers. The other prevalent categories are PUAs (10%), spyware (9%), and rootkits (4%).
During December 2014, there was a notable spike across the board, with rootkits showing a nearly nine-fold increase from November’s numbers. This is likely due to the holiday season and new models of phones coming to market. For each new phone, a rooting tool is usually
released soon after. Although the impact of this is not as large as the number increase might suggest, these rooting exploits clearly continue to make their way into apps.
Android apps can also be analyzed by their apparent purpose, based on the 45 categories defined by the Google Play store. Webroot found malicious apps in each of the purpose categories, but not evenly distributed. The tools category, which includes a wide range of utilities, ranging from calculators to battery management apps, was by far the leading category for malicious apps, with 44% of all malicious apps, as shown in Figure 16 (next page).
Figure 15: Frequency of Android™ application threat types
100%
90%
80%
70%
60%
50%
40%
30%
20%
10%
0%
01/14 02/14 03/14 04/14 05/14 06/14 07/14 08/14 09/14 10/14 11/14 12/14
Trojan PUA Spyware Rootkit Adware System Monitor Worm

22
43
Note that apps in this category often require additional access to the device, making them better suited for malicious purposes. The other categories in the top 10 are Arcade & Action (8%), Casual (5%), Entertainment (5%), Personalization (4%), Brain & Puzzle (4%), Communication (3%), Social (3%), Lifestyle (2%), and Media & Video (2%). The remaining 35 categories only comprise 20% of all malicious apps. What these numbers can’t show is the details on the malware themselves. Below are some additional insights from Webroot analysts on the nature of these Android-based threats:
Nearly all Android malware types exploit the device administrator functionality to make themselves powerful and nearly un-removable. Because the device administrator popup label can be specified within the app, apps almost always spoof the names of other apps or use social engineering techniques to convince the victim that the popup is legitimate.
It’s become commonplace to emulate PC malware for Android devices. One example is the ransomware threats that have targeted PCs for years. These threats have now moved to Android devices, and include Simplelocker, the latest Svpeng variants, and Kohler. Another example is crypto-currency mining software. In 2014, mining software was discovered hidden in a number of Android apps in the Google Play store.
There’s been an ever-growing amount of SMS-related malware for Android devices, including SmsForw, Smsreg, Sms.Fakeinst, and Sms.Thief. Older SMS malware such as ShastroSms and Yzhcsms has also reemerged recently.
At the end of 2013, the popular obfuscation tool, Secapk, was widely available. It can be used for both legitimate purposes, such as preventing code theft, and nefarious purposes, such as hiding malicious content. The number of apps using Secapk is not shrinking over time. Webroot continues to see hundreds of apps per week that use Secapk for obfuscation.
1 2
Figure 16: Top 10 malicious Android apps by category in 2014
Media & Video 2%
Tools 44%
Other 20%
Lifestyle 2%
Social 3%
Communication 3%
Brain & Puzzle 4%
Personalization 4%
Entertainment 5%
Casual 5% Arcade & Action 8%

23
Webroot BrightCloud Mobile App Reputation
Webroot data clearly shows that threats are coming from all over the world and
that these threats are extremely dynamic in nature. IP address blacklists need to
be updated continuously to keep up with new attacks and attackers who thwart
blacklists by quickly migrating IP addresses. Phishing attacks also come and
go quickly, with approximately 30% of users falling for a zero-day phishing site
annually, making real-time anti-phishing security controls a necessity.
CONCLUSION
The data also shows trends in benign versus malicious content. Based on the data from URL reputation services, users should be made aware that just because a URL category appears benign or malicious, that it doesn’t indicate the actual nature of its websites. In addition, a staggering number of executable files—over 15% of those encountered—were determined to be malware or potentially unwanted applications. On average, each user encountered 6 new, unique instances of these questionable applications, which demonstrates how highly customized and targeted these applications have become in order to infiltrate systems successfully.
A final area of study is the reputation of Android apps. With the number of benign and trustworthy apps falling by almost half from 2013 to 2014, and the number of malicious,
suspicious, and unwanted apps nearly tripling in that same time period, Android device users are being threatened more often than ever before.
In summary, organizations need to bolster their security posture with real-time, highly accurate threat intelligence to protect themselves from cybercriminal activity. This enables them to set proactive policies to automatically protect networks, endpoints, and users as part of a defense-in-depth strategy. This is crucial when security teams consider the threat landscape as a whole, in addition to conducting in-depth analysis on the threats targeting them. Individuals also need to be more vigilant than ever about the websites they visit, the URLs they follow from emails, and the applications and mobile apps that they use.
– The Webroot Threat Research Team
Discover more about the power of collective threat intelligence by visiting www.webroot.com and www.brightcloud.com, where you’ll also able to access insightful analyst reports. You can also learn about smarter cybersecurity solutions from Webroot by contacting your local Webroot office located on the back of this report.

© 2015 Webroot Inc. All rights reserved. Webroot, Webroot BrightCloud and BrightCloud are trademarks or registered trademarks of Webroot Inc. in the United States and/or other countries. All other trademarks are properties of their respective owners.
About WebrootWebroot provides intelligent cybersecurity for endpoints that harnesses collective threat intelligence to protect the Internet of Everything. We protect consumers, businesses and technology providers from malware and other cyberattacks using a cloud-based threat intelligence network. Computers, tablets, smartphones and the Internet of Things can be protected by our award-winning suite of SecureAnywhere® and BrightCloud® products. Webroot protects over 30 million devices and is trusted by market-leading technology companies, including: Cisco, F5 Networks, HP, Microsoft, Palo Alto Networks, and RSA. Webroot is headquartered in Colorado and operates globally across North America, Europe and the Asia Pacific region. Discover smarter cybersecurity at www.webroot.com and www.brightcloud.com.
World Headquarters385 Interlocken CrescentSuite 800Broomfield, Colorado 80021 USA
+1 800 772 9383
Webroot EMEA6th floor, Block A 1 George’s Quay PlazaGeorge’s Quay, Dublin 2, Ireland
+44 (0) 870 1417 070
Webroot APACSuite 1402, Level 14, Tower A821 Pacific HighwayChatswood, NSW 2067, Australia
+61 (0) 2 8071 1900


![Collective intelligence - esalq.usp.br€¦ · Contents [hide] 1 Collective intelligence as a property of the living 2 Collective intelligence as a research field 3 Collective intelligence](https://static.fdocuments.us/doc/165x107/5b98bbed09d3f2ef798c9bc3/collective-intelligence-esalquspbr-contents-hide-1-collective-intelligence.jpg)


