
Insight & Outlook - Freddie Mac
17
Economic & Housing Research Buy-to-Rent Goes Big Time? Maybe. My childhood home was situated on a very deep lot. The backyard extended far behind the house, providing an ideal playground. On many days, the backyard became the planet Mongo, and I was transformed into Flash Gordon. The little girl next door became my companion, Dale Arden. When I was in a generous mood, my younger brother became the brilliant scientist, Dr. Zarkov. More often, I forced him to be a space monster, shortly to be vaporized. Mongo was destroyed suddenly when someone more powerful than Flash Gordon (i.e., my father) decided to convert our house into a duplex and to rent out the back unit. I was demoted from Flash Gordon, intergalactic hero, to the maintenance crew for our duplex. The single-family rental market The single-family rental market provides an alternative to renting an apartment in a larger complex, and our duplex was typical of much of the single-family rental market. A homeowner becomes a landlord to augment their income. Like my family, they may expand their home to a duplex if they have the space. Or they may buy a nearby home that looks like a promising rental property. Or they may inherit a family home that can be rented out. Or they may retain their starter home as a rental when they move up to a larger house. The rental generally is a sideline, not the landlord’s primary source of income. A 1996 survey found that three quarters of all single-family detached rental units were owned by individuals or partnerships that owned fewer than ten units, and some analysts have estimated that about half of the nation’s single- family rental homes are owned by individuals who own a single rental property Insight & Outlook January 29, 2016 Insight: Buy-to-Rent Goes Big Time? Maybe. The large investors, backed by private equity, business model of buy-to-rent (B2R) operations stands in contrast to that of the more-familiar, professionally-managed apartment complexes. (p.1) Outlook: Headwinds to Real Economic Growth Stiffen Concerns about global growth, particularly in China have rocked financial markets and led to sharp selloffs in equities to start the year. (p.6) In Closing: Happy 21st Birthday Loan Prospector It’s easy to forget the cumbersome manual underwriting process that preceded Freddie Mac’s Loan Prospector underwriting system – a process that involved uncertainty, long delays, and lots of paperwork. (p.15) In this Edition: 1 Summary 2015 2016 2017 Real GDP Growth (%) 1.9 2.5 2.3 CPI (%) 0.5 1.9 1.9 30-year PMMS (%) 3.9 4.3 4.9 Total originations ($B) 1750 1580 1460 Refi share (%) 48 35 24 Total home sales (M) 5.71 5.92 6.16 House price growth (%) 6.0 4.4 3.5
Transcript of Insight & Outlook - Freddie Mac

Economic & Housing Research
Buy-to-Rent Goes Big Time? Maybe.My childhood home was situated on a very deep lot. The backyard extended far behind the house, providing an ideal playground. On many days, the backyard became the planet Mongo, and I was transformed into Flash Gordon. The little girl next door became my companion, Dale Arden. When I was in a generous mood, my younger brother became the brilliant scientist, Dr. Zarkov. More often, I forced him to be a space monster, shortly to be vaporized. Mongo was destroyed suddenly when someone more powerful than Flash Gordon (i.e., my father) decided to convert our house into a duplex and to rent out the back unit. I was demoted from Flash Gordon, intergalactic hero, to the maintenance crew for our duplex.
The single-family rental market
The single-family rental market provides an alternative to renting an apartment in a larger complex, and our duplex was typical of much of the single-family rental market. A homeowner becomes a landlord to augment their income. Like my family, they may expand their home to a duplex if they have the space. Or they may buy a nearby home that looks like a promising rental property. Or they may inherit a family home that can be rented out. Or they may retain their starter home as a rental when they move up to a larger house. The rental generally is a sideline, not the landlord’s primary source of income. A 1996 survey found that three quarters of all single-family detached rental units were owned by individuals or partnerships that owned fewer than ten units, and some analysts have estimated that about half of the nation’s single-family rental homes are owned by individuals who own a single rental property
Insight & OutlookJanuary 29, 2016
Insight: Buy-to-Rent Goes Big Time? Maybe.
The large investors, backed by private equity, business model of buy-to-rent (B2R) operations stands in contrast to that of the more-familiar, professionally-managed apartment complexes. (p.1)
Outlook: Headwinds to Real Economic Growth Stiffen
Concerns about global growth, particularly in China have rocked financial markets and led to sharp selloffs in equities to start the year. (p.6)
In Closing: Happy 21st Birthday Loan Prospector
It’s easy to forget the cumbersome manual underwriting process that preceded Freddie Mac’s Loan Prospector underwriting system – a process that involved uncertainty, long delays, and lots of paperwork. (p.15)
In this Edition:
1
Summary 2015 2016 2017
Real GDP Growth (%) 1.9 2.5 2.3
CPI (%) 0.5 1.9 1.9
30-year PMMS (%) 3.9 4.3 4.9
Total originations ($B) 1750 1580 1460
Refi share (%) 48 35 24
Total home sales (M) 5.71 5.92 6.16
House price growth (%) 6.0 4.4 3.5

Economic & Housing Research
The single-family rental market expanded during the Great Recession, and, as of 2013, represented 35 percent of all rented housing units in the U.S. The growth in foreclosures increased the number of vacant single-family homes. At the same time, the reduction in the availability of mortgage credit left many families unable to purchase a home. As a consequence, many previously-owner-occupied homes became rentals.
Exhibit 1: Renter occupied 1-unit properties
Source: American Housing Survey
Employment-motivated relocations also boosted single-family rentals. Tight credit conditions and sagging house prices made it more difficult to sell existing homes. Some homeowners rented their current home in order to move to a job in another part of the country.
The emergence of large-scale buy-to-rent
In 2012, a new type of single-family rental business appeared. A few large investors, backed by private equity, started accumulating portfolios of single-family homes with the intention of renting and managing them.
The business model of these large-scale B2R operations stands in contrast to that of the more-familiar, professionally-managed apartment complexes. Intuitively, it seems that large apartment complexes should be more cost-efficient to manage and maintain than a network of scattered single-family houses. Apartment units can be built with standardized infrastructure (appliances, plumbing, etc.) making maintenance and repairs more efficient. The costs of amenities – landscaping, common areas, gyms, etc. – can be spread across all the units in the complex. Management and maintenance staff can be located on site.
None of these advantages are present for large-scale single-family rentals. Maintenance crews must travel between houses, adding to time and cost. No two houses are alike, making it difficult to stock parts for rapid repairs. Collecting rents and dealing with tenant requests also can be more difficult in a network of scattered houses than in apartments located in a single complex.
The collapse of house prices may help to explain the appearance of B2R companies. The drop in the acquisition cost of single-family homes may have outweighed the presumably-higher management and maintenance costs of a
2

Economic & Housing Research
single-family network. And the decline in home ownership – some by choice, some by necessity – generated new demand for single-family rentals, particularly among people who may not have found apartment living attractive.
Is large-scale buy-to-rent simply a product of the house price collapse, a one-time bargain purchase? If so, we might expect it to be a temporary phenomenon. Alternatively, if there has been a permanent shift away from home ownership toward renting – particularly among families – and if B2R firms have developed new and more efficient ways to manage a network of single-family houses, large-scale buy-to-rent may be here to stay.
Evidence on Buy-to-Rent Firms
A recent paper by James Mills, Raven S. Molloy, and Rebecca E. Zarutskie (MM&Z) provides a look at the business models of the eight largest buy-to-rent (B2R) firms. MM&Z track the house purchases of these firms from 2012 through 2014 and compare the characteristics of these houses to the characteristics of the purchases of other large investors. MM&Z focus exclusively on detached homes; they exclude townhouses, condominiums, and other property types that commonly are rented. (That leaves my family’s duplex out of this study.) MM&Z divide the purchasers of these houses into several groups: individuals (who may rent, resell, or occupy the houses); corporate investors broken into micro (1-2 properties/year), small (3-10 properties/year), medium (11-50 properties/year) and large (more than 50 properties/year) size categories; and, finally, the eight largest B2R firms.
Although B2R has attracted a great deal of attention, MM&Z find that it remains a small part of the single-family housing market. Purchases by the eight firms studied by MM&Z totaled $16 billion from 2012 through 2014 and never exceeded 2 percent of the market in any of these three years.
Are large-scale B2R firms in single-family rental for the long haul?
The data compiled by MM&Z may provide clues about the future of large-scale buy-to-rent. If this phenomenon is driven primarily by the extraordinary collapse in house prices, we might expect B2R firms to concentrate on areas hard hit by the housing collapse and to focus on distressed properties in those areas. We might also expect B2R firms to resell properties as soon as house prices recover. Alternatively, if the large-scale B2R business model represents a lasting feature of the rental market, we might expect B2R firms to purchase houses most likely to appeal to single-family renters and to hold those properties longer.
Do large-scale B2R firms focus on distressed properties?Exhibit 2 displays the share of foreclosures, short sales, REOs, and non-distressed properties in B2R purchases from 2012 through 2014 and compares them to purchases by other large corporate investors. Non-distressed properties comprised a growing share of B2R purchases, from around a third of purchases in 2012 to about a half in 2014. Also, in each year, the eight B2R firms purchased a higher share of non-distressed properties than other large investors.
Focusing on the distressed properties, B2R firms purchased a significantly smaller share of REOs than other large investors. REOs tend to be in poorer condition than foreclosures and short sales. The relatively small share of REOs in B2R purchases may signal the intention of B2R firms to rent the houses they purchase for an extended period. Another indication is the relatively large expenditure of B2R firms on renovations; on average B2Rs spend an amount equal to 20 percent of the purchase price on renovations.
3

Economic & Housing Research
Exhibit 2: Share of purchases by type of sale
Where do large-scale B2R firms purchase houses?B2R purchases are concentrated in a few metro areas, particularly in the Southeast, where B2R comprises a significant share of purchases. For example, B2R firms accounted for 12 percent of single-family house purchases in the Atlanta metro area in 2013. In 2012, three-quarters of all buy-to-rent purchases were in ten metropolitan areas (15 metropolitan areas in 2013 and 2014). Moreover, within a single metro area, houses purchased by B2R firms tended to be more tightly clustered than houses purchased by other investors.
This geographic concentration is a mixed signal. If B2R is a long-term business model, it makes sense to acquire properties near each other to minimize operating costs. However, this clustering also could reflect a strategy of favoring areas which suffered greater-than-average house price declines or had greater-than-average expected house price recoveries.
Exhibit 3 compares house price changes nationally to the changes in metro areas with a significant B2R concentration. The left-panel of Exhibit 3 compares the house price decline from the June 2006 national peak to the average time of purchase – in other words, did the B2R firms target especially hard-hit metros? In 2012 and 2013, areas with a concentration of B2R purchases had suffered larger house price declines than the rest of the nation. In 2014, the difference between house price declines in B2R metros and the nation is negligible.
The right-panel of Exhibit 3 compares the house price recovery from the average time of purchase to the middle of 2015 – in other words, did B2R invest in metros with relatively favorable growth prospects? The areas with B2R concentrations in 2012 enjoyed significantly higher rates of house price appreciation than the rest of the nation. On average, there does not appear to be meaningful house price appreciation differences in the areas with B2R concentrations in 2013 and 2014. Overall, MM&Z find that areas favored by B2R recorded higher-than-average house price appreciation in the two years subsequent to the purchases.
4

Economic & Housing Research
Exhibit 3: House price changes in metros with concentrations of large-scale B 2R
What types of houses do large-scale B2R firms purchase?MM&Z find that houses purchased by B2R firms tended to be newer, larger, and on smaller lots than houses purchased by other large investors. These differences are consistent with the view that B2R firms intend to rent these houses for an extended period rather than resell them. Heating and cooling, plumbing, and electrical systems in newer homes are likely to need less renovation and maintenance. Moreover, replacement parts for newer infrastructure systems and major appliances are likely to be more readily available. Smaller lot sizes require less landscaping maintenance. The larger size and greater number of bedrooms of the B2R houses suggests that the B2R business model targets families that might find traditional apartment accommodations too confining.
Conclusion
Single family rental is a significant component of the rental market. Historically – and currently – it is dominated by individuals and small partnerships. The emergence of large-scale buy-to-rent in recent years potentially represents a new feature of this market sector. Undoubtedly, the house price collapse following 2006 provided large-scale operators with an extraordinary opportunity to launch their operations. But, while the data is mixed, there are some signs that large-scale firms intend to manage their large portfolios of single-family rentals as an on-going business.
5

Economic & Housing Research
Outlook: Headwinds to real economic growth stiffenThe beginning of 2016 has coincided with worrying reports from overseas and turmoil in financial markets. Concerns about global growth, particularly in China, have rocked financial markets and led to sharp selloffs in equities to start the year. Domestic U.S. economic data has been mixed, with disappointing automotive and retail sales in December somewhat offset by a strong employment report. On balance, risks to the downside for economic growth have increased since our last Outlook.
Tracking data for fourth quarter 2015 growth has been negative and we’ve revised down our forecast for full-year 2015 real GDP growth a tenth of a percentage point to 1.9 percent. The current expansion is the weakest in postwar history. According to our forecast, 2016 will mark the sixth full year of sub-3-percent economic growth. During prior postwar U.S. expansions economic growth averaged over 4 percent per year. The prospects for 2016 and 2017 are a little brighter, with real GDP growth projected to be 2.5 and 2.3 percent respectively, but still well below the postwar average.
The outlook for inflation is equally subdued. If oil prices stabilize and dollar appreciation slows, we should see a bounce in headline consumer price inflation. However, recent data suggest this bounce will be delayed. We’ve lowered our 2016 and 2017 forecast for headline consumer price inflation to 1.9 percent in both years. And core inflation is likely to remain well below the Federal Reserve’s target of two percent for the next two years.
The bright spot in recent economic reports has been the labor market. Job growth in December beat expectations, with the economy adding 292,000 jobs. Total job gains for 2015 were 2.65 million (+1.9%), the second best year since 1999. Construction employment growth outpaced the total economy, increasing 4.2 percent for the year.
While the December report was strong, there are still some signs of weakness. The labor force participation rate ticked up to 62.6 percent in December, but is still down 0.1 percent for the year, and well below pre-recession levels. Some of the decline in the labor force participation rate is due to the aging population, but the participation rate for the prime working age population was flat for the year and remains down over two percentage points from December 2007. Wage growth remains anemic, with average hourly earnings flat for the month and up only 2.5 percent on a year-over-year basis.
6

Economic & Housing Research
7
Housing markets build on momentum
Despite slow economic growth, general weakness in the overall economy, and turmoil in financial markets, housing and mortgage markets should sustain their momentum from last year. Total home sales in 2015 were the highest since 2007, and we expect sales to rise another 3.7 percent in 2016. Purchase mortgage origination activity will increase in 2016, but total originations will decline as rising mortgage rates depress refinances.
Insofar as the U.S. economy is insulated from overseas financial turmoil, troubles abroad could actually be a positive for housing and mortgage markets by putting downward pressure on mortgage interest rates. For the first four weeks of 2016 interest rates on 30-year fixed rate mortgage rat have averaged below four percent. In the near term, mortgage rates could continue drifting down, before reversing course and increasing modestly for the rest of the year.
For the full year, we expect mortgage interest rates to increase, but the pace should be subdued. Many analysts are expecting the FOMC to raise the Federal funds rate three times this year. That’s one less increase than the best public guess of the FOMC. Moreover, these increases in short-term interest rates are unlikely to generate one-for-one increases in longer-term rates like the mortgage rate. Long-term interest rates are influenced by inflation expectations and term premiums, which capture risks inherent in holding long-term bonds. Low oil prices, a stronger dollar, and stagnant wage growth have kept a lid on inflation expectations. Term premiums have declined recently, perhaps reflecting greater pessimism about global growth or reflecting more demand for liquidity given overseas financial turmoil. These factors have persuaded us to lower our 30-year mortgage rate forecast for the full year 2016 a tenth of a percentage point.
10-Year Treasury Term Premium
Source: New York Fed
Even after the projected modest increase in mortgage rates, these rates will remain at historically-low levels and thus should help to sustain home sales and housing construction in 2016. Home sales throughout 2015 showed considerable strength, except for a dip in November of 2015 that was likely a short-term drop related to the implementation of new mortgage origination disclosure standards mandated by the CFPB. With solid job gains and

Economic & Housing Research
low mortgage rates, home sales should post solid numbers in 2016. The real constraint on home sales activity is a dearth of inventory.
Tight inventories of houses for sale continue to put pressure on house prices in many regional markets. Due to the lack of available supply and rising demand, house prices have been rising rapidly across much of the country. We estimate house prices increased six percent nationally during 2015 with much stronger gains in some markets. The pace of house price increases should slow gradually as inventory comes to market and higher mortgage interest rates dampen homebuyer demand. We’re expecting house price gains of 4.4 percent and 3.5 percent in 2016 and 2017 respectively.
Mortgage originations decrease in 2016
With solid home sales and strong house price gains, purchase mortgage activity should be robust in 2016. For the full year 2016, we expect purchase mortgage and home improvement originations to increase by about $117 billion dollars (+12.9%). This 12.9 percent increase is a function of 3.7 percent higher home sales, 4.4 percent higher house prices and a reduction in the all-cash share of home sales. For 2017, we expect more gains with purchase mortgage and home improvement originations increasing an additional $83 billion (8.1%) to $1.11 trillion.
But increased home purchase and home improvement originations will not be enough to offset declining refinance volume. Total mortgage originations are projected to decrease $170 billion (9.7%) and $120 billion (-7.6%) in 2016 and 2017 respectively.
Refinance potential is uncertain
Refinance volume is the greatest uncertainty in our originations forecast. The projected increase in mortgage rates will reduce rate/term refinances – that is, refinances motivated by a desire to lower the interest rate on the mortgage – but perhaps not by as much as anticipated. In addition, many borrowers with HARP refinances now are in a position to refinance their HARP into a lower-rate conventional mortgage. In fact, this “unHARPing”, as we dub it, has already started.
Let’s look at the factors driving these two sources of refinance volume.
Refinance mortgage originations ($ billions)
8

Economic & Housing Research
Rate/term refinances
Outstanding Agency MBS Conv. Conforming 30-yr (Billions)
Source: Bloomberg Dec 2015
Despite years of low mortgage rates there is still a substantial volume of mortgages that could potentially lower payments through a rate/term refinance. According to data from Bloomberg, there are $655 billion in outstanding conventional 30-year MBS with a coupon greater than 4 percent. Many of those mortgages were originated years ago and the borrowers have failed to refinance even though mortgage rates have dropped steadily. However, we believe there are good reasons to expect some of them to refinance in 2016.
The house price collapse during the Great Recession left many borrowers underwater, owing more on their mortgage than the current market value of their house. Many of these borrowers were unable or unwilling to refinance – even into mortgages with significantly lower interest rates – when they were required to bring cash to the closing to reduce their loan-to-value ratio. Even today, CoreLogic estimates there are still approximately 5 million underwater homeowners. Some of these borrowers turned to the HARP program, designed to assist underwater borrowers to refinance, but many borrowers did not qualify for HARP.
Home equity has grown $6 trillion since mid-2011
Source: Federal Reserve, Z.1 Table B.101, December 10, 2015 9

Economic & Housing Research
10
Solid house price growth-about 6 percent in 2015-has been replenishing much of the home equity lost during the recession, and total household home equity has increased $6 trillion since 2011. Continued house price gains could lower potential borrowers’ LTV enough that they are able to refinance.
UnHARPing
The HARP program allowed many underwater borrowers with good payment records to refinance without paying down the balance of their current mortgage. Many borrowers who took advantage of HARP over the past five years now have built sufficient equity that a conventional, non-HARP refinance is possible with little or no cash brought to closing. Through October 2015 close to 3.4 million homeowners refinanced through the HARP program. Borrowers who refinance with HARP between 2009, when the program began, and 2012 likely have a rate over 5 percent. As these HARP borrowers gain positive equity, many of them refinance while mortgage rates are still low. In fact, we estimate about 10 percent of borrowers who received a HARP loan, have already refinanced again into a non-HARP loan. With about 2 million active HARP refinance loans in the market today, there is a substantial potential for refinance from these borrowers.
Taking advantage of the same data that we use for our Quarterly Refinance Statistics, we tracked borrowers who refinanced out of the HARP program. Our data includes matched transactions where both mortgages are funded by Freddie Mac. We are able to subset these transactions so that the first transaction was a HARP refinance and the second transaction was a non-HARP refinance. We call these matches “UnHARPing”. Key trends in UnHARPing data are presented in the figure below.
What products do UnHARPed borrowers choose?percentages of all HARP to non-HARP matched transactions
Median interest rate reduction (ppt)Contract rate on UnHARPed loan – contract rate on HARP loan
Share of UnHARP borrowers who “cash-in”% of borrowers who decrease their loan amount when UnHARPing
Median appreciation of UnHARPed loan% Difference, Value at UnHARP and Property Value at HARP
Economic & Housing Research
11
“UnHARPing” trends:
■ Shorter Terms: Borrowers who UnHARP prefer the 30-year fixed rate mortgage, but about 43 percent choose a 20-year or 15-year product up from 25 percent in HARP loans.
■ Higher Home Values: The median appreciation of an UnHARPed borrower’s property is 24.6 percent in 2015Q3, up from just 9.5% in 2011.
■ Interest Rate Reduction: Borrows who UnHARP lower their interest rates between 0.6 and 1.5 percentage points.
■ Less Cash In: Early in our sample, nearly one-quarter of all UnHARPed borrowers had to bring cash to closing to refinance. Now less than 1 in 20 UnHARPed borrowers bring cash.
Additional refinance drivers
In addition to traditional rate/term refinances and UnHARPs, there are some other potential sources of refinance activity:
ARM Resets: During the housing bubble, ARM hybrids were a popular mortgage product. When a borrower owns a hybrid, the loan is fixed for a period of time and adjustable thereafter. Typically the contract allows for a potentially large change in the interest rate at the first reset. This makes the first reset date a critical one for borrowers. With mortgage rates expected to increase, borrowers approaching reset may refinance into a fixed product to limit their risk. Over $54 billion in hybrids are due to reset in 2016.
HELOC Consolidation: HELOC originations increased during the housing boom as a way for borrowers to tap the growing equity in their homes. HELOC loans typically were originated as 10-year, interest-only loans that switch to fully amortizing loans after a decade. At the end of the interest-only period, borrowers experience a payment shock as they begin paying back both interest and principal. As the ten-year mark approaches, payments can as much as triple for many borrowers, rendering repayment impossible for some.
We expect substantial HELOC consolidation to avoid this payment shock. Borrowers will refinance their HELOCs or roll their existing HELOC into their mortgage to avoid a spike in monthly payments. Many HELOCs were originated at the peak of the home equity boom between 2004 and 2006, and CoreLogic estimates there will be about $190 billion in HELOC loans resets between Q4 2014 and 2017.
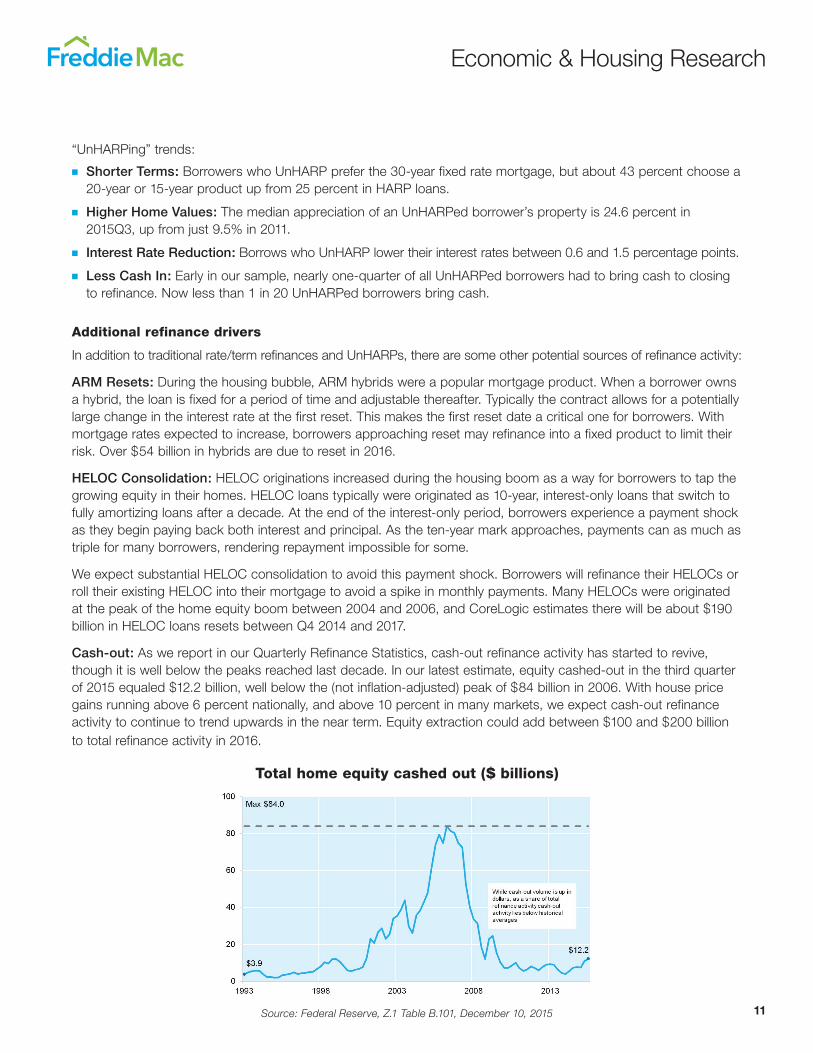
Cash-out: As we report in our Quarterly Refinance Statistics, cash-out refinance activity has started to revive, though it is well below the peaks reached last decade. In our latest estimate, equity cashed-out in the third quarter of 2015 equaled $12.2 billion, well below the (not inflation-adjusted) peak of $84 billion in 2006. With house price gains running above 6 percent nationally, and above 10 percent in many markets, we expect cash-out refinance activity to continue to trend upwards in the near term. Equity extraction could add between $100 and $200 billion to total refinance activity in 2016.
Total home equity cashed out ($ billions)
Source: Federal Reserve, Z.1 Table B.101, December 10, 2015

Economic & Housing Research
12
Housing Snapshot: A selection of key indicators
3.0
3.5
4.0
4.5
5.0
5.5
6.0
6.5
7.0
2005 2006 2007 2008 2009 2010 2011 2012 2013 2014 2015 2016
30-yr Fixed Mrtg Rate (%)
100
110
120
130
140
150
160
170
2005 2006 2007 2008 2009 2010 2011 2012 2013 2014 2015 2016
Freddie Mac House Price Index
527% 66%
3000
4000
5000
6000
7000
8000
9000
2005 2006 2007 2008 2009 2010 2011 2012 2013 2014 2015 2016
Total Home Sales (Ths., SAAR)
0
100
200
300
400
500
600
700
800
900
1000
2005 2006 2007 2008 2009 2010 2011 2012 2013 2014 2015
SF Mortgage Originations ($ Bil.)
0
10
20
30
40
50
60
70
80
90
2005 2006 2007 2008 2009 2010 2011 2012 2013 2014 2015
Refinance Share (% of UPB)
100
120
140
160
180
200
220
2005 2006 2007 2008 2009 2010 2011 2012 2013 2014 2015 2016
NAR Affordability Index

Economic & Housing Research
13
1500
2000
2500
3000
3500
4000
4500
5000
2005 2006 2007 2008 2009 2010 2011 2012 2013 2014 2015 2016
Homes for sale (Ths., NSA)
0%
5%
10%
15%
20%
25%
30%
2009 2010 2011 2012 2013 2014
Negative Equity Share
0
500
1000
1500
2000
2500
2005 2006 2007 2008 2009 2010 2011 2012 2013 2014 2015 2016
Housing Starts (Ths., SAAR)
Long-run historical average
-1
0
1
2
3
4
5
2005 2006 2007 2008 2009 2010 2011 2012 2013 2014 2015
Rent of Primary Residence (YoY %)
62
63
64
65
66
67
68
69
70
2005 2006 2007 2008 2009 2010 2011 2012 2013 2014 2015 2016
Total Homeownership Rate (%)
3000
3200
3400
3600
3800
4000
4200
4400
4600
4800
5000
2005 2006 2007 2008 2009 2010 2011 2012 2013 2014 2015
Homes for rent (Ths., NSA)

Economic & Housing Research
January 2016 Economic and Housing Market Outlook
Econ
omic
& H
ousi
ng R
esea
rch
Rev
ised
1/2
0/20
16
2015
2016
2017
Indi
cato
rQ
1Q
2Q
3Q
4Q
1Q
2Q
3Q
4Q
1Q
2Q
3Q
420
1220
1320
1420
1520
1620
17
Real
GDP
(%)
0.6
3.9
2.1
1.0
2.5
2.5
2.5
2.5
2.3
2.3
2.3
2.3
1.3
2.5
2.5
1.9
2.5
2.3
Cons
umer
Pric
es (%
) a.
-3.1
3.0
1.6
0.2
1.7
1.9
1.9
2.0
1.9
1.9
1.9
1.9
1.9
1.2
1.2
0.4
1.9
1.9
Unem
ploy
men
t Rat
e (%
) b.
5.6
5.4
5.2
5.0
5.0
4.9
4.9
4.8
4.8
4.8
4.7
4.7
8.1
7.4
6.2
5.3
4.9
4.8
30-Y
ear F
ixed
Mtg
. Rat
e (%
) b.
3.7
3.8
4.0
3.9
4.0
4.2
4.4
4.5
4.6
4.8
5.0
5.2
3.7
4.0
4.2
3.9
4.3
4.9
5/1
Hybr
id T
reas
. Ind
exed
ARM
Rat
e (%
) b.
2.9
2.9
2.9
3.0
3.1
3.3
3.6
3.8
4.0
4.2
4.4
4.6
2.8
2.9
3.0
2.9
3.5
4.3
10-Y
ear C
onst
. Mat
. Tre
as. R
ate
(%) b
.2.
02.
22.
22.
22.
22.
42.
62.
72.
83.
03.
23.
41.
82.
42.
62.
22.
53.
11-
Year
Con
st. M
at. T
reas
. Rat
e (%
) b.
0.2
0.3
0.3
0.5
0.5
0.6
0.8
1.0
1.2
1.4
1.6
1.8
0.2
0.1
0.1
0.3
0.7
1.5
2015
2016
2017
Indi
cato
rQ
1Q
2Q
3Q
4Q
1Q
2Q
3Q
4Q
1Q
2Q
3Q
420
1220
1320
1420
1520
1620
17Ho
usin
g St
arts
c.
0.98
1.16
1.16
1.13
1.23
1.28
1.33
1.38
1.43
1.48
1.53
1.58
0.78
0.92
1.00
1.11
1.31
1.51
Tota
l Hom
e Sa
les
d.5.
495.
795.
965.
605.
815.
915.
916.
066.
116.
166.
166.
215.
035.
525.
385.
715.
926.
16FM
HPI H
ouse
Pric
e Ap
prec
iatio
n (%
) e.
1.6
1.2
1.4
1.7
1.3
1.1
0.9
1.0
0.9
0.9
0.9
0.8
6.2
9.6
5.0
6.0
4.4
3.5
1-4
Fam
ily M
ortg
age
Orig
inat
ions
f.
Conv
entio
nal
$320
$390
$337
$314
$250
$351
$317
$286
$285
$299
$261
$246
$1,7
50$1
,570
$1,0
91$1
,361
$1,2
05$1
,091
FH
A &
VA$8
0$1
10$1
13$8
6$7
0$1
09$1
03$9
4$9
5$1
01$8
9$8
4$3
72$3
55$2
59$3
89$3
75$3
69To
tal
$400
$500
$450
$400
$320
$460
$420
$380
$380
$400
$350
$330
$2,1
22$1
,925
$1,3
50$1
,750
$1,5
80$1
,460
Refin
anci
ng S
hare
- O
rigin
atio
ns (%
) g.
5245
4550
4835
3028
2725
2322
7059
3948
3524
Resi
dent
ial M
ortg
age
Debt
(%) h
.-0
.32.
62.
72.
72.
73.
53.
74.
04.
04.
04.
04.
0-1
.8-0
.50.
71.
93.
54.
0
Info
rmat
ion
from
this
doc
umen
t may
be
used
with
pro
per a
ttrib
utio
n. A
ltera
tion
of th
is d
ocum
ent i
s str
ictly
pro
hibi
ted.
© 2
016
by F
redd
ie M
ac.
f. B
illion
s of
dol
lars
(not
sea
sona
lly-a
djus
ted)
; con
vent
iona
l for
201
4 ar
e Fr
eddi
e M
ac e
stim
ates
. g.
Hom
e M
ortg
age
Dis
clos
ure
Act f
or a
ll si
ngle
-fam
ily m
ortg
ages
(not
sea
sona
lly-a
djus
ted)
; an
nual
sha
re is
dol
lar-w
eigh
ted
aver
age
of q
uarte
rly s
hare
s (2
014
estim
ated
).h.
Fed
eral
Res
erve
Boa
rd; g
rowt
h ra
te o
f res
iden
tial m
ortg
age
debt
, the
sum
of s
ingl
e-fa
mily
and
mul
tifam
ily m
ortg
ages
(not
sea
sona
lly-a
djus
ted,
ann
ual r
ate)
.
Janu
ary
2016
Eco
nom
ic a
nd H
ousi
ng M
arke
t Out
look
Annu
al T
otal
s
Opi
nion
s, es
timat
es, f
orec
asts
and
oth
er v
iews
con
tain
ed in
this
doc
umen
t are
thos
e of
Fre
ddie
Mac
's Ec
onom
ic &
Hou
sing
Res
earc
h gr
oup,
do
not n
eces
sari
ly re
pres
ent t
he v
iews
of F
redd
ie M
ac o
r its
man
agem
ent,
shou
ld n
ot b
e co
nstr
ued
as in
dica
ting
Fred
die
Mac
's bu
sine
ss p
rosp
ects
or e
xpec
ted
resu
lts, a
nd
are
subj
ect t
o ch
ange
with
out n
otic
e. A
lthou
gh th
e O
ffice
of t
he C
hief
Eco
nom
ist a
ttem
pts t
o pr
ovid
e re
liabl
e, u
sefu
l inf
orm
atio
n, it
doe
s not
gua
rant
ee th
at th
e in
form
atio
n is
acc
urat
e, c
urre
nt o
r sui
tabl
e fo
r any
par
ticul
ar p
urpo
se. T
he in
form
atio
n is
ther
efor
e pr
ovid
ed o
n an
"as
is"
basi
s, wi
th n
o wa
rran
ties o
f an
y ki
nd w
hats
oeve
r.
d. M
illion
s of
hou
sing
uni
ts; t
otal
sal
es a
re th
e su
m o
f new
and
exis
ting
sing
le-fa
mily
hom
es;q
uarte
rly a
vera
ges
of m
onth
ly, s
easo
nally
-adj
uste
d le
vels
(rep
orte
d at
an
annu
al ra
te).
Annu
al T
otal
s
Prep
ared
by
the
Econ
omic
& H
ousin
g R
esea
rch
grou
p. S
end
com
men
ts a
nd q
uest
ions
to c
hief
_eco
nom
ist@
fredd
iem
ac.c
om.
Not
e: Q
uarte
rly a
nd a
nnua
l for
ecas
ts a
re s
hown
in s
hade
d ar
eas;
tota
ls m
ay n
ot a
dd d
ue to
roun
ding
; qua
rterly
dat
a ex
pres
sed
as a
nnua
l rat
es.
Annu
al fo
reca
st d
ata
are
aver
ages
of q
uarte
rly v
alue
s; a
nnua
l hist
orica
l dat
a ar
e re
porte
d as
Q4
over
Q4.
a. C
alcu
latio
ns b
ased
on
quar
terly
ave
rage
of m
onth
ly in
dex
leve
ls; i
ndex
leve
ls b
ased
on
the
seas
onal
ly-ad
just
ed, a
ll-ur
ban
cons
umer
pric
e in
dex.
b. Q
uarte
rly a
vera
ge o
f mon
thly
unem
ploy
men
t rat
es (s
easo
nally
-adj
uste
d); Q
uarte
rly a
vera
ge o
f mon
thly
inte
rest
rate
s (n
ot s
easo
nally
-adj
uste
d).
c. M
illion
s of
hou
sing
uni
ts; q
uarte
rly a
vera
ges
of m
onth
ly, s
easo
nally
-adj
uste
d le
vels
(rep
orte
d at
an
annu
al ra
te).
e. Q
uarte
rly g
rowt
h ra
te o
f Fre
ddie
Mac
's H
ouse
Pric
e In
dex;
sea
sona
lly-a
djus
ted;
ann
ual r
ates
for y
early
dat
a.

Economic & Housing Research
In Closing: Happy 21st Birthday, Loan ProspectorLoan Prospector (LP), Freddie Mac’s automated underwriting system, turns 21 this year.
Today we take for granted the convenience of this system that allows lenders electronically to submit information about a loan to Freddie Mac and to receive an almost-instantaneous decision about the acceptability of the loan to Freddie Mac. It’s easy to forget the cumbersome manual underwriting process that preceded it – a process that involved uncertainty, long delays, and lots of paperwork. It’s also easy to forget how much Loan Prospector has reduced the costs of obtaining a mortgage and expanded access to credit.
At the time of its introduction, some expressed concern that an automated underwriting system could never compete with an experienced human underwriter. Shouldn’t a human being be better at spotting subtle indications of creditworthiness (or credit risk) than a mechanical formula? After all, in the pre-LP era, loan officers were taught that the most important element in underwriting was the character of the borrower. How could a mathematical credit score take the place of character in underwriting?
As it happens, during the development of Loan Prospector Freddie Mac conducted an experiment to answer that very question. A block of loans was purchased for the experiment and then each loan was underwritten twice –once manually by experienced human underwriters and a second time by an early version of LP. The results were eye-opening. LP was far more accurate than the human underwriters at identifying the future credit performance of borrowers. Not only did LP outperform at identifying borrowers likely to experience difficulty in repaying their loans, LP also succeeded in identifying creditworthy borrowers who would have been turned down by the manual underwriting process.
While it’s difficult to calculate precisely, LP clearly has saved borrowers billions of dollars in closing costs over the last 21 years. A 1996 study estimated that borrowers would have saved $2 billion in closing costs in 1995 alone if every mortgage had used LP in place of manual underwriting. This reduction in closing costs lowers an important barrier to home ownership.
Just as important, LP helped to expand access to credit to a host of borrowers who might not fit the mold most familiar to loan officers and underwriters. Self-employed borrowers, borrowers with low down payments, members of ethnic and racial minorities, borrowers with complex combinations of risk characteristics – all of these borrowers and more have been helped by LP’s ability to cut through appearances to objective measures of credit risk.
Despite these impressive successes, calls for even-more-improved underwriting processes have increased in recent years, and Freddie Mac constantly looks for ways to improve the accuracy and reach of Loan Prospector. New credit-scoring companies have emerged that may expand the population of borrowers with reliable credit scores. Freddie Mac reviews these claims to determine whether they might improve LP. More recently, some marketplace lenders have claimed that alternative underwriting formulas – some of which dispense with credit scores completely – may be more accurate gauges of the creditworthiness of large segments of the population, especially Millennials with short credit histories. It’s too early to tell whether these unorthodox strategies will pan out, but interest in improved underwriting systems remains high.
LP’s 21st birthday is an appropriate time to celebrate the substantial benefits of automated underwriting and to look forward to even-better systems in the future. Happy 21st birthday, Loan Prospector, and many more.
14

Economic & Housing Research
Sean Becketti, Chief Economist Leonard Kiefer, Deputy Chief Economist Penka Trentcheva, Statistician Travell Williams, Statistician Matthew Reyes, Financial Analyst
www.freddiemac.com/news/finance [email protected]
Opinions, estimates, forecasts and other views contained in this document are those of Freddie Mac’s Economic & Housing Research group, do not necessarily represent the views of Freddie Mac or its management, should not be construed as indicating Freddie Mac’s business prospects or expected results, and are subject to change without notice. Although the Economic & Housing Research group attempts to provide reliable, useful information, it does not guarantee that the information is accurate, current or suitable for any particular purpose. The information is therefore provided on an “as is” basis, with no warranties of any kind whatsoever. Information from this document may be used with proper attribution. Alteration of this document is strictly prohibited.

Economic & Housing Research
Revised 1/20/2016
2015 2016 2017
Indicator Q1 Q2 Q3 Q4 Q1 Q2 Q3 Q4 Q1 Q2 Q3 Q4 2012 2013 2014 2015 2016 2017
Real GDP (%) 0.6 3.9 2.1 1.0 2.5 2.5 2.5 2.5 2.3 2.3 2.3 2.3 1.3 2.5 2.5 1.9 2.5 2.3
Consumer Prices (%) a. -3.1 3.0 1.6 0.2 1.7 1.9 1.9 2.0 1.9 1.9 1.9 1.9 1.9 1.2 1.2 0.4 1.9 1.9
Unemployment Rate (%) b. 5.6 5.4 5.2 5.0 5.0 4.9 4.9 4.8 4.8 4.8 4.7 4.7 8.1 7.4 6.2 5.3 4.9 4.8
30-Year Fixed Mtg. Rate (%) b. 3.7 3.8 4.0 3.9 4.0 4.2 4.4 4.5 4.6 4.8 5.0 5.2 3.7 4.0 4.2 3.9 4.3 4.9
5/1 Hybrid Treas. Indexed ARM Rate (%) b. 2.9 2.9 2.9 3.0 3.1 3.3 3.6 3.8 4.0 4.2 4.4 4.6 2.8 2.9 3.0 2.9 3.5 4.3
10-Year Const. Mat. Treas. Rate (%) b. 2.0 2.2 2.2 2.2 2.2 2.4 2.6 2.7 2.8 3.0 3.2 3.4 1.8 2.4 2.6 2.2 2.5 3.1
1-Year Const. Mat. Treas. Rate (%) b. 0.2 0.3 0.3 0.5 0.5 0.6 0.8 1.0 1.2 1.4 1.6 1.8 0.2 0.1 0.1 0.3 0.7 1.5
2015 2016 2017
Indicator Q1 Q2 Q3 Q4 Q1 Q2 Q3 Q4 Q1 Q2 Q3 Q4 2012 2013 2014 2015 2016 2017Housing Starts c. 0.98 1.16 1.16 1.13 1.23 1.28 1.33 1.38 1.43 1.48 1.53 1.58 0.78 0.92 1.00 1.11 1.31 1.51Total Home Sales d. 5.49 5.79 5.96 5.60 5.81 5.91 5.91 6.06 6.11 6.16 6.16 6.21 5.03 5.52 5.38 5.71 5.92 6.16FMHPI House Price Appreciation (%) e. 1.6 1.2 1.4 1.7 1.3 1.1 0.9 1.0 0.9 0.9 0.9 0.8 6.2 9.6 5.0 6.0 4.4 3.51-4 Family Mortgage Originations f. Conventional $320 $390 $337 $314 $250 $351 $317 $286 $285 $299 $261 $246 $1,750 $1,570 $1,091 $1,361 $1,205 $1,091 FHA & VA $80 $110 $113 $86 $70 $109 $103 $94 $95 $101 $89 $84 $372 $355 $259 $389 $375 $369
Total $400 $500 $450 $400 $320 $460 $420 $380 $380 $400 $350 $330 $2,122 $1,925 $1,350 $1,750 $1,580 $1,460
Refinancing Share - Originations (%) g. 52 45 45 50 48 35 30 28 27 25 23 22 70 59 39 48 35 24Residential Mortgage Debt (%) h. -0.3 2.6 2.7 2.7 2.7 3.5 3.7 4.0 4.0 4.0 4.0 4.0 -1.8 -0.5 0.7 1.9 3.5 4.0
Information from this document may be used with proper attribution. Alteration of this document is strictly prohibited. © 2016 by Freddie Mac.
f. Billions of dollars (not seasonally-adjusted); conventional for 2014 are Freddie Mac estimates. g. Home Mortgage Disclosure Act for all single-family mortgages (not seasonally-adjusted); annual share is dollar-weighted average of quarterly shares (2014 estimated).h. Federal Reserve Board; growth rate of residential mortgage debt, the sum of single-family and multifamily mortgages (not seasonally-adjusted, annual rate).
January 2016 Economic and Housing Market Outlook
Annual Totals
Opinions, estimates, forecasts and other views contained in this document are those of Freddie Mac's Economic & Housing Research group, do not necessarily represent the views of Freddie Mac or its management, should not be construed as indicating Freddie Mac's business prospects or expected results, and are subject to change without notice. Although the Office of the Chief Economist attempts to provide reliable, useful information, it does not guarantee that the information is accurate, current or suitable for any particular purpose. The information is therefore provided on an "as is" basis, with no warranties of any kind whatsoever.
d. Millions of housing units; total sales are the sum of new and existing single-family homes;quarterly averages of monthly, seasonally-adjusted levels (reported at an annual rate).
Annual Totals
Prepared by the Economic & Housing Research group. Send comments and questions to [email protected].
Note: Quarterly and annual forecasts are shown in shaded areas; totals may not add due to rounding; quarterly data expressed as annual rates. Annual forecast data are averages of quarterly values; annual historical data are reported as Q4 over Q4.
a. Calculations based on quarterly average of monthly index levels; index levels based on the seasonally-adjusted, all-urban consumer price index.b. Quarterly average of monthly unemployment rates (seasonally-adjusted); Quarterly average of monthly interest rates (not seasonally-adjusted).c. Millions of housing units; quarterly averages of monthly, seasonally-adjusted levels (reported at an annual rate).
e. Quarterly growth rate of Freddie Mac's House Price Index; seasonally-adjusted; annual rates for yearly data.