
Insert title - Ofgem · 7.1 Installation of the Smart Fuses ... Feeder Pillars ... impeded any part...
48
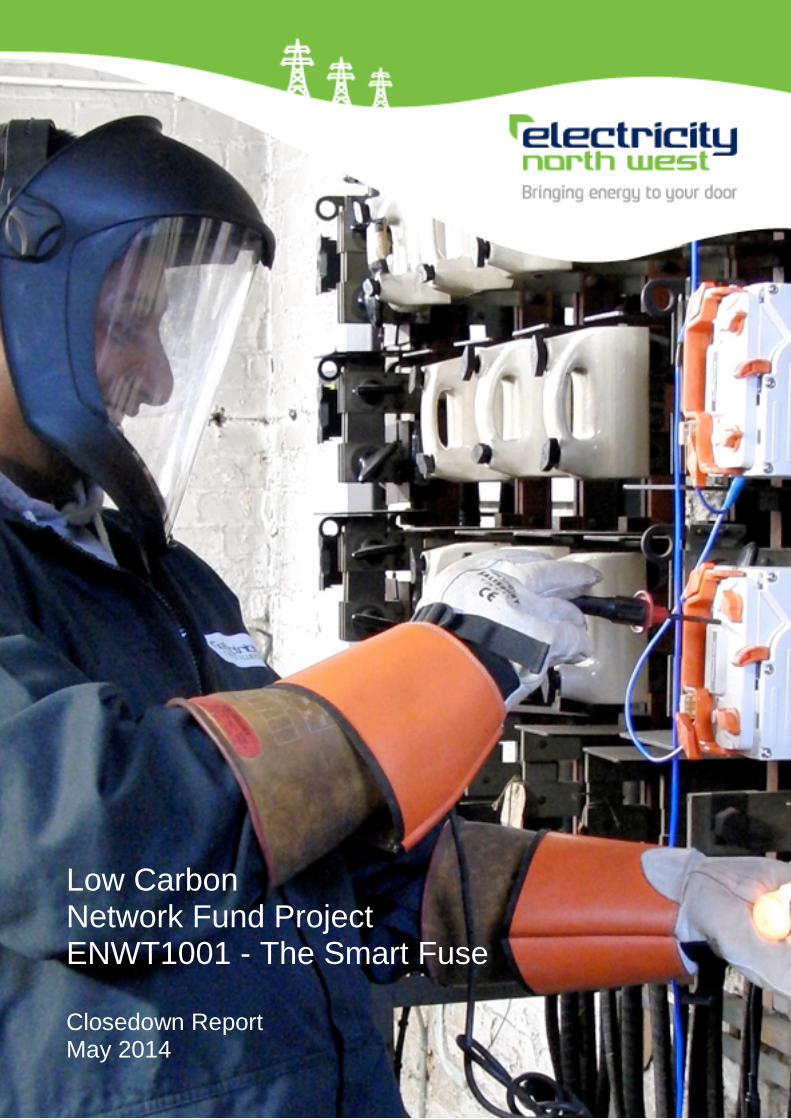
Insert title Insert subtitle Low Carbon Network Fund Project ENWT1001 - The Smart Fuse Closedown Report May 2014
Transcript of Insert title - Ofgem · 7.1 Installation of the Smart Fuses ... Feeder Pillars ... impeded any part...
Insert title
Insert subtitle
Low Carbon Network Fund Project ENWT1001 - The Smart Fuse Closedown Report May 2014
ENWT001 The Bidoyng Smart Fuse Closedown Report/May 2014/v1.0 1 of 48
CONTENTS
1 Executive Summary ...................................................................................................... 1 1.1 Aims ............................................................................................................................... 1 1.2 Methodology ................................................................................................................... 1 1.3 Outcomes ....................................................................................................................... 1 1.4 Key Learning .................................................................................................................. 1 1.5 Conclusions .................................................................................................................... 1
2 Project Title................................................................................................................... 1 3 Project Background ...................................................................................................... 1
3.1 Development of the Smart Fuse ..................................................................................... 2 4 ENWT1001 - Scope and Objectives ............................................................................. 4 5 ENWT1001 - Scale of Project ....................................................................................... 5 6 ENWT1001 - Success Criteria ...................................................................................... 5 7 ENWT1001 - Details of the work carried out ................................................................. 5
7.1 Installation of the Smart Fuses ....................................................................................... 5 7.1.1 Load Monitoring ....................................................................................................... 5 7.1.2 Fault Management................................................................................................... 8 7.1.3 Defects .................................................................................................................... 8
7.2 Data Gathering to Support Analysis of Low Voltage Networks Performance................... 8 7.2.1 Network Data ........................................................................................................... 8 7.2.2 Measured Parameters ............................................................................................. 9 7.2.3 Baseline Results (No PV) ........................................................................................ 9 7.2.4 Effects of PV on the Transformer ........................................................................... 15 7.2.5 General comments and recommendations ............................................................ 18 7.2.6 Results Summary .................................................................................................. 19
7.3 Improving Customer Service by Reducing the Impact of Transient Faults .................... 20 7.3.1 Background ........................................................................................................... 20 7.3.2 Analysis of Faults Types ........................................................................................ 20 7.3.3 LV Fault Performance Prior to the Introduction of the Smart Fuse ......................... 20 7.3.4 Improvements in IIS Performance ......................................................................... 22
7.4 LV Fault Management Policy Implementation ............................................................... 24 8 The Outcomes of the Project ...................................................................................... 26
8.1 Performance Compared To the Original Project Aims, Objectives and Success Criteria ................................................................................................................................... 26
8.2 Required Modifications to the Planned Approach during the Course of the Project ....... 27 8.3 Significant Variance in Expected Costs and Benefits .................................................... 27 8.4 Lessons Learnt For Future Projects .............................................................................. 28 8.5 Facilitate Replication .................................................................................................... 28 8.6 IPR Ownership ............................................................................................................. 28
9 Planned implementation ............................................................................................. 29 10 Academic Papers........................................................................................................ 29 11 Co-authors .................................................................................................................. 29 Appendix A - Original Project Scope and Objectives................................................................... 30 Appendix B - Total Real Power Through All Transformers .......................................................... 31 Appendix C – Installation Manual................................................................................................ 33 Appendix D – Gateway Set Up Instructions ................................................................................ 43
ENWT001 The Bidoyng Smart Fuse Closedown Report/May 2014/v1.0 2 of 48
FIGURES
Figure 3-1 - Circuit diagram of a Bidoyng ...................................................................................... 3 Figure 3-2 - Smart Fuse Development .......................................................................................... 3 Figure 3-3 - First Successful Re-close of the Smart Fuses on a UK Network ................................ 4 Figure 7-1 - Single Line Diagram of the LV Network where the Smart Fuses were installed ......... 6 Figure 7-2 - Smart Fuse Gateway ................................................................................................. 6 Figure 7-3 - Various Installation showing the types and variations of indoor and outdoor LV
Feeder Pillars ........................................................................................................... 7 Figure 7-4 - Screen Shots from the Web Server ........................................................................... 7 Figure 7-5 - Energy delivered through Keston Crescent transformer in 2012 .............................. 10 Figure 7-6 - Real and reactive power through Brinnington Mount on 12th February 2012 ........... 12 Figure 7-7 - Voltage and real power for Middlesex Road, 12th December 2011 – 9th January
2012 ........................................................................................................................ 12 Figure 7-8 - Distribution of voltages for Middlesex Road for 10/02/2012 to 21/12/2012 ............... 13 Figure 7-9 - Duration of VUF for Middlesex Road (low PV) and Dunton Green (high PV) ........... 14 Figure 7-10 - Average VUF each minute over a 24-hour period for Middlesex Road................... 14 Figure 7-11 - Voltage unbalance factor for single way of Cornwall Crescent, 17th January 2012 15 Figure 7-12 - Highest reverse power flow seen on all feeders in the Kelvatek data ..................... 15 Figure 7-13 - Reverse Power Flow for Keston Crescent ............................................................. 16 Figure 7-14 - Load duration curve for Dunton Green (all feeders) for winter and spring .............. 16 Figure 7-15 - Dunton Green, W5, Phase 1, 19/02/2012 .............................................................. 17 Figure 7-16 - Network voltage and real power flow for Dunton Green, Way 5 which has a high
penetration of PV (9th February to 26th June 2012).............................................. 18 Figure 7-17 - Distribution of voltages for Dunton Green (high PV) vs. Middlesex Road (low PV) for
10/02/2012 to 21/12/2012 ...................................................................................... 18 Figure 7-18 - Permissible penetration of PV in an LV network (for illustrative purposes). Here
50,000 load flows are performed with PV at random and feasible locations within the network ............................................................................................................ 19
Figure 7-19 – Locations of Transient Faults ................................................................................ 21 Figure 7-20 – Fault Mitigation ..................................................................................................... 26 Figure - B-1: Power through all transformers for 10th-16th February 2012 as unit of peak power . 31 Figure - B-2: Average voltage across phases on 10/02/2012 for all transformers ....................... 32
TABLES
Table 7-1 - Details of Substations where the Smart Fuses were installed ..................................... 6 Table 7-2 - Monitored Feeders ..................................................................................................... 9 Table 7-3 - Peak power through transformers in study for week 10th-16th February 2012 ......... 10 Table 7-4 - ADMD Figures .......................................................................................................... 11 Table 7-5 – Average and Standard Deviation of Voltage Unbalance for all data available for all
substations .............................................................................................................. 13 Table 7-6 - Largest voltage unbalance seen in data, and length of excursion above 2% limit ..... 14 Table 7-7 – Impact of Transient Faults 2006/7 ............................................................................ 21 Table 7-8 – Time Between Transient Faults ............................................................................... 22 Table 7-9 – Smart Fuse Performance ......................................................................................... 23 Table 7-10 – Nafirs Data for LV Transients for 2012 ................................................................... 24 Table 7-11 – Nafirs Data for LV Transients for 2013 ................................................................... 24 Table 8-1 – Performance Compared To the Original Project Aims, Objectives and Success
Criteria .................................................................................................................... 27 Table 8-2 – Forecasted and Actual Costs ................................................................................... 27 Table 8-3 – IPR Ownership ......................................................................................................... 28
ENWT001 The Bidoyng Smart Fuse Closedown Report/May 2014/v1.0 1 of 48
1 EXECUTIVE SUMMARY
1.1 Aims
The aim of the project was to both monitor and record a number of low voltage network performance metrics and reduce the impact of transient faults on our customers.
1.2 Methodology
Methodologies used for the introduction of the Smart Fuse were similar to those used for the introduction of any new technology into a DNO business. Specific training programmes including regular refresher courses were developed with Kelvatek and rolled out across out field staff as the Smart Fuse was deployed. Data analysis was carried out by Durham University.
1.3 Outcomes
The outcome of the project is a demonstration of the benefits of the Smart Fuse. The development of the device funded through the Innovation Funding Incentive was based on a cost/benefit analysis that contained a number of financial and network performance projections. Whilst these projections were based on the best available information at the time, they were still only estimated figures and the outcome of this project has allowed those projections to be improved based on real data.
1.4 Key Learning
There were a number of key learning points regarding the management of low voltage networks and the use of technology to improve this performance.
1.5 Conclusions
The Smart Fuse has been a demonstration of the positive impact of the innovation incentives available to DNOs. What began as a simple concept for a low voltage auto-reclosing device to meet a perceived has now grown into a significant business activity across a number of DNOs. The Smart Fuse is generating measurable financial benefits to DNOs and improved service to our customers and not least has created long term employment opportunities within Kelvatek.
2 PROJECT TITLE
ENWT001 The 'Bidoyng' Smart Fuse
3 PROJECT BACKGROUND
In recognition of the number of transient faults being experienced on low voltage (LV) distribution networks and the constant drive to improve customer service, Electricity North West initiated the IFI funded Fuse Restorer Project in 2006 with Kelvatek. The aim of the project was to develop a device capable of carrying two low voltage fuses in a standard size fuse carrier. The device would be designed to automatically insert a secondary fuse into a circuit following a transient fault to restore supplies to our customers and could then send an alarm to a nominated contact. Kelvatek delivered the final device in November 2010, subsequently known as the 'Bidoyng Smart Fuse' and three were installed on Electricity North West's network in Wigan, Lancashire. They successfully operated to restore supplies to over 100 customers following a transient fault at 11.30pm on 12th November 2010. Following the success of the IFI project this project funded under Tier 1 of the Low Carbon Network Fund was launched in December 2010 and was aimed at facilitating the deployment of Smart Fuses across a number of feeders to both gather a range of network performance data and to attempt to make a positive impact on customer restoration performance.

ENWT001 The Bidoyng Smart Fuse Closedown Report/May 2014/v1.0 2 of 48
As part of the original IFI funded project, financial projections were made describing the potential benefits of implementing the Smart Fuse across Electricity North West’s entire business. The ultimate aim of ENWT1001 was to move the Smart Fuse through the design, development, deployment to business as usual process and provide real data to further develop the original financial cost and benefit projections.
3.1 Development of the Smart Fuse
The Smart Fuse was developed between 2006 and 2010 by Kelvatek in response to a specification developed by Electricity North West. The original specification contained the following performance parameters;
• The unit will contain two off JP type fuses • The unit will have a panel engagement footprint of approximately 60 mm x 160 mm • The packaging volume will be made up of two parts
• Part 1 : 60 mm x 160 mm x 120 mm high • Part 2 : 85 mm x 160 mm x 30 mm high • Part 2 will sit on top of part 1 to give an overall height of 150 mm
• The unit will incorporate a handle to facilitate handling and installation, the handle must not impeded any part of the low voltage fuse pillar
• The overall height of the unit will be determined by the fundamental requirement to package the components into a compact integral unit, incorporating any additional features necessary to provide an easy to use product
• The unit will incorporate tang clamping arrangements generally as per existing products • The unit will incorporate a switch to transfer electrical load to the secondary fuse in the event of
failure of the primary fuse. Switch configurations to be investigated. Options to be considered include linear or rotary motion incorporating plates or pins
• It is desirable that the actuation of the switch should be as fast as possible. Actuation speed cannot be determined until the switch is manufactured and tested
• A delay of typically 10 seconds is acceptable between operation of the primary fuse and triggering of the switch
• The unit will incorporate a spring(s) as the motive force to operate the switch • The unit will incorporate a latching arrangement to prime the spring. The unit will be designed
to facilitate spring latching before or after installation into the electrical panel • It is envisaged that a special latching tool will be required. The design of the latching tool is
within the scope of this proposal • The unit will be designed to incorporate visual indication as to the state of the spring
mechanism i.e. latched or unlatched. It is also desirable to have an indication that the secondary fuse has failed
• The unit will incorporate a triggering mechanism to automatically unlatch the spring on detection of failure of the primary fuse
• The triggering mechanism will be designed around an electrically operated solenoid device • The electrical triggering signal will be generated from an electronic system within the unit. The
system will also verify if it is safe to trigger the switch • The unit will be of a robust construction capable of withstanding the loads experienced during
handing, installation, clamping and latching • The unit will incorporate a cover to prevent access to live components when installed into a
panel • The circuit diagram must be as shown in Figure 3-1
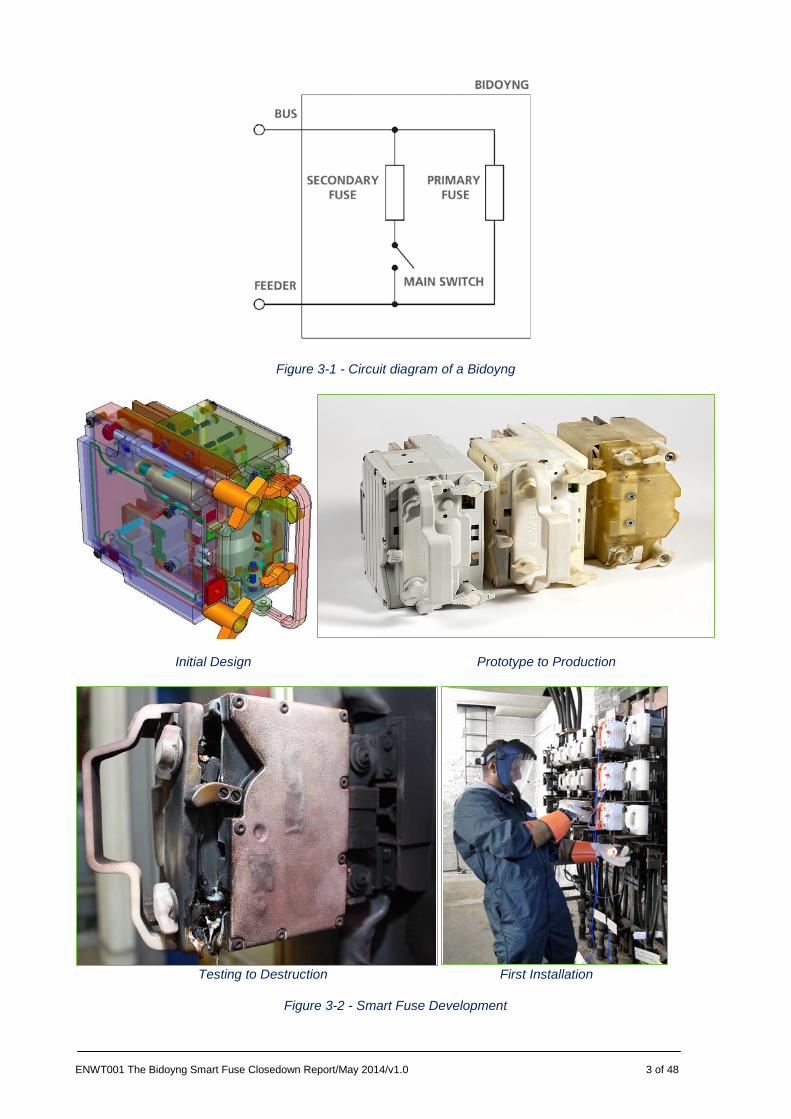
ENWT001 The Bidoyng Smart Fuse Closedown Report/May 2014/v1.0 3 of 48
Figure 3-1 - Circuit diagram of a Bidoyng
Initial Design Prototype to Production
Testing to Destruction First Installation
Figure 3-2 - Smart Fuse Development
ENWT001 The Bidoyng Smart Fuse Closedown Report/May 2014/v1.0 4 of 48
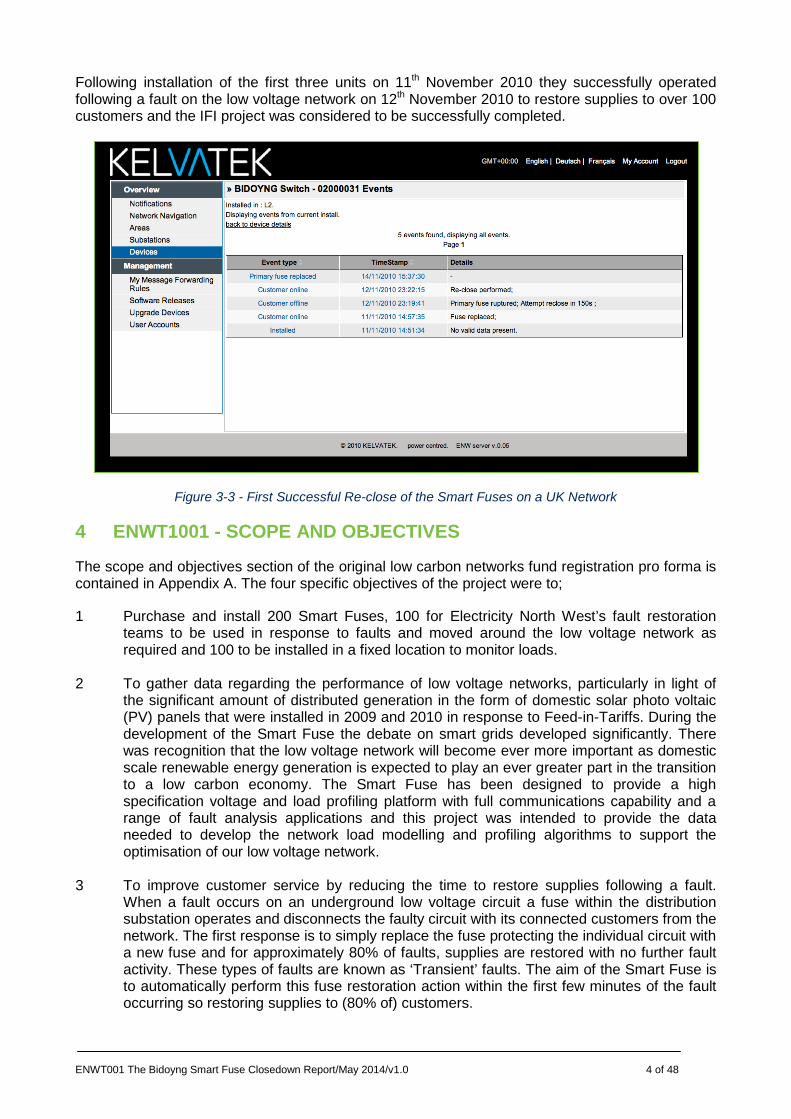
Following installation of the first three units on 11th November 2010 they successfully operated following a fault on the low voltage network on 12th November 2010 to restore supplies to over 100 customers and the IFI project was considered to be successfully completed.
Figure 3-3 - First Successful Re-close of the Smart Fuses on a UK Network
4 ENWT1001 - SCOPE AND OBJECTIVES
The scope and objectives section of the original low carbon networks fund registration pro forma is contained in Appendix A. The four specific objectives of the project were to;
1 Purchase and install 200 Smart Fuses, 100 for Electricity North West’s fault restoration teams to be used in response to faults and moved around the low voltage network as required and 100 to be installed in a fixed location to monitor loads.
2 To gather data regarding the performance of low voltage networks, particularly in light of the significant amount of distributed generation in the form of domestic solar photo voltaic (PV) panels that were installed in 2009 and 2010 in response to Feed-in-Tariffs. During the development of the Smart Fuse the debate on smart grids developed significantly. There was recognition that the low voltage network will become ever more important as domestic scale renewable energy generation is expected to play an ever greater part in the transition to a low carbon economy. The Smart Fuse has been designed to provide a high specification voltage and load profiling platform with full communications capability and a range of fault analysis applications and this project was intended to provide the data needed to develop the network load modelling and profiling algorithms to support the optimisation of our low voltage network.
3 To improve customer service by reducing the time to restore supplies following a fault. When a fault occurs on an underground low voltage circuit a fuse within the distribution substation operates and disconnects the faulty circuit with its connected customers from the network. The first response is to simply replace the fuse protecting the individual circuit with a new fuse and for approximately 80% of faults, supplies are restored with no further fault activity. These types of faults are known as ‘Transient’ faults. The aim of the Smart Fuse is to automatically perform this fuse restoration action within the first few minutes of the fault occurring so restoring supplies to (80% of) customers.

ENWT001 The Bidoyng Smart Fuse Closedown Report/May 2014/v1.0 5 of 48
4 To provide enough data to develop policies and procedures regarding the use of the Smart
Fuse on low voltage networks. The management of faults on electricity networks or indeed any contact with energised conductors presents a number of significant risks to operators. The project provided the opportunity to develop a set of procedures to describe the correct use of the Smart Fuse.
5 ENWT1001 - SCALE OF PROJECT
The Smart Fuse design was rigorously tested in laboratories and on live test networks during the IFI funded project1 and was shown to operate as designed. The rationale for this project was to scale up the deployment of Smart Fuses to gather data that could be used for a meaningful statistical analysis to assess the performance of the device and the potential for deployment across Electricity North West. The rationale for the size of the trial was to ensure a significant number of locations could be covered to guarantee enough faults could be recorded to prove the reliability and robustness of the Smart Fuse.
6 ENWT1001 - SUCCESS CRITERIA
Following procurement and installation of the Smart Fuses, the project was to be considered a success by achieving four milestones: installation of the devices, recording and analysis of low voltage network performance metrics, demonstration of the advantages of the technology (auto-reclosing, load profiling) in restoring customers supplies following a fault and internal policy and installation procedure development.
7 ENWT1001 - DETAILS OF THE WORK CARRIED OUT
7.1 Installation of the Smart Fuses
7.1.1 Load Monitoring
The first units were installed in collaboration with Stockport Homes in Stockport, Cheshire in an area identified for a significant installation of solar PV on domestic properties. A great deal has been learnt about the effects of wide scale PV adoption on urban underground networks through a range of other low carbon network fund sponsored projects since 2010 but at the time the project was initiated there was a lack of monitored data to complement the various models that had been developed. In total 94 units were installed across 6 distribution substations in Stockport described in Table 7-1.
1 Type testing carried out at IPH in Berlin during Nov 2009, Test Report No 3147.2091118.0847 available on request

ENWT001 The Bidoyng Smart Fuse Closedown Report/May 2014/v1.0 6 of 48
Substation Name Number of Installed Smart Fuses
Brinnington Mount 6
Cornwall Crescent 23
Dunton Green 13
Keston Crescent 20
Lapwing Lane 16
Middlesex Rd 16
Total 94
Table 7-1 - Details of Substations where the Smart Fuses were installed
Figure 7-1 - Single Line Diagram of the LV Network where the Smart Fuses were installed
The Smart Fuse is installed with a ‘Gateway’ which can communicate via low power radio with up to 15 individual units; the Gateway communicates with a central server via the GSM Network.
Figure 7-2 - Smart Fuse Gateway
ENWT001 The Bidoyng Smart Fuse Closedown Report/May 2014/v1.0 7 of 48
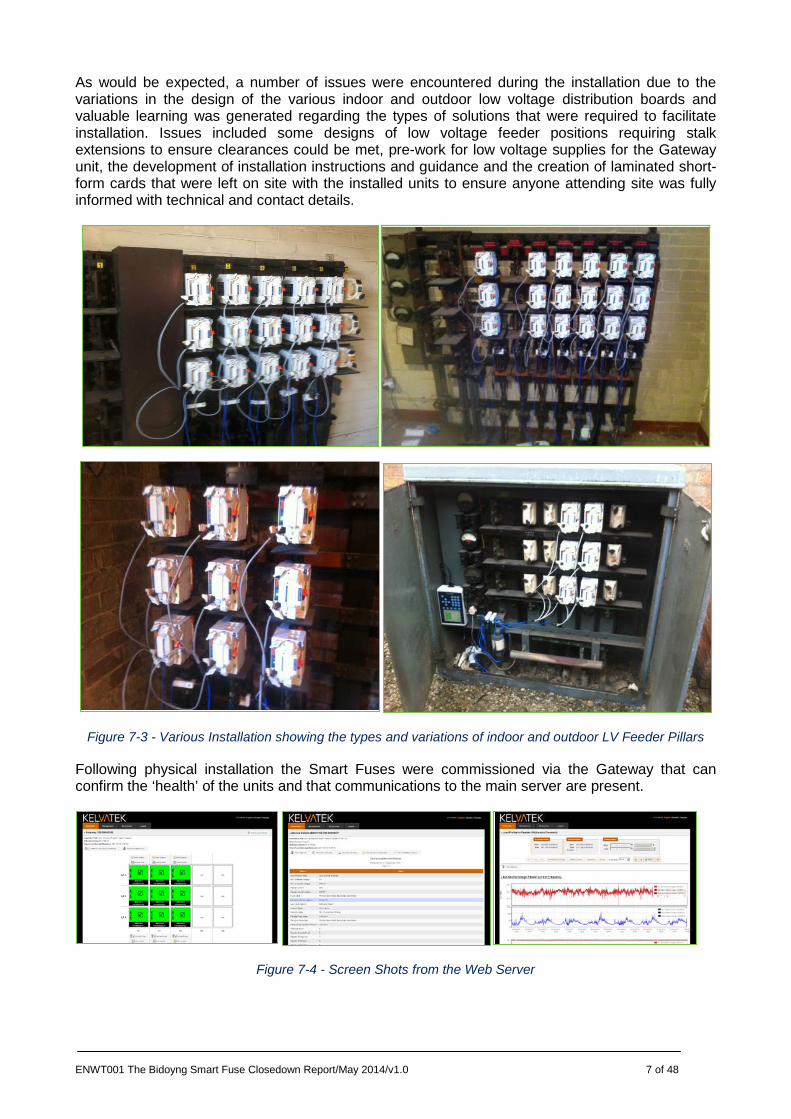
As would be expected, a number of issues were encountered during the installation due to the variations in the design of the various indoor and outdoor low voltage distribution boards and valuable learning was generated regarding the types of solutions that were required to facilitate installation. Issues included some designs of low voltage feeder positions requiring stalk extensions to ensure clearances could be met, pre-work for low voltage supplies for the Gateway unit, the development of installation instructions and guidance and the creation of laminated short-form cards that were left on site with the installed units to ensure anyone attending site was fully informed with technical and contact details.
Figure 7-3 - Various Installation showing the types and variations of indoor and outdoor LV Feeder Pillars
Following physical installation the Smart Fuses were commissioned via the Gateway that can confirm the ‘health’ of the units and that communications to the main server are present.
Figure 7-4 - Screen Shots from the Web Server

ENWT001 The Bidoyng Smart Fuse Closedown Report/May 2014/v1.0 8 of 48
Load data from the units is remotely retrieved through the Kelvatek Web Server (Figure 7-4 - Screen Shots from the Web Server) and a range of analysis algorithms are available to display all parameters relating to singe phase power flow on low voltage feeders. Load readings are taken on each phase on a 1 minute interval providing a significant amount of data for analysis.
7.1.2 Fault Management
The remaining 106 Smart Fuse Units were issued across Electricity North West’s fault restoration teams for trailing in response to transient fault management. The Smart Fuses were issued to a number of fault teams across Electricity North West’s region and training was provided by Kelvatek.
7.1.3 Defects
Of the 200 units purchased three were found to be defective during the installation period. The defects were only apparent when the units were ‘shaken’ and a loose part could be heard inside the case, these units were returned to Kelvatek and replaced under the terms of the commercial agreement. No ‘operational’ defects were found with any of the units.
7.2 Data Gathering to Support Analysis of Low Voltage Networks Performance
The second project objective, analysis of load data, was performed by the Durham Energy Institute at Durham University by PhD students under the guidance of Dr Neal Wade and Professor Phil Taylor. The results and analysis in the following section is illustrated with examples from a very large data set gathered during the project, the full data is available on request from Electricity North West.
7.2.1 Network Data
The data analysed in the following sections was sourced from a number of locations including GIS drawings of the low voltage network, known locations of PV systems and monitoring data downloaded from the Smart Fuse. It was not possible to monitor loads on every low voltage feeder (due to a limited number of Smart Fuses) so a criteria was developed to monitor those feeders with the greatest number of PV installations and a sample of feeders with no PV. The aim was to highlight the differences between ‘normal’ feeders (no PV) and those with a high penetration of installed PV. Table 7-2 shows a summary of the monitored feeders.
Substation Name No. Of Outgoing
Circuit (usually 1 to 5)
Loads PV
systems installed
Ratio of PV to loads
Brinnington Mount 4 44 6 14%
5 54 4 7%
Cornwall Crescent
1 41 9 22%
2 56 14 25%
3 20 8 40%
4 45 6 13%
Dunton Green
2 73 40 55%
3 29 8 28%
4 32 6 19%

ENWT001 The Bidoyng Smart Fuse Closedown Report/May 2014/v1.0 9 of 48
5 67 45 67%
Keston Crescent
2 61 8 13%
4 42 5 12%
5 53 24 45%
Lapwing Lane
1 16 0 0%
2 31 0 0%
3 55 2 4%
4 58 4 7%
5 48 0 0%
Middlesex Road
1 50 5 10%
2 60 9 15%
3 55 9 16%
4 83 31 37%
5 77 11 19%
Table 7-2 - Monitored Feeders
7.2.2 Measured Parameters
The measured data included the following parameters on each phase:
• Mean, minimum and maximum bus-neutral voltage [V] • Mean, minimum and maximum feeder current [A] • Mean apparent power [VA] • Mean power factor • Mean reactive power [VAr] • Mean real power [W] • THD [%] • Frequency [Hz]
7.2.3 Baseline Results (No PV)
7.2.3.1 Real Power
All of the monitored feeders exhibited a typical daily load cycle and annual overall trend of higher winter than summer demand as would be expected from a densely populated suburban location. As an example, the energy delivered through each of the Keston Crescent feeders is given in Figure 7-5.

ENWT001 The Bidoyng Smart Fuse Closedown Report/May 2014/v1.0 10 of 48
Figure 7-5 - Energy delivered through Keston Crescent transformer in 2012
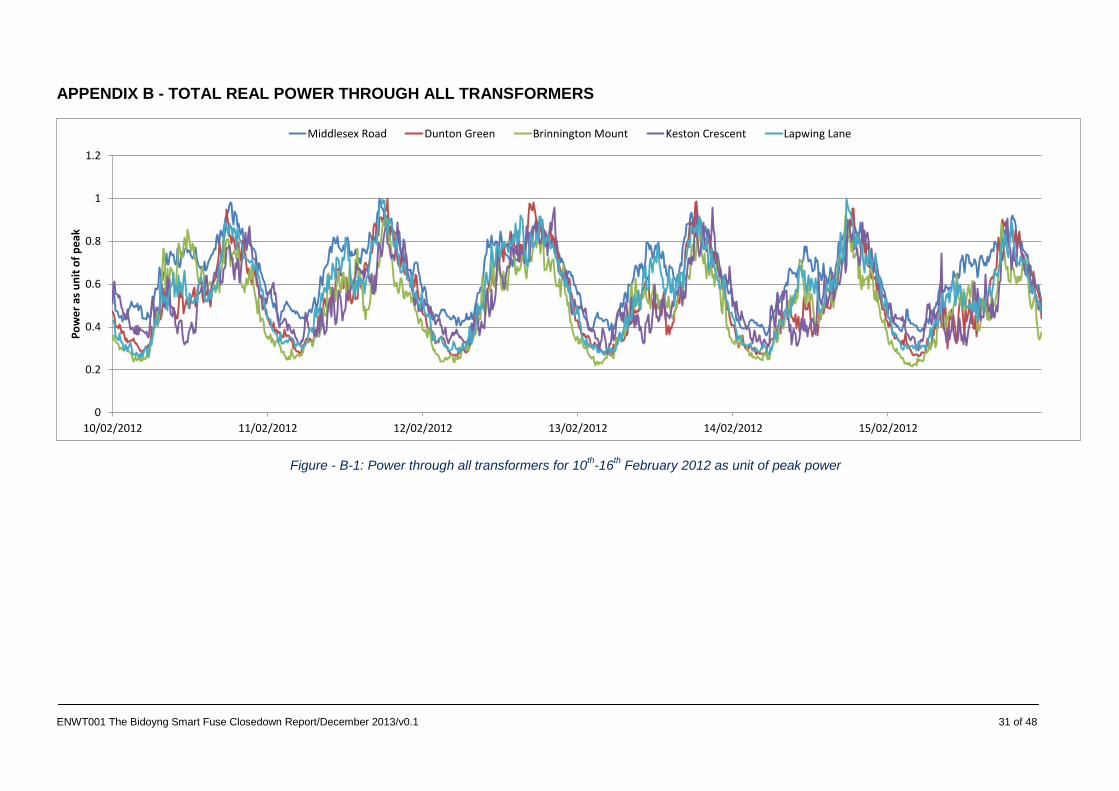
As shown in Figure - B-1 (in appendix), all feeders exhibited a typical daily load cycle with morning and evening peaks with some variability between maximum loading. This is almost certainly related to the types of demand or number of occupants on each feeder and is further illustrated by the peak power seen in the week 10th-16th February 2012 (Table 7-3).
Substation Name Transformer Size (kVA) Peak Power [kW]
Lapwing Lane 315 39.9
Keston Crescent 500 43.4
Brinnington Mount 500 51.9
Dunton Green 750 54.9
Middlesex Road 1000 83.8
Table 7-3 - Peak power through transformers in study for week 10th-16th February 2012
7.2.3.2 After Diversity Maximum Demand (ADMD)
By comparing the number of customers connected to each way and the maximum power flows seen in the data, the ADMD has been calculated as shown in Table 7-4. The ADMD is varied across the feeders which has important planning considerations.
0
5000
10000
15000
20000
25000
30000
35000
40000
Jan Feb Mar Apr May Jun Jul Aug Sep Oct Nov Dec
Ener
gy D
eliv
ered
[kW
h]

ENWT001 The Bidoyng Smart Fuse Closedown Report/May 2014/v1.0 11 of 48
Substation Name Way Number of loads After diversity
maximum demand per customer [kW]
Brinnington Mount 4 44 1.53
5 54 1.83
Cornwall Crescent
1 41 1.65
2 56 1.38
3 20 3
4 45 1.55
Dunton Green
2 73 1.53
3 29 2.11
4 32 1.73
5 67 1.17
Keston Crescent
2 61 1.28
4 42 1.37
5 53 1.29
Middlesex Road
1 50 1.66
2 60 1.89
3 55 2
4 83 1.96
5 77 1.6
Table 7-4 - ADMD Figures
7.2.3.3 Reactive Power
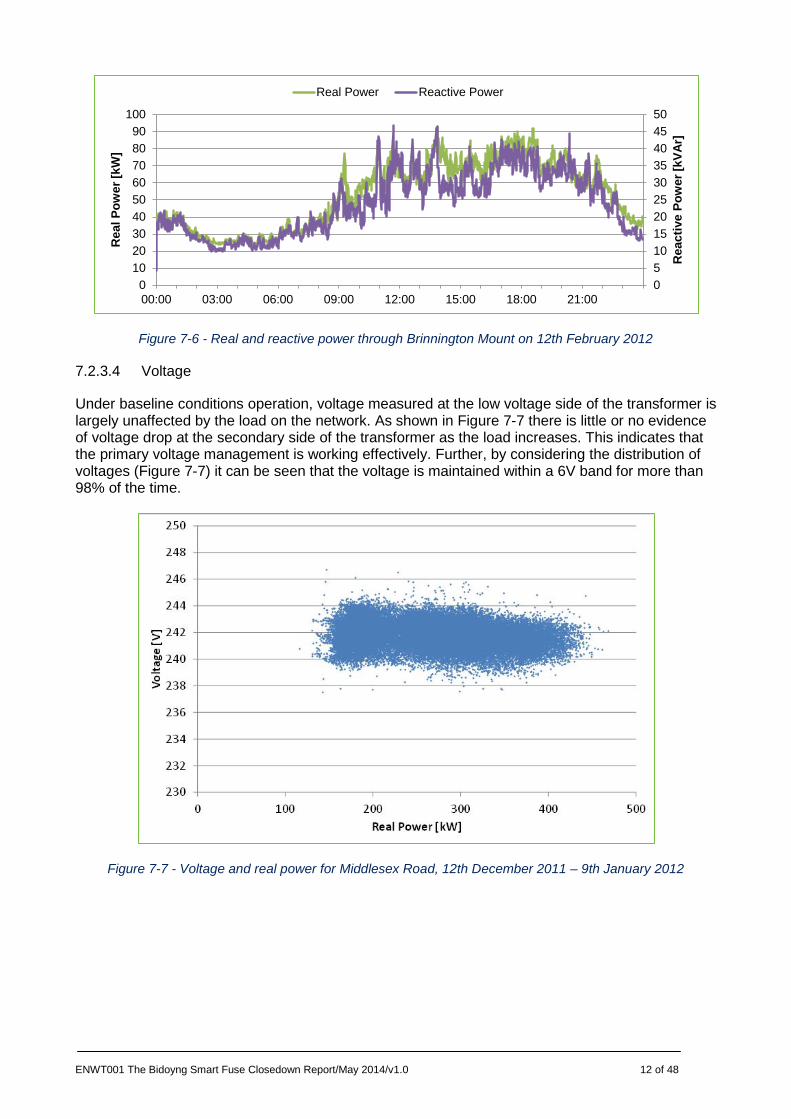
For feeders with no installed PV, the reactive power generally follows the real power (Figure 7-6) and reactive power demand is generally very low, leading to a high power factor. Statistical analysis shows the reactive power demand, although low, is more dynamic than real power demand.
ENWT001 The Bidoyng Smart Fuse Closedown Report/May 2014/v1.0 12 of 48
Figure 7-6 - Real and reactive power through Brinnington Mount on 12th February 2012
7.2.3.4 Voltage
Under baseline conditions operation, voltage measured at the low voltage side of the transformer is largely unaffected by the load on the network. As shown in Figure 7-7 there is little or no evidence of voltage drop at the secondary side of the transformer as the load increases. This indicates that the primary voltage management is working effectively. Further, by considering the distribution of voltages (Figure 7-7) it can be seen that the voltage is maintained within a 6V band for more than 98% of the time.
Figure 7-7 - Voltage and real power for Middlesex Road, 12th December 2011 – 9th January 2012
05101520253035404550
0102030405060708090
100
00:00 03:00 06:00 09:00 12:00 15:00 18:00 21:00
Rea
ctiv
e Po
wer
[kVA
r]
Rea
l Pow
er [k
W]
Real Power Reactive Power
ENWT001 The Bidoyng Smart Fuse Closedown Report/May 2014/v1.0 13 of 48
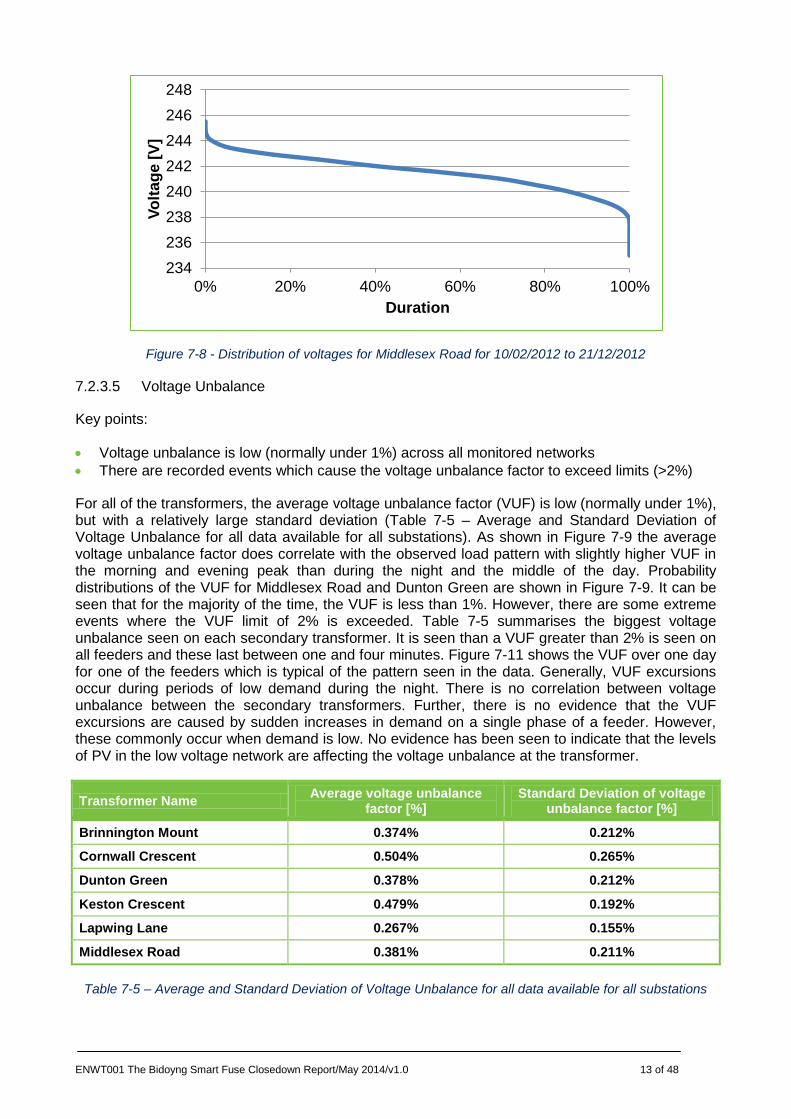
Figure 7-8 - Distribution of voltages for Middlesex Road for 10/02/2012 to 21/12/2012
7.2.3.5 Voltage Unbalance
Key points:
• Voltage unbalance is low (normally under 1%) across all monitored networks • There are recorded events which cause the voltage unbalance factor to exceed limits (>2%)
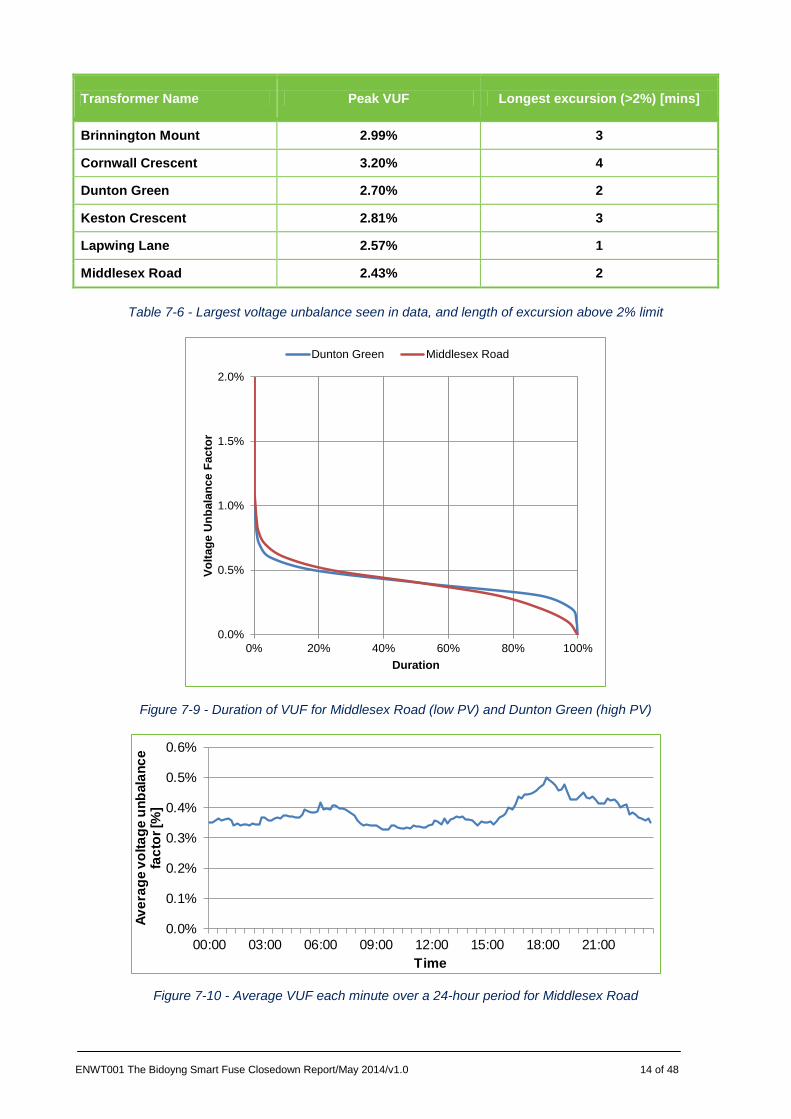
For all of the transformers, the average voltage unbalance factor (VUF) is low (normally under 1%), but with a relatively large standard deviation (Table 7-5 – Average and Standard Deviation of Voltage Unbalance for all data available for all substations). As shown in Figure 7-9 the average voltage unbalance factor does correlate with the observed load pattern with slightly higher VUF in the morning and evening peak than during the night and the middle of the day. Probability distributions of the VUF for Middlesex Road and Dunton Green are shown in Figure 7-9. It can be seen that for the majority of the time, the VUF is less than 1%. However, there are some extreme events where the VUF limit of 2% is exceeded. Table 7-5 summarises the biggest voltage unbalance seen on each secondary transformer. It is seen than a VUF greater than 2% is seen on all feeders and these last between one and four minutes. Figure 7-11 shows the VUF over one day for one of the feeders which is typical of the pattern seen in the data. Generally, VUF excursions occur during periods of low demand during the night. There is no correlation between voltage unbalance between the secondary transformers. Further, there is no evidence that the VUF excursions are caused by sudden increases in demand on a single phase of a feeder. However, these commonly occur when demand is low. No evidence has been seen to indicate that the levels of PV in the low voltage network are affecting the voltage unbalance at the transformer.
Transformer Name Average voltage unbalance factor [%]
Standard Deviation of voltage unbalance factor [%]
Brinnington Mount 0.374% 0.212%
Cornwall Crescent 0.504% 0.265%
Dunton Green 0.378% 0.212%
Keston Crescent 0.479% 0.192%
Lapwing Lane 0.267% 0.155%
Middlesex Road 0.381% 0.211%
Table 7-5 – Average and Standard Deviation of Voltage Unbalance for all data available for all substations
234236238240242244246248
0% 20% 40% 60% 80% 100%
Volta
ge [V
]
Duration
ENWT001 The Bidoyng Smart Fuse Closedown Report/May 2014/v1.0 14 of 48
Transformer Name Peak VUF Longest excursion (>2%) [mins]
Brinnington Mount 2.99% 3
Cornwall Crescent 3.20% 4
Dunton Green 2.70% 2
Keston Crescent 2.81% 3
Lapwing Lane 2.57% 1
Middlesex Road 2.43% 2
Table 7-6 - Largest voltage unbalance seen in data, and length of excursion above 2% limit
Figure 7-9 - Duration of VUF for Middlesex Road (low PV) and Dunton Green (high PV)
Figure 7-10 - Average VUF each minute over a 24-hour period for Middlesex Road
0.0%
0.5%
1.0%
1.5%
2.0%
0% 20% 40% 60% 80% 100%
Volta
ge U
nbal
ance
Fac
tor
Duration
Dunton Green Middlesex Road
0.0%
0.1%
0.2%
0.3%
0.4%
0.5%
0.6%
00:00 03:00 06:00 09:00 12:00 15:00 18:00 21:00
Aver
age
volta
ge u
nbal
ance
fa
ctor
[%]
Time
ENWT001 The Bidoyng Smart Fuse Closedown Report/May 2014/v1.0 15 of 48
Figure 7-11 - Voltage unbalance factor for single way of Cornwall Crescent, 17th January 2012
7.2.4 Effects of PV on the Transformer
7.2.4.1 Measured Effects of PV on Power Flow
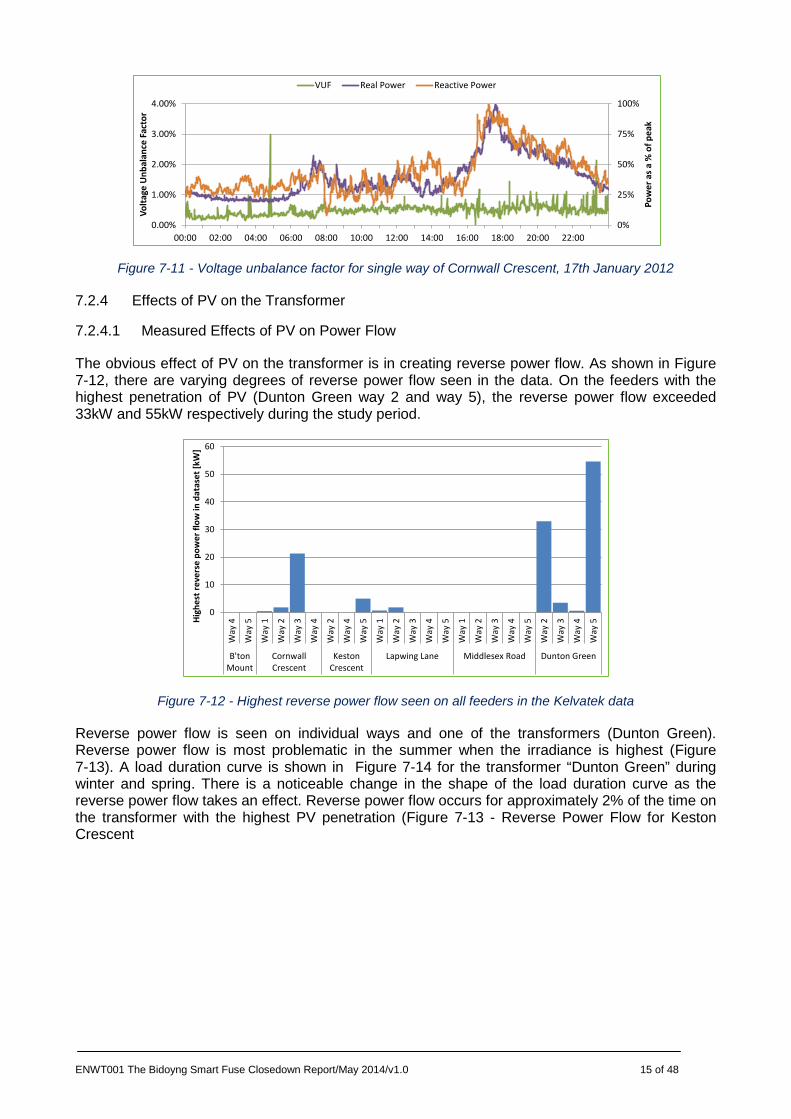
The obvious effect of PV on the transformer is in creating reverse power flow. As shown in Figure 7-12, there are varying degrees of reverse power flow seen in the data. On the feeders with the highest penetration of PV (Dunton Green way 2 and way 5), the reverse power flow exceeded 33kW and 55kW respectively during the study period.
Figure 7-12 - Highest reverse power flow seen on all feeders in the Kelvatek data
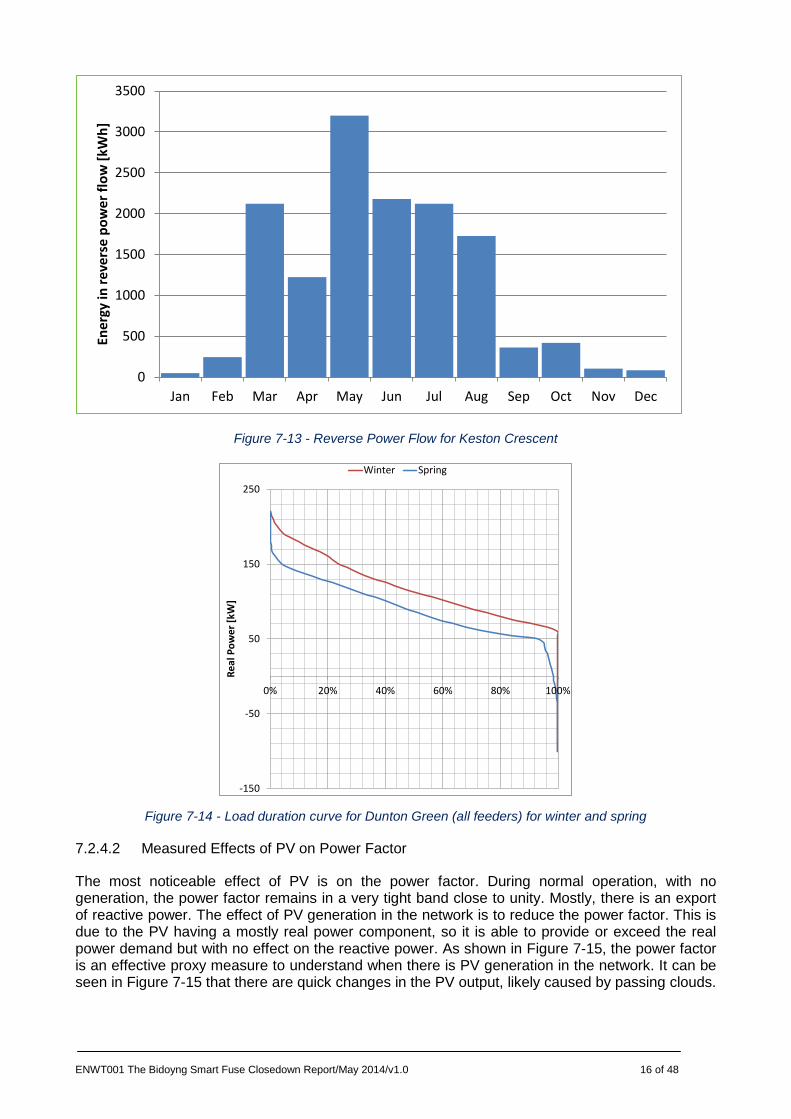
Reverse power flow is seen on individual ways and one of the transformers (Dunton Green). Reverse power flow is most problematic in the summer when the irradiance is highest (Figure 7-13). A load duration curve is shown in Figure 7-14 for the transformer “Dunton Green” during winter and spring. There is a noticeable change in the shape of the load duration curve as the reverse power flow takes an effect. Reverse power flow occurs for approximately 2% of the time on the transformer with the highest PV penetration (Figure 7-13 - Reverse Power Flow for Keston Crescent
0%
25%
50%
75%
100%
0.00%
1.00%
2.00%
3.00%
4.00%
00:00 02:00 04:00 06:00 08:00 10:00 12:00 14:00 16:00 18:00 20:00 22:00
Pow
er a
s a %
of p
eak
Volta
ge U
nbal
ance
Fac
tor
VUF Real Power Reactive Power
0
10
20
30
40
50
60
Way
4
Way
5
Way
1
Way
2
Way
3
Way
4
Way
2
Way
4
Way
5
Way
1
Way
2
Way
3
Way
4
Way
5
Way
1
Way
2
Way
3
Way
4
Way
5
Way
2
Way
3
Way
4
Way
5
B'tonMount
CornwallCrescent
KestonCrescent
Lapwing Lane Middlesex Road Dunton Green
High
est r
ever
se p
ower
flow
in d
atas
et [k
W]
ENWT001 The Bidoyng Smart Fuse Closedown Report/May 2014/v1.0 16 of 48
Figure 7-13 - Reverse Power Flow for Keston Crescent
Figure 7-14 - Load duration curve for Dunton Green (all feeders) for winter and spring
7.2.4.2 Measured Effects of PV on Power Factor
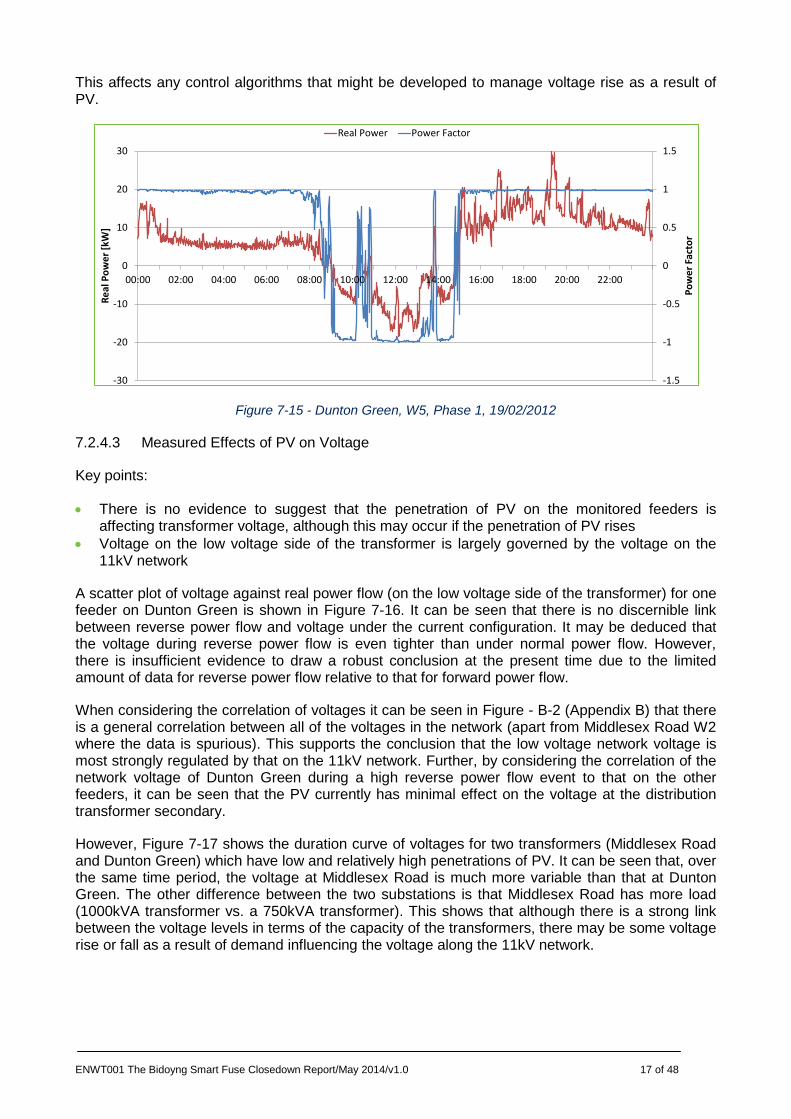
The most noticeable effect of PV is on the power factor. During normal operation, with no generation, the power factor remains in a very tight band close to unity. Mostly, there is an export of reactive power. The effect of PV generation in the network is to reduce the power factor. This is due to the PV having a mostly real power component, so it is able to provide or exceed the real power demand but with no effect on the reactive power. As shown in Figure 7-15, the power factor is an effective proxy measure to understand when there is PV generation in the network. It can be seen in Figure 7-15 that there are quick changes in the PV output, likely caused by passing clouds.
0
500
1000
1500
2000
2500
3000
3500
Jan Feb Mar Apr May Jun Jul Aug Sep Oct Nov Dec
Ener
gy in
reve
rse
pow
er fl
ow [k
Wh]
-150
-50
50
150
250
0% 20% 40% 60% 80% 100%
Real
Pow
er [k
W]
Winter Spring
ENWT001 The Bidoyng Smart Fuse Closedown Report/May 2014/v1.0 17 of 48
This affects any control algorithms that might be developed to manage voltage rise as a result of PV.
Figure 7-15 - Dunton Green, W5, Phase 1, 19/02/2012
7.2.4.3 Measured Effects of PV on Voltage
Key points:
• There is no evidence to suggest that the penetration of PV on the monitored feeders is affecting transformer voltage, although this may occur if the penetration of PV rises
• Voltage on the low voltage side of the transformer is largely governed by the voltage on the 11kV network
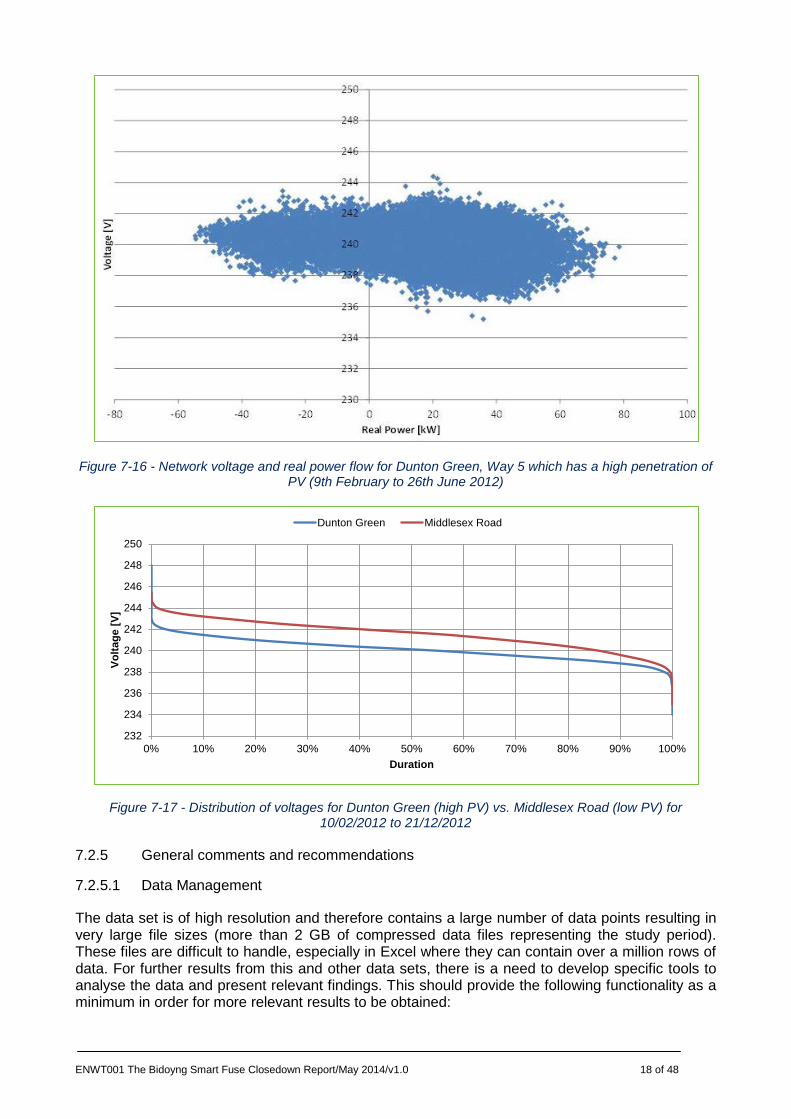
A scatter plot of voltage against real power flow (on the low voltage side of the transformer) for one feeder on Dunton Green is shown in Figure 7-16. It can be seen that there is no discernible link between reverse power flow and voltage under the current configuration. It may be deduced that the voltage during reverse power flow is even tighter than under normal power flow. However, there is insufficient evidence to draw a robust conclusion at the present time due to the limited amount of data for reverse power flow relative to that for forward power flow.
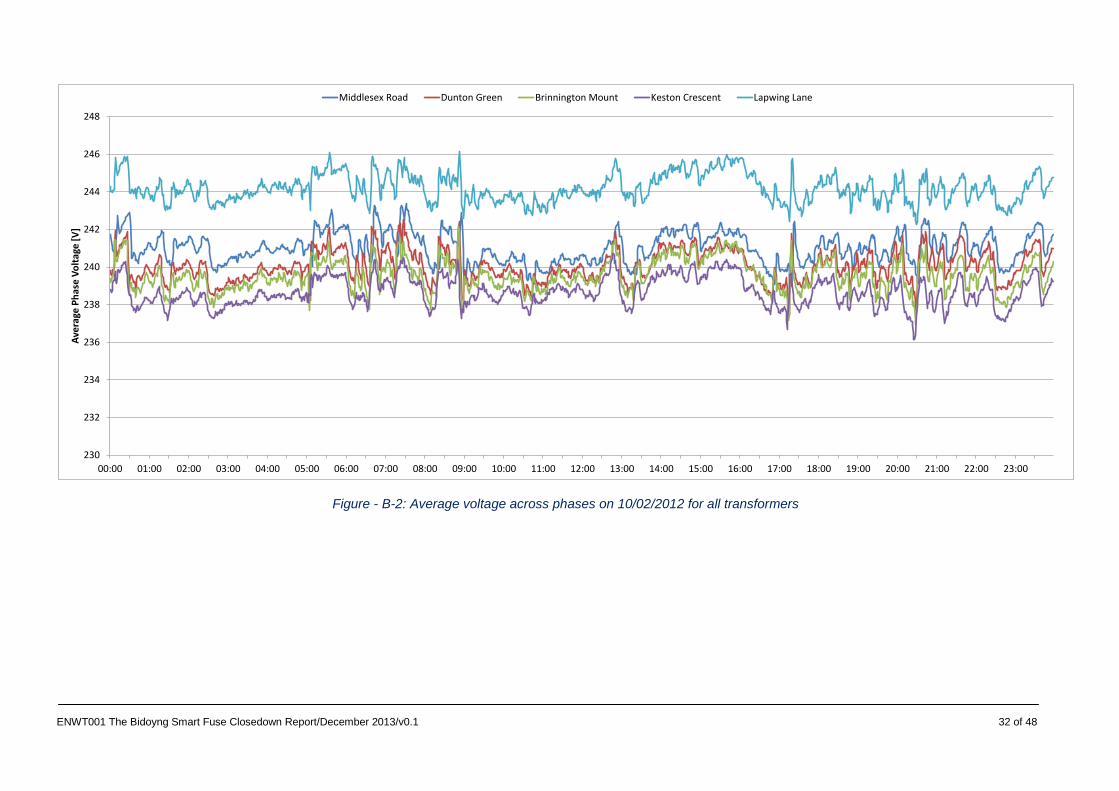
When considering the correlation of voltages it can be seen in Figure - B-2 (Appendix B) that there is a general correlation between all of the voltages in the network (apart from Middlesex Road W2 where the data is spurious). This supports the conclusion that the low voltage network voltage is most strongly regulated by that on the 11kV network. Further, by considering the correlation of the network voltage of Dunton Green during a high reverse power flow event to that on the other feeders, it can be seen that the PV currently has minimal effect on the voltage at the distribution transformer secondary.
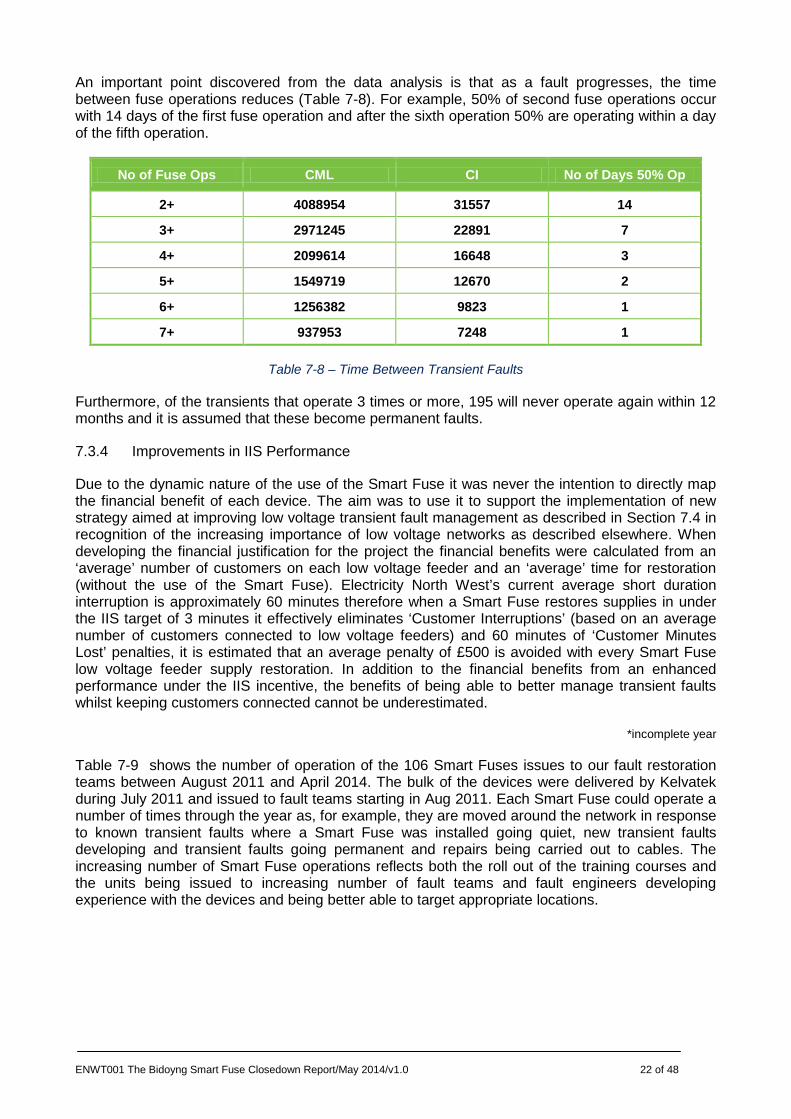
However, Figure 7-17 shows the duration curve of voltages for two transformers (Middlesex Road and Dunton Green) which have low and relatively high penetrations of PV. It can be seen that, over the same time period, the voltage at Middlesex Road is much more variable than that at Dunton Green. The other difference between the two substations is that Middlesex Road has more load (1000kVA transformer vs. a 750kVA transformer). This shows that although there is a strong link between the voltage levels in terms of the capacity of the transformers, there may be some voltage rise or fall as a result of demand influencing the voltage along the 11kV network.
-1.5
-1
-0.5
0
0.5
1
1.5
-30
-20
-10
0
10
20
30
00:00 02:00 04:00 06:00 08:00 10:00 12:00 14:00 16:00 18:00 20:00 22:00
Pow
er F
acto
r
Real
Pow
er [k
W]
Real Power Power Factor
ENWT001 The Bidoyng Smart Fuse Closedown Report/May 2014/v1.0 18 of 48
Figure 7-16 - Network voltage and real power flow for Dunton Green, Way 5 which has a high penetration of PV (9th February to 26th June 2012)
Figure 7-17 - Distribution of voltages for Dunton Green (high PV) vs. Middlesex Road (low PV) for 10/02/2012 to 21/12/2012
7.2.5 General comments and recommendations
7.2.5.1 Data Management
The data set is of high resolution and therefore contains a large number of data points resulting in very large file sizes (more than 2 GB of compressed data files representing the study period). These files are difficult to handle, especially in Excel where they can contain over a million rows of data. For further results from this and other data sets, there is a need to develop specific tools to analyse the data and present relevant findings. This should provide the following functionality as a minimum in order for more relevant results to be obtained:
232
234
236
238
240
242
244
246
248
250
0% 10% 20% 30% 40% 50% 60% 70% 80% 90% 100%
Volta
ge [V
]
Duration
Dunton Green Middlesex Road

ENWT001 The Bidoyng Smart Fuse Closedown Report/May 2014/v1.0 19 of 48
• The ability to sort data into a number of time horizons to include:
• Data over a given day • Data for a selected time period • Monthly data
• The ability to plot any of the measured variables against each other on an xy scatter plot over any of the time horizons specified above
• The ability to plot duration (cumulative probability curves) for any of the variables over the specified time horizons
• The ability to cross-correlate data between individual ways • The ability to download any of the above data sets as csv files for import into Excel or similar
7.2.5.2 Planning tools
During analysis of the full data set models were developed that supported the creation of a new tool to assess the highest amount of PV that can be accepted into any given low voltage network. As shown in Figure 7-18, the exact number of PV systems that can be permitted depends on the rating of each installed PV system resulting in a region where PV is acceptable, a region where PV might be acceptable and a region where PV is definitely not acceptable.
Figure 7-18 - Permissible penetration of PV in an LV network (for illustrative purposes). Here 50,000 load flows are performed with PV at random and feasible locations within the network
7.2.6 Results Summary
• Under normal operating conditions without the effects of PV:
• Seasonal trends in energy are visible between summer and winter months • There is a daily cycling of energy, but there are noticeable differences in power flows
between individual transformers • The reactive power closely follows the real power, but is much more variable and in
smaller quantities • The voltage remains within a tight band on the low voltage side of the transformer and
appears to be regulated by the voltage on the 11kV network • The voltage unbalance factor is generally low (less than 0.7%) but there are excursions
in the data of more two minutes where it is greater than 2%
1.00
1.05
1.10
1.15
1.20
1.25
50 75 100 125 150 175 200 225 250
Max
imum
Vol
tage
in N
etw
ork
(p.u
.)
Number of PV Systems in Network
Voltage Limit
No voltage rise Voltage rise possible Voltage rise

ENWT001 The Bidoyng Smart Fuse Closedown Report/May 2014/v1.0 20 of 48
• Under operating conditions with PV within the low voltage network
• There is reverse power flow over feeders and over one transformer in the study • The amount of reverse power flow follows a seasonal pattern with more seen in the
summer when there is more irradiance and lower demand • The PV also influences the power factor, causing it to reduce due to the real power
component of the PV output • There is no noticeable effect of PV on the low voltage side of the transformer further
supporting the finding that low voltage is governed by the 11kV voltage. However, further analysis is needed on networks with higher PV penetrations to show this
7.3 Improving Customer Service by Reducing the Impact of Transient Faults
7.3.1 Background
The third project objective was to improve Electricity North West’s Quality of Supply performance. The original IFI project was driven by an analysis of performance during 2006 which highlighted the need to address the number of transient faults that were affecting low voltage networks. As automation is rolled out across higher voltage levels the impact of faults (particularly transient faults) on low voltage networks becomes more apparent and in 2006 it was understood that eventually new technology would be needed to complement better organised workforces.
7.3.2 Analysis of Faults Types
Low voltage transient faults are characterised as faults that may occur causing the substation fuse protecting the feeder to operate and so disconnecting customers but when replaced, the new ‘healthy’ fuse does not operate and supplies are restored to customers. Transient faults can occur for a number of reasons, for example after periods of heavy rain moisture can ingress into directly buried cable joints to cause a short circuit leading to fault currents that will operate the substation fuse. However the resulting arc from the release of fault energy at the short circuit location can dry the cable joint removing the moisture that caused the short circuit.
Transient faults have four stages of development;
• Transitory (irregular voltage dips which don’t cause fuse operation) • Intermittent (irregular fuse operations) • Persistent (repetitive fuse operations) • Permanent (open circuit or short circuit weld)
A fault could potentially develop on any part of the underground low voltage network and the fault may miss stages of development. For example, a fault towards the end of a low voltage feeder with a small cross-sectional cable would have the transitory phase but jump to the permanent stage. Whereas, if the fault is closer to the substation on a larger cross-section cable then it could have all four stages. Networks with bottle ends and larger cross-section cables further away from the substation would have different phases of development. Furthermore faults very rarely ‘regress’ i.e. they do not move from ‘Persistent’ to ‘Transitory’, once a cable has experienced some fault activity it is only a matter of time before the fault becomes ‘Permanent’.
7.3.3 LV Fault Performance Prior to the Introduction of the Smart Fuse
In developing the justification for the project, low voltage transient fault data was analysed from 2006-07, this data only includes transient faults and not those when a fuse operates and a fault is identified and repaired. Table 7-7 shows the number of repeated fuse operations and the impact on customer minutes lost and customer interruptions. Intermittent faults (irregular fuse operations) are shown in the table as a single fuse operation in 12 months. Persistent faults are 2 or more fuse operations within a 12 month period. Persistent faults will, after an indeterminate number of fuse

ENWT001 The Bidoyng Smart Fuse Closedown Report/May 2014/v1.0 21 of 48
operations, move to the permanent stage and hence the reason why the numbers of transients reduces as the number of operations increase.
No Fuse Operations No. of Transient Faults CML CI
1 1665 6,196,584 40,574
2 635 2,553,842 17,400
3 329 1,117,709 8,666
4 204 871,631 6,243
5 131 549,895 3,978
6 96 293,337 2,847
7 67 318,429 2,575
8 53 175,713 1,754
9 43 181,939 1,512
10 33 155,451 1,100
11 22 109,074 690
12 15 55,997 575
13 13 89,151 694
14 9 20,409 288
15 8 74,456 333
16 5 66,056 228
17 1 6,875 50
18 1 2,832 24
Table 7-7 – Impact of Transient Faults 2006/7
Figure 7-19 shows the results of subdividing these faults into locations.
Figure 7-19 – Locations of Transient Faults
ENWT001 The Bidoyng Smart Fuse Closedown Report/May 2014/v1.0 22 of 48
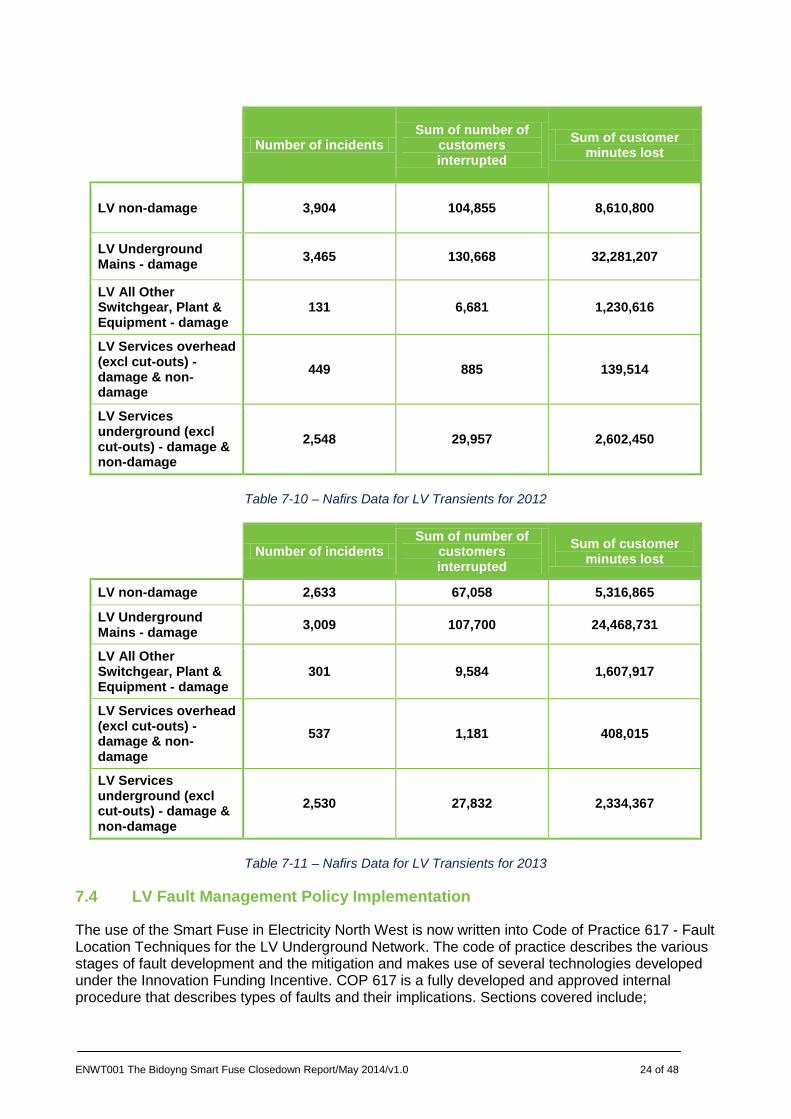
An important point discovered from the data analysis is that as a fault progresses, the time between fuse operations reduces (Table 7-8). For example, 50% of second fuse operations occur with 14 days of the first fuse operation and after the sixth operation 50% are operating within a day of the fifth operation.
No of Fuse Ops CML CI No of Days 50% Op
2+ 4088954 31557 14
3+ 2971245 22891 7
4+ 2099614 16648 3
5+ 1549719 12670 2
6+ 1256382 9823 1
7+ 937953 7248 1
Table 7-8 – Time Between Transient Faults
Furthermore, of the transients that operate 3 times or more, 195 will never operate again within 12 months and it is assumed that these become permanent faults.
7.3.4 Improvements in IIS Performance
Due to the dynamic nature of the use of the Smart Fuse it was never the intention to directly map the financial benefit of each device. The aim was to use it to support the implementation of new strategy aimed at improving low voltage transient fault management as described in Section 7.4 in recognition of the increasing importance of low voltage networks as described elsewhere. When developing the financial justification for the project the financial benefits were calculated from an ‘average’ number of customers on each low voltage feeder and an ‘average’ time for restoration (without the use of the Smart Fuse). Electricity North West’s current average short duration interruption is approximately 60 minutes therefore when a Smart Fuse restores supplies in under the IIS target of 3 minutes it effectively eliminates ‘Customer Interruptions’ (based on an average number of customers connected to low voltage feeders) and 60 minutes of ‘Customer Minutes Lost’ penalties, it is estimated that an average penalty of £500 is avoided with every Smart Fuse low voltage feeder supply restoration. In addition to the financial benefits from an enhanced performance under the IIS incentive, the benefits of being able to better manage transient faults whilst keeping customers connected cannot be underestimated.
*incomplete year
Table 7-9 shows the number of operation of the 106 Smart Fuses issues to our fault restoration teams between August 2011 and April 2014. The bulk of the devices were delivered by Kelvatek during July 2011 and issued to fault teams starting in Aug 2011. Each Smart Fuse could operate a number of times through the year as, for example, they are moved around the network in response to known transient faults where a Smart Fuse was installed going quiet, new transient faults developing and transient faults going permanent and repairs being carried out to cables. The increasing number of Smart Fuse operations reflects both the roll out of the training courses and the units being issued to increasing number of fault teams and fault engineers developing experience with the devices and being better able to target appropriate locations.

ENWT001 The Bidoyng Smart Fuse Closedown Report/May 2014/v1.0 23 of 48
Aug 11 to July 12
Aug 12 to July 13
Aug 13 to Apr 14*
Primary Fuse Rupture
Incidents Type of fault No. of
faults % No. of faults % No. of
faults %
Successful Customer
Restorations (< 3 minutes)
Transient - supplies restored under 3 mins then planned
fuse replacement 66 69% 85 70% 75 72%
Secondary Rupture within 60 minutes of
restoration
Transient - supplies restored under 3 mins then a further
fuse operation, engineer dispatched for fuse
replacement
10 11% 7 6% 6 6%
Secondary Rupture within
3 minutes of restoration
Permanent fault - supplies off - engineer dispatched for fault finding according to COP617
19 20% 30 25% 23 22%
*incomplete year Table 7-9 – Smart Fuse Performance
Table 7-10 and Table 7-11 show Nafirs2 information for low voltage underground transient faults recorded for the two complete years available at the time of writing, 2012 and 2013. They show a correlation between a reducing number of low voltage transients (because the Smart Fuse restores supplies so the transient is not recorded) and an increasing use of the Smart Fuse. Two years is not enough time to draw any firm conclusion between the increasing use of the Smart Fuse and a reduction in the number of transient faults but the results are certainly encouraging.
2 National Fault and Interruption Reporting Scheme - http://www.energynetworks.org/electricity/engineering/nafirs.html;
ENWT001 The Bidoyng Smart Fuse Closedown Report/May 2014/v1.0 24 of 48
Number of incidents Sum of number of
customers interrupted
Sum of customer minutes lost
LV non-damage 3,904 104,855 8,610,800
LV Underground Mains - damage 3,465 130,668 32,281,207
LV All Other Switchgear, Plant & Equipment - damage
131 6,681 1,230,616
LV Services overhead (excl cut-outs) - damage & non-damage
449 885 139,514
LV Services underground (excl cut-outs) - damage & non-damage
2,548 29,957 2,602,450
Table 7-10 – Nafirs Data for LV Transients for 2012
No of Fuse Ops Number of incidents Sum of number of
customers interrupted
Sum of customer minutes lost
LV non-damage 2,633 67,058 5,316,865
LV Underground Mains - damage 3,009 107,700 24,468,731
LV All Other Switchgear, Plant & Equipment - damage
301 9,584 1,607,917
LV Services overhead (excl cut-outs) - damage & non-damage
537 1,181 408,015
LV Services underground (excl cut-outs) - damage & non-damage
2,530 27,832 2,334,367
Table 7-11 – Nafirs Data for LV Transients for 2013
7.4 LV Fault Management Policy Implementation
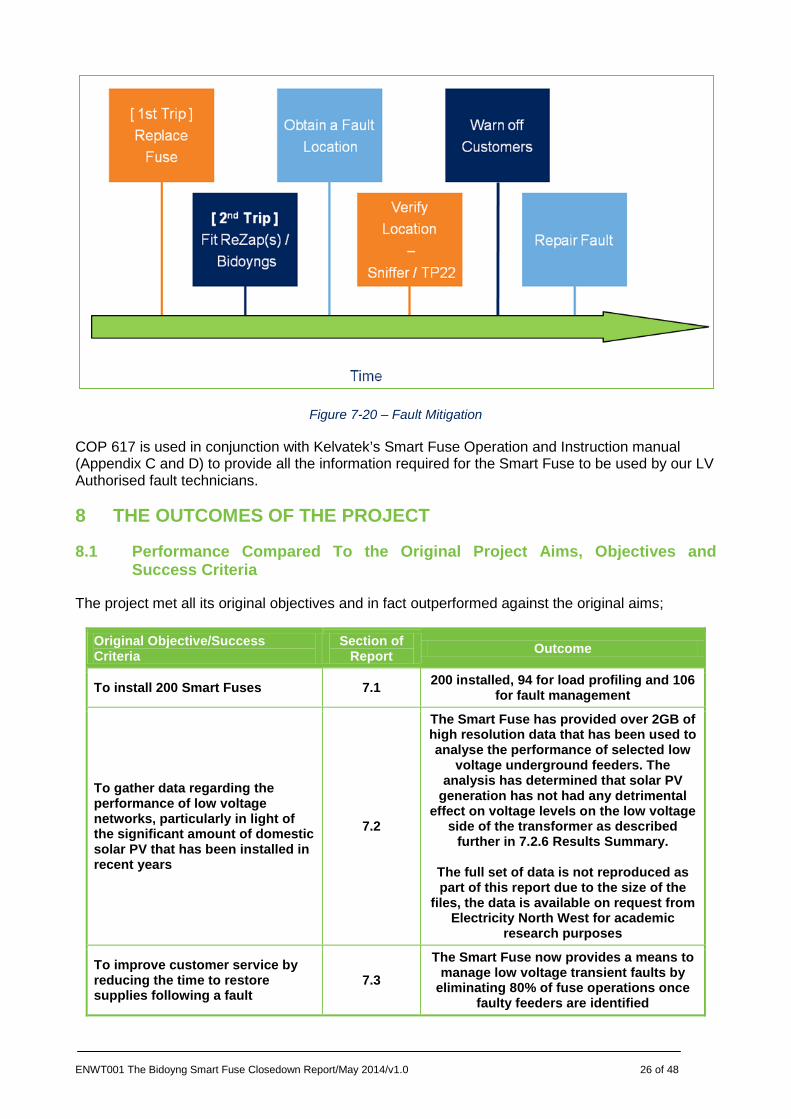
The use of the Smart Fuse in Electricity North West is now written into Code of Practice 617 - Fault Location Techniques for the LV Underground Network. The code of practice describes the various stages of fault development and the mitigation and makes use of several technologies developed under the Innovation Funding Incentive. COP 617 is a fully developed and approved internal procedure that describes types of faults and their implications. Sections covered include;

ENWT001 The Bidoyng Smart Fuse Closedown Report/May 2014/v1.0 25 of 48
• Introduction • Scope • Definitions • Faults • Restoration and Pre-location Summary • Restoration Equipment • Pre-location Equipment • Pre-location Notes • Pinpointing Equipment and Techniques
COP 617 describes basic fault types including;
Arcing Faults - characterised by arcing which is very unstable and non-linear. There is a voltage drop across the fault. Burning occurs which rapidly heats the point of fault and produces hot conducting gases, through which the high fault current flows
Welded faults - Welded faults do not exhibit any of the Arcing Faults characteristics. They occur when insulation has broken down between two conducting metals and sufficient heat has been generated to weld the two conductors together, therefore completing a short circuit. A welded fault can be between any two or more phases or between any one or more phases and neutral. A characteristic of this type of fault is that the voltage gradient which is present on the supply side of the fault stops at the fault position (i.e. no voltage gradient beyond that point)
COP 617 also describes the various equipment used for fault management and its safe operation;
FuseMate – Comprises a miniature vacuum switch in series with a fuse. It is designed to re-energise a circuit temporarily after a fuse has operated and is inserted in place of the fuse. Once in place, the breaker can be operated remotely, thus re-energising the circuit from a safe distance
Rezap Fault Master and Modular Rezap – These units are auto-reclosers with a programmable number of trips-to-lockout and built in fault-finding capability. The reclose operation is performed by a vacuum recloser. Rezap units are the basic platforms used for supply restoration and pre-location of persistent faults on low voltage underground networks
Retrace – The Retrace can aid fault pre-location where there is uncertainty or apparent discrepancy in the low voltage network records. This is particularly useful for ensuring that fault finding equipment is connected to the correct phase
Delta V – This device uses the voltage gradient technique to locate faults on underground low voltage cables. It is especially effective when used with the Rezap Fault Master on both intermittent and persistent faults and for locating faults on complex cable networks
T-P22 – This is essentially a fault disturbance recorder. It displays, records and processes the waveforms of all three phases. It is particularly effective when used in conjunction with a Rezap and it can be left to record the waveforms and wait for a fault to occur
Cable Sniffer – This is used to pinpoint the location of underground faults by analysing the content of gas produced by burning insulation. The gasses produced during the fault remain for several hours and by analysing and quantifying the level of gas along the cable route it is possible to define a very accurate fault location prior to excavation
In addition to the Smart Fuse, COP 617 also prescribes the timescales to be adopted for the deployment of other low voltage fault management technologies as illustrated in Figure 7-20.
ENWT001 The Bidoyng Smart Fuse Closedown Report/May 2014/v1.0 26 of 48
Figure 7-20 – Fault Mitigation
COP 617 is used in conjunction with Kelvatek’s Smart Fuse Operation and Instruction manual (Appendix C and D) to provide all the information required for the Smart Fuse to be used by our LV Authorised fault technicians.
8 THE OUTCOMES OF THE PROJECT
8.1 Performance Compared To the Original Project Aims, Objectives and Success Criteria
The project met all its original objectives and in fact outperformed against the original aims;
Original Objective/Success Criteria
Section of Report Outcome
To install 200 Smart Fuses 7.1 200 installed, 94 for load profiling and 106 for fault management
To gather data regarding the performance of low voltage networks, particularly in light of the significant amount of domestic solar PV that has been installed in recent years
7.2
The Smart Fuse has provided over 2GB of high resolution data that has been used to analyse the performance of selected low
voltage underground feeders. The analysis has determined that solar PV
generation has not had any detrimental effect on voltage levels on the low voltage
side of the transformer as described further in 7.2.6 Results Summary.
The full set of data is not reproduced as part of this report due to the size of the
files, the data is available on request from Electricity North West for academic
research purposes
To improve customer service by reducing the time to restore supplies following a fault
7.3 The Smart Fuse now provides a means to
manage low voltage transient faults by eliminating 80% of fuse operations once
faulty feeders are identified

ENWT001 The Bidoyng Smart Fuse Closedown Report/May 2014/v1.0 27 of 48
To provide enough data to develop policies and procedures regarding the use of the Smart Fuse on low voltage networks
7.4
The Smart Fuse has operated safely both due to design of the device and the
development of robust operating procedures. The basis of ENWLs internal
policy and code of practice documentation is contained in Section 7.4
7.4and installation instructions and procedures are contained in the Appendix
to the report
Table 8-1 – Performance Compared To the Original Project Aims, Objectives and Success Criteria
8.2 Required Modifications to the Planned Approach during the Course of the Project
There were no modifications to the scope or delivery of the project from the information provided at time of registration.
8.3 Significant Variance in Expected Costs and Benefits
There were no significant variations in the expected costs of the project. The original forecast at the time of Project Registration was £442,666, the final cost was £387,336.
Original Objective Forecasted Cost Actual Cost Provider Comments
Purchase 200 Smart Fuses, Gateways and associated
Technical Support £357,666 £354,700 Kelvatek
Minor variation in original forecasted
costings
Project Management £35,000 £20,265
Electricity North West
Contingency not used, installation
and project management costs
less than forecasted
Smart Fuse Installation £15,000 £4,871
Contingency £30,000 £0
Internal Policy Creation £5,000 £7,500
Network Fault Restoration Analysis £0 £0 Kelvatek
Provided as part of the technical
support element of the contract
Network Performance Analysis £0 £0 Durham
University
Provided as part of an IFI Funded
Project in Storage for Distribution
Networks
Total £442,666 £387,336
Table 8-2 – Forecasted and Actual Costs
Financial benefits resulting in restoring customers supplies in under 3 minutes were achieved on a device by device basis although no claims were made for the overall benefits of deploying the entire fleet of devices at the outset. Financial benefits from the data analysis are harder to quantify and will be delivered through the development of optimal design of low voltage networks. The EA Technology Ltd Transform model has been used to assess the projected volume of PV installations
ENWT001 The Bidoyng Smart Fuse Closedown Report/May 2014/v1.0 28 of 48
and the models developed by this project were used to assess the likely load flows from these volumes.
8.4 Lessons Learnt For Future Projects
During the course of the project no significant issues were discovered that prevented the use of the Smart Fuse and based on the on-going results, Electricity North West has already purchased further Smart Fuses for use by our fault restoration teams.
Transfer of new technology into DNO businesses is a standard activity as, for example, manufacturers develop new circuit breakers. This project followed a very similar path with the only real difference being that the new technology was developed at the behest of Electricity North West rather than relying on manufacturers to develop new technology, one of the many advantages of funding from the low carbon networks fund.
8.5 Facilitate Replication
The Smart Fuse is a fully developed device and has the full technical and commercial support structure in place that would be expected of any commercially available technology. Electricity North West can advise any DNO on adoption of the Smart Fuse and discussions have already taken place at the time of writing with a number of DNOs who are assessing the potential costs and benefits of the Smart Fuse. Whilst the benefits of the Smart Fuse would be related to the specific Quality of Supply Strategy of a DNO, there are no barriers in place regarding the technology or its use by any electricity network operator. There is no further development of the physical technology required although the fault analysis software that is employed within the device is under constant review and development. One feature built into the Smart Fuse at the request of Electricity North West is ‘over the air’ software and firmware upgrades managed by Kelvatek, the devices do not need to be returned to have their operating software upgraded to the latest versions, it is all done automatically as is GPS enabled tracking so the locations of the devices are known at all times. 8.6 IPR Ownership
IPR developed during the project is listed below;
Owner Nature Availability
Kelvatek
Manuals, Operating procedures
and technical training
courses
Available
Electricity North West
Code of Practice and internal procedures
Available in a format to be agreed, procedures developed are specific to ENWL therefore
consideration needs to be made to their suitability for use by another company
Durham University Analysis of data Available as part of PhD studies when the final
theses are available
Table 8-3 – IPR Ownership
ENWT001 The Bidoyng Smart Fuse Closedown Report/May 2014/v1.0 29 of 48
9 PLANNED IMPLEMENTATION
The Smart Fuse has been fully adopted at Electricity North West and is use as a business as usual approach to the management and mitigation of faults on our low voltage underground network.
10 ACADEMIC PAPERS
Crossland, A., Jones, D., & Wade, N. (2013). Energy Storage/Demand Side Response in LV Networks: Design of Cost Based Planning Tools for Network Operators. 22nd International Conference on Electricity Distribution. Stockholm.
Wang, L., Liang, D., Crossland, A., Wade, N., & Jones, D. (2013). Using a Smart Grid Laboratory to Investigate Battery Energy Storage to Mitigate the Effect of PV in Distribution Networks. 22nd International Conference on Electricity Distribution. Stockholm.
11 CO-AUTHORS
Thanks to Dave Talbot at Electricity North West, Neal Wade and Andrew Crossland at Durham University and to Jonathan Rogers and Nigel Russell at Kelvatek.

ENWT001 The Bidoyng Smart Fuse Closedown Report/May 2014/v1.0 30 of 48
APPENDIX A - ORIGINAL PROJECT SCOPE AND OBJECTIVES
As logged on Ofgem’s LCNF pages (https://www.ofgem.gov.uk/publications-and-updates/first-tier-low-carbon-network-fund-project-bidoyng-smart-fuse-submitted-electricity-north-west-limited-enwlt1001)
Project title The 'Bidoyng' Smart Fuse
Project background
In recognition of the number of Transient Faults being experienced on Low Voltage (LV) Distribution Networks and the constant drive to improve customer service, Electricity North West initiated the IFI funded Fuse Restorer Project in 2006 with Kelvatek. The aim of the project was to develop a device capable of carrying two LV fuses in a standard size fuse carrier that could automatically insert a secondary fuse into a circuit following a Transient Fault to restore supplies to our customers and could then send an alarm to a nominated contact. Kelvatek delivered the final device, now known as the 'Bidoyng Smart Fuse' and three were installed on Electricity North West's network in Wigan, Lancs, they successfully operated to restore supplies to over 100 connected customers following a transient fault at 11.30pm on 14th November. The Smart Fuse has been fully type tested (up to 50kA) and now provides a potential means to eliminate a significant proportion of Transient Faults based on developing a targeted installation strategy.
Scope and objectives
The primary aim of this project is to test the feasibility of installing a sufficient number of Smart Fuses to reduce the impact of Transient Faults on our network, if the Smart Fuse proves a reliable solution the project will provide enough data to develop a business case for the installation of a substantial number of units. During the development of The Smart Fuse the debate on smart grids has developed significantly with the recognition that the Low Voltage Network will become ever more important as domestic scale renewable energy generation is expected to play an ever greater part in the transition to a low carbon economy. The Smart Fuse has been designed to provide a high specification voltage and load profiling platform with full communications capability and a range of fault analysis applications under development and this project will provide the data needed to develop the network load modelling and profiling algorithms to support the optimisation of our low voltage network. The scope of the project is to install 200 Smart Fuse units and Gateways in identified LV circuits. The Smart Fuse units are retrofitted to the LV Fuse position in the LV Fuse pillar with 3 Smart Fuse units installed per feeder (one on each phase). 200 units will provide coverage for 66 feeders and one gateway is needed in each substation that Smart Fuses are installed. The objective is to demonstrate the advantages of being able to automatically restore supplies to LV connected customers and to gather data about the performance such a device will deliver to the network. It is envisaged that other smart grid opportunities will arise once data has been gathered and evaluated.
Success Criteria
The project will be considered a success by achieving three milestones: Installation of 200 Smart Fuse units, demonstration of the advantages of the technology (Auto-reclosing, Load profiling) and Smart Grid support. Fault restoration and load profiling data will be gathered from the time of installation which will then be will then be collated and analysed and recommendations published from the data analysis.
ENWT001 The Bidoyng Smart Fuse Closedown Report/December 2013/v0.1 31 of 48
APPENDIX B - TOTAL REAL POWER THROUGH ALL TRANSFORMERS
Figure - B-1: Power through all transformers for 10th-16th February 2012 as unit of peak power
0
0.2
0.4
0.6
0.8
1
1.2
10/02/2012 11/02/2012 12/02/2012 13/02/2012 14/02/2012 15/02/2012
Pow
er a
s uni
t of p
eak
Middlesex Road Dunton Green Brinnington Mount Keston Crescent Lapwing Lane
ENWT001 The Bidoyng Smart Fuse Closedown Report/December 2013/v0.1 32 of 48
Figure - B-2: Average voltage across phases on 10/02/2012 for all transformers
230
232
234
236
238
240
242
244
246
248
00:00 01:00 02:00 03:00 04:00 05:00 06:00 07:00 08:00 09:00 10:00 11:00 12:00 13:00 14:00 15:00 16:00 17:00 18:00 19:00 20:00 21:00 22:00 23:00
Aver
age
Phas
e Vo
ltage
[V]
Middlesex Road Dunton Green Brinnington Mount Keston Crescent Lapwing Lane
ENWT001 The Bidoyng Smart Fuse Closedown Report/December 2013/v0.1
APPENDIX C – INSTALLATION MANUAL
BIDOYNG
OPEATIONAL MANUAL
July 2011
40-0142-02
BIDOYNG
Operational Manual

ENWT001 The Bidoyng Smart Fuse Closedown Report/December 2013/v0.1
www.kelvatek.com
Please register your details at our website to access product support and software updates.
IMPORTANT!
Please read this manual carefully to familiarise yourself with the safe and effective use of BIDOYNG before operation.
Please retain this manual for future reference.
Specifications are subject to change without notice. Look for the following items when reading this guide:
Important Information
This exclamation point means there is a note of interest that you should pay special attention to while using BIDOYNG.
Warning
Where the warning symbol is displayed means that user should exercise caution. Failure to follow proper procedure could damage property or the BIDOYNG.

ENWT001 The Bidoyng Smart Fuse Closedown Report/December 2013/v0.1
Conventions
Throughout this manual, the following conventions shall be used:
• When a key term is mentioned, the definition will appear like this:
definition
• BIDOYNG parts are referenced to Figure 2 like this:
Part name (#)

ENWT001 The Bidoyng Smart Fuse Closedown Report/December 2013/v0.1 36 of 48
Parts of the BIDOYNG
Figure 1: The BIDOYNG components

ENWT001 The Bidoyng Smart Fuse Closedown Report/December 2013/v0.1 37 of 48
Key
1 Primary Fuse Carrier 10 Secondary Fuse
2 Primary Fuse 11 Main Body Clamp Thumbscrews
3 Fold-Away Handle 12 Status Indicator LED
4 Spring Actuator 13 Warning Flag
5 Auto Reclose Disable Switch 14 Lever
6 Primary Fuse Carrier Thumb- screws 15 Neon Indicator
7 Main Body 16 Neutral Cable Connector
8 Switch 17 Test Lamp Connection Holes
9 Primary Fuse Stocks
1. INTRODUCTION
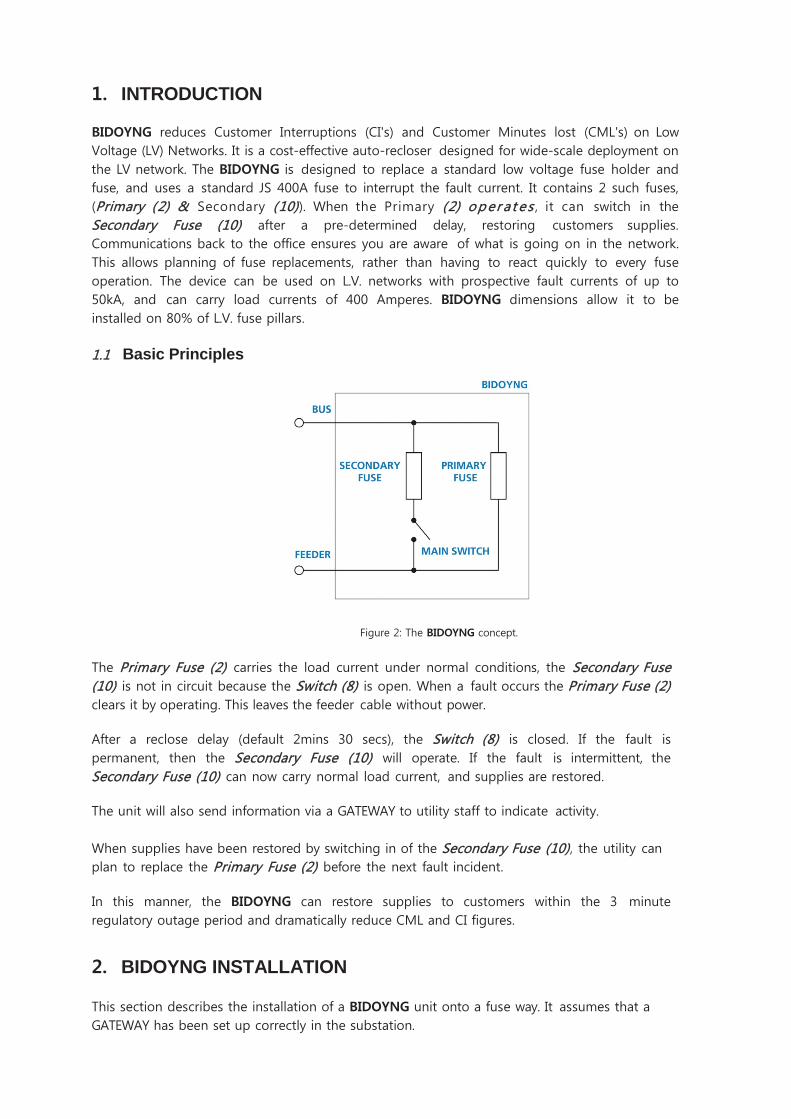
BIDOYNG reduces Customer Interruptions (CI's) and Customer Minutes lost (CML's) on Low Voltage (LV) Networks. It is a cost-effective auto-recloser designed for wide-scale deployment on the LV network. The BIDOYNG is designed to replace a standard low voltage fuse holder and fuse, and uses a standard JS 400A fuse to interrupt the fault current. It contains 2 such fuses, (Primary (2) & Secondary (10)). When the Primary (2) oper a t e s , it can switch in the Secondary Fuse (10) after a pre-determined delay, restoring customers supplies. Communications back to the office ensures you are aware of what is going on in the network. This allows planning of fuse replacements, rather than having to react quickly to every fuse operation. The device can be used on L.V. networks with prospective fault currents of up to 50kA, and can carry load currents of 400 Amperes. BIDOYNG dimensions allow it to be installed on 80% of L.V. fuse pillars.
1.1 Basic Principles
Figure 2: The BIDOYNG concept.
The Primary Fuse (2) carries the load current under normal conditions, the Secondary Fuse (10) is not in circuit because the Switch (8) is open. When a fault occurs the Primary Fuse (2) clears it by operating. This leaves the feeder cable without power.
After a reclose delay (default 2mins 30 secs), the Switch (8) is closed. If the fault is permanent, then the Secondary Fuse (10) will operate. If the fault is intermittent, the Secondary Fuse (10) can now carry normal load current, and supplies are restored.
The unit will also send information via a GATEWAY to utility staff to indicate activity. When supplies have been restored by switching in of the Secondary Fuse (10), the utility can plan to replace the Primary Fuse (2) before the next fault incident.
In this manner, the BIDOYNG can restore supplies to customers within the 3 minute regulatory outage period and dramatically reduce CML and CI figures.
2. BIDOYNG INSTALLATION
This section describes the installation of a BIDOYNG unit onto a fuse way. It assumes that a GATEWAY has been set up correctly in the substation.

2.1 BIDOYNG Pre-installation checks
The Main Body (7) of the BIDOYNG is designed to be inserted onto the fuse stalks using a non-pivoting action. In order to ensure that the BIDOYNG does not pick up fault current during installation, it is essential that the following checks are carried out:
1. Fit the Secondary Fuse (10).
2. Ensure Primary Fuse (2) is removed.
3. Charge Spring Actuator (4).
4. Re-Insert Primary Fuse Holder (1).
5. Set Lever (14) to Secondary out.
6. Set to Auto.
7. Ensure open circuit between test points A & B.
If number 7 indicates closed circuit DO NOT USE THE BIDOYNG and check the above procedure was followed correctly.
2.2 Installation procedure
Ensure that the pre-installation checks (section 2.1) have been carried out before going ahead with the installation procedure.
Approved PPE must be used when installing the BIDOYNG onto the fuse way.
1. Put GATEWAY into install mode.
2. Set to Auto
3. Insert the assembled BIDOYNG onto the fuse way stalks and secure into position using the two Main Body Clamp Thumbscrews (11) on the left.
4. Connect the umbilical cable to the BIDOYNG and to the Neutral Bar
5. On the BIDOYNG set to AUTO mode by moving the auto-reclose switch to the ON position. Wait until the BIDOYNG switches the Secondary Fuse (10) into circuit (approximately 15 seconds). Check Lever is up
6. Ensure that the Secondary Fuse (10) holes, (Neon Indicator (15)) re mains off
When BIDOYNG is about to close it will give a warning beep. The last 10 seconds before close will be a fast beep.
7. Install the next BIDOYNG.
8. Follow GATEWAY on-screen instructions to choose BIDOYNG positions. Save and exit to complete the install on the GATEWAY.
9. Replace the Primary Fuse (2) using the procedure described in section 5.
3. RECLOSING 3.1 Auto reclosing
Auto reclosing can be disabled or enabled using the Auto Reclose Disable Switch (5) on the Main Body (7).
After a fault event causes the Primary Fuse (2) to operate, the BIDOYNG will pause for a reclose delay (typical 2 minutes 30 seconds). During the reclose delay a slow warning beep will be sounded from the BIDOYNG. After this time, a fast warning beep is given for 10

seconds, after which the Main Switch (8) will close and the Secondary Fuse (10) will be switched into circuit.
3.2 Phase-phase fault
BIDOYNG will not reclose onto a phase-phase fault condition.
4. PERFORMING TESTS WITH BIDOYNG FITTED 4.1 Checking the state of the bus and feeder
The BIDOYNG has two Test Lamp Connection Holes (17) on the front of the Primary Fuse Carrier (1). These holes give access to the BUS and FEEDER fuse stalks, and are designed to allow connection of a test lamp.
4.2 BIDOYNG Neon Indicator
The neon indicator on the front panel of the BIDOYNG indicates voltage across the BUS and FEEDER stalks.
When the Lever (14) is in SECONDARY IN position, and the Neon Indicator (15) is illuminated the entire BIDOYNG must be removed from the fuse pillar and pre-installation checks carried out.
5. PRIMARY FUSE REPLACEMENT
The Primary Fuse (2) on the BIDOYNG can be replaced without disconnecting customer supplies.
Only attempt Primary Fuse (2) replacement when the Lever (14) is in the SECONDARY IN position and the Neon Indicator (15) is NOT illuminated! Assume the fault can strike at any time.
Approved PPE must be used. Follow your utility's procedures for replacing LV fuses
5.1 To replace the Primary Fuse:
1. Ensure the load is carried by the Secondary Fuse (10). (Lever (14) in SECONDARY IN position, Neon Indicator (15), not illuminated).
2. Loosen the Primary Fuse Carrier Thumbscrews (6) and remove the Primary Fuse Carrier (1).
3. Replace the Primary Fuse (2) with a fresh fuse.
4. Charge the Spring Actuator (4) by pressing on the plunger until it locks in the retracted position.
5. Check again that the Neon Indicator (15) is out.
6. Place the bottom of the Primary Fuse Carrier (1) onto the lower Primary Fuse Stalk (9). Use a pivoting action to insert the Primary Fuse Carrier (1).
7. Hold the Primary Fuse Carrier (1) in place while tightening the Primary Fuse Carrier Thumbscrews (6).
8. The Primary Fuse (2) is now in parallel with the Secondary Fuse (10) and the Warning Flag
(15) indicator is RED.
9. Switch Lever (14) to SECONDARY OUT. This switches the load onto the Primary Fuse (2).
5.2 Notes:
No attempt should be made to remove the Main Body (7), or to open the contact when the Primary Fuse Carrier (1) is removed. If removing the entire BIDOYNG becomes necessary then insert the Primary Fuse Carrier (1) with NO fuse first.
The Main Switch (7) and Lever (14) is locked in position by means of an interlock when the Primary Fuse Carrier (1) is removed. This feature is to ensure the user's safety.
A red flag shows in the Warning Flag (15) window when the Primary Fuse (2) is removed. It will continue to show until the Primary Fuse Carrier (1) is re-inserted and the Secondary is out. Note that if the Secondary Fuse (10) is left in circuit, this flag will show RED. In this condition the Primary (2) and Secondary (10) fuses are running in parallel. A BIDOYNG should NEVER be left in this condition.
6. SECONDARY FUSE REPLACEMENT
If both the Primary (2) and Secondary (10) fuses have operated, then the entire BIDOYNG must be removed from the fuse pillar.
When the BIDOYNG Switch (8) is closed (Lever (14) in the up position), and the Neon indicator (15) is illuminated the entire BIDOYNG must be removed from the fuse pillar and pre-installation checks carried out.
• Loosen the Main Body Clamp Thumbscrews (11) and remove the entire BIDOYNG unit from the fuse pillar in a quick fluid movement.
• Follow the BIDOYNG installation instructions to install the BIDOYNG back onto the fuse pillar.
7. GATEWAY
The GATEWAY is designed to relay information about the status and operation of BIDOYNG units back to the office or forward the information directly to staff via e-mail and SMS.
8. ALARMS, WEB INTERFACE & MESSAGE FORWARDING 8.1 Alarms
Customer Supply Related Alarms
• Secondary Fuse (10) operated - Customers off supply. • Awaiting reclose instruction - (Manual mode selected) Customers off supply. • Customer supply restored via Secondary Fuse (10)

8.2 Operations Messages
• Primary Fuse (2) operated • Reclose Timer started (Auto mode selected) • BIDOYNG installed successfully • Manual mode - awaiting reclose instruction - Customers off supply
8.3 Warnings
• BIDOYNG in parallel mode for >1 min • BIDOYNG high temperature warning • BIDOYNG critical high temperature warning - Attend site! •
9. SPECIFICATION
SPECIFICATION VALUES Rated Voltage: 90 to 500 V rms
Rated load current: 400 A rms
Reclose Delay Range: 30 seconds to 10 minutes
Maximum fault making capacity: 50,000 A rms
Maximum fault current breaking capacity: Determined by fuse (80kA typical)
Fault making life @ 10kA: TBC
Maximum rating of fuses: 400 A Class J
Primary fuse insertion method: Pivoting action
Nominal gateway radio range: 15 m
Communications: via Kelvatek Gateway (GPRS)
Dimensions: 90.4 x 141 x 161 mm
Weight: 3 kg
Temperature range: -20 to +50 °C
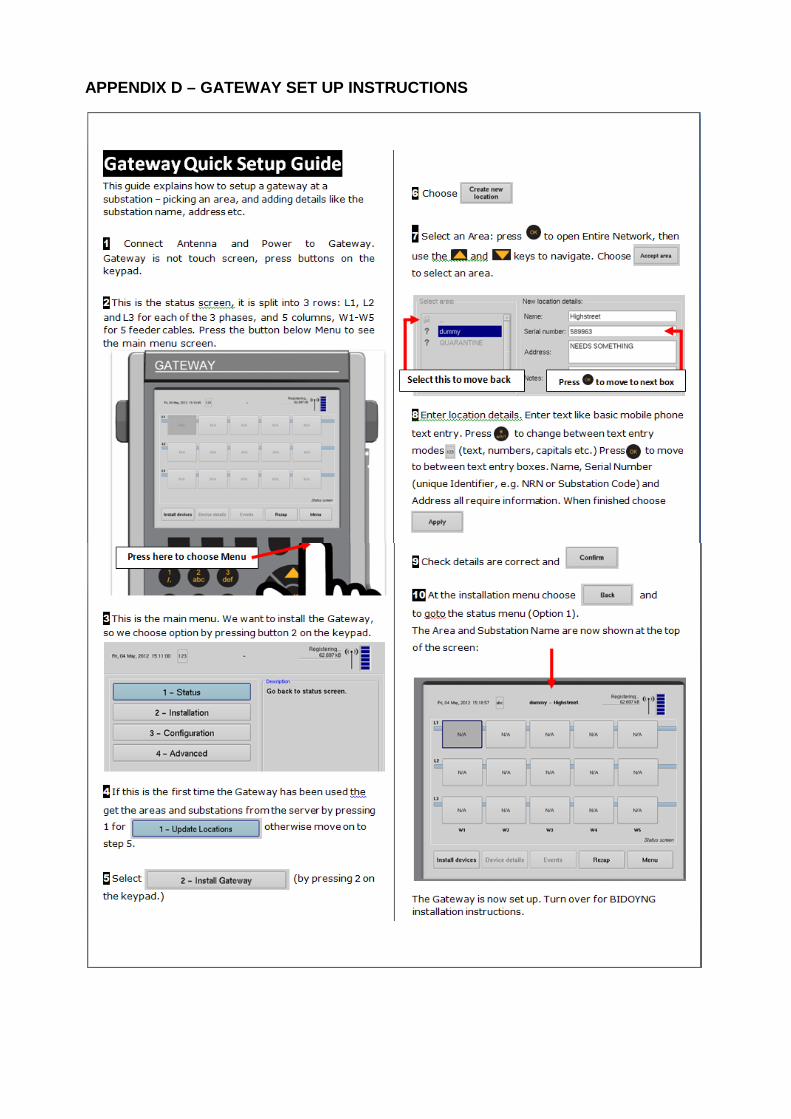
APPENDIX D – GATEWAY SET UP INSTRUCTIONS