
Insert Title of Presentation Here Presenters Name No 1 ...
18
6/19/2012 1 Insert footer here for cover slide if required. Go to View / Slide Master to adjust or remove Storm surge flood level modelling during cyclones for Port Hedland Paul Branson David Taylor Engineers Australia - NSW Coastal, Ocean and Port Engineering Panel Acknowledgements Cardno team Landcorp and Department of Planning who funded the Port Hedland Coastal Vulnerability Study Organizations who contributed data > Port Hedland Port Authority > Department of Transport > Bureau of Meteorology > Department of Water > Town of Port Hedland
Transcript of Insert Title of Presentation Here Presenters Name No 1 ...

6/19/2012
1
Insert footer here for cover slide if required. Go to View / Slide Master to adjust or remove
Storm surge flood level modelling during cyclones for Port Hedland Paul Branson David Taylor
Engineers Australia - NSW Coastal, Ocean and Port Engineering Panel
Acknowledgements
Cardno team Landcorp and Department of Planning who funded the Port Hedland Coastal Vulnerability
Study Organizations who contributed data
> Port Hedland Port Authority > Department of Transport > Bureau of Meteorology > Department of Water > Town of Port Hedland
6/19/2012
2
Engineers Australia - NSW Coastal, Ocean and Port Engineering Panel
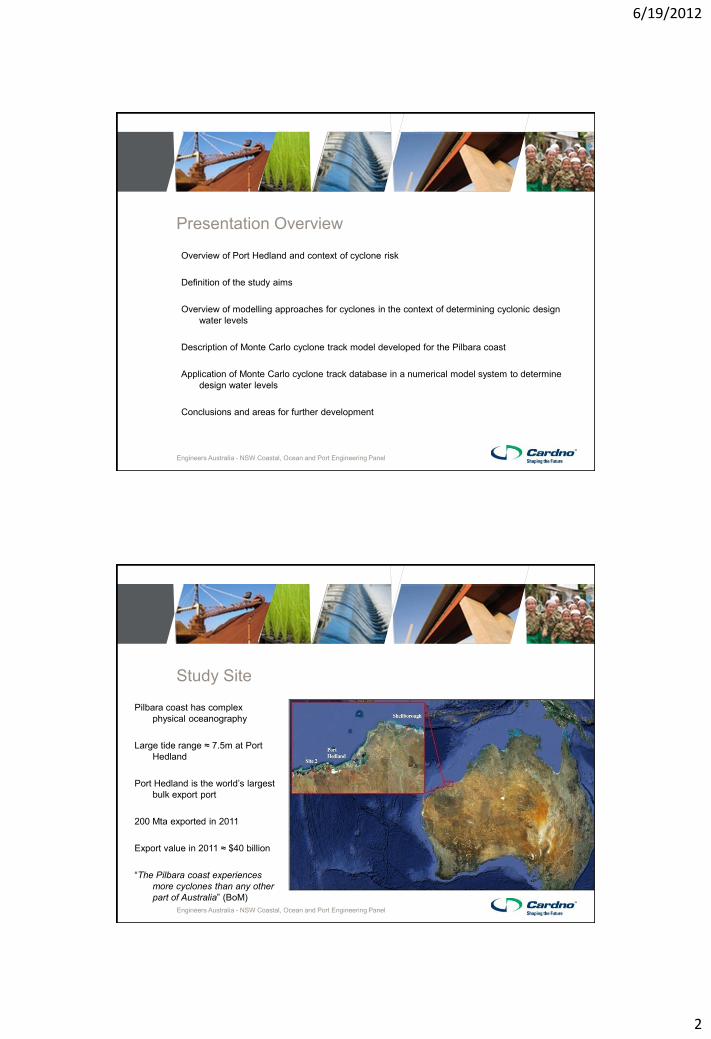
Presentation Overview
Overview of Port Hedland and context of cyclone risk Definition of the study aims Overview of modelling approaches for cyclones in the context of determining cyclonic design
water levels Description of Monte Carlo cyclone track model developed for the Pilbara coast Application of Monte Carlo cyclone track database in a numerical model system to determine
design water levels Conclusions and areas for further development
Engineers Australia - NSW Coastal, Ocean and Port Engineering Panel
Study Site
Pilbara coast has complex physical oceanography
Large tide range ≈ 7.5m at Port
Hedland Port Hedland is the world’s largest
bulk export port 200 Mta exported in 2011 Export value in 2011 ≈ $40 billion “The Pilbara coast experiences
more cyclones than any other part of Australia” (BoM)

6/19/2012
3
Engineers Australia - NSW Coastal, Ocean and Port Engineering Panel
Port Hedland
Engineers Australia - NSW Coastal, Ocean and Port Engineering Panel
UDP – 495Mta
Port Hedland Port Developments
Outer Harbour Capacity – 100 to 400Mta

6/19/2012
4
Engineers Australia - NSW Coastal, Ocean and Port Engineering Panel
Coastal Processes
Engineers Australia - NSW Coastal, Ocean and Port Engineering Panel
Cyclone Risk and Impacts Pilbara coastline experiences high frequency and
intensity of cyclones Cape Lambert ≈ 150km west of Port Hedland
Central Pressure Distribution – Cyclones within 100km
1939 Cyclone – Photo taken outside Esplanade Hotel storm tide
estimated at +5.7m AHD, +2m above HAT
6/19/2012
5
Engineers Australia - NSW Coastal, Ocean and Port Engineering Panel
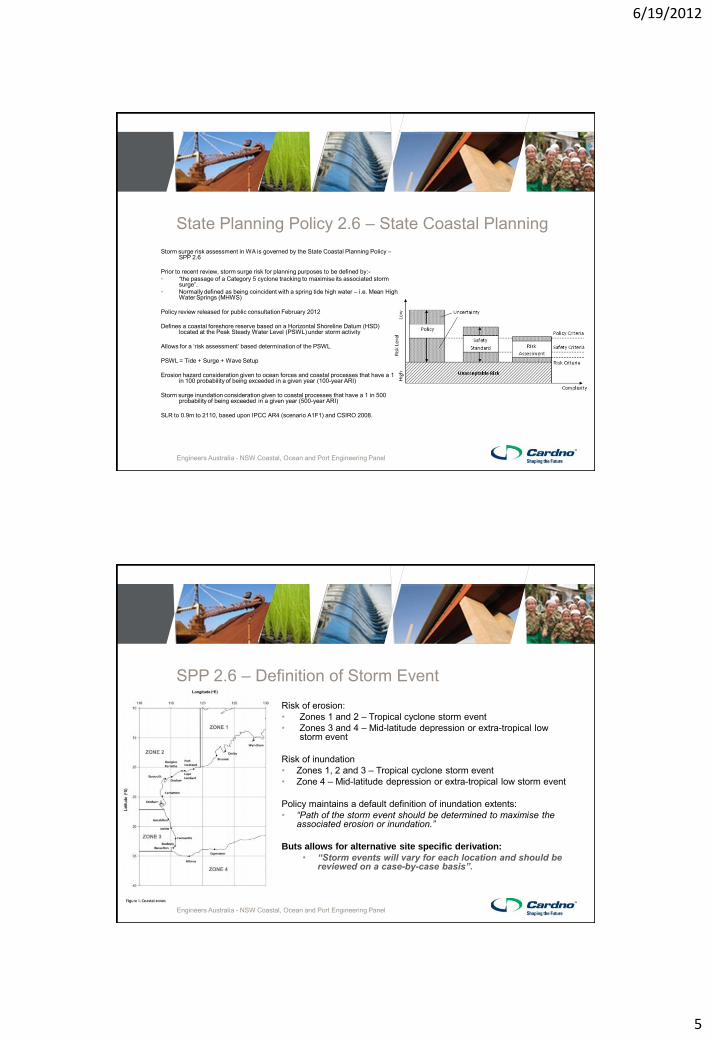
State Planning Policy 2.6 – State Coastal Planning Storm surge risk assessment in WA is governed by the State Coastal Planning Policy –
SPP 2.6 Prior to recent review, storm surge risk for planning purposes to be defined by:- • “the passage of a Category 5 cyclone tracking to maximise its associated storm
surge”. • Normally defined as being coincident with a spring tide high water – i.e. Mean High
Water Springs (MHWS) Policy review released for public consultation February 2012 Defines a coastal foreshore reserve based on a Horizontal Shoreline Datum (HSD)
located at the Peak Steady Water Level (PSWL) under storm activity Allows for a ‘risk assessment’ based determination of the PSWL PSWL = Tide + Surge + Wave Setup Erosion hazard consideration given to ocean forces and coastal processes that have a 1
in 100 probability of being exceeded in a given year (100-year ARI) Storm surge inundation consideration given to coastal processes that have a 1 in 500
probability of being exceeded in a given year (500-year ARI) SLR to 0.9m to 2110, based upon IPCC AR4 (scenario A1F1) and CSIRO 2008.
Engineers Australia - NSW Coastal, Ocean and Port Engineering Panel
SPP 2.6 – Definition of Storm Event Risk of erosion: • Zones 1 and 2 – Tropical cyclone storm event • Zones 3 and 4 – Mid-latitude depression or extra-tropical low
storm event Risk of inundation • Zones 1, 2 and 3 – Tropical cyclone storm event • Zone 4 – Mid-latitude depression or extra-tropical low storm event
Policy maintains a default definition of inundation extents: • “Path of the storm event should be determined to maximise the
associated erosion or inundation.” Buts allows for alternative site specific derivation:
• “Storm events will vary for each location and should be reviewed on a case-by-case basis”.

6/19/2012
6
Engineers Australia - NSW Coastal, Ocean and Port Engineering Panel
Study Outline and Objectives
In 2010, Landcorp and the Department of Planning initiated three Coastal Vulnerability Studies for the Pilbara region focused at future growth sites – Port Hedland, Karratha and Onslow
Each of these sites has been designated as a strategic regional centre in Western Australia
Cardno was awarded the Port Hedland project Cardno recommended that a Monte Carlo cyclone track model be developed to undertake long duration
simulation of cyclone tracks and associated storm water levels at Port Hedland • This study was the first WA government study to adopt a risk assessment approach to define cyclonic
water levels for regional planning Project builds on 5-years of continuous investigation and study of coastal processes and hydrodynamics in
the Port Hedland region Study is focused on shoreline water levels and wave conditions
Engineers Australia - NSW Coastal, Ocean and Port Engineering Panel
Port Hedland Coastal Vulnerability Study
Port Hedland is a strategic regional centre in Western Australia and over the coming 15 years the population is forecast to increase from 19,500 to 40,000.
The Coastal Vulnerability Study assists in identifying development opportunities and
constraints for the Port Hedland region to meet the infrastructure requirements as the population doubles over the coming 15 years.
Comprised of four components: 1. Hydrodynamic ocean modelling to assess extreme water levels 2. Hydrologic assessment of the extreme rainfall conditions 3. Hydraulic modelling of the combined effects of storm surge inundation and
catchment flooding 4. Shoreline stability assessment
6/19/2012
7
Engineers Australia - NSW Coastal, Ocean and Port Engineering Panel
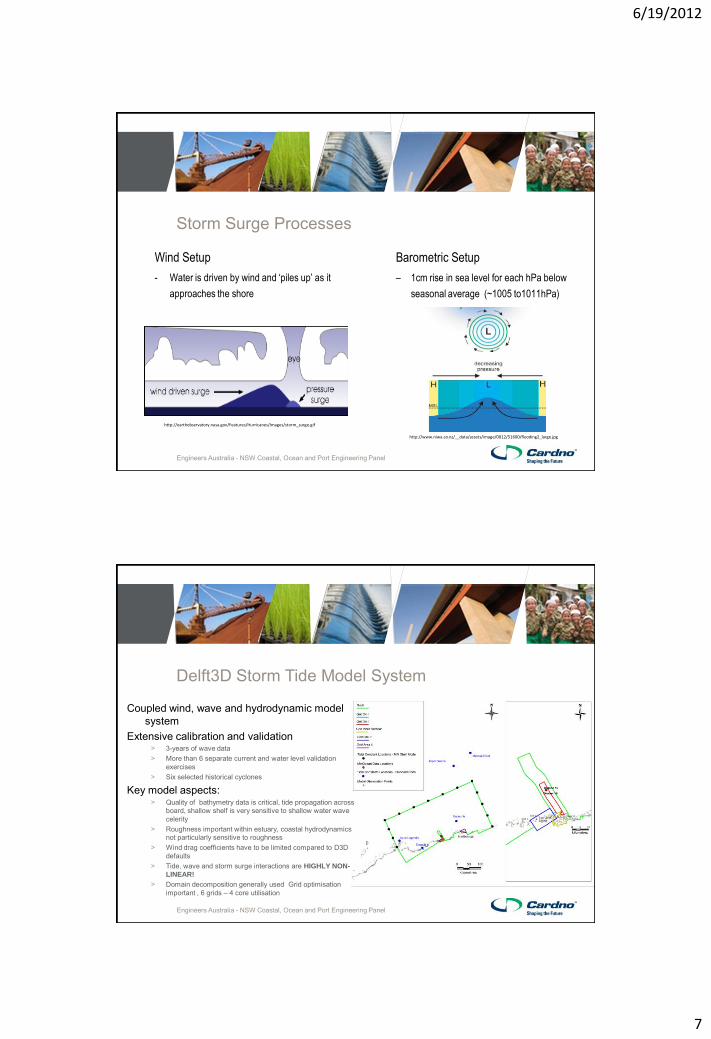
Storm Surge Processes
Barometric Setup
– 1cm rise in sea level for each hPa below
seasonal average (~1005 to1011hPa)
http://www.niwa.co.nz/__data/assets/image/0012/51600/flooding2_large.jpg
Wind Setup
- Water is driven by wind and ‘piles up’ as it
approaches the shore
http://earthobservatory.nasa.gov/Features/Hurricanes/Images/storm_surge.gif
Engineers Australia - NSW Coastal, Ocean and Port Engineering Panel
Delft3D Storm Tide Model System
Coupled wind, wave and hydrodynamic model system
Extensive calibration and validation > 3-years of wave data > More than 6 separate current and water level validation
exercises > Six selected historical cyclones
Key model aspects: > Quality of bathymetry data is critical, tide propagation across
board, shallow shelf is very sensitive to shallow water wave celerity
> Roughness important within estuary, coastal hydrodynamics not particularly sensitive to roughness
> Wind drag coefficients have to be limited compared to D3D defaults
> Tide, wave and storm surge interactions are HIGHLY NON-
LINEAR!
> Domain decomposition generally used Grid optimisation important , 6 grids – 4 core utilisation

6/19/2012
8
Engineers Australia - NSW Coastal, Ocean and Port Engineering Panel
Delft3D Storm Tide Model System Calibration Procedure
Wind and Pressure Model Inputs:
Measured (BoM) cyclone track
and central pressure data
Compare modelled and measured
winds and pressure
Best fit wind and pressure field
SWAN Wave Model Inputs:
Modelled windfield, bathymetry
Compare modelled and measured wave
parameters
Adjust model parameters, in
particular the friction coefficients,
to improve agreement with
measured data
Best fit wave field
Delft3D Hydrodynamic
Model
Compare modelled and measured water
level and storm surge
Inputs:
Modelled wind and pressure field, bathymetry,
offshore modelled wave conditions, variable
bed roughness description Adjust model parameters, in
particular the wind drag
coefficients, to improve
agreement with measured data
Calibrated model system For application as ocean inundation
model system
Best fit hydrodynamic model
Adjust wind model parameters
including RMW and B parameter
to improve agreement with
measured data
Engineers Australia - NSW Coastal, Ocean and Port Engineering Panel
Delft3D Storm Tide Model System Tropical Cyclone George

6/19/2012
9
Engineers Australia - NSW Coastal, Ocean and Port Engineering Panel
Delft3D Storm Tide Model System Tropical Cyclone George
Engineers Australia - NSW Coastal, Ocean and Port Engineering Panel
• Cardno (2011) presents a model investigation of the influence of the phasing between the tide and the cyclone track
• Simulations undertaken for a synthetic cyclone • Central pressure @ landfall = 925 hPa • Crossing 43km west of Port Hedland • Track phase shifted relative to the tide
+/- 6 hours @ 2-hour intervals
• Whilst initially cyclones can be selected from the MC database on intensity or surge potential, a sufficiently large sample needs to be simulated with jointly occurring random tides in a process model
Non-Linear Interaction between Astronomical Tide and Water Level Residual

6/19/2012
10
Engineers Australia - NSW Coastal, Ocean and Port Engineering Panel
Spoil Bank Interaction
1939 Cyclone – Photo taken outside Esplanade Hotel storm tide
estimated at +5.7m AHD, +2m above HAT
Engineers Australia - NSW Coastal, Ocean and Port Engineering Panel
Applying Delft3D to Determine Long Return Period Design Criteria (up to 5000 Years ARI)
A range of study approaches can be adopted:
1. Historical hindcast > Relatively high cyclone frequency but extrapolation
of design levels limited to about 100 to 200 years ARI
> Difficult to define jointly occurring water levels, waves and currents
2. Synthetic Track Simulation > Can potentially simulate a very large sample
synthetic sample set > Developing a robust synthetic track database is
challenging > Computational capacity limits simulations
3. Numerical Simulation > Expand a sample set of results from a process
based model system using a numerical simulation proceedure
> Computationally efficient > Provides a solution to the effect of jointly occurring
water levels > Non-linear interactions and complexities due to
cyclone track neglected

6/19/2012
11
Engineers Australia - NSW Coastal, Ocean and Port Engineering Panel
Stochastic Simulation – Monte Carlo Models
A range approaches exist to determine design cyclonic water levels 1. Analysis of historical data or modelled hindcast data 2. Empirical simulation techniques 3. Historical track translation techniques 4. Stochastic simulation techniques, eg Monte Carlo models 5. Global scale atmospheric and oceanographic process modelling
Monte Carlo modelling techniques have been widely applied in cyclone water level and wave studies
> Hardy T.A., Mason L.B., and McConochie J.D. (2010) > James M.K., Mason L.B., (2005) > Department of Natural Resources and Mines (2001) > Widely adopted in Queensland studies:
– Sunshine Coast: Hardy, Mason, Astorquia and Harper (2004) – Moreton Bay Region: Cardno Lawson Treloar (2009)
The aim of this project was to develop a Monte Carlo cyclone track model which replicated spatial and temporal
variability in cyclone parameters (heading, speed and central pressure) in a framework that is flexible and can be easily deployed to different sites
Engineers Australia - NSW Coastal, Ocean and Port Engineering Panel
Monte Carlo Model Development Stochastic modelling requires careful analysis of comprehensive
data sets to produce a robust and realistic model A range of BoM data sets utilised: Best Track, re-analysis and
operational All data re-sampled to 1-hour time step Analyses undertaken on all cyclones which passed within 500km
of Port Hedland post-1960, CP < 980hPa (77 events) Analysed variables:-
> Time of origin (adopted to be the time at which it entered a 1,000km radius from Port Hedland);
> Location of origin; > Central pressure; > Forward speed; and > Cyclone heading.

6/19/2012
12
Engineers Australia - NSW Coastal, Ocean and Port Engineering Panel
• Spatial probability functions developed for rates of change with time for key cyclone variables:-
• Speed:
• Heading:
• Central pressure:
• Probability distributions developed for a 250km Cartesian grid
• For grid cells with an even split between over-water and over-land area separate distributions were developed
Model Probability Distributions
dt
Pc
dt
V fwd
dt
Engineers Australia - NSW Coastal, Ocean and Port Engineering Panel
1. Simulations initiated 1000km from Port Hedland and proscribed:
• Location of origin • Central pressure • Forward speed • Cyclone heading
2. Cyclones simulated as a generalised random
walk:
3. Model applies conditional probability – change in parameter variable dependent on value at previous time step:
Model Operation
)(
)()|(
xXP
yYxXPxXyYP
n
i iYYY10

6/19/2012
13
Engineers Australia - NSW Coastal, Ocean and Port Engineering Panel
Model Verification
Historical 50-year model simulation
Engineers Australia - NSW Coastal, Ocean and Port Engineering Panel
Comparison central pressure – historical and 200 Monte Carlo
simulations (50-years each)
Model Verification

6/19/2012
14
Engineers Australia - NSW Coastal, Ocean and Port Engineering Panel
• Complete model data base comprises 16,000 events
• An appropriate sub-sample of severe events must be selected for detailed simulation in the process model system
• A multi-tiered ranking algorithm applied to identify severe cyclones which could generate extreme water levels
• In Cardno (2011), an empirical non-linear regression model for storm surge generated from a 35 sample of hindcast events using the calibrated process model system
• Limitation is that this algorithm neglects the interaction between tide and the total residual water level
Ranking Monte Carlo Cyclone Database
Engineers Australia - NSW Coastal, Ocean and Port Engineering Panel
Top 1000 Events

6/19/2012
15
Engineers Australia - NSW Coastal, Ocean and Port Engineering Panel
Regional Ranking Model
Top 1000 events identified by Regression Model implemented in coarse regional scale coupled wind-hydrodynamic-wave model
Grid resolution from 1500m x 1500m to 500m x 500m at site
5 min time step sufficient to account for physical process at coarse resolution
Regional model predicts 90% of variability present in Full Process model for hindcast events with no bias
Engineers Australia - NSW Coastal, Ocean and Port Engineering Panel
Design Event Selection
EVA applied to regional ranking results and design events selected ARI 100 event, low intensity but occurred at large spring tide

6/19/2012
16
Engineers Australia - NSW Coastal, Ocean and Port Engineering Panel
Design Levels
Engineers Australia - NSW Coastal, Ocean and Port Engineering Panel
Combined Ocean and Catchment Flooding The Port Hedland CVS also involved a
comprehensive catchment flood assessment for the Port Hedland region
Analysis of historical data indicated that there was
no significant correlation being cyclonic ocean water levels and rainfall
Cardno worked with the Department of Transport
and Department of Water to formulate a conservative model to account for Joint Occurrence of ocean and catchment flooding
• 1:5 ARI allowance up to 100-years ARI, i.e. 100-year ARI ocean level coincident with 20-year catchment flows (and vis-versa)
• 1:10 ARI allowance beyond 100-years ARI, i.e. 500-year ARI ocean level coincident with 50-year catchment flows (and vis-versa)

6/19/2012
17
Engineers Australia - NSW Coastal, Ocean and Port Engineering Panel
Conclusions
Monte Carlo cyclone track model is an accepted technique to simulate physically complex cyclone track generation and propagation processes
A Monte Carlo model system has been developed for the Pilbara region which replicates spatial and
temporal variations in historical cyclone tracks and intensity The model system has been demonstrated in a regional inundation risk assessment study which
required the determination of long return period design water levels The architecture of the model system means it is highly adaptable and can be readily deployed to
other locations Careful selection of the model domain and grid discretisation is required to account for variations in
cyclone processes and available data sets
Engineers Australia - NSW Coastal, Ocean and Port Engineering Panel
Current and Further Model Developments
A regional scale process model has been developed to allow a large number of cyclones (>3,000
events) to be simulated in the hydrodynamic model (including tide) within a short time period (<5-days, 20 CPU’s)
Open source software and cloud computing enable a large number of events to be simulated with
coupled wind, waves and hydrodynamics in high resolution Implementation of a physically based condition to limit the potential minimum central pressure
Integration of larger scale atmospheric forcing into the model to allow complex wind fields to be
generated for each Monte Carlo model event

6/19/2012
18
Engineers Australia - NSW Coastal, Ocean and Port Engineering Panel
Thank you and Questions


![[insert briefing type here] [insert program name here] for [insert name and organization of person(s) to be briefed here] [insert “month day, year” of.](https://static.fdocuments.us/doc/165x107/56649ed15503460f94bdfd72/insert-briefing-type-here-insert-program-name-here-for-insert-name-and.jpg)

![Lecture 1: Unit 1 [Insert Course Reference Here] [Insert Facilitator Reference Here] [Insert Contact Details Here] [Insert Contact Web address Here] .](https://static.fdocuments.us/doc/165x107/551488d5550346d36e8b4d98/lecture-1-unit-1-insert-course-reference-here-insert-facilitator-reference-here-insert-contact-details-here-insert-contact-web-address-here-wwwnaturaledgeprojectnet.jpg)


