Inquiry into the sustainability and operational challenges ... · sustainability. The report looks...
18
Parliament of Victoria Environment, Natural Resources and Regional Development Committee Ordered to be published VICTORIAN GOVERNMENT PRINTER December 2017 PP No 350, Session 2014‑17 ISBN 978 1 925703 14 6 (print version) 978 1 925703 15 3 (PDF version) Inquiry into the sustainability and operational challenges of Victoria’s rural and regional councils Interim Report PARLIAMENT OF VICTORIA Environment, Natural Resources and Regional Development Committee
Transcript of Inquiry into the sustainability and operational challenges ... · sustainability. The report looks...

Parliament of VictoriaEnvironment, Natural Resources and Regional Development Committee
Ordered to be published
VICTORIAN GOVERNMENT PRINTERDecember 2017
PP No 350, Session 2014‑17ISBN 978 1 925703 14 6 (print version) 978 1 925703 15 3 (PDF version)
Inquiry into the sustainability and operational challenges of Victoria’s rural and regional councils
Interim Report
PARLIAMENT OF VICTORIAEnvironment, Natural Resources and Regional Development Committee

ii Environment, Natural Resources and Regional Development Committee
Committee functions
The Environment, Natural Resources and Regional Development Committee is constituted under section 10 of the Parliamentary Committees Act 2003.
The Committee’s functions are to inquire into, consider and report to the Parliament on any proposal, matter or thing concerned with:
a. the environment
b. natural resources
c. planning the use, development or protection of land
d. the provision of services to rural and regional Victoria
e. the development of rural and regional Victoria.

Inquiry into the sustainability and operational challenges of Victoria’s rural and regional councils iii
Committee membership
Ms Bronwyn Halfpenny MPChair (until 23 March 2017)
Thomastown
Mr Josh Bull MPChair (from 23 March 2017) Member from 21 March 2017
Sunbury
Mr Simon Ramsay MLCDeputy Chair (from 23 March 2017)
Western Victoria
Ms Vicki Ward MPMember until 21 March 2017
Eltham
Mr Richard Riordan MPMember from 21 March 2017
Polwarth
Mr Tim McCurdy MPDeputy Chair (until 20 March 2017)Member until 20 March 2017
Ovens Valley
Mr Luke O’Sullivan MLCMember from 22 March 2017
Northern Victoria
Mr Tim Richardson MPMordialloc
Mr Daniel Young MLCNorthern Victoria
Mr Bill Tilley MPMember from 28 May 2015 until 21 March 2017
Benambra
Mr Brad Battin MPMember until 27 May 2015
Gembrook
Former members

iv Environment, Natural Resources and Regional Development Committee
Committee secretariat
Staff
Dr Christopher Gribbin, Executive OfficerMs Annemarie Burt, Research OfficerMs Sarah Catherall, Administrative OfficerMr Kieran Crowe, Administrative Officer
Committee contact details
Address Environment, Natural Resources and Regional Development Committee Parliament of Victoria, Spring Street EAST MELBOURNE, VIC 3002
Phone 61 3 8682 2803
Email [email protected]
Web www.parliament.vic.gov.au/enrrdc
This report is available on the Committee’s website.

Inquiry into the sustainability and operational challenges of Victoria’s rural and regional councils v
Contents
PreliminariesCommittee functions iiCommittee membership iiiCommittee secretariat ivTerms of reference vii
Interim report 11 Background 1
2 The state of Victoria’s regional councils 1
3 The challenges facing regional councils 33.1 Higher costs than metropolitan councils 3
3.2 Less ability to raise revenue than metropolitan councils 4
4 Recent changes to council responsibilities 5
5 Recent changes to council funding 65.1 Decreases in grants 6
5.2 Increases in revenue from rates and charges 7
6 The impact of recent changes 8
7 How councils are responding to the situation 9
8 Suggested changes to grant programs and grant ratios 9
9 Other possible solutions 9
10 Reviewing the rating system 10
11 The final report 10


Inquiry into the sustainability and operational challenges of Victoria’s rural and regional councils vii
Terms of reference
Inquiry into the sustainability and operational challenges of Victoria’s rural and regional councils
Received from the Legislative Council on 6 May 2015:
To the Environment, Natural Resources and Regional Development Committee to inquire into, consider and report, no later than 31 March 2016*, on the sustainability and operational challenges of Victoria’s rural and regional councils, including but not limited to the following —
(a) local government funding and budgetary pressures;
(b) fairness, equity and adequacy of rating systems;
(c) impact of rate-capping policies;
(d) capacity for rural and regional councils to meet responsibilities for flood planning and preparation, and maintenance of flood mitigation infrastructure;
(e) maintenance of local road and bridge networks; and
(f) weed and pest animal control.
* The reporting date has been extended to 30 March 2018.


Inquiry into the sustainability and operational challenges of Victoria’s rural and regional councils 1
Interim report
1 Background
The Victorian Parliament asked the Environment, Natural Resources and Regional Development Committee to undertake this inquiry in May 2015. As the Committee was undertaking another inquiry at the time, the Committee did not begin taking evidence until the middle of 2016. Since then, the Committee has:
• received written submissions from 67 individuals and organisations
• undertaken a survey of all 48 regional councils in Victoria
• held public hearings with stakeholders in Melbourne, Traralgon, Wycheproof, Kerang, Shepparton, Bendigo and Colac
• gathered data from a number of sources, including the Victoria Grants Commission, Victorian Auditor-General’s Office and the Department of Environment, Land, Water and Planning.
This report provides an overview of the key issues that have emerged through this process. The Committee expects to table a final report, with more details and recommendations for changes, by the end of March 2018.
2 The state of Victoria’s regional councils
Regional Victoria is divided into 48 municipalities. These include large regional cities, remote rural areas and peri-urban areas. They vary from fewer than 3,000 residents to over 230,000 and from 13 km2 to over 22,000. There are considerable differences between regional councils with respect to socio-economic conditions. A key difference relates to population change – while regional cities and peri-urban municipalities have growing populations, some remote rural municipalities have relatively stable or declining populations.
Though there are some issues that affect regional councils as a whole, these variations mean that there are also important differences in the challenges faced by councils. There are also differences in the ways that councils have responded to these challenges.
Some councils are struggling financially. A report by Merv and Rohan Whelan on local council sustainability in 2010 identified 18 rural councils that are particularly struggling to be sustainable due to environmental factors beyond the councils’ control (see Figure 1). This report was brought to the Committee’s attention by a number of submitters and witnesses to the inquiry.

2 Environment, Natural Resources and Regional Development Committee
Interim report
Figure 1 Least sustainable councils identified in the Whelan Report
1
2 3 45
7
6
10
89
12
11
13
14
MetropolitanCouncils
15
17
1816
West WimmeraHindmarshYarriambiackBulokeGannawarraLoddon
123456
Northern GrampiansAraratPyreneesCentral GoldfieldsHepburnGolden Plains
789101112
StrathbogieMurrindindiMansfieldIndigoAlpineTowong
131415161718
Source: Environment, Natural Resources and Regional Development Committee, based on Merv & Rohan Whelan, Local Government Financial Sustainability: Abridged Report (2010), p.18
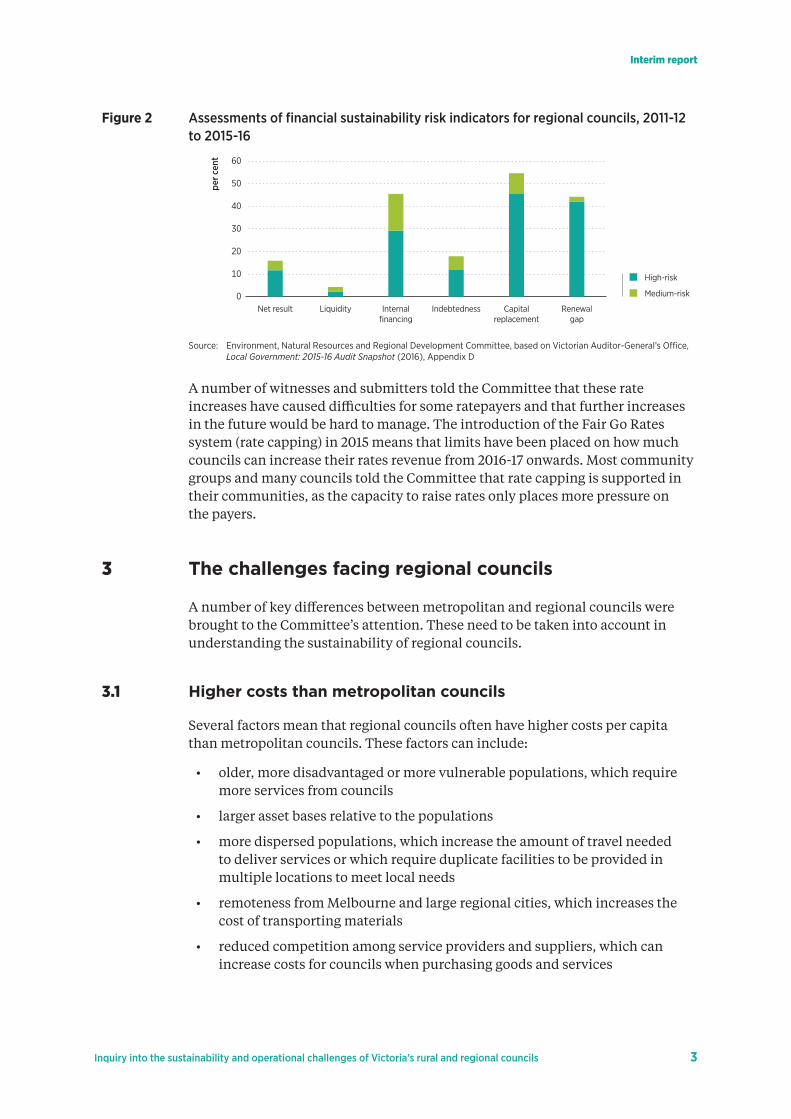
Each year, the Auditor-General releases a report on councils’ financial sustainability. The report looks at six indicators for each council. Between 2011-12 and 2015-16, the indicators for a number of regional councils were assessed as medium- or high-risk (see Figure 2). The most common areas which were assessed as medium- or high-risk were:
• internal financing (the ability for a council to finance expenditure on infrastructure from its cash flows)
• capital replacement (a comparison of expenditure on infrastructure with depreciation)
• renewal gap (a comparison of the expenditure on existing infrastructure with depreciation).
The Committee notes that these all relate to councils’ expenditure on infrastructure (see further discussion in Section 6 of this report).
At the same time as councils were struggling financially, prior to rate capping many regional councils raised rates considerably. Regional councils’ revenue from rates and charges increased from $1.1 to 1.6 billion between 2010-11 and 2015-16. This represents an average increase of 6.8 per cent per year. These increases have not been evenly spread, with revenue from rates and charges increasing by much higher amounts in some municipalities than others.
Inquiry into the sustainability and operational challenges of Victoria’s rural and regional councils 3
Interim report
Figure 2 Assessments of financial sustainability risk indicators for regional councils, 2011‑12 to 2015‑16
per c
ent
10
20
30
0
40
50
60
Net result Liquidity Internalfinancing
Indebtedness Capitalreplacement
Renewalgap
Medium-risk
High-risk
Source: Environment, Natural Resources and Regional Development Committee, based on Victorian Auditor‑General’s Office, Local Government: 2015‑16 Audit Snapshot (2016), Appendix D
A number of witnesses and submitters told the Committee that these rate increases have caused difficulties for some ratepayers and that further increases in the future would be hard to manage. The introduction of the Fair Go Rates system (rate capping) in 2015 means that limits have been placed on how much councils can increase their rates revenue from 2016-17 onwards. Most community groups and many councils told the Committee that rate capping is supported in their communities, as the capacity to raise rates only places more pressure on the payers.
3 The challenges facing regional councils
A number of key differences between metropolitan and regional councils were brought to the Committee’s attention. These need to be taken into account in understanding the sustainability of regional councils.
3.1 Higher costs than metropolitan councils
Several factors mean that regional councils often have higher costs per capita than metropolitan councils. These factors can include:
• older, more disadvantaged or more vulnerable populations, which require more services from councils
• larger asset bases relative to the populations
• more dispersed populations, which increase the amount of travel needed to deliver services or which require duplicate facilities to be provided in multiple locations to meet local needs
• remoteness from Melbourne and large regional cities, which increases the cost of transporting materials
• reduced competition among service providers and suppliers, which can increase costs for councils when purchasing goods and services
4 Environment, Natural Resources and Regional Development Committee
Interim report
• market failures in some services, such as child care, requiring councils to step in and deliver services that may not be required of a metropolitan council.
The size of the local road and bridge network relative to the population is a particularly significant factor. The maintenance of local roads and bridges is a substantial cost for many regional councils. For municipalities with large areas and small populations, it can be harder for councils to fund the required maintenance from rates and charges. Whereas metropolitan municipalities as a whole have 190 people per kilometre of local road, regional municipalities as a whole have only 14 people per kilometre. In some municipalities in north-western Victoria, there are fewer than 2 people per kilometre of local road.
Similar problems exist with other council responsibilities, such as roadside weed and pest animal control and the maintenance of flood mitigation infrastructure. These are also responsibilities where regional councils often have much larger burdens than metropolitan councils, despite having a smaller rate base from which to raise revenue.
3.2 Less ability to raise revenue than metropolitan councils
At the same time as having higher per capita costs than metropolitan councils, many regional councils have less capacity to raise their own revenue. Many metropolitan councils raise revenue through user fees for facilities, parking charges and development applications. These revenue sources are not significant options for many regional municipalities.
In addition, the more disadvantaged residents in some regional municipalities have less capacity to pay rates.
A number of remote municipalities are also experiencing population decline and are finding it a challenge to attract new businesses and residents to the area. This can put further pressure on the remaining population, can mean that councils have less access to revenue from businesses and can lead to social problems such as limited employment opportunities.
Given these factors, regional councils tend to be more reliant on grants from the State and Commonwealth Governments. Figure 3 compares the revenue sources for metropolitan councils as a whole to regional councils.
The reliance on grants is much higher in some regional municipalities, with grants accounting for more than 40 per cent of their revenue in some cases. This can make these councils particularly vulnerable to changes in the level of grant funding (see further discussion in Section 5.1 of this report).

Inquiry into the sustainability and operational challenges of Victoria’s rural and regional councils 5
Interim report
Figure 3 Sources of revenue for metropolitan and regional councils as a whole, 2015‑16
per c
ent
10
20
30
0
40
50
60
70
Rates and charges Fees and fines Grants Other
Regional councils
Metropolitan councils
Source: Environment, Natural Resources and Regional Development Committee, based on data supplied by councils to the Victoria Grants Commission, with some adjustments by the Committee
4 Recent changes to council responsibilities
Councils indicated to the Committee that there have been a number of changes to their responsibilities in recent years. Commonly cited examples include weed and pest animal management on roadsides (which became a council responsibility in 2013) and flood-mitigation infrastructure (for which responsibilities were adjusted in 2016).
Councils stated that there has also been cost shifting in recent years, where funding provided by State or Commonwealth Governments for services has reduced or stopped completely. Examples include libraries, school crossing supervisors and maternal and child health services. Some councils also noted cases where State or Commonwealth Governments had funded councils to deliver programs for fixed terms and then ceased funding. Some councils found that the community came to expect the service and that there was then pressure to continue delivering the service with the council covering the full cost.
A number of councils also noted a requirement in 2013 to top up a shortfall in the defined benefits superannuation scheme. The Committee was told that this had a considerable impact on some councils’ finances.
Some councils spoke of increasing compliance, enforcement and reporting standards imposed on them by other levels of government, which led to escalating costs. The Local Government Performance Reporting Framework (introduced from the 2014-15 reporting period) and increasing regulation relating to waste are examples of this, along with reforms to kindergartens in recent years.
On the other hand, the State Government’s decision in 2017 to provide additional funding to SES units has reduced the burden for local councils.
The Committee notes that quantifying the impact of these changes on local council finances will be important. This will help with understanding local council sustainability and assessing the extent to which decisions at the State and

6 Environment, Natural Resources and Regional Development Committee
Interim report
Commonwealth levels have affected councils’ finances. In some cases, the impact of these changes is difficult to calculate. The final report will look in more detail at the financial impact of these changes where possible.
5 Recent changes to council funding
The two main sources of funding for councils are rates and grants. Recent changes to grants programs have caused difficulties for some councils. The introduction of the Fair Go Rates system (rate capping) from 2016-17 has also limited councils’ capacity to raise additional revenue through rates.
5.1 Decreases in grants
A key source of revenue, especially for rural councils, is the Commonwealth’s Financial Assistance Grant program. Financial Assistance Grants are general-purpose grants for councils, which are distributed to all councils, but with more disadvantaged councils receiving higher per-capita rates.
However, from 2014-15, the Commonwealth Government stopped indexing these grants for three years, meaning that the grants decreased in real terms. Indexing began again in 2017-18 but continued from the frozen rate, without any adjustment for inflation between 2014 and 2017. Councils therefore noted that they remain worse-off with respect to this program than they were before 2014.
Additional funding for roads and bridges was made available through increases in the Commonwealth Government’s Roads to Recovery Program from 2015-16. However, some councils have expressed concern about the fact that the current funding level for the Roads to Recovery Program is not expected to continue.
The State Government’s Country Roads and Bridges Program, which provided $1 million per year to 40 rural councils, was discontinued in 2015. New funding programs commenced to partly compensate for this change.
Overall, the total amount of grants revenue received by regional councils has generally decreased in recent years, when inflation and population growth are taken into account (see Figure 4). This is partly a result of larger-than-usual grants being received in 2011-12 and 2012-13 for natural disaster relief following the floods in 2010-11 and partly due to decisions by other levels of government.
A number of councils also noted the benefits of regular, predictable grants. These were considered important to assist councils with future planning.

Inquiry into the sustainability and operational challenges of Victoria’s rural and regional councils 7
Interim report
Figure 4 Total grants revenue and revenue from rates and charges for regional Victoria
$ re
al p
er p
erso
n
200
400
600
0
800
1,000
1,200
Adjusted grants(a)
Rates and charges
2010-11 2011-12 2012-13 2013-14 2014-15 2015-16
(a) The value of grants has been adjusted to recognise Financial Assistance Grants in the year for which they were intended, even if they were paid in a different year.
Sources: Environment, Natural Resources and Regional Development Committee, based on grants data supplied by councils to the Victoria Grants Commission, with some adjustments by the Committee; population data from the Australian Bureau of Statistics; values in 2014‑15 dollars, using price deflator from the Department of Treasury and Finance
5.2 Increases in revenue from rates and charges
As can also be seen from Figure 4, regional councils have increased their revenue from rates and charges at the same time as grants revenue has decreased. Rates and charges across regional Victoria as a whole rose by an average of 6.8 per cent per year between 2010-11 and 2015-16 (or 3.7 per cent when adjusted for inflation and population growth). Part of this is explained by increasing land value. However, it has also been caused by councils’ decisions to increase rates in many cases – 38 of the 48 regional councils increased both their lowest and highest rates between 2011-12 and 2015-16.
The Committee notes that these figures reflect regional councils as a whole. There are significant differences between individual councils – the changes to grants programs have affected some municipalities more than others and some councils have increased rates charges by much larger amounts than other councils. The final report for this inquiry will discuss some of these variations in more detail.
Where rate increases have occurred, this has been a concern for some members of the community. Some councils have also acknowledged that their ratepayers have limited capacity to manage further rate increases.
The Fair Go Rates system (rate capping) was introduced in 2015. This restricts increases in the average value of rates that a council can charge unless the council is granted a variation. Increases in average rates have been capped at 2.5 per cent for 2016-17 and 2.0 per cent for 2017-18. The increases in rates seen in recent years therefore cannot continue.
The Committee has received mixed views on rate capping. While some stakeholders have welcomed it, some considered that it should be left to councils to decide or that a ‘one size fits all’ approach fails to recognise the diversity of local councils. Some councils argued that the rate caps have been set at inappropriate levels because they have been based on consumer price index

8 Environment, Natural Resources and Regional Development Committee
Interim report
forecasts, which are lower than inflation for some key functions (such as road construction and maintenance). This would effectively make the rate cap a funding cut in real terms.
The Committee notes that issues associated with the Fair Go Rates system are being investigated in more detail by the Parliament’s Environment and Planning Committee.
6 The impact of recent changes
A number of councils expressed concern about their ability to be financially sustainable in these circumstances. These councils argued that the increases in responsibility and reductions in funding meant that they would be unable to deliver the required services and maintain or build the infrastructure required by their communities.
Some of the key potential impacts identified by councils include:
• reductions in service levels or the discontinuation of certain services
• increased debt
• progressive deterioration in the quality and condition of assets (such as roads, bridges and community facilities).
A decrease in councils’ asset investment in recent years can be seen by comparing the level of asset investment to depreciation (an estimate of the amount of money required to maintain the asset base). Figure 5 compares these figures for regional councils as a whole. A result below 1 indicates that asset investment is less than depreciation. Although regional councils as a whole are above 1, some individual councils are spending less than depreciation and the capital replacement ratio as a whole is declining.
Figure 5 Asset investment compared to depreciation, regional councils as a whole
ratio
0.5
1.0
1.5
0
2.0
2010-11 2011-12 2012-13 2013-14 2014-15 2015-16
Source: Environment, Natural Resources and Regional Development Committee, based on data supplied by councils to the Victoria Grants Commission, with some adjustments by the Committee
As noted in Section 2 of this report, assessments by the Auditor-General have indicated concerns with respect to infrastructure investment by some regional councils.

Inquiry into the sustainability and operational challenges of Victoria’s rural and regional councils 9
Interim report
7 How councils are responding to the situation
A number of councils have taken actions to adapt to the changes in funding and responsibility. Approaches that have been implemented include:
• seeking efficiencies in their operations (for example, restructuring staff or consolidating service centres)
• exploring shared service arrangements with neighbouring councils (such as sharing resources or joint procurement) to achieve savings
• focusing on core services and ceasing discretionary services
• reducing their responsibilities by closing facilities in some towns or decommissioning roads.
Measures such as these have the potential to provide some savings. However, concerns were raised about how much can be saved through such approaches. Some considered that it is not possible to find sufficient savings in these ways to make all councils sustainable.
8 Suggested changes to grant programs and grant ratios
There were calls for increased grants for regional councils, from either the State or Commonwealth Government. Alternatively, it was suggested that changes be made to the way Financial Assistance Grants are distributed so that regional councils get a larger share and some metropolitan councils with access to large amounts of revenue from their own sources get less.
A number of councils emphasised the importance of grants being regular and predictable, to assist with council planning. Some councils also argued for more grants to be given without competitive processes. They argued that competitive grant allocation processes advantage larger municipalities with more staff to prepare grant applications.
Grants where councils are expected to partially fund a program or project, with State or Commonwealth Governments matching that funding, were also noted as difficult for some regional councils. It was suggested that funding ratios be higher for some regional councils than others or for regional municipalities compared to metropolitan councils.
9 Other possible solutions
A variety of other solutions to improve regional councils’ financial sustainability were also suggested to the Committee by councils and others.
Some councils argued that other levels of government would be better placed to take responsibility for certain services. Roadside weed and pest animal management and floodplain management strategies were cited as examples of responsibilities that could be removed from councils and thereby reduce pressure on council budgets.

10 Environment, Natural Resources and Regional Development Committee
Interim report
Some submitters and witnesses believed that there was potential for further savings to be made by councils through organisational changes. It was argued that staff salaries or staff numbers could be reduced. Some people called for the range of services offered by councils to be reduced, with councils only focusing on core responsibilities.
The prospect of amalgamations was discussed a number of times, though there was a general view that these are unlikely to resolve the problems.
Some argued that many people are unaware of how many services councils provide or how much subsidies councils provide for some services or facilities. It was suggested that making people more aware of these things would increase people’s willingness to pay for them. User charges without subsidies or where the subsidies are clearly stated were suggested as ways of helping people to understand the cost of delivering services.
10 Reviewing the rating system
Underpinning many of these issues was the fact that rates and charges are the largest source of revenue for Victorian councils. Rates and charges are also the only significant source of revenue that councils can directly control in many regional municipalities.
Overall, councils have adopted a variety of rating strategies, with some providing lower rates for particular groups. The rate in the dollar charged by councils also varies considerably from one municipality to another. Two groups in particular argued that the rating system was unfair for them:
• some farmers considered that they carried an unreasonable proportion of the rate burden, as their rate bills are based on the value of their land, which is not a reliable indicator of their income and capacity to pay
• some retirement village residents advocated for a reduction in their rates, arguing that they pay for a number of the services that councils would normally provide (such as road maintenance and street lighting) as part of their payments to the retirement village and that paying full rates effectively means that they have to pay for services twice.
Some participants in this inquiry believed that rates are an out-dated and inappropriate way to raise revenue and advocated for major changes in the way that councils are funded.
11 The final report
The Committee’s final report on this inquiry will explore the above issues in further detail. It will also explore some of the variations between councils within regional Victoria. The final report will include a number of recommendations designed to improve the situation for Victoria’s rural and regional councils.