INPEX CORPORATION Financial Results - IR Webcasting · INPEX CORPORATION Financial Results ......
26
INPEX CORPORATION Financial Results for the Six Months ended September 30, 2016 November 14, 2016
Transcript of INPEX CORPORATION Financial Results - IR Webcasting · INPEX CORPORATION Financial Results ......
INPEX CORPORATION
Financial Resultsfor the Six Months ended September 30, 2016November 14, 2016

1
Agenda
1. Corporate OverviewToshiaki Kitamura
Representative Director, President & CEO
2. Financial Results for the six months ended September 30, 2016
Masahiro MurayamaDirector, Senior Managing Executive OfficerSenior Vice President, Finance & Accounting
2
Cautionary Statement
This presentation includes forward‐looking information that reflects the plans and expectations of the Company. Such forward‐looking information is based on the current assumptions and judgments of the Company in light of the information currently available to it, and involves known and unknown risks, uncertainties, and other factors. Such risks, uncertainties and other factors may cause the Company’s performance, achievements or financial position to be materially different from any future results, performance, achievements or financial position expressed or implied by such forward‐looking information. Such risks, uncertainties and other factors include, without limitation: Price volatility and change in demand in crude oil and natural gas Foreign exchange rate volatility Change in costs and other expenses pertaining to exploration, development and production
The Company undertakes no obligation to publicly update or revise the disclosure of information in this presentation (including forward‐looking information) after the date of this presentation.

Corporate Overview
Toshiaki KitamuraRepresentative Director, President & CEO
4
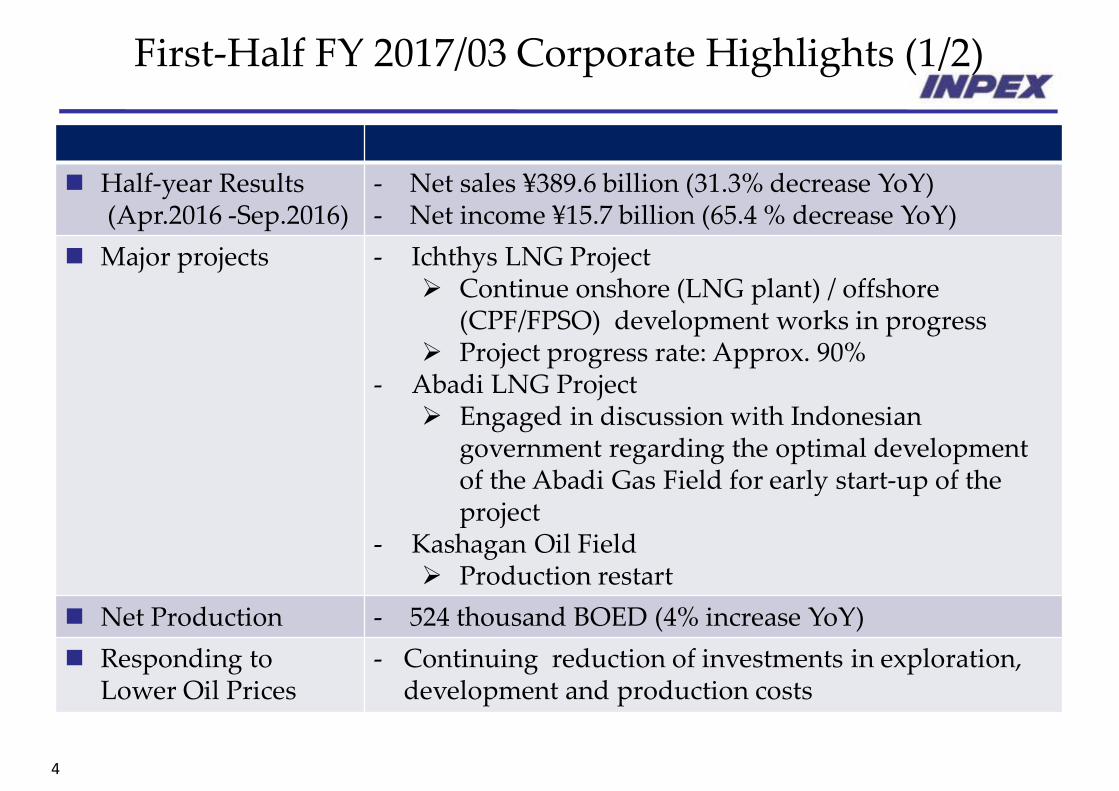
First‐Half FY 2017/03 Corporate Highlights (1/2)
Half‐year Results (Apr.2016 ‐Sep.2016)
‐ Net sales ¥389.6 billion (31.3% decrease YoY)‐ Net income ¥15.7 billion (65.4 % decrease YoY)
Major projects ‐ Ichthys LNG Project Continue onshore (LNG plant) / offshore
(CPF/FPSO) development works in progress Project progress rate: Approx. 90%
‐ Abadi LNG Project Engaged in discussion with Indonesian
government regarding the optimal development of the Abadi Gas Field for early start‐up of the project
‐ Kashagan Oil Field Production restart
Net Production ‐ 524 thousand BOED (4% increase YoY) Responding to
Lower Oil Prices‐ Continuing reduction of investments in exploration,
development and production costs

5
Continuous Enhancement of E&P Activities
Commenced exploratory drilling offshore Shimane and Yamaguchi Prefectures, Japan (June)
Reached final investment decision to expand Tangguh LNG facility, Indonesia (July)
Strengthening Gas Supply Chain Commenced partial (July) and full operations (October) of Toyama Line,
Japan Agreed to sales contracts with three additional city gas companies based on
Heads of Agreement with Chubu Electric on joint business operation to supply electricity (September)
Reinforcement of Renewable Energy Initiatives Commenced drilling survey in Fukushima Prefecture for geothermal energy
development (June) Progress on the Sarulla Geothermal Independent Power Producer Project for
commercial operations, Indonesia
First‐Half FY 2017/03 Corporate Highlights (2/2)
Note: Months in parentheses indicate timing of press release.

6
Ichthys LNG Project (1/3)
Proved reserves: Approx. 930 million BOE (Based on INPEX’s participating interest of 62.245%) Production capacity :
‐Approx. 8.9 million t/y of LNG ‐Approx. 1.6 million t/y of LPG‐Approx. 100,000 bbl/d of condensate (at peak)
Participating interest:INPEX 62.245%, TOTAL 30.000%, Tokyo Gas 1.575%, Osaka Gas 1.200%, JERA 0.735%, Toho Gas 0.420%, CPC 2.625%, Kansai Electric Power 1.200%
FID in January 2012 Project progress rate : Approx. 90%
■ Announcement in September 2015 Production start: End December 2016 → 3rd quarter of 2017 CAPEX : Approx. 10% increase LNG production capacity : Approx.8.4 million t/y →Approx. 8.9 million t/y
(approx. 6% increase)
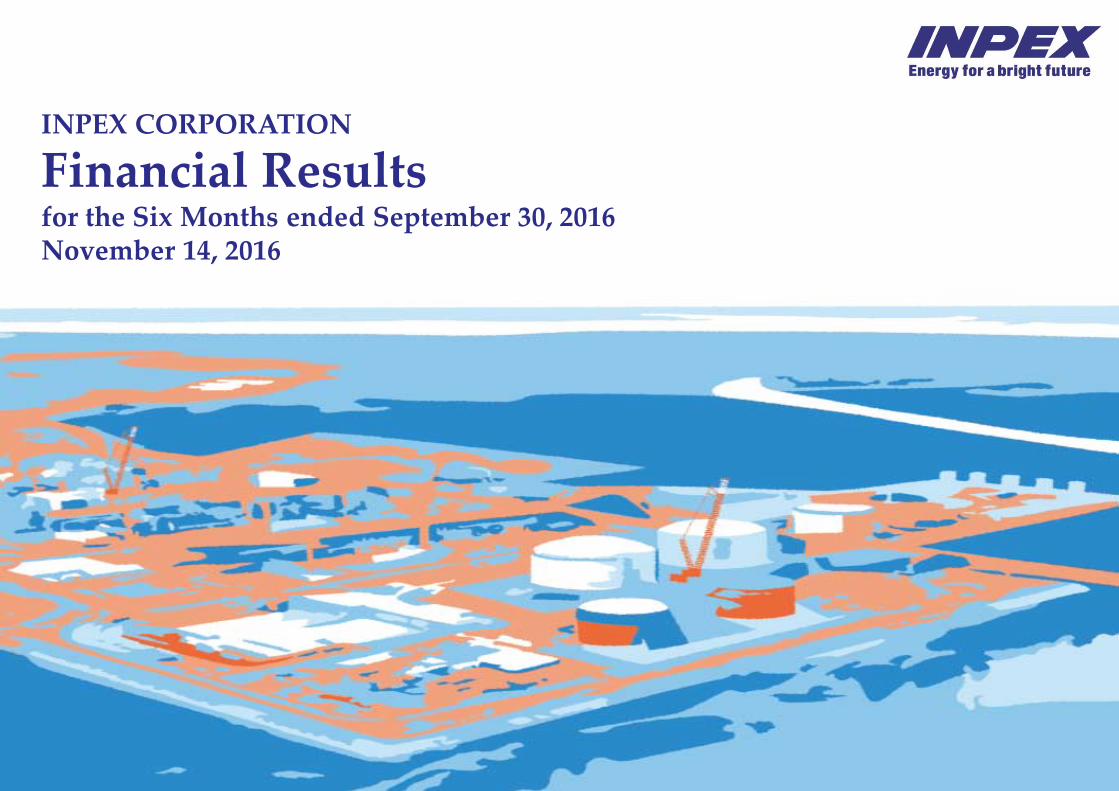
Completion of off‐loading of the final onshore module (Aug/2016)
Construction of LNG train(Aug./2016)
7
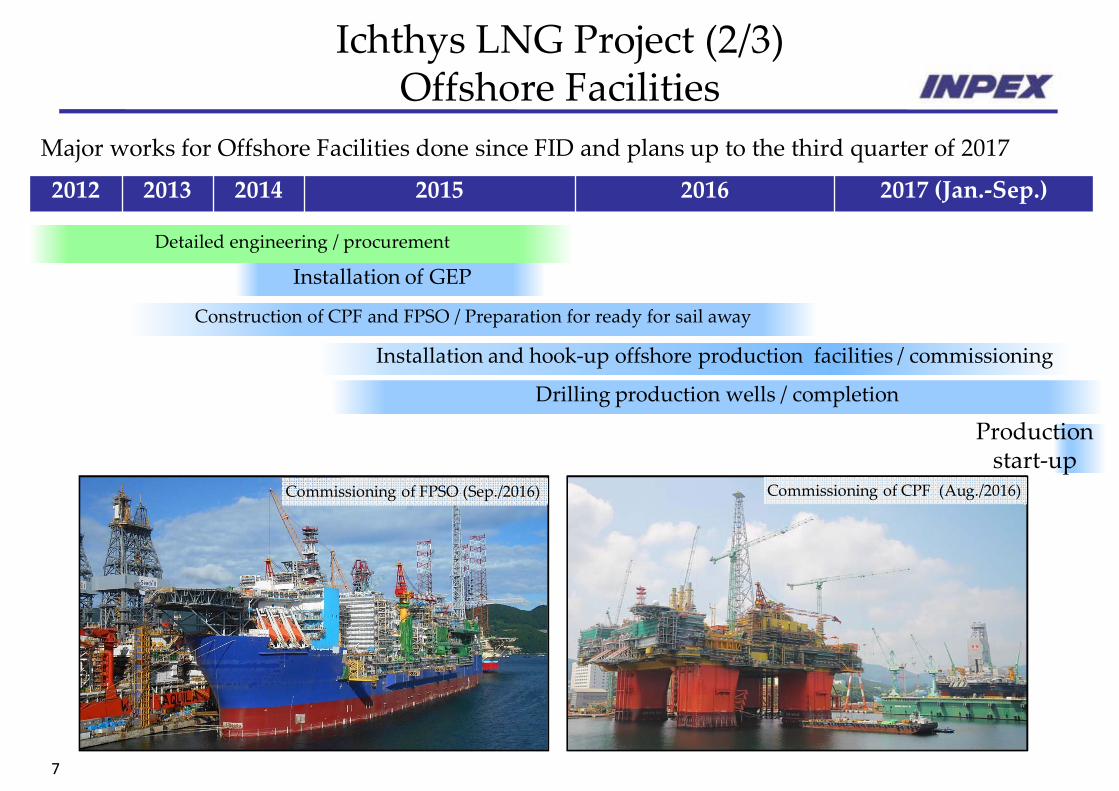
Ichthys LNG Project (2/3)Offshore Facilities
Major works for Offshore Facilities done since FID and plans up to the third quarter of 2017
2012 2013 2014 2015 2016 2017 (Jan.‐Sep.)
Detailed engineering / procurement
Construction of CPF and FPSO / Preparation for ready for sail away
Installation of GEP
Drilling production wells / completion
Installation and hook‐up offshore production facilities / commissioning
Production start‐up
Commissioning of CPF (Aug./2016)Commissioning of FPSO (Sep./2016)
8
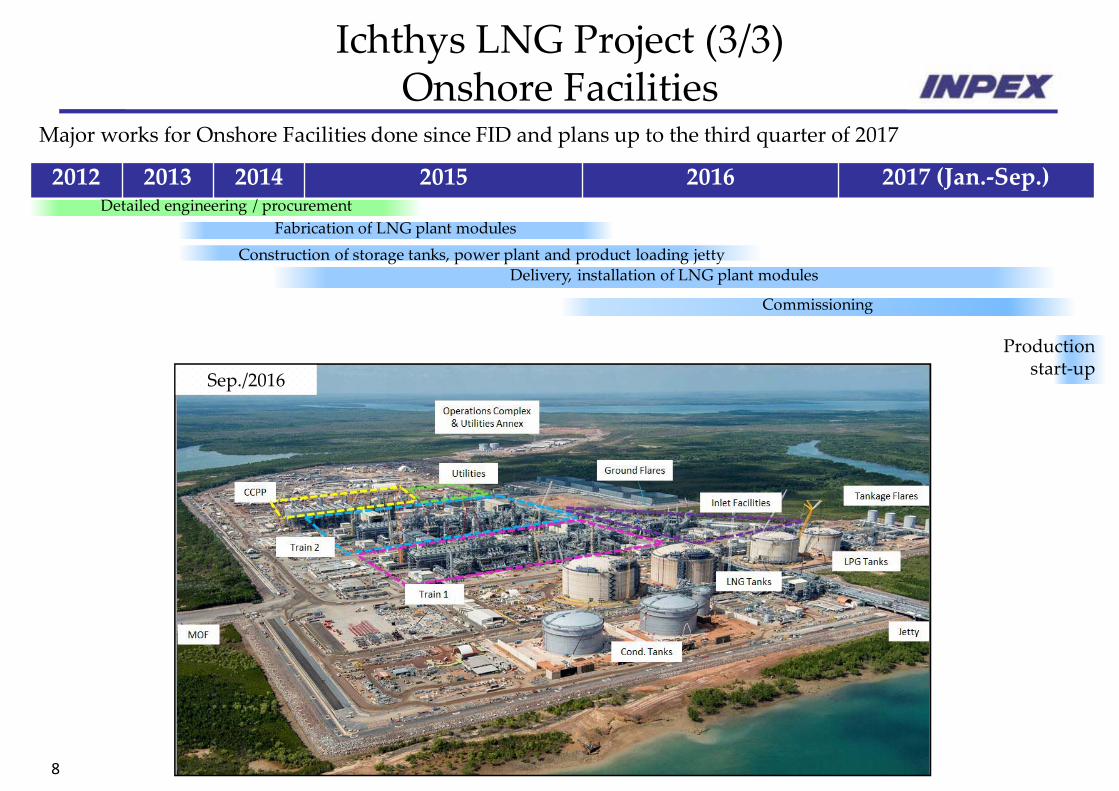
2012 2013 2014 2015 2016 2017 (Jan.‐Sep.)
Production start‐up
Ichthys LNG Project (3/3)Onshore Facilities
Major works for Onshore Facilities done since FID and plans up to the third quarter of 2017
Delivery, installation of LNG plant modules
Fabrication of LNG plant modulesDetailed engineering / procurement
Commissioning
Construction of storage tanks, power plant and product loading jetty
Sep./2016

9
Abadi LNG Project
Location of Masela Block Abadi gas field (image)
Received the notice from Indonesian government instructing to re‐propose a plan of development based on onshore LNG for the project in April 2016
Engaged in discussion with Indonesian government regarding the optimal development of the Abadi Gas Field for early start‐up of the project

10
In July 2016, announced final investment decision to add a third LNG process train (Train 3)
Commencement of production expected in 2020 3.8 million tons per annum (mtpa) of additional
production capacity• 75% of LNG to be sold to the state electricity
company PT.PLN • 25% of LNG to be sold to Kansai Electric Power
海上生産施設
海上生産施設
Commenced dispatch of crude oil in October 2016 following production restart
To increase production capacity to a target level of approx. 370,000 bbl/d over the next year
One of the worldʹs largest oil fields with estimated oil in place of some 35 billion barrels
Indonesia: Tangguh LNG Project
「さやえんどう」型の船型(イメージ))
Progress of major upstream business
Kazakhstan: Kashagan Oil Field

11
Strengthening Gas Supply Chain &Reinforcement of Renewable Energy Initiatives
Indonesia: Sarulla Geothermal Independent Power Producer (IPP) Project Power plant with maximum capacity
of 330MW, the world’s largest single‐contract geothermal power project
Expected to initiate commercial operations in FY2016, targeting phased ramp‐up with 2nd and 3rdplants
Domestic natural gas business Geothermal power generation business
Sarulla Geothermal IPP Project
Toyama Line completed in June 2016 Commenced supply of natural gas to Nissan
Chemical Industries in July 2016 Commenced supply of natural gas to Nihonkai
Gas in October 2016 Natural Gas Sales
FY 2016/03: approx. 1,750 million m3* FY 2017/03(estimated): approx. 1,930 million m3*
*1m3 =41.8605MJ
12
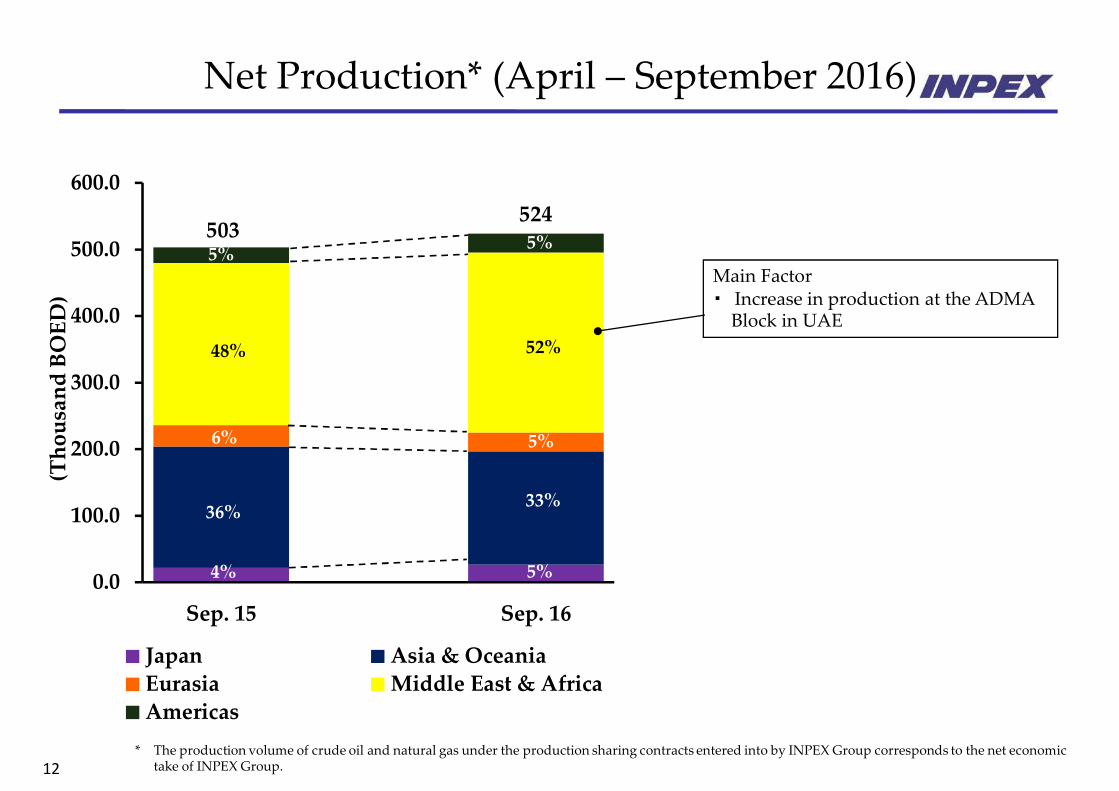
Net Production* (April – September 2016)
503524
0.0
100.0
200.0
300.0
400.0
500.0
600.0
Sep. 15 Sep. 16
(ThousandBOED)
Japan Asia & OceaniaEurasia Middle East & AfricaAmericas
5%
52%
5%
5%
33%
6%
48%
5%
4%
36%
* The production volume of crude oil and natural gas under the production sharing contracts entered into by INPEX Group corresponds to the net economic take of INPEX Group.
Main Factor・ Increase in production at the ADMA Block in UAE
13
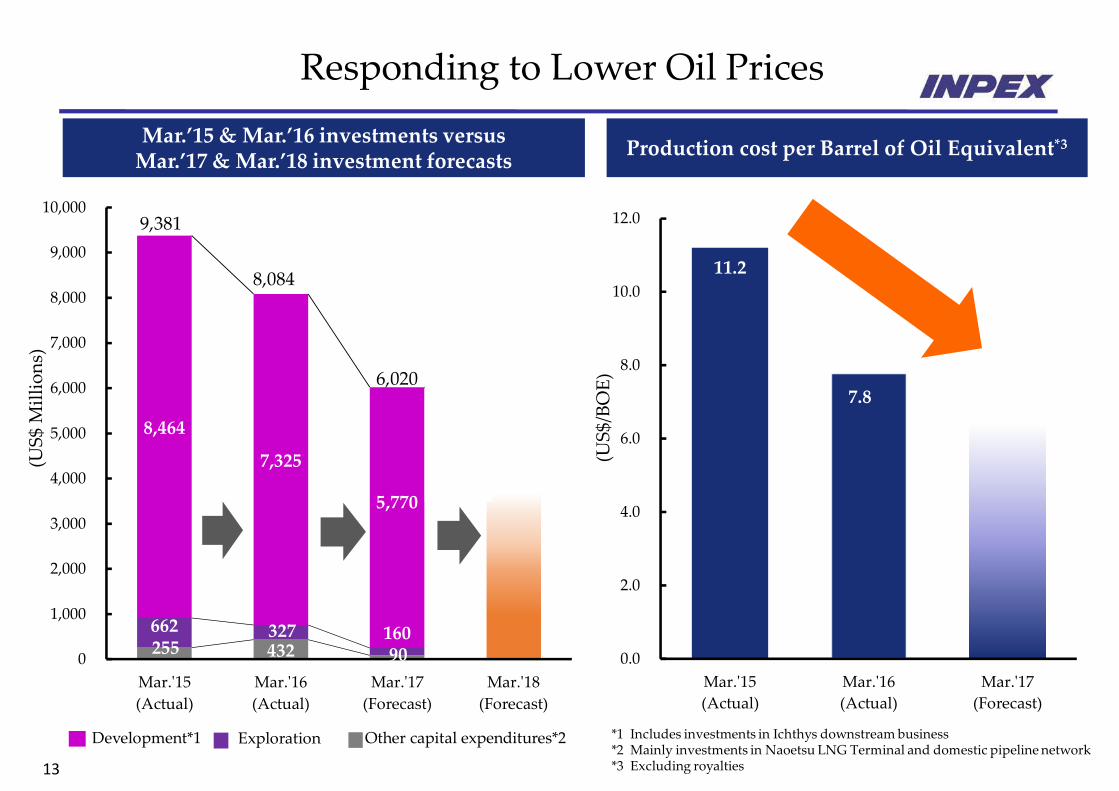
255 432 90 662 327 160
8,464
7,325
5,770
0
1,000
2,000
3,000
4,000
5,000
6,000
7,000
8,000
9,000
10,000
Mar.ʹ15(Actual)
Mar.ʹ16(Actual)
Mar.ʹ17(Forecast)
Mar.ʹ18(Forecast)
(US$ M
illions)
Mar.’15 & Mar.’16 investments versus Mar.’17 & Mar.’18 investment forecasts
Responding to Lower Oil Prices
Production cost per Barrel of Oil Equivalent*3
Development*1 Other capital expenditures*2Exploration *1 Includes investments in Ichthys downstream business*2 Mainly investments in Naoetsu LNG Terminal and domestic pipeline network*3 Excluding royalties
11.2
0.0
2.0
4.0
6.0
8.0
10.0
12.0
Mar.ʹ15(Actual)
Mar.ʹ16(Actual)
Mar.ʹ17(Forecast)
7.8
(US$/BOE)
9,381
8,084
6,020

Masahiro MurayamaDirector, Senior Managing Executive OfficerSenior Vice President, Finance & Accounting
Financial Results for the six months endedSeptember 30, 2016
15
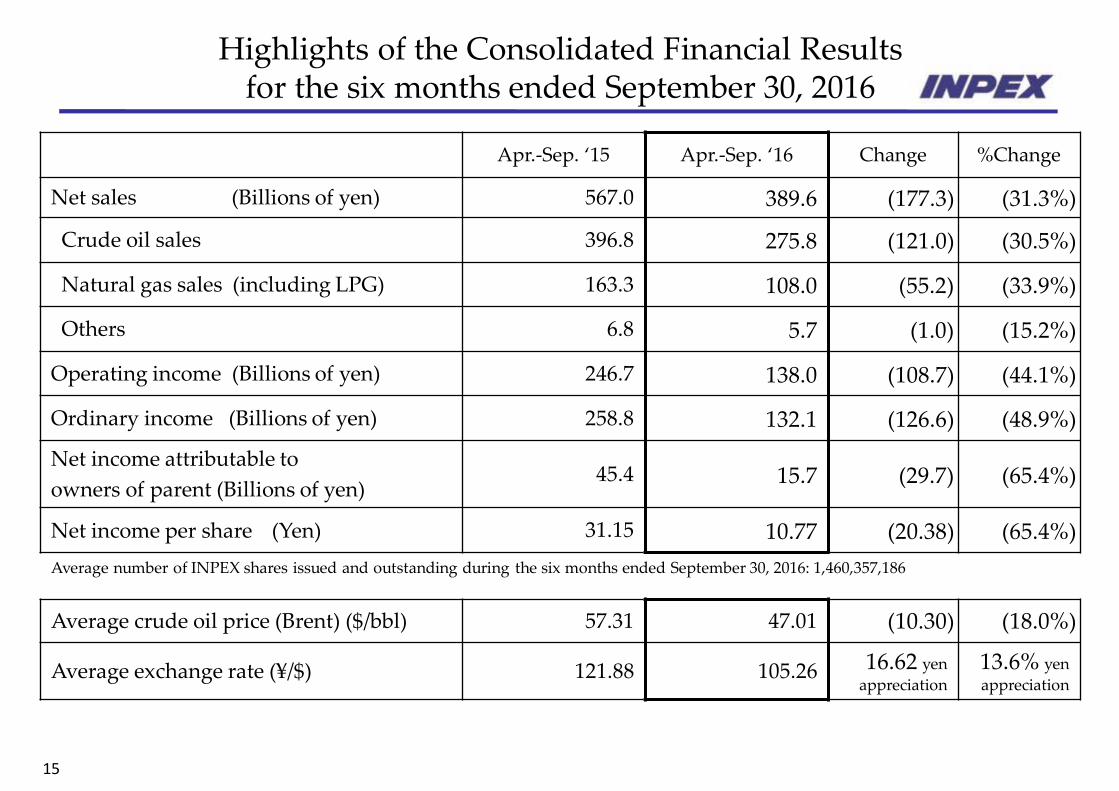
Highlights of the Consolidated Financial Resultsfor the six months ended September 30, 2016
Apr.‐Sep. ‘15 Apr.‐Sep. ‘16 Change %Change
Net sales (Billions of yen) 567.0 389.6 (177.3) (31.3%)
Crude oil sales 396.8 275.8 (121.0) (30.5%)
Natural gas sales (including LPG) 163.3 108.0 (55.2) (33.9%)
Others 6.8 5.7 (1.0) (15.2%)
Operating income (Billions of yen) 246.7 138.0 (108.7) (44.1%)
Ordinary income (Billions of yen) 258.8 132.1 (126.6) (48.9%)
Net income attributable to owners of parent (Billions of yen)
45.4 15.7 (29.7) (65.4%)
Net income per share (Yen) 31.15 10.77 (20.38) (65.4%) Average number of INPEX shares issued and outstanding during the six months ended September 30, 2016: 1,460,357,186
Average crude oil price (Brent) ($/bbl) 57.31 47.01 (10.30) (18.0%)
Average exchange rate (¥/$) 121.88 105.26 16.62 yenappreciation
13.6% yen appreciation
16
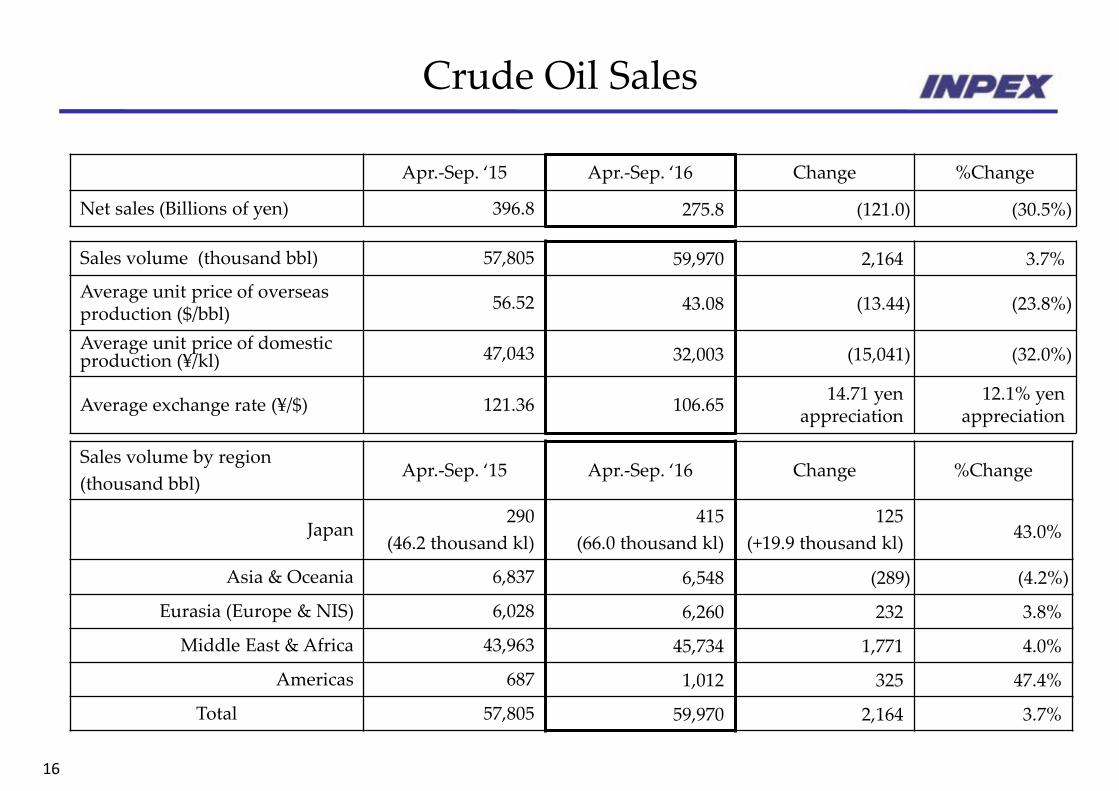
Crude Oil Sales
Sales volume (thousand bbl) 57,805 59,970 2,164 3.7%
Average unit price of overseas production ($/bbl) 56.52 43.08 (13.44) (23.8%)
Average unit price of domestic production (¥/kl) 47,043 32,003 (15,041) (32.0%)
Average exchange rate (¥/$) 121.36 106.65 14.71 yen appreciation
12.1% yen appreciation
Apr.‐Sep. ‘15 Apr.‐Sep. ‘16 Change %Change
Net sales (Billions of yen) 396.8 275.8 (121.0) (30.5%)
Sales volume by region (thousand bbl)
Apr.‐Sep. ‘15 Apr.‐Sep. ‘16 Change %Change
Japan290
(46.2 thousand kl)415
(66.0 thousand kl)125
(+19.9 thousand kl) 43.0%
Asia & Oceania 6,837 6,548 (289) (4.2%)
Eurasia (Europe & NIS) 6,028 6,260 232 3.8%
Middle East & Africa 43,963 45,734 1,771 4.0%
Americas 687 1,012 325 47.4%
Total 57,805 59,970 2,164 3.7%

17
Natural Gas Sales (excluding LPG)
Sales volume (million cf) 160,634 165,837 5,204 3.2%
Average unit price of overseas production ($/thousand cf) 7.23 4.83 (2.40) (33.2%)
Average unit price of domestic sales (¥/m3) 54.72 43.88 (10.84) (19.8%)
Average exchange rate (¥/$) 121.23 105.87 15.36 yen appreciation
12.7% yen appreciation
Apr.‐Sep. ‘15 Apr.‐Sep. ‘16 Change %Change
Net sales (Billions of yen) 157.7 104.3 (53.3) (33.8%)
Sales volume by region (million cf) Apr.‐Sep. ‘15 Apr.‐Sep. ‘16 Change %Change
Japan28,725
(770 million m3*)29,523
(791 million m3*)798
(+21 million m3*)2.8%
Asia & Oceania 114,556 118,646 4,090 3.6%
Eurasia (Europe & NIS) ‐ ‐ ‐ ‐
Middle East & Africa ‐ ‐ ‐ ‐
Americas 17,353 17,668 315 1.8%
Total 160,634 165,837 5,204 3.2% (FYI) LPG Sales
Apr.‐Sep. ‘15 Apr.‐Sep. ‘16 Change %Change
Net sales (Billions of yen) 5.5 3.6 (1.9) (34.7%)
*1m3=41.8605MJ
18
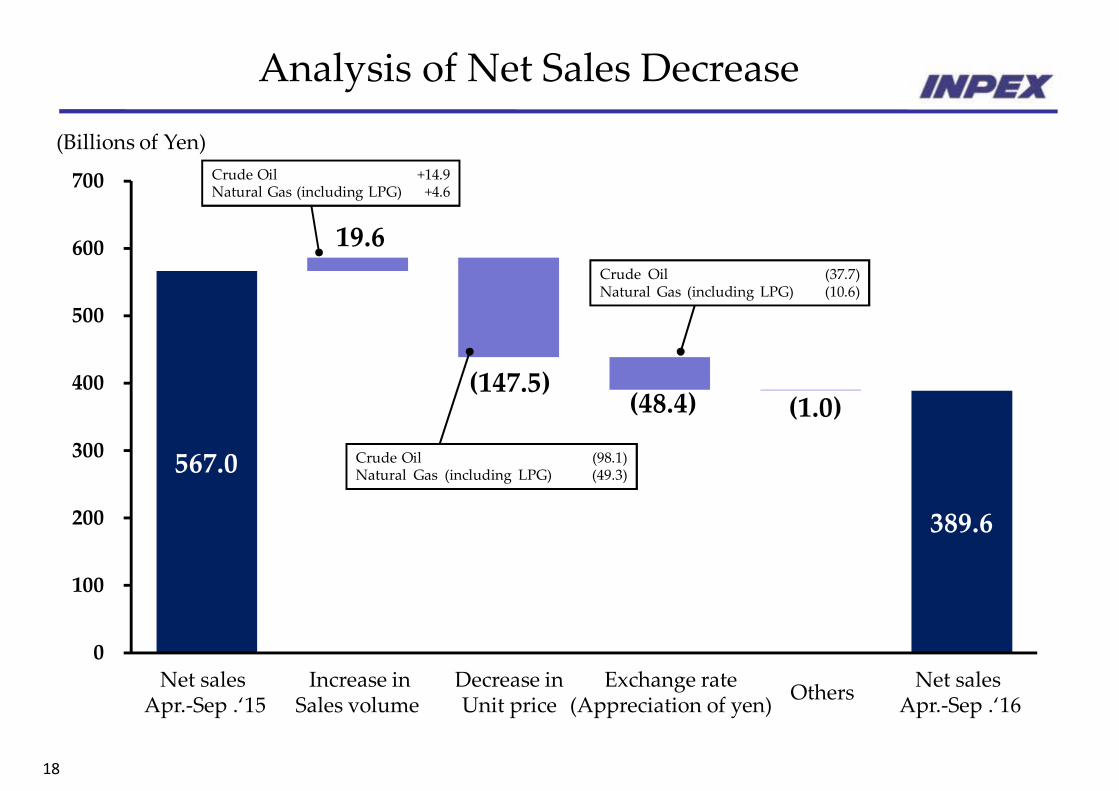
Analysis of Net Sales Decrease
567.0
19.6
(147.5)(48.4) (1.0)
389.6
0
100
200
300
400
500
600
700
(Billions of Yen)
Net salesApr.‐Sep .‘15
Increase inSales volume
Decrease inUnit price
Exchange rate(Appreciation of yen) Others Net sales
Apr.‐Sep .‘16
Crude Oil +14.9Natural Gas (including LPG) +4.6
Crude Oil (98.1)Natural Gas (including LPG) (49.3)
Crude Oil (37.7)Natural Gas (including LPG) (10.6)
19
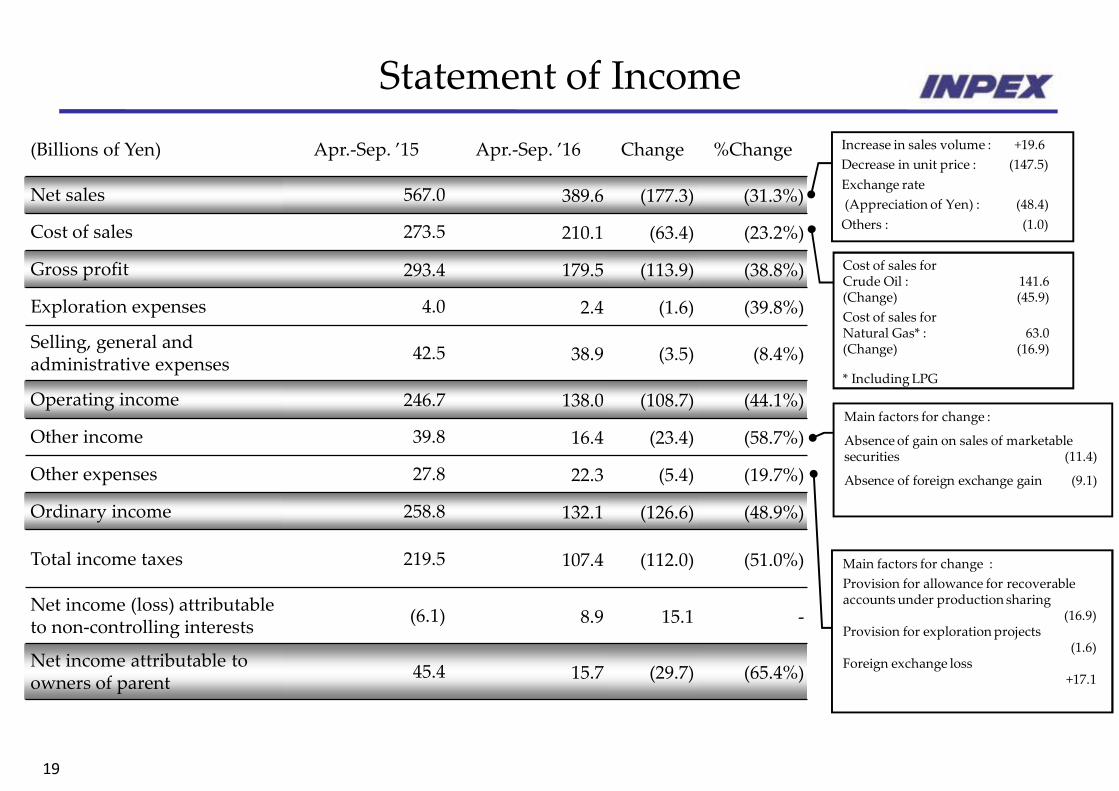
Statement of Income(Billions of Yen) Apr.‐Sep. ’15 Apr.‐Sep. ’16 Change %Change
Net sales 567.0 389.6 (177.3) (31.3%)
Cost of sales 273.5 210.1 (63.4) (23.2%)
Gross profit 293.4 179.5 (113.9) (38.8%)
Exploration expenses 4.0 2.4 (1.6) (39.8%)
Selling, general and administrative expenses 42.5 38.9 (3.5) (8.4%)
Operating income 246.7 138.0 (108.7) (44.1%)
Other income 39.8 16.4 (23.4) (58.7%)
Other expenses 27.8 22.3 (5.4) (19.7%)
Ordinary income 258.8 132.1 (126.6) (48.9%)
Total income taxes 219.5 107.4 (112.0) (51.0%)
Net income (loss) attributable to non‐controlling interests (6.1) 8.9 15.1 ‐
Net income attributable to owners of parent 45.4 15.7 (29.7) (65.4%)
Cost of sales for Crude Oil : 141.6(Change) (45.9)Cost of sales forNatural Gas* : 63.0(Change) (16.9)
* Including LPG
Increase in sales volume : +19.6Decrease in unit price : (147.5)Exchange rate(Appreciation of Yen) : (48.4)Others : (1.0)
Main factors for change :
Absence of gain on sales of marketable securities (11.4)
Absence of foreign exchange gain (9.1)
Main factors for change :Provision for allowance for recoverable accounts under production sharing
(16.9)Provision for exploration projects
(1.6)Foreign exchange loss
+17.1
20
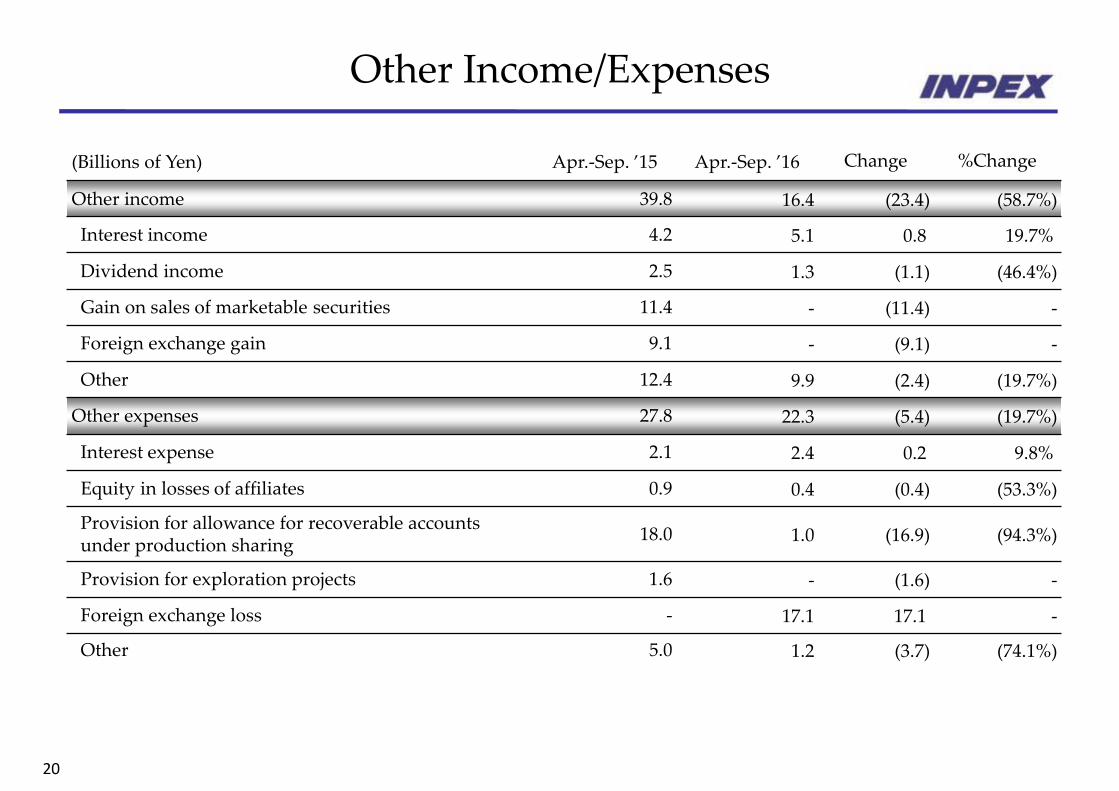
Other Income/Expenses
(Billions of Yen) Apr.‐Sep. ’15 Apr.‐Sep. ’16 Change %Change
Other income 39.8 16.4 (23.4) (58.7%)
Interest income 4.2 5.1 0.8 19.7%
Dividend income 2.5 1.3 (1.1) (46.4%)
Gain on sales of marketable securities 11.4 ‐ (11.4) ‐
Foreign exchange gain 9.1 ‐ (9.1) ‐
Other 12.4 9.9 (2.4) (19.7%)
Other expenses 27.8 22.3 (5.4) (19.7%)
Interest expense 2.1 2.4 0.2 9.8%
Equity in losses of affiliates 0.9 0.4 (0.4) (53.3%)
Provision for allowance for recoverable accounts under production sharing 18.0 1.0 (16.9) (94.3%)
Provision for exploration projects 1.6 ‐ (1.6) ‐
Foreign exchange loss ‐ 17.1 17.1 ‐
Other 5.0 1.2 (3.7) (74.1%)
21
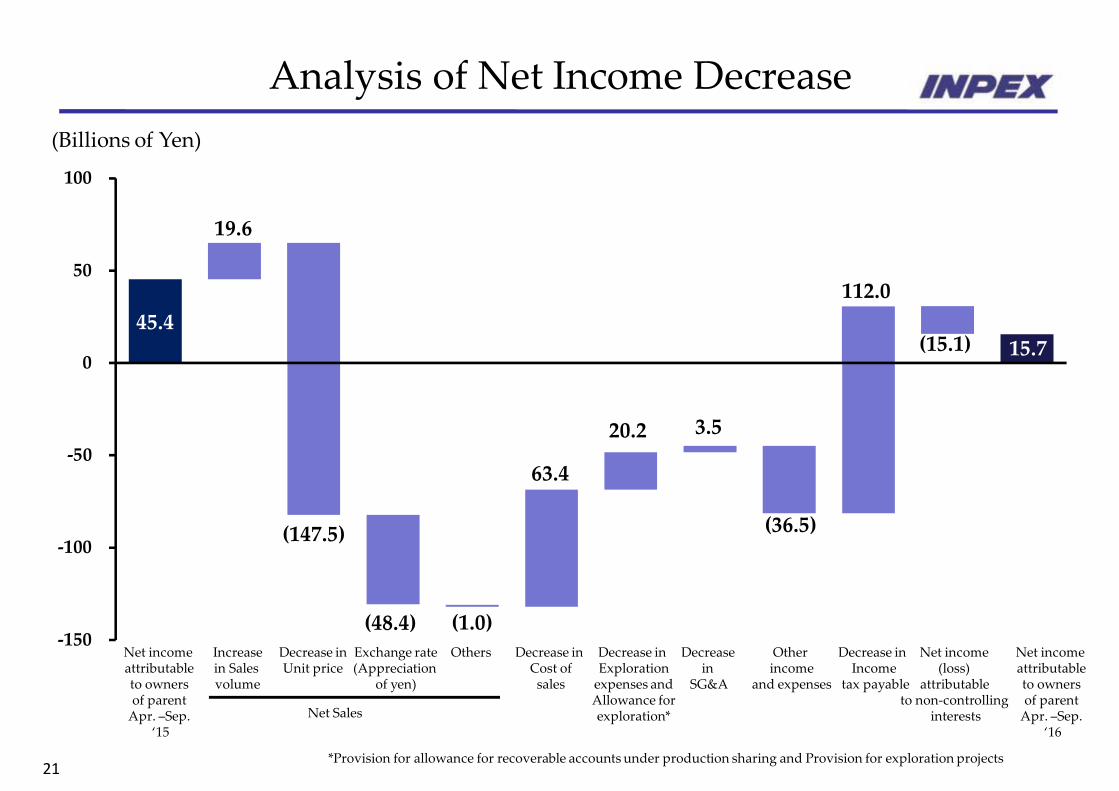
45.4
19.6
(48.4) (1.0)
63.4
20.2 3.5
(36.5)
112.0
15.7
(147.5)
(15.1)
‐150
‐100
‐50
0
50
100
(億円)(億円)
Analysis of Net Income Decrease
*Provision for allowance for recoverable accounts under production sharing and Provision for exploration projects
Net income attributableto owners of parentApr. –Sep.
‘15
Increasein Sales volume
Decrease inUnit price
Decrease in Cost ofsales
Decrease in Explorationexpenses andAllowance forexploration*
Decrease in
SG&A
Other income
and expenses
Net income(loss)
attributable to non‐controlling
interestsNet Sales
Decrease in Income
tax payable
OthersExchange rate(Appreciation
of yen)
(Billions of Yen)
Net income attributableto owners of parentApr. –Sep.
‘16
22
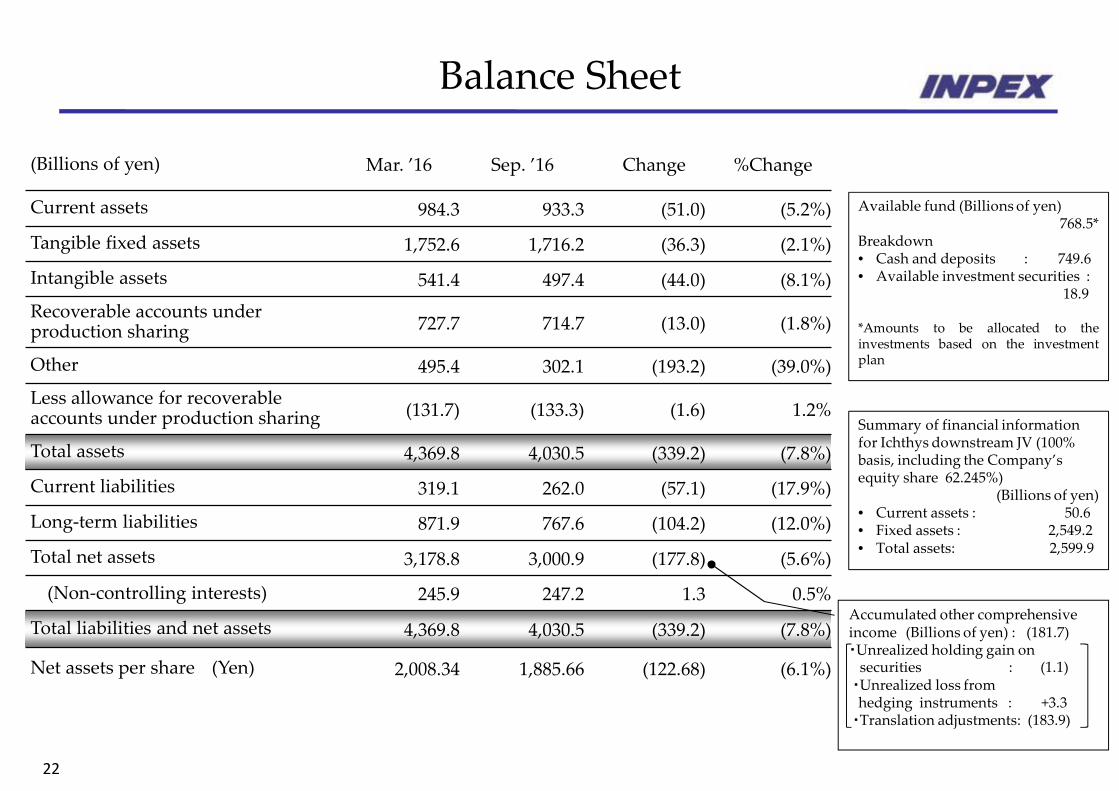
Balance Sheet
(Billions of yen) Mar. ’16 Sep. ’16 Change %Change
Current assets 984.3 933.3 (51.0) (5.2%)
Tangible fixed assets 1,752.6 1,716.2 (36.3) (2.1%)
Intangible assets 541.4 497.4 (44.0) (8.1%)
Recoverable accounts under production sharing 727.7 714.7 (13.0) (1.8%)
Other 495.4 302.1 (193.2) (39.0%)
Less allowance for recoverableaccounts under production sharing (131.7) (133.3) (1.6) 1.2%
Total assets 4,369.8 4,030.5 (339.2) (7.8%)
Current liabilities 319.1 262.0 (57.1) (17.9%)
Long‐term liabilities 871.9 767.6 (104.2) (12.0%)
Total net assets 3,178.8 3,000.9 (177.8) (5.6%)
(Non‐controlling interests) 245.9 247.2 1.3 0.5%
Total liabilities and net assets 4,369.8 4,030.5 (339.2) (7.8%)
Net assets per share (Yen) 2,008.34 1,885.66 (122.68) (6.1%)
Available fund (Billions of yen) 768.5*
Breakdown • Cash and deposits : 749.6• Available investment securities :
18.9
*Amounts to be allocated to theinvestments based on the investmentplan
Accumulated other comprehensive income (Billions of yen) : (181.7)・Unrealized holding gain on securities : (1.1)・Unrealized loss from hedging instruments : +3.3・Translation adjustments: (183.9)
Summary of financial information for Ichthys downstream JV (100% basis, including the Company’s equity share 62.245%)
(Billions of yen) • Current assets : 50.6• Fixed assets : 2,549.2• Total assets: 2,599.9

23
Statement of Cash Flows(Billions of Yen) Apr.‐Sep. ’15 Apr.‐Sep. ’16 Change %Change
Income before income taxes 258.8 132.1 (126.6) (48.9%)
Depreciation and amortization 35.1 43.2 8.1 23.3%
Recovery of recoverable accounts under production sharing (capital expenditures) 26.8 37.2 10.4 38.8%
Recoverable accounts under production sharing (operating expenditures) (29.3) (1.5) 27.8 (94.7%)
Income taxes paid (226.7) (110.4) 116.2 (51.3%)
Other 32.9 15.9 (16.9) (51.5%)
Net cash provided by (used in) operating activities 97.6 116.6 18.9 19.4%
Payments for time deposits / Proceeds from time deposits 257.9 166.3 (91.6) (35.5%)
Payments for long‐term time deposits (63.8) ‐ 63.8 ‐
Payments for purchases of tangible fixed assets (243.9) (143.1) 100.7 (41.3%)
Payments for purchases of marketable securities/investment securities and proceeds from sales of marketable securities/investment securities 124.2 (0.1) (124.4) ‐
Investment in recoverable accounts under production sharing (capital expenditures) (40.2) (24.3) 15.9 (39.6%)
Long‐term loans made / Collection of long‐term loans receivable (192.2) (65.4) 126.7 (65.9%)
Payments for purchase of mining rights (133.6) ‐ 133.6 ‐
Other (21.4) (9.3) 12.0 (56.2%)
Net cash provided by (used in) investing activities (313.1) (76.2) 236.8 (75.7%)
Net cash provided by (used in) financing activities 46.9 (26.4) (73.4) ‐
Cash and cash equivalents at end of the period 90.9 62.5 (28.4) (31.3%)

24
Differences between Consolidated Financial Forecasts and Actual Results for the six months ended September 30, 2016
Previous Forecasts(August 4, 2016) Actual Results Change % Change
Net Sales (billions of yen) 395.0 389.6 (5.3) (1.4%)
Operating income (billions of yen) 136.0 138.0 2.0 1.5%
Ordinary income (billions of yen) 128.0 132.1 4.1 3.3%
Net income attributable to owners of parent (billions of yen) 10.0 15.7 5.7 57.3%
‐ Differences between Consolidated Financial Forecasts and Actual Results for the six months ended September 30, 2016
‐ Assumptions
(November 11, 2016) 1st half (Actual Results)
Crude oil price (Brent) (US$/bbl) 47.0
Exchange rate (yen/US$) 105.3
(August 4, 2016) 1st half (Previous Forecasts)
Crude oil price (Brent) (US$/bbl) 46.0
Exchange rate (yen/US$) 106.6
25
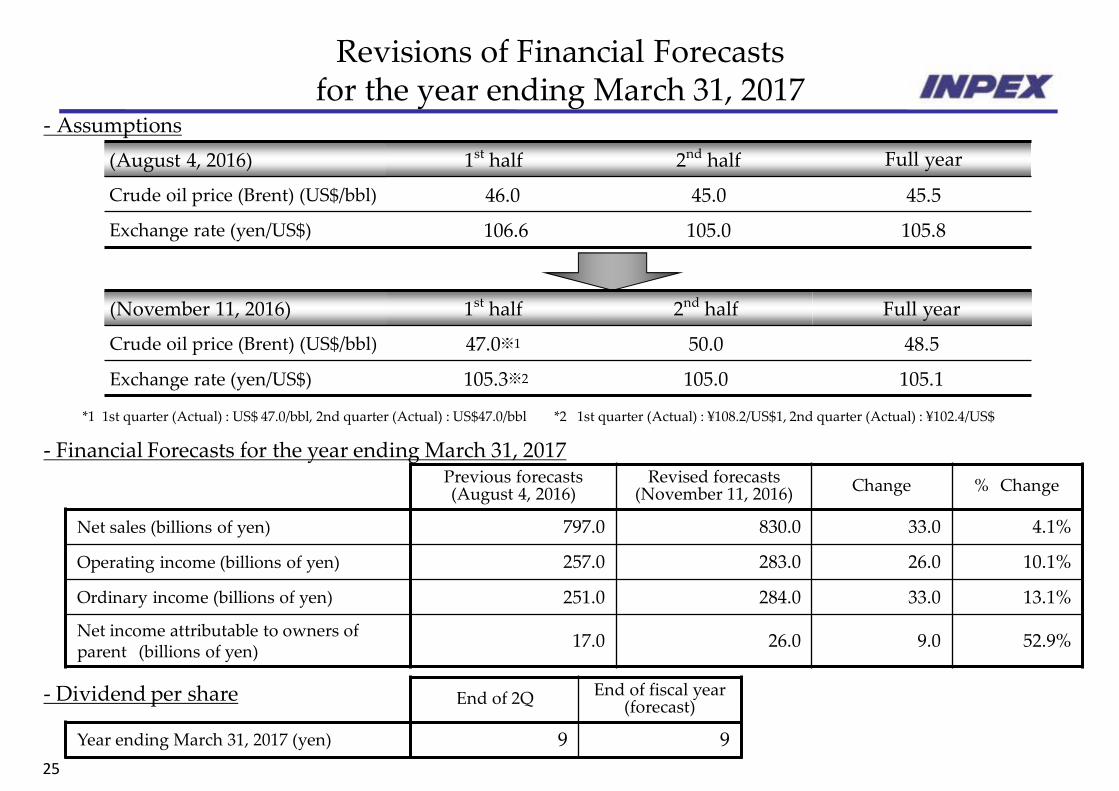
Revisions of Financial Forecasts for the year ending March 31, 2017
Previous forecasts(August 4, 2016)
Revised forecasts(November 11, 2016) Change % Change
Net sales (billions of yen) 797.0 830.0 33.0 4.1%
Operating income (billions of yen) 257.0 283.0 26.0 10.1%
Ordinary income (billions of yen) 251.0 284.0 33.0 13.1%
Net income attributable to owners of parent (billions of yen) 17.0 26.0 9.0 52.9%
‐ Financial Forecasts for the year ending March 31, 2017
‐ Assumptions
(November 11, 2016) 1st half 2nd half Full year
Crude oil price (Brent) (US$/bbl) 47.0※1 50.0 48.5
Exchange rate (yen/US$) 105.3※2 105.0 105.1
‐ Dividend per share End of 2Q End of fiscal year (forecast)
Year ending March 31, 2017 (yen) 9 9
(August 4, 2016) 1st half 2nd half Full year
Crude oil price (Brent) (US$/bbl) 46.0 45.0 45.5
Exchange rate (yen/US$) 106.6 105.0 105.8
*1 1st quarter (Actual) : US$ 47.0/bbl, 2nd quarter (Actual) : US$47.0/bbl *2 1st quarter (Actual) : ¥108.2/US$1, 2nd quarter (Actual) : ¥102.4/US$
![CSR Report 2011 - 国際石油開発帝石株式会社[INPEX]ACG Oil Fields ADMA Block West Bakr Block 128,699 Company Name: INPEX CORPORATION Established: April 3, 2006 Capital: ¥290,809,835,000](https://static.fdocuments.us/doc/165x107/5f08fad37e708231d424a712/csr-report-2011-ececccinpex-acg-oil-fields-adma.jpg)