Inpatient Malnutrition: No disclosures to report ANCE/Leblanc_Malnutrition.pdf · Acute...
10
2/28/2018 1 Inpatient Malnutrition: Identify, Implement, Assess and Validate GISELE LEBLANC, MS, RDN, LDN, CNSC, FAND March, 2018 Disclosures No disclosures to report Objectives • Identify the essential components of implementing and monitoring the malnutrition coding process. • Establish a quality assessment process to demonstrate patient outcomes from the implementation of the malnutrition coding process. • Demonstrate the financial outcomes for C-Suite executives. Why is this necessary? Scope of the Problem 1/3 1 in 3 hospitalized patients is malnourished upon admission 15-60% Estimated prevalence of malnutrition in the hospital Malnutrition leads to adverse outcomes Risk for Pressure Ulcers & Impaired Wound Healing Immune Suppression Increased Infection Rate Muscle Wasting and Functional Loss Falls
Transcript of Inpatient Malnutrition: No disclosures to report ANCE/Leblanc_Malnutrition.pdf · Acute...
2/28/2018
1
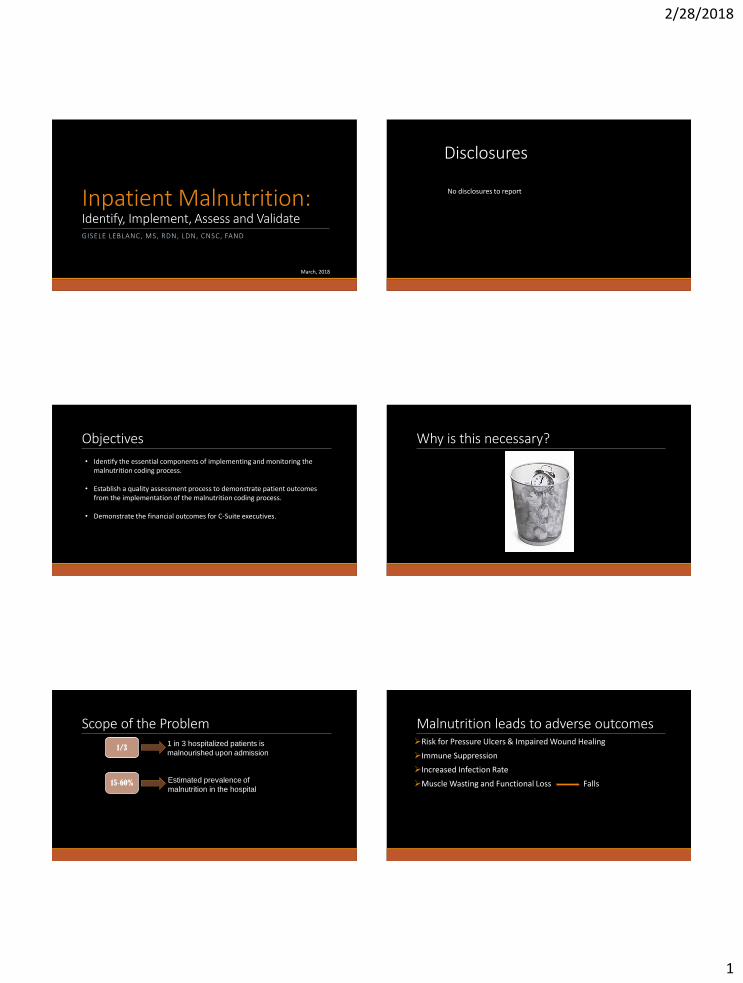
Inpatient Malnutrition: Identify, Implement, Assess and ValidateGISELE LEBLANC, MS, RDN, LDN, CNSC, FAND
March, 2018
Disclosures
No disclosures to report
Objectives
• Identify the essential components of implementing and monitoring the malnutrition coding process.
• Establish a quality assessment process to demonstrate patient outcomes from the implementation of the malnutrition coding process.
• Demonstrate the financial outcomes for C-Suite executives.
Why is this necessary?
Scope of the Problem
1/31 in 3 hospitalized patients is
malnourished upon admission
15-60% Estimated prevalence of
malnutrition in the hospital
Malnutrition leads to adverse outcomesRisk for Pressure Ulcers & Impaired Wound Healing
Immune Suppression
Increased Infection Rate
Muscle Wasting and Functional Loss Falls

2/28/2018
2
Malnutrition leads to adverse outcomesLonger Lengths of Stay : 12.6 days versus 4.4 days
Higher Readmission Rates: 23% versus 14.9%
Higher Treatment Costs: Direct & Indirect cost: $157 billion each year
Mortality: 5 times more common
Estimated Cost of Malnutrition - State
State Results (90% Confidence Interval) $
Per Capita Cost $ Results (65+) $ Per Capita Cost (65+) $
Massachusetts 322,609,120 47 90,326,104 88
Vermont 29,008,612 45 9,114,263 85
Florida 1,061,692,992 52 346,982,176 91
New York 1,025,842,688 51 28,918,304 90
California 1,779,335,552 44 492,571,488 97
Maryland 340,440,992 55 84,344,672 102
National 15,598,520,320 48 4,320,378,880 93
Simulation annual for 8 target diseases
Massachusetts DAM by disease (Million $)
Stroke COPD CHF Colon Cancer
Breast Cancer
Dementia Musculo-skelatal
Depression Total
$23.4 $35.7 $11.7 $3.8 $1.8 $177.9 $16.6 $51.8 $322.6
Identify & Diagnose• Patient is identified as malnourished or at nutrition risk
via a validated nutrition screen tool
• Referral is made to the RDN
• RDN performs thorough nutrition assessment and determines the degree of malnutrition.
Validated Nutrition Screening ToolThe Joint Commission
PC.01.02.01 The hospital assesses and reassesses its patients.
1. The hospital defines, in writing, the scope and content of screening, assessment, and reassessment in formation it collects. Note 3: The scope may also address the need for more in-depth assessments, such as a nutritional, functional, or pain assessment for patients who are at risk.
2. The hospital has defined criteria that identify when nutritional plans are developed.
DNV Healthcare
NS.3 Nursing staff shall complete an assessment of a patient’s condition within twenty four hours of admission to an inpatient setting.
SR.2a The nursing assessment will include but not be limited to: Dietary requirements.

2/28/2018
3
Validated Nutrition Screening Tool
SensitivityTRUE POSITIVES
Identified at risk AND is at nutrition riskFALSE POSITIVES
Identified at risk BUT is not at nutritional risk
SpecificityTRUE NEGATIVES
Not identified at risk AND not atnutritional risk
FALSE NEGATIVESNot identified at risk BUT at nutritional risk
Tool Population Sensitivity % Specificity %
Malnutrition Screening Tool (MST)
Acute hospitalized n=408 93 93
Acute hospitalized n=2211 74 76
Malnutrition Universal Screening Tool (MUST)
Hospitalized – med/surgn=995
61 76
Nutrition Risk Screening (NRS 2002)
Hospitalized- med/surgN=995
62 93
Acute hospitalized n=120 70 85
Validated Nutrition Screening ToolConsider the # of criteria that make up the tool:
- Weight Loss - Housebound
- Weight - Impaired general condition
- Height - Meal preparation habits and eating alone
- Appetite - Dementia and depression
- Subcutaneous fat loss - Food intake or eating problem
- Ability to eat and retain food - Intake of fluid/fruits and vegetables
- How and when to administer the tool?
- Involve interdisciplinary collaboration
Identify & Diagnose• Patient is identified as malnourished or at nutrition risk
via a validated nutrition screen tool
• Referral is made to the RDN
• RDN performs thorough nutrition assessment and determines the degree of malnutrition.
Identify & Diagnose• RDN notifies physician of recommended diagnosis with
supporting evidence.
• Physician documents the degree of malnutrition. The clinical documentation specialist will query the physician.
• Coders translate the malnutrition diagnosis from the physician documentation into the corresponding ICD-10 code.
Understanding Malnutrition CodingWhat are ICD-10 codes?
• ICD-10 CM stands for International Classification of Disease, 10th Revision, Clinical Modifications. These are 3-5 digit codes that are used to translate medical documentation, including signs, symptoms, injuries, diseases, and conditions into diagnosis codes.
Understanding Malnutrition CodingWhat are DRGs?
Hospital payment is determined by Medicare Diagnostic Related Groupings (DRGs). Accurate malnutrition documentation and coding not only helps increase hospital revenue, it helps paint a better picture of causes of mortality and morbidity.
ICD10 codes are associated with DRGs. The final primary diagnosis at discharge is the one that determines the DRG to which the patient’s hospital admission is assigned. To maximize the DRG reimbursement, all appropriate ICD10 diagnosis should be entered in the coding database.
2/28/2018
4
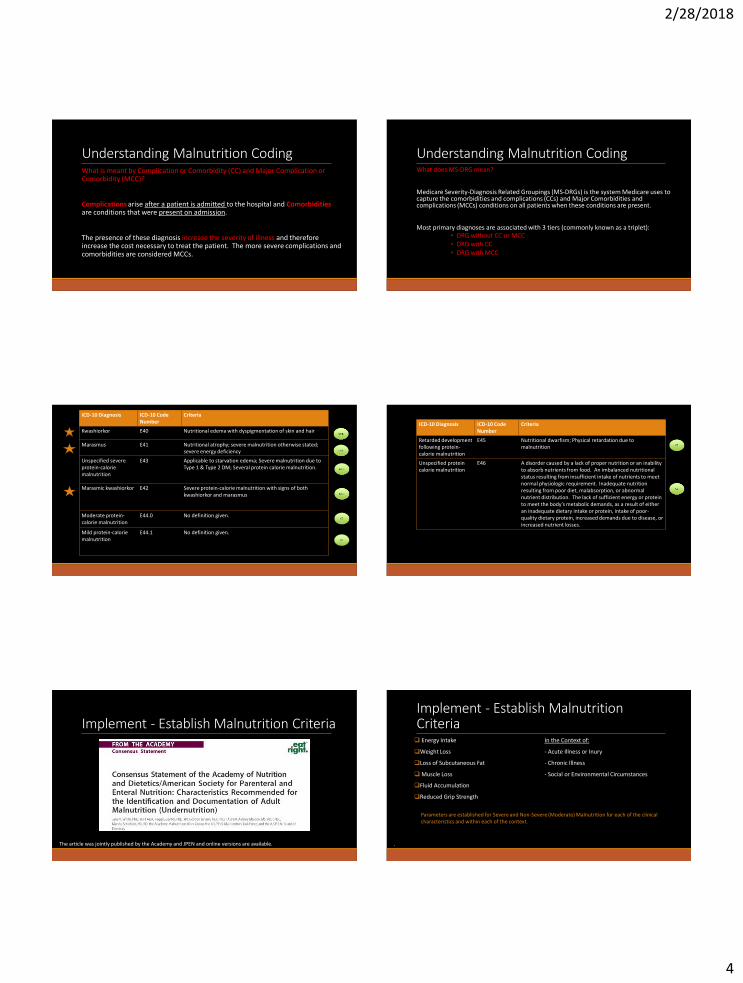
Understanding Malnutrition CodingWhat is meant by Complication or Comorbidity (CC) and Major Complication or Comorbidity (MCC)?
Complications arise after a patient is admitted to the hospital and Comorbiditiesare conditions that were present on admission.
The presence of these diagnosis increase the severity of illness and therefore increase the cost necessary to treat the patient. The more severe complications and comorbidities are considered MCCs.
Understanding Malnutrition CodingWhat does MS-DRG mean?
Medicare Severity-Diagnosis Related Groupings (MS-DRGs) is the system Medicare uses to capture the comorbidities and complications (CCs) and Major Comorbidities and complications (MCCs) conditions on all patients when these conditions are present.
Most primary diagnoses are associated with 3 tiers (commonly known as a triplet):◦ DRG without CC or MCC◦ DRG with CC◦ DRG with MCC
ICD-10 Diagnosis ICD-10 Code Number
Criteria
Kwashiorkor E40 Nutritional edema with dyspigmentation of skin and hair
Marasmus E41 Nutritional atrophy; severe malnutrition otherwise stated; severe energy deficiency
Unspecified severe protein-calorie malnutrition
E43 Applicable to starvation edema; Severe malnutrition due to Type 1 & Type 2 DM; Several protein calorie malnutrition.
Marasmic kwashiorkor E42 Severe protein-calorie malnutrition with signs of both kwashiorkor and marasmus
Moderate protein-calorie malnutrition
E44.0 No definition given.
Mild protein-calorie malnutrition
E44.1 No definition given.CC
ICD-10 Diagnosis ICD-10 Code Number
Criteria
Retarded development following protein-calorie malnutrition
E45 Nutritional dwarfism; Physical retardation due to malnutrition
Unspecified protein calorie malnutrition
E46 A disorder caused by a lack of proper nutrition or an inability to absorb nutrients from food. An imbalanced nutritional status resulting from insufficient intake of nutrients to meet normal physiologic requirement. Inadequate nutrition resulting from poor diet, malabsorption, or abnormal nutrient distribution. The lack of sufficient energy or protein to meet the body’s metabolic demands, as a result of either an inadequate dietary intake or protein, intake of poor-quality dietary protein, increased demands due to disease, or increased nutrient losses.
Implement - Establish Malnutrition Criteria
The article was jointly published by the Academy and JPEN and online versions are available.
Implement - Establish Malnutrition Criteria Energy Intake
Weight Loss
Loss of Subcutaneous Fat
Muscle Loss
Fluid Accumulation
Reduced Grip Strength
In the Context of:
- Acute Illness or Inury
- Chronic Illness
- Social or Environmental Circumstances
.
Parameters are established for Severe and Non-Severe (Moderate) Malnutrition for each of the clinical characteristics and within each of the context.

2/28/2018
5
Why?
Criteria Severe Moderate Mild
Albumin and/or Prealbumin
<2.0<5.0
<2.5<10.0
<3.0<15.0
Ideal Body Weight <70% <80% <90%
Usual Body Weight <75% wt loss parameters*
<85% >95%
BMI <16 <17 <18.5
* Unintended weight loss of >5% in one month, >7.5% in three months, >10% in 6 months, or >20% in one year.
Understanding Malnutrition CodingHow is payment determined?
That hospital‘s base rate for Medicare payments for that fiscal year (changes every October 1).
Relative Weight (RW) of the Final MS-DRG assigned at discharge (available on www.cms.gov). Be sure to use the correct fiscal year).
◦ Payment = Base rate x RW*
Understanding Malnutrition CodingExample: MS-DRG Example MS-DRG Relative Weight
(RW)Average Payment for US hospitals for CHFbased on MS-DRG
(Base rate of $8,800)
DRG without CC or MCC
293 – Heart failure & shock w/o CC or MCC
0.6732 $5,924
DRG with CC but without MCC
292 – Heart failure & shock w/ CC
0.9610 $8,456
DRG with at least one MCC
291 – Heart failure & shock w/MCC
1.4825 $13,046
Additional factors that affect payments: penalties and incentives
Relative Weight Table
Tracking and Quantifying Payment• Work with Coding Specialist and Billing Department to establish how this can be tracked to measure the financial impact and/or patient outcomes
• Track your current year incremental volume/revenue
• Use the information to create a baseline
• Work with administration, finance and coding to project incremental volumes/revenues for the upcoming fiscal year
Facility’s base rate for Medicare payments for the current fiscal year• Suggested departments to ask:
• Patient Financial Services
• Revenue Integrity
• Patient Billing Office
• Revenue Cycle Office
All patients coded for malnutrition in the previous year using the ICD-10 malnutrition codes.• For those patients, you also want to know:
• Payment source (Medicare, private insurance, Medicaid etc..)
• Final MS-DRG
• Which malnutrition code was assigned (ICD-10)
• If severe E43 – were any other MCCs assigned to that patient?
• If mild E44.1 or moderate E44 – were any MCCs or other CCs assigned to that patient?
If not included in the data from the hospital, use the CMS table for relative weights for each MS-DRG to determine the RW for that MS-DRG. Be sure to use the current year.
Checklist of Data Required to Track Impact
W MCC
or CC
W
MCC
W
CC
W/O
MCC
date
range
match
supplied
month
supplied
date PPX DX2 SPX PT ID MRNO PT TYPE CASE LOS
ADM
DATE D/C DATE
D/C
YEAR
D/C
MONTH CMI
DRG
CODE DRG DESC
PRIN
DIAG CD PRIN DIAG DESC
DX2
CODE
DX3
CODE
DX4
CODE
DX5
CODE
DX6
CODE
1 1 0 0 NO Jan 0 0 1 Inpatient 1 8 8/5/2015 8/13/2015 2015 AUGUST 1.5625 698 OTHER KIDNEY & URINARY TRACT DIAGNOSES W MCC 996.64 React-indwell urin cath 038.42 038.49 995.92 038.9 707.03
1 1 0 0 NO Jan 0 0 1 Inpatient 1 22 6/23/2015 7/15/2015 2015 JULY 1.9195 314 OTHER CIRCULATORY SYSTEM DIAGNOSES W MCC 999.32 Blood inf dt cen ven cth 038.49 262 514 557.1 518.82
1 0 1 0 NO Jan 0 0 1 Inpatient 1 5 8/22/2015 8/27/2015 2015 AUGUST 1.617 671 URETHRAL PROCEDURES W CC/MCC 996.76 Comp-genitourin dev/grft 189.0 263.0 197.0 599.0 427.31
1 0 1 0 NO Jan 0 0 1 Inpatient 1 4 4/27/2015 5/1/2015 2015 MAY 1.1235 598 MALIGNANT BREAST DISORDERS W CC 174.9 Malign neopl breast NOS 197.0 511.81 263.0 196.3 423.9
1 1 0 0 NO Jan 0 1 1 Inpatient 1 7 8/20/2015 8/27/2015 2015 AUGUST 1.5131 865 VIRAL ILLNESS W MCC 075 Infectious mononucleosis 262 284.19 784.7 V14.0
1 1 0 0 NO Jan 0 1 1 Inpatient 1 3 4/14/2015 4/17/2015 2015 APRIL 1.9749 146 EAR, NOSE, MOUTH & THROAT MALIGNANCY W MCC 146.9 Malig neo oropharynx NOS 262 518.83 V44.0 197.0 401.0
1 1 0 0 NO Jan 0 1 1 Inpatient 1 11 7/21/2015 8/1/2015 2015 AUGUST 2.0182 374 DIGESTIVE MALIGNANCY W MCC 152.0 Malignant neopl duodenum 262 197.7 276.51 537.3 518.0
1 1 0 0 NO Jan 0 1 1 Inpatient 1 7 7/7/2015 7/14/2015 2015 JULY 3.661 166 OTHER RESP SYSTEM O.R. PROCEDURES W MCC 162.2 Malig neo main bronchus 262 428.31 799.4 423.8 511.9
1 1 0 0 NO Jan 0 1 1 Inpatient 1 11 5/20/2015 5/31/2015 2015 MAY 1.6869 180 RESPIRATORY NEOPLASMS W MCC 197.0 Secondary malig neo lung 262 518.81 038.9 584.9 198.89
1 1 0 0 NO Jan 0 1 1 Inpatient 1 2 5/14/2015 5/16/2015 2015 MAY 1.3944 637 DIABETES W MCC 250.12 DMII ketoacd uncontrold 262 V62.84 296.50 536.3 250.62
1 1 0 0 NO Jan 0 1 1 Inpatient 1 11 6/27/2015 7/8/2015 2015 JULY 1.1044 640 MISC DISORDERS OF NUTRITION,METABOLISM,FLUIDS/ELECTROLYTES W MCC 276.0 Hyperosmolality 262 288.00 294.21 285.9 295.30
1 1 0 0 NO Jan 0 1 1 Inpatient 1 9 5/21/2015 5/30/2015 2015 MAY 1.1044 640 MISC DISORDERS OF NUTRITION,METABOLISM,FLUIDS/ELECTROLYTES W MCC 276.1 Hyposmolality 262 785.59 348.1 780.39 710.0
1 1 0 0 NO Jan 0 1 1 Inpatient 1 2 7/1/2015 7/3/2015 2015 JULY 1.1044 640 MISC DISORDERS OF NUTRITION,METABOLISM,FLUIDS/ELECTROLYTES W MCC 276.1 Hyposmolality 262 275.2 273.8 783.21 V85.1
1 1 0 0 NO Jan 0 1 1 Inpatient 1 9 7/2/2015 7/11/2015 2015 JULY 1.1044 640 MISC DISORDERS OF NUTRITION,METABOLISM,FLUIDS/ELECTROLYTES W MCC 276.1 Hyposmolality 262 295.30 296.20 295.90 783.0
1 1 0 0 NO Jan 0 1 1 Inpatient 1 7 7/18/2015 7/25/2015 2015 JULY 4.9968 981 EXTENSIVE O.R. PROCEDURE UNRELATED TO PRINCIPAL DIAGNOSIS W MCC 276.1 Hyposmolality 262 785.50 584.9 576.4 799.4
1 1 0 0 NO Jan 0 1 1 Inpatient 1 5 4/8/2015 4/13/2015 2015 APRIL 1.1044 640 MISC DISORDERS OF NUTRITION,METABOLISM,FLUIDS/ELECTROLYTES W MCC 276.51 Dehydration 262 196.9 141.0 112.0 787.01
1 1 0 0 NO Jan 0 1 1 Inpatient 1 2 6/3/2015 6/5/2015 2015 JUNE 1.1044 640 MISC DISORDERS OF NUTRITION,METABOLISM,FLUIDS/ELECTROLYTES W MCC 276.51 Dehydration 262 458.9 276.2 284.11 174.9
1 1 0 0 NO Jan 0 1 1 Inpatient 1 13 8/5/2015 8/18/2015 2015 AUGUST 1.2829 811 RED BLOOD CELL DISORDERS W MCC 282.62 Hb-SS disease w crisis 262 453.86 790.7 997.79 536.2
Relative Weight
DRG
Primary Diagnosis
Secondary Diagnosis
Malnutrition Codes are highlighted
2/28/2018
6
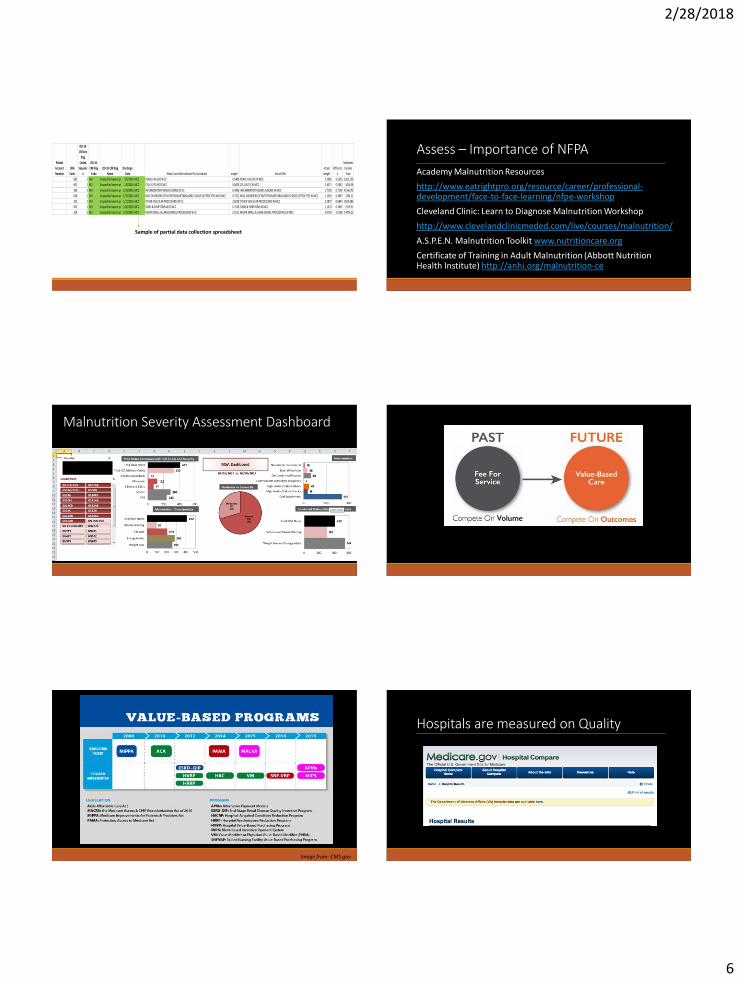
Patient
Account
Number
DRG
Code
ICD-10-
CM Any
Diag
Coded
Sequenc
e
ICD-10-
CM Diag
Code
ICD-10-CM Diag
Name
Discharge
Date What it would be without Pro/cal malnut weight Actual DRG
Actual
weight
Differenc
e
Multiplied
by Base
Rate
682 2 E43 Unspecified severe protein-calorie malnutrition1/6/2016 MCC RENAL FAILURE W CC 0.9406 RENAL FAILURE W MCC 1.5085 0.5679 3263.256
602 2 E43 Unspecified severe protein-calorie malnutrition1/6/2016 MCC CELLULITIS W/O MCC 0.8429 CELLULITIS W MCC 1.4371 0.5942 3414.38
385 2 E43 Unspecified severe protein-calorie malnutrition1/18/2016 MCC INFLAMMATORY BOWEL DISEASE W CC 0.9996 INFLAMMATORY BOWEL DISEASE W MCC 1.7195 0.7199 4136.675
640 2 E43 Unspecified severe protein-calorie malnutrition1/19/2016 MCC MISC DISORDERS OF NUTRITION,METABOLISM,FLUIDS/ELECTROLYTES W/O MCC 0.7221 MISC DISORDERS OF NUTRITION,METABOLISM,FLUIDS/ELECTROLYTES W MCC 1.1318 0.4097 2354.21
252 2 E43 Unspecified severe protein-calorie malnutrition1/21/2016 MCC OTHER VASCULAR PROCEDURES W CC 2.6028 OTHER VASCULAR PROCEDURES W MCC 3.2872 0.6844 3932.686
947 2 E43 Unspecified severe protein-calorie malnutrition1/26/2016 MCC SIGNS & SYMPTOMS W/O MCC 0.7356 SIGNS & SYMPTOMS W MCC 1.1323 0.3967 2279.51
329 2 E43 Unspecified severe protein-calorie malnutrition1/29/2016 MCC MAJOR SMALL & LARGE BOWEL PROCEDURES W CC 2.5511 MAJOR SMALL & LARGE BOWEL PROCEDURES W MCC 5.0709 2.5198 14479.22
Sample of partial data collection spreadsheet
Assess – Importance of NFPA
Academy Malnutrition Resources
http://www.eatrightpro.org/resource/career/professional-development/face-to-face-learning/nfpe-workshop
Cleveland Clinic: Learn to Diagnose Malnutrition Workshop
http://www.clevelandclinicmeded.com/live/courses/malnutrition/
A.S.P.E.N. Malnutrition Toolkit www.nutritioncare.org
Certificate of Training in Adult Malnutrition (Abbott Nutrition Health Institute) http://anhi.org/malnutrition-ce
Malnutrition Severity Assessment Dashboard
Image from: CMS.gov
Hospitals are measured on Quality

2/28/2018
7
eCQMs
Infographic source: eCQI Resource Center https://ecqi.healthit.gov/ecqms
eCQMs
eCQI Resource Center https://ecqi.healthit.gov/ecqms
Proposed Malnutrition eCQMs
Completion of a malnutrition screening within 24 hours of admission
Completion of a nutrition assessment for patients identified as at-risk for malnutrition within 24 hours of a malnutrition screening
Nutrition care plan for patients identified as malnourished after a complete nutrition assessment
Appropriate documentation of malnutrition diagnosis
What is the Malnutrition Quality Improvement Initiative (MQii)?
41
MQii Objectives
● Develop malnutrition quality measures “that matter”
● Improve malnutrition care with an interdisciplinary care team
roadmap (toolkit)
● Advance tools that can be integrated into EHR systems to improve
care quality
The MQii is focused on older adults (ages 65 and older) given the
significant impact malnutrition has on this patient population and the
opportunity to improve care among these patients
The MQii Uses a Toolkit to Support Improved Malnutrition Care
The Toolkit provides a clear workflow, as well as associated tools and resources, to support quality improvement and best practices in the screening, assessment, and treatment of older adults admitted to the hospital with or at risk of malnutrition.
http://mqii.defeatmalnutrition.today/mqii-toolkit.html

2/28/2018
8
MQii Tools
Setting up data collection Setting up data collection
Metrics to Track:
(if without electronic monitoring)
1. Gather data on your current nutrition screening tool.
2. Keep specific patient population or units separate.
3. Perform random evaluation of screening.
4. Gather information on break in process.
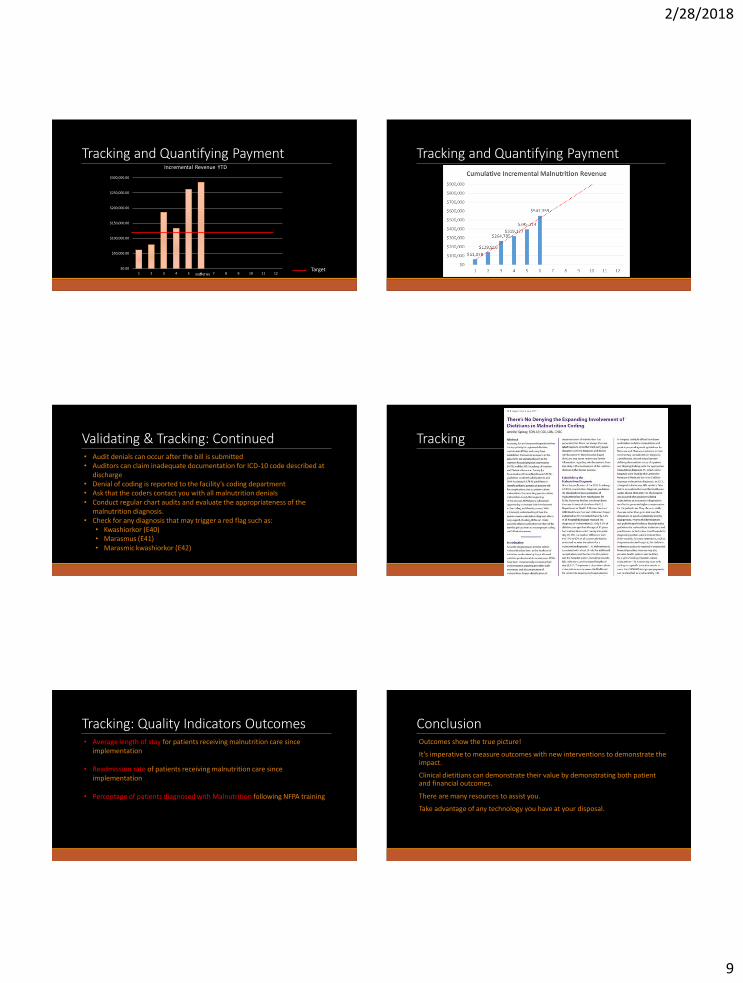
Report/Validate the DataFacility Bed Size Date Reported Revenue Collected Comments
Hospital A 614 9 months in 2014 $580,000
2015 $1.2 M
2016 $2.1 M
Hospital B 95 7 months in 2015 $290,000
Hospital C 50 2015 $170,000
Hospital D 250 2016 $320,141
Hospital E 150 2016 $213,526 Medicare only MCC
2017 $295,922 Medicare only MCC January February March April May June July August Sept October November December
2016 $161,764.00 $182,556.00 $228,129.00 $152,178.00 $197,359.00 $219,347.00 $172,553.00 $221,000.00 $182,377.00 $247,222.00 $190,143.00 $213,526.00
2017 $209,721.00 $216,777.00 $208,455.00 $228,984.00 $247,616.00 $256,943.00 $256,342.00 $246,308.00 $276,097.00 $310,786.00 $283,205.00 $295,922.00
$0
$50,000
$100,000
$150,000
$200,000
$250,000
$300,000
$350,000
2016 2017 Linear (2016) Linear (2017)
2/28/2018
9
Tracking and Quantifying Payment
$0.00
$50,000.00
$100,000.00
$150,000.00
$200,000.00
$250,000.00
$300,000.00
1 2 3 4 5 6 7 8 9 10 11 12MONTHS
Incremental Revenue YTD
Target
Tracking and Quantifying Payment
Validating & Tracking: Continued • Audit denials can occur after the bill is submitted• Auditors can claim inadequate documentation for ICD-10 code described at
discharge• Denial of coding is reported to the facility’s coding department• Ask that the coders contact you with all malnutrition denials• Conduct regular chart audits and evaluate the appropriateness of the
malnutrition diagnosis.• Check for any diagnosis that may trigger a red flag such as:
• Kwashiorkor (E40)• Marasmus (E41)• Marasmic kwashiorkor (E42)
Tracking
Tracking: Quality Indicators Outcomes• Average length of stay for patients receiving malnutrition care since
implementation
• Readmission rate of patients receiving malnutrition care since implementation
• Percentage of patients diagnosed with Malnutrition following NFPA training
ConclusionOutcomes show the true picture!
It’s imperative to measure outcomes with new interventions to demonstrate the impact.
Clinical dietitians can demonstrate their value by demonstrating both patient and financial outcomes.
There are many resources to assist you.
Take advantage of any technology you have at your disposal.
2/28/2018
10
ReferencesFontes D Clin Nutr 2014;33: 291-295
Tappenden K et al. JPEN 2013;37:482-497
White J et al. JAND 2012;112:730-738
Barker et al. Int J Environ Res Public Health. 2011;8(2):514-527
Fry DE et al. Arch Surg. 2010; 145(2):148-151
Corkins M et al. JPEN 2014;38:186-195
Fingar R et al. 2016; HCUP Statistical Brief #218 https://hcup-us.ahrq.gov/reports/statbriefs/sb218-Malnutrition-Readmissions-2013.jsp
Goates S et al. JPEN 2014;38(2):77S-85S
ReferencesMogensen K et al. JPEN 2017;00:1-9 http://onlinelibrary.wiley.com/doi/10.1177/0148607117709766/pdf
Hudson L et al. JPEN 2018;00:1-6 http://onlinelibrary.wiley.com/doi/10.1002/jpen.1021/epdf
Elia M et al. Clin Nutr 2005;24:867-884
Skipper et al. JPEN 2012;36:292-298
Phillips W. Support Line 39;3, June, 2017
White J et al. JAND 2012;112:730-738