Innovative Electrolytes for Safer Sodium-Ion...
85
THESIS FOR THE DEGREE OF DOCTOR OF PHILOSOPHY Innovative Electrolytes for Safer Sodium-Ion Batteries Damien Monti Department of Physics CHALMERS UNIVERSITY OF TECHNOLOGY Göteborg, Sweden, 2016
Transcript of Innovative Electrolytes for Safer Sodium-Ion...

THESIS FOR THE DEGREE OF DOCTOR OF PHILOSOPHY
Innovative Electrolytes for Safer
Sodium-Ion Batteries
Damien Monti
Department of Physics
CHALMERS UNIVERSITY OF TECHNOLOGY
Göteborg, Sweden, 2016

INNOVATIVE ELECTROLYTES FOR SAFER SODIUM-ION BATTERIES
DAMIEN MONTI © Damien Monti, 2016 Doktorsavhandlingar vid Chalmers tekniska högskola ISBN: 978-91-7597-310-4 Serial number: 3991 ISSN 0346-718X Chalmers University of Technology Department of Physics SE-412 96 Göteborg Sweden Telephone: +46 (0)31-772 3333 Fax: +46 (0)31-772 20 90
Cover:
Schematic of a sodium-ion battery
© Nicolas Monti
Printed by Chalmers Reproservice
Göteborg, Sweden, 2016

i
Innovative Electrolytes for Safer Sodium-Ion Batteries Damien Monti Department of Physics Chalmers University of Technology
Abstract
The overconsumption of non-renewable/fossil fuels by vehicles and industry has resulted in dangerously high levels of CO2 in the atmosphere the last 40 years. The impact on the environment, climate and public health urge governments to find new technologies to ensure a sustainable development. In this context, the development of greener energy storage technologies such as novel secondary batteries has already had a wide impact. The commercialisation of the first lithium-ion battery (LIB) in 1991 by Sony has revolutionized mobile devices and the LIB now emerges in electric vehicles, but can be even more important for load levelling of renewable energy. Unfortunately, an increase in our lithium consumption coupled with its low abundance in the Earth’s crust raises financial and sustainability concerns, forcing us to think about complementary battery technologies.
One of the most appealing alternatives is to use sodium instead of lithium. Chemically these elements are close and these similarities should ease a technological change. Therefore, the sodium-ion battery (SIB) is a concept worth studying - especially for large-scale applications due to the “unlimited” abundance of sodium in the Earth’s crust and the overall low materials cost, anticipated to be 30 times lower than for Li.
Electrolytes for SIBs can be based on organic solvents or ionic liquids (IL), or a mixture of both as matrices, all doped with the appropriate sodium salt. Several features and properties of hybrid IL and pure IL-based electrolytes for SIBs are investigated in this thesis; the ionic conductivity of novel electrolytes using a few ILs chosen among the large number available. These studies are complemented by Raman vibrational spectroscopy to understand the interactions within the electrolytes, and the possible operation temperature ranges by differential scanning calorimetry. Moreover, several electrolytes have been analysed to understand the IL contribution to various safety measures; ignition time (IT), flash point (FP), and self-extinguishing time (SET).
In addition, a significant part of the work is dedicated to the electrochemical compatibility of the electrolytes with novel SIB electrode materials. The stability and behaviour toward the electrodes are investigated to make possible a fully operative safer SIB in the future, possibly based on hybrid IL or pure IL-based electrolytes.
Keywords: Sodium-ion batteries, ionic liquids, organic solvents, electrodes, electrolytes,
safety, Raman spectroscopy, ionic conductivity, electrochemistry.

ii
List of Appended Papers
This thesis is based on the work presented in the following publications:
Paper I Microwaves as a synthetic route for preparing electrochemically active TiO2 nanoparticles Damien Monti, Alexandre Ponrouch, Marc Estruga, M. Rosa Palacín, José A. Ayllón and Anna Roig Journal of Materials Science, Volume 28, 2012, Pages 340-347
Paper II Towards high energy density sodium-ion batteries through electrolyte optimization Alexandre Ponrouch, Rémi Dedryvère, Damien Monti, Atif E. Demet, Jean Marcel Ateba Mba, Laurence Croguennec, Christian Masquelier, Patrik Johansson and M. Rosa Palacín Energy and Environmental Science, Volume 4, 2013, Pages 2361-2369
Paper III Ionic liquid based electrolytes for sodium-ion batteries: Na+ solvation and ionic conductivity Damien Monti, Erlendur Jónsson, M. Rosa Palacín and Patrik Johansson Journal of Power Sources, Volume 245, 2014, Pages 630-636
Paper IV Non-aqueous electrolytes for sodium-ion batteries Alexandre Ponrouch, Damien Monti, Andrea Boschin, Bengt Steen, Patrik Johansson and M. Rosa Palacín Journal of Materials Chemistry A, Volume 3, 2015, Pages 22-42
Paper V Towards safer sodium-ion batteries via organic solvents/ionic liquids based hybrid
electrolytes
Damien Monti, Alexandre Ponrouch, M. Rosa Palacín and Patrik Johansson
Submitted

iii
Additional Publication Not Included in the Thesis
Paper VI Solvation of Li+ and Na+ in carbonate based battery electrolytes – a combined computational and spectroscopic study Erlendur Jónsson, Luis Aguilera, Damien Monti, Aleksandar Matic and Patrik Johansson Submitted

iv
My Contribution to the Appended Papers
Paper I I (D.M) performed the synthesis of the TiO2 nanoparticles and the full characterization of the samples made using the laboratory microwave (MW) equipment. I electrochemically characterized the TiO2 synthesized with the domestic MW equipment. I wrote the first draft of the paper, wrote the paper together with my colleagues, and was the first author.
Paper II I performed the Raman spectroscopy experiments and analysis for all the electrolytes and wrote the corresponding part of paper, and co-authored the rest of the paper with my colleagues.
Paper III I characterized all the samples by all the experimental techniques included and did all the
data analysis, except for the DFT calculations. I wrote the first draft of the paper and was
first author of the paper written together with my colleagues.
Paper IV I wrote the ionic liquid part of the review including the bibliographic work. I co-authored the
review with my colleagues.
Paper V I characterized all the samples by all the experimental techniques included and did all the
data analysis. I wrote the first draft and was first author of the paper written together with
my colleagues.

v
List of Acronyms
°C Degrees Celsius
BF4- Tetrafluoroborate
BMIm 1-butyl-3-methyl-imidazolium
CE Counter electrode
CN Coordination number
Cu Copper
CV Cyclic voltammetry
DEC Diethyl carbonate
DFT Density functional theory
DMC Dimethyl carbonate
DME Dimethoxyethane
DSC Differential scanning calorimetry
EC Ethylene carbonate
EMC Ethyl methyl carbonate
EMIm 1-ethyl-3-methyl-imidazolium
ESW Electrochemical stability window
EV Electric vehicle
F Faraday’s constant
F- Fluoride ion
FP Flash point
FR Flame retardant
FSI Bis(fluorosulfonyl)imide
FWHM Full width at half maximum
GCPL Galvanostatic cycling with potential limitation
GPE Gel polymer electrolyte
G3 Triglyme - H3CO(CH2CH2O)3CH3
HC Hard carbon
HF Hydrogen fluoride
Hz Hertz
IL Ionic liquid
IT Ignition time
LE Liquid electrolyte
LFP LiFePO4
Li Lithium
Li2CO3 Lithium carbonate
LIB Lithium-ion battery
LMO LiMn2O4
LTO Li4Ti5O12
MW Microwave

vi
Na Sodium
NASICON Na Super Ionic CONductor
NiMH Nickel-metal hydride
NVP Na3V2(PO4)3
NVPF Na3V2(PO4)2F3
PC Propylene carbonate
PEO Poly(ethylene oxide)
PHEV Plug-in hybrid electric vehicle
PVA Poly(vinyl alcohol)
Pyr13 N-propyl-N-methyl-pyrrolidinium
Q Current flux
RE Reference electrode
RTIL Room temperature ionic liquid
SEI Solid electrolyte interphase
SET Self-extinguising time
S.H.E Standard hydrogen electrode
SIB Sodium-ion battery
SLI Starting, lighting, and ignition
SN Solvation number
SPI Solid permeable interface
TFSI Bis(trifluoromethanesulfonyl)imide
τa Amplitude correlation time
τc Correlation lifetime
Tg Glass transition temperature
Tm Melting temperature
TOTO 2,5,8,11-tetraoxatridecan-13-oate
WE Working electrode
WEC World energy consumption
VTF Vogel-Tammann-Fulcher

vii
List of Figures
Figure 1. Worldwide CO2 emissions by fuel in 1973 and 2012.
Figure 2. Worldwide energy repartition (a, b) and oil consumption (c, d) by sector in 1973 and 2012.
Figure 3. Price and consumption evolution of Li2CO3 and soda ash during the 20th Century.
Figure 4. Schematic illustration of an SIB with E1 and E2 being the electrode potentials and e-
electrons. The signs are using the galvanic cell convention (anode = negative electrode).
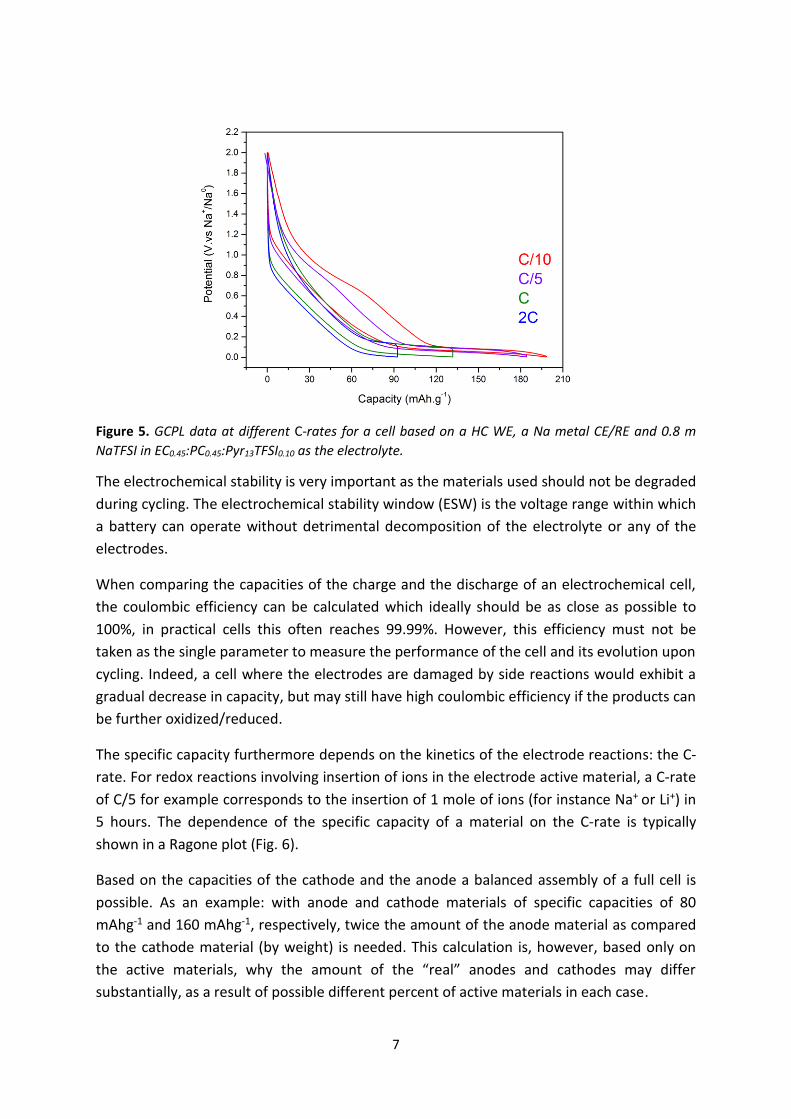
Figure 5. GCPL data at different C-rates for a cell based on a HC WE, a Na metal CE/RE and 0.8 m
NaTFSI in EC0.45:PC0.45:Pyr13TFSI0.10 as the electrolyte.
Figure 6. Ragone plot of the specific capacity as function of the C-rate of electrolytes from II and V.
Figure 7. Intercalation of sodium into HC (left) vs. intercalation of lithium into graphite (right).
Figure 8. An ion pair of the IL BMImBF4.
Figure 9. Schematic representation showing the difference between the intrinsic electrolyte ESW
and the extended ESW due to the electrode/electrolyte interfaces.
Figure 10. Dielectric spectroscopy cell used for all measurements in II and III.
Figure 11. Variation of the real part ε*(ω) (solid line) ε’(ω) and the imaginary part ε’’(ω) (dashed line)
of the complex dielectric function.
Figure 12. Conductivity vs. frequency for different temperature of NaTFSI in BMImTFSI.
Figure 13. Ionic conductivity results for NaxEMIm(1-x)TFSI and NaxBMIm(1-x)TFSI for different molar
fractions (x = 0, 0.1, 0.2, and saturated).
Figure 14. Schematic of two masses m1 and m2 connected by a weightless spring with a stiffness
force k.
Figure 15. Description of the Stokes and anti-Stokes processes, where E0 and Ei are vibrational
modes while hv0 and hvs are photon energies.
Figure 16. Raman spectra of (a) ECx:PCx:BMImTFSI(1-2x) and (b) ECx:PCx:Pyr13TFSI(1-2x), between 675-
1075 cm-1.
Figure 17. Deconvolution and fitting of peaks of TFSI, EC, and PC between 680-770 cm-1 using Voigt
profiles. The red line is the experimental Raman data and the green lines are the resulting individual
peaks from the fitting procedure.
Figure 18. Illustration of a DSC chamber with TS, TR, and TF the temperatures of the sample,
reference, and furnace, respectively. φFS and φFR are the heat flow rates from the furnace to the
sample, and from the furnace to the reference, respectively.
Figure 19. DSC traces of NaxEMIm(1-x)TFSI for different molar fractions (x = 0, 0.1, 0.2, and saturated)
between -150 - 150°C. Typical glass transitions, crystallizations and meltings are highlighted.
Figure 20. Microwave mechanism from dipole motion.
Figure 21. Three electrode Swagelok cell set-up.

viii
Figure 22. CV of EC0.40:PC0.40:EMImTFSI0.20 ((E1=0.005) – (E2=4) V vs. Na+/Na°) at a sweep rate of 1
mV/s using an Al WE; V0=2 V vs. Na+/Na°.
Figure 23. CV of 10 cycles (20 sweeps) for EMImTFSI (0-3 V vs. Na+/Na°) at a sweep rate of 1 mV/s
using a SS WE.
Figure 24. GCPL data for a half cell of NVP of 0.8 m NaTFSI in EC0.45:PC0.45:Pyr13TFSI0.10 electrolyte
cycled at different C-rates.
Figure 25. GCPL data for the charge and discharge of NVP with 0.8 m NaTFSI in
EC0.45:PC0.45:Pyr13TFSI0.10 as electrolyte at different C-rates. The alternation between fast and slow C-
rates is used to test the structural and chemical stability/reversibility.
Figure 26. Isotherms of the conductivity for (a) NaxEMIm(1-x)TFSI and (b) NaxBMIm(1-x)TFSI for
different molar fractions (x = 0.025, 0.05, 0.075, 0.1, 0.15, 0.2, and saturated). (III)
Figure 27. Conductivities of (a) ECx:PCx:BMImTFSI(1-2x) and (b) ECx:PCx:Pyr13TFSI(1-2x) as functions of
temperature. (V)
Figure 28. Viscosity of (a) ECx:PCx:BMImTFSI(1-2x) and (b) ECx:PCx:Pyr13TFSI(1-2x) as functions of
temperature. (V)
Figure 29. Isotherms of the conductivity for (a) NaxEMIm(1-x)TFSI and (b) NaxBMIm(1-x)TFSI for
different molar fractions (x = 0.025, 0.05, 0.075, 0.1, 0.15, 0.2, and saturated). (III)
Figure 30. Various safety measures as functions of the electrolyte IL content: (a) FP, (b) IT, and (c)
SET. Reference data for 1M MPF6 in EC:DMC (M=Na, Li) are represented by horizontal lines. (V)
Figure 31. Raman spectra of NaxEMIm(1-x)TFSI and NaxBMIm(1-x)TFSI between 725-765 cm-1 for
different molar fractions with the deconvolution and fitting for NaxEMIm(1-x)TFSI, x=sat, as insert.
Figure 32. Raman spectra of 1 M NaTFSI in ECx:PCx:DMC(1-2x) between 880-940 cm-1 for different
electrolyte compositions (x= 0.25, 0.33, 0.45, and 0.50).
Figure 33. Capacity versus cycle number for MWA200 (green inverted triangles), MWA200500 (red
triangles), DMWBTMA (black circles), DMWTEA (blue squares) (left), and capacity versus cycle number
of DMWBTMA (black circles) and DMWTEA (blue squares) (right) all cycled at C/15-rate. (I)
Figure 34. Typical behaviour of the anatase TiO2 anode material (MW200500) between 1-3 V vs. Li+/Li°.
Figure 35. (a) 1st cycle voltage vs. normalized capacity profiles for HC using 1 M NaClO4 in EC:PC:DMC
electrolytes with various amounts of DMC recorded at C/20-rate, (b) discharge capacity and (c)
coulombic efficiency vs. cycle number for the corresponding half-cells.
Figure 36. (a) Coulombic efficiency and discharge capacity vs. cycle number for HC electrodes tested
at C/10, C/5, 1C, and 2C-rates and a EC0.45:PC0.45:Pyr13TFSI0.10 electrolyte and (b) Potential vs. capacity
profiles at different C-rates for HC and a EC0.45:PC0.45:Pyr13TFSI0.10 electrolyte.
Figure 37. (a) Voltage vs. capacity profiles for HC ||NVPF full SIB cells cycled with 1 M NaPF6 or 1 M NaClO4 in EC0.45:PC0.45:DMC0.1 electrolytes recorded at C/5-rate (b) Voltage vs. capacity profiles for HC || NVPF full SIB cells cycled with 1 M NaPF6 in EC0.45:PC0.45:DMC0.10 electrolytes at different C-rates.

ix
List of Tables
Table 1. Worldwide primary energy supply, final energy consumption, and electricity generation
between 1973 and 2012.
Table 2. Comparison of lithium and sodium resources and the main electrochemical properties.
Table 3. Comparison of cell voltages, typical electrode materials, and resulting approximate energy
densities at the cell level for the NiMH, LIB, and SIB technologies.
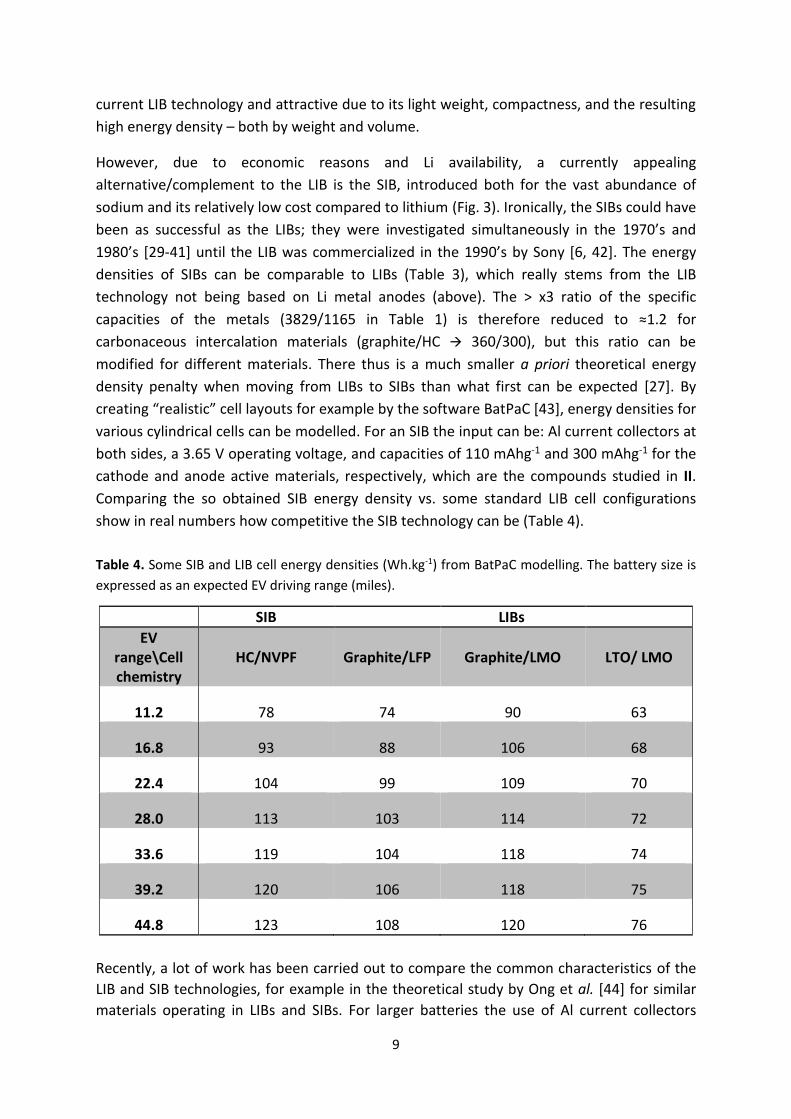
Table 4. Some SIB and LIB cell energy densities (Wh.kg-1) from BatPaC modelling. The battery size is
expressed as an expected EV driving range (miles).
Table 5. Summary of SIB anode materials with potentials of insertion and specific capacities (* = for
first charge/discharge cycle).
Table 6. Some SIB cathode materials with potentials for sodium insertion and resulting specific
capacities.
Table 7. Comparison of different SIB electrolyte concepts.
Table 8. Linear and cyclic carbonate solvents for battery electrolytes.
Table 9. Conductivity (σ), viscosity (η), ESW, and thermal stability of common SIB electrolytes.
Table 10. Molecular vibration modes with their characteristics. The + and - signs correspond to
movements vs. the plane.
Table 11. Functional groups/vibration modes and their approximate positions in a Raman spectrum.
Table 12. Associated vibrational modes to bands used in the analysis of hybrid electrolytes.
Table 13. Solvation number analysis of hybrid electrolytes for two different types of ILs.

x
Table of Contents
Abstract ........................................................................................................................................ i
List of Appended Papers ............................................................................................................... ii
Additional Publication Not Included in the Thesis ........................................................................ iii
My Contribution to the Appended Papers .................................................................................... iv
List of Acronyms .......................................................................................................................... v
List of Figures ............................................................................................................................. vii
List of Tables ............................................................................................................................... ix
1 Introduction ......................................................................................................................................... 1
2 Batteries ............................................................................................................................................... 5
2.1 General Concepts and the SIB ....................................................................................................... 8
2.2 SIB Electrodes .............................................................................................................................. 10
2.2.1 Anodes ............................................................................................................................... 10
2.2.1.1 Carbon Based Anodes ................................................................................................ 11
2.2.1.2 Non-carbonaceous Anodes ....................................................................................... 12
2.2.2 Cathodes ............................................................................................................................ 13
2.3 Electrolytes .................................................................................................................................. 15
2.3.1 Organic Solvents Based Electrolytes .................................................................................... 17
2.3.2 Ionic Liquids ......................................................................................................................... 19
2.3.2.1 Ionic Liquid Based Electrolytes .................................................................................. 20
2.3.3 Hybrid Electrolytes .............................................................................................................. 21
2.4 Electrode/Electrolyte Interfaces ................................................................................................ 22
2.4.1 The Solid Electrode Interphase (SEI) and the Solid Permeable Interface (SPI) ................... 22
2.5 Safety Concerns ........................................................................................................................... 24
3 Experimental Methods ...................................................................................................................... 25
3.1 Dielectric Spectroscopy ............................................................................................................... 25
3.1.1 Data Interpretation ............................................................................................................ 27
3.2 Raman Spectroscopy ................................................................................................................... 29
3.2.1 Theory of Raman Scattering ............................................................................................... 29
3.2.1.1 Classical Wave Interpretation ................................................................................... 29

xi
3.2.1.1 Quantum Particle Theory .......................................................................................... 31
3.2.2 Molecular Vibrations .......................................................................................................... 33
3.2.3 Raman Data Interpretation ................................................................................................ 34
3.3 Differential Scanning Calorimetry (DSC) ..................................................................................... 37
3.3.1 Theoretical Foundation ...................................................................................................... 37
3.3.2 DSC Data Interpretation ..................................................................................................... 39
3.4 Microwave Synthesis .................................................................................................................. 39
3.4.1 Microwaves and Electrode Synthesis ................................................................................ 40
3.5 Cyclic Voltammetry (CV) ............................................................................................................. 41
3.5.1 Theoretical Foundation ..................................................................................................... 42
3.5.2 CV Data Interpretation ...................................................................................................... 44
3.6 Chronopotentiometry ................................................................................................................ 45
3.7 Safety Assessments .................................................................................................................... 46
3.7.1 Flash Point (FP) .................................................................................................................. 46
3.7.2 Ignition Time (IT) ............................................................................................................... 47
3.7.3 Self-Extinguishing Time (SET) ............................................................................................. 47
4 Results and Discussions ..................................................................................................................... 49
4.1 Physical Properties of IL Based SIB Electrolytes ......................................................................... 49
4.2 Sodium Ion Solvation and Coordination .................................................................................... 53
4.3 Electrode Synthesis and SIB Performance ................................................................................. 56
5 Conclusions and Outlook .................................................................................................................. 61
Acknowledgements .............................................................................................................................. 63
Bibliography.......................................................................................................................................... 64

xii

1
1 Introduction
In 1760, the occidental world witnessed a turning point which had a major impact on the standard of living for the general population. It is known as the “1st industrial revolution” and lasted until 1840 [1]. During this period, the industry moved from hand production methods to machines, developed new chemical manufacturing and iron production processes, improved efficiency of water power, saw the increasing use of steam power, and worked on the development of machine tools. The use of wood and bio-fuels was replaced by coal, nowadays coined a “fossil” fuel. The use of petroleum as it is known today started in 1840 with the “2nd industrial revolution” and helped the development of textile and chemical industries, and later on the automotive industry [2, 3]. Unfortunately, this quick energy race initiated industrial pollutions that severely impacted public health. The first catastrophe happened in London in 1873 when numerous “killer fogs” caused over 1150 deaths in only three days from severe air pollution due to coal burning. Aside sanitary concerns, later on climate modifications and the new global awareness of CO2 emissions and levels and greenhouse gases in general were seriously discussed in for example 1992 with the establishment of the Kyoto protocol. But as of today 2016 has just started and have the Kyoto protocol directives really been followed? As an example, the air in Beijing is so polluted due to the extensive use of coal that breathing damages the lungs as much as smoking 40 cigarettes a day and at the same time the pollution overall kills 4000 people every day in China [4]. Moreover, the global CO2 emissions by fuel consumption have more than doubled since 1973 (Fig. 1) [5].
Figure 1. Worldwide CO2 emissions by fuel consumption in 1973 and 2012.
Another issue is the world energy consumption (WEC) i.e. the total energy used by the human civilization per year including every energy source used in the industrial and technologic sectors world-wide. The energy partition shows fossil fuel based energy (coal, natural gas, oil) to still be close to 70% of the WEC in 2012 (Fig. 2) [5]. Also the final energy consumption (energy after processed into usable forms) and electricity generation reveal large increases over the years (Table 1). Facing an inevitable fossil fuel depletion, research towards electrical energy storage for renewable and variable energy has been intensified the past 20 years. In this context, secondary batteries have rapidly evolved since the early 1990’s due to the boost of mobile electronics [6] and are today part of our everyday lives [7-9]. This technology can partially solve the urge for balancing renewable and green energy, with a focus on large scale applications, in particular by storing the energy from solar cells and wind turbines. It is thus an absolute current necessity to improve and develop new

2
energy storage technologies and materials suitable for high performance devices to satisfy the increasing market demand.
Figure 2. Worldwide energy repartition (a, b) and oil consumption (c, d) by sector in 1973 and 2012.
Table 1. Worldwide primary energy supply, final energy consumption, and electricity generation
between 1973 and 2012.
The lithium-ion battery (LIB) technology is currently the energy storage technology of choice
for hybrid and fully electric vehicles (EVs), and is starting to play a role also for large scale
energy storage. There are, however, numerous debates on the limited lithium supply and
the lithium consumption (Table 2 and Fig. 3), and thus it is useful to put forth
complementary electric energy storage technologies [12-14]. As an example, the Chevrolet
Volt plug-in hybrid electric vehicle (PHEV) with a 17.1 kWh LIB necessitates 3 kg of raw
Li2CO3 (≈ 440 g of Li). Based on the annual world production of Li2CO3 it would be possible to
Year Primary energy
supply Final energy consumption
Electricity generation
Ref.
1973 71013 54335 6129 [5]
1990 102569 - 11821 [5]
2000 117687 - 15395 [5]
2010 147899 100914 21431 [10]
2011 152504 103716 22126 [11]
2012 155505 104426 22668 [5]

3
build ca. 12,350,000 such PHEVs a year. This figure is far from the total of 67,000,000 cars
produced in 2014 [15]. Moreover, this does not take into account the still growing portable
electronics market, large electric storage facilities, ceramics industry, or the growing
pharmaceutical need for lithium, all severely reducing the amount of lithium available [16].
They also do not include the growing commercial vehicle demand for electrification. In all,
these factors will modify the price tag for all materials, not only Li2CO3, needed to construct
the energy storage (Fig. 3).
Table 2. Comparison of lithium and sodium resources and the main electrochemical properties.
Sodium based battery technologies were seriously considered in the 1970’s and 1980’s prior to the emergence of the LIB concept in the 1990´s, but why? Sodium (Na) is ranked as the 4th most abundant element on Earth [16] and its derivatives are massively produced and consumed (Fig. 3) around the world for various applications such as basic chemicals (sodium bicarbonate, sodium chromates, sodium phosphates, and sodium silicates), and glass containers for beverages, household products, food, liquor, medical products, toiletries and cosmetics, as well as in soaps and detergents. Chemically, Li and Na are close and the similarities should ease a technological change from LIBs to sodium-ion batteries (SIBs). Therefore SIBs have been intensively “re-studied” the past decades and seem to be technologically viable. In Table 3 three secondary battery technologies are compared; SIBs, nickel-metal hydride (NiMH) batteries, and LIBs. The cell voltage and the energy density are two characteristics discussed in the following section.
Lithium (Li2CO3) Property Sodium (Soda Ash)
37 [16] World Production
(thousands of metric tons) 52,000 [16]
13,000 [16] World reserves
(thousands of metric tons) 24,000,000 [16]
39,500 [16] World resources
(thousands of metric tons) >50,000,000 [16]
4500 [16] Price
($ton-1) 155 [16]
3829 [17] Theoretical capacity (Metal)
(mAhg-1) 1165 [17]
0 Electrochemical Potential E0
(V vs. Li+/Li°) 0.3 [17]

4
Figure 3. Price and consumption evolution of Li2CO3 and soda ash during the 20th Century.
Table 3. Comparison of cell voltages, typical electrode materials, and resulting approximate energy
densities at the cell level for the NiMH, LIB, and SIB technologies.
Property\Battery technology NiMH [18, 19] LIB [9, 20] SIB [21, 22]
Nominal voltage [V] 1.20 3.70 3.65
Anode material H in TiNi2 Graphite Hard Carbon
Cathode material NiOOH LiCoO2 or
Li(NixCoyAlz)O2 (NCA)
Na3V2(PO4)2F3 (NVPF)
Energy density [Wh.kg-1] 30-80 175-240 78-365

5
2 Batteries
When it comes to storing energy, secondary batteries converting chemical energy into
electrical energy – and vice versa – are one of the most efficient devices (far beyond
hydraulic and thermal storage). A battery is an electrochemical device composed of one or
more electrochemical cells that can be assembled both in parallel and series depending on
the currents and voltages desired. Historically, Alessandro Volta two centuries ago
constructed the first battery [23], later known as the voltaic cell, based on copper and zinc
plates and with an electrolyte made of brine. However, Volta did not realize that the
operation of the cell was the result of redox (reduction-oxidation) reactions, but rather used
an obsolete scientific theory known as contact tension to justify the current as a result of
two materials simply touching each other [23].
But what are redox reactions? Redox reactions include all chemical reactions in which the
oxidation states of atoms change – and thus involve the transfer of electrons between
species. By definition oxidation is an increase in oxidation state by a molecule, atom, or ion,
while reduction is a decrease in oxidation state. This concept is the basis of all
electrochemistry.
Figure 4. Schematic illustration of an SIB with E1 and E2 being the electrode potentials and e-
electrons. The signs are using the galvanic cell convention (anode = negative electrode).
Two electrodes and an electrolyte is the basic composition of all electrochemical cells. If the
electrolyte is liquid, a porous separator (membrane) can be used to allow the ion transport
while avoiding short circuit by direct contact between the electrodes. The use of a separator
can be avoided by having a large enough distance between the electrodes i.e. two wires in a
beaker, but this large excess of electrolyte makes the whole system less efficient. Battery

6
technologies using solid polymer, gel polymer, or ceramic electrolytes are not in need of
separate separators [9, 24].
The electrodes are usually a composite of several materials making the final product
mechanically stable and electrochemically performing; the active electrode material itself,
some sort of carbon added to enhance electronic conductivity, and a binder to hold all
together [25]. The crystal structure of the active electrode material and its composition
determines the electrochemical potential of the material/electrode. By definition “cathode”
and “anode” are the positive and negative electrodes, respectively, for a secondary battery.
The anode/cathode designation is switching depending on whether the battery is charging
or discharging, while the negative/positive nomination remains unchanged. As soon as the
two electrodes with potentials of E1 and E2, respectively, are connected by an external
circuit, the difference in potential between the electrodes (Ecell = E1-E2) causes electrons to
flow spontaneously from the more negative to the more positive potential (Fig. 4) – which
can be used to drive a device. The cell maintains charge balance by the internal ionic
transfer within the electrolyte. All is a result of an overall process where the system releases
Gibbs free energy (ΔG) [26] (Eq. 1) and moves to a thermodynamically more stable state:
𝛥𝐺 = −𝑛𝐹𝐸𝑐𝑒𝑙𝑙 (1)
where n is the number of electron transferred, F is the Faraday’s constant, and Ecell the
electrochemical potential difference.
Usually, the specific capacity (C) is extracted from a plot such as presented in Fig. 5 by the
following relation:
𝐶 =𝑛𝐹
𝑀𝑤 3.6 (2)
where Mw is the molar weight of the active electrode material (in g/mol) in the cell’s native
assembled state (charged or discharged), and C the specific capacity expressed in mAhg-1.
7
Figure 5. GCPL data at different C-rates for a cell based on a HC WE, a Na metal CE/RE and 0.8 m
NaTFSI in EC0.45:PC0.45:Pyr13TFSI0.10 as the electrolyte.
The electrochemical stability is very important as the materials used should not be degraded
during cycling. The electrochemical stability window (ESW) is the voltage range within which
a battery can operate without detrimental decomposition of the electrolyte or any of the
electrodes.
When comparing the capacities of the charge and the discharge of an electrochemical cell,
the coulombic efficiency can be calculated which ideally should be as close as possible to
100%, in practical cells this often reaches 99.99%. However, this efficiency must not be
taken as the single parameter to measure the performance of the cell and its evolution upon
cycling. Indeed, a cell where the electrodes are damaged by side reactions would exhibit a
gradual decrease in capacity, but may still have high coulombic efficiency if the products can
be further oxidized/reduced.
The specific capacity furthermore depends on the kinetics of the electrode reactions: the C-
rate. For redox reactions involving insertion of ions in the electrode active material, a C-rate
of C/5 for example corresponds to the insertion of 1 mole of ions (for instance Na+ or Li+) in
5 hours. The dependence of the specific capacity of a material on the C-rate is typically
shown in a Ragone plot (Fig. 6).
Based on the capacities of the cathode and the anode a balanced assembly of a full cell is
possible. As an example: with anode and cathode materials of specific capacities of 80
mAhg-1 and 160 mAhg-1, respectively, twice the amount of the anode material as compared
to the cathode material (by weight) is needed. This calculation is, however, based only on
the active materials, why the amount of the “real” anodes and cathodes may differ
substantially, as a result of possible different percent of active materials in each case.

8
The difference in potential between the two electrodes, together with the specific capacity
of the balanced full cell defines the theoretical specific energy i.e. the maximum amount of
energy stored per mass [18]:
𝑇ℎ𝑒𝑜𝑟𝑒𝑡𝑖𝑐𝑎𝑙 𝑠𝑝𝑒𝑐𝑖𝑓𝑖𝑐 𝑒𝑛𝑒𝑟𝑔𝑦 = −𝛥𝐺
∑ 𝑀𝑤= 𝐶 𝐸𝑐𝑒𝑙𝑙 (3)
Figure 6. Ragone plot of the specific capacity of HC as function of the C-rate using electrolytes from
papers II and V.
2.1 General Concepts and the SIB
The secondary lithium battery beginnings were extremely promising, as the theoretical
specific capacity of a lithium metal anode is very large: 3860 mAhg-1 [27] (Table 2).
Unfortunately, the uneven deposition of lithium during cycling, ultimately resulting in
dangerous dendrite growth, made them unsuitable for any commercial applications [7]. An
early idea was to substitute the Li metal anode by an alloy with aluminum, these electrodes,
however, have a short life-time due to large volumetric expansion upon cycling [28]. In the
end, the metallic lithium anode was substituted by a much safer insertion material,
graphite, operating at low potential [6]. This concept was coined “rocking-chair”, as the
lithium now “rocks” between two intercalation electrodes. This is still the basis of the
9
current LIB technology and attractive due to its light weight, compactness, and the resulting
high energy density – both by weight and volume.
However, due to economic reasons and Li availability, a currently appealing
alternative/complement to the LIB is the SIB, introduced both for the vast abundance of
sodium and its relatively low cost compared to lithium (Fig. 3). Ironically, the SIBs could have
been as successful as the LIBs; they were investigated simultaneously in the 1970’s and
1980’s [29-41] until the LIB was commercialized in the 1990’s by Sony [6, 42]. The energy
densities of SIBs can be comparable to LIBs (Table 3), which really stems from the LIB
technology not being based on Li metal anodes (above). The > x3 ratio of the specific
capacities of the metals (3829/1165 in Table 1) is therefore reduced to ≈1.2 for
carbonaceous intercalation materials (graphite/HC 360/300), but this ratio can be
modified for different materials. There thus is a much smaller a priori theoretical energy
density penalty when moving from LIBs to SIBs than what first can be expected [27]. By
creating “realistic” cell layouts for example by the software BatPaC [43], energy densities for
various cylindrical cells can be modelled. For an SIB the input can be: Al current collectors at
both sides, a 3.65 V operating voltage, and capacities of 110 mAhg-1 and 300 mAhg-1 for the
cathode and anode active materials, respectively, which are the compounds studied in II.
Comparing the so obtained SIB energy density vs. some standard LIB cell configurations
show in real numbers how competitive the SIB technology can be (Table 4).
Table 4. Some SIB and LIB cell energy densities (Wh.kg-1) from BatPaC modelling. The battery size is
expressed as an expected EV driving range (miles).
Recently, a lot of work has been carried out to compare the common characteristics of the
LIB and SIB technologies, for example in the theoretical study by Ong et al. [44] for similar
materials operating in LIBs and SIBs. For larger batteries the use of Al current collectors
SIB LIBs
EV range\Cell chemistry
HC/NVPF Graphite/LFP Graphite/LMO LTO/ LMO
11.2 78 74 90 63
16.8 93 88 106 68
22.4 104 99 109 70
28.0 113 103 114 72
33.6 119 104 118 74
39.2 120 106 118 75
44.8 123 108 120 76

10
(rather than Cu) means a significantly reduced mass as larger batteries involve relatively
larger mass of current collectors. The numbers presented in Table 4 are more or less based
on bench-scale results applied rudimentary to “the world of real batteries”, and do not
include e.g. life-length, safety, or fabrication issues. Yet, they serve to disprove the
“common belief” that SIBs intrinsically have worse energy densities than LIBs – a
misunderstanding based on the potential difference between the Li and Na metals of ca. 0.3
V and their different capacities (Table 3).
2.2 SIB Electrodes
2.2.1 Anodes
As compared to lithium metal, it is even more problematic to use sodium metal based anodes as the melting point is relatively low (98°C) [17]. Therefore, alternative anode materials were early studied, in most cases similar to those investigated for LIBs, and a small overview is presented in Table 5. Most early SIB studies envisaged to use graphite, the typical LIB anode due to its high capacity (372 mAhg-1), low potential (<0.1 V vs. Li+/Li°), and high stability [45-47]. Unfortunately, sodium does not intercalate efficiently in graphite [48], often explained in terms of thermodynamics [45-47].
Table 5. Summary of SIB anode materials with potentials of insertion and specific capacities (* = for
first charge/discharge cycle).
Anode materials Potential of
insertion [V vs. Na+/Na°]
Capacity [mAhg-1]
Reference
Hard carbon 0.005 300 [49] Hard carbon C1600 0.005 416 [50]
Na2Ti3O7 0.3 178 [51] TiO2 1.5 150 [52]
NiCo2O4 > 2.0 200 [53] Sb2O4 0.5 800 [54]
SnSb/C 0.2 544 [55] NaTi2(PO4)3 2.1 130 [56]
Ni3S2 0.8 400 [57] MoS2 1.2 1000 [58] SnS/C 1.2 1050 [59] SnS2/C 1.2 750 [59] Sn4P3 < 1.0 800 [60] NiP3 0.4 1000 [61]
Na15Sn4 < 0.2 847 [62, 63] Na3Sb 0.7 660 [63] Fe3O4* 1.1 643/366 [64] Fe2O3* 1.0 618/200 [65, 66]
α – MoO3* 1.4 771/410 [67] CuO* 0.8 935/640 [68]
Na2C8H4O4 0.29 250 [69]

11
2.2.1.1 Carbon Based Anodes
While graphite thus cannot be used [48], other kinds of carbon based electrodes have been
extensively investigated. In 1993, carbon based sodium intercalation materials such as
petroleum coke (maximum Na content = NaC30) and Shawinigan black (NaC15) were
examined by Doeff et al. [70] and cycled using PEO-NaCF3SO3 electrolytes [71]. The resulting
SIB had a capacity of 85 mAhg-1, at the time the highest value ever reported for
electrochemical intercalation of Na using carbonaceous materials [70].
While the above SIB used a polymer electrolyte, the use of liquid electrolytes with SIBs
became successful first when hard carbon (HC) was used as the anode by Prof. Dahn’s group
[49]. HC is a non-graphitizable carbon with inherent nano-porosity due to the random
stacking of graphene sheets and with pores on the order of the size of the graphene sheets
(Fig.7). HC is at the moment the standard negative electrode of SIBs. Its disordered structure
allows sodium ions to be intercalated in the structure from any direction at the same time
as it exhibits a good reversibility. It has been recently synthesized from pyrolysis of sugar
and exhibit a theoretical capacity of 300 mAhg-1 [72]. Moreover, HC has a very low potential
of insertion (ca. 0.005 V vs. Na+/Na°) [70, 73-75]. This ensures a viability to create high
energy density SIB cells with high potential cathodes, but can also be a disadvantage; a high
current may force plating of metallic Na which makes the cell unstable and unsafe.
Figure 7. Schematic of the intercalation of sodium into HC (left) vs. lithium into graphite (right).
Recently, a new of HC called “C1600”, fabricated from an organic polymer with an aromatic
ring and heat-treated in non-reactive gas at 1600°C with a specific surface area of about
10 m2g−1 was studied in SIBs utilizing different electrolytes [76]. The best performance was
obtained using NaClO4 in EC:DMC as the electrolyte, giving an initial capacity of 413 mAhg-1,
50 cycles, and being more thermally stable than its Li analogue [50].

12
2.2.1.2 Non-Carbonaceous Anodes
Alternatives to the carbonaceous materials have been investigated during the last decade
and several metal alloys and oxides with high capacities and cyclabilities have been reported
(Table 5). Titanium oxides based have been explored [54, 56, 77-80] [51], with the
prominent example being Na2Ti3O7 with good cyclability and coulombic efficiency and a
potential of insertion at 0.3 V vs. Na+/Na°, and the option of two Na to be reversibly
extracted and inserted into the structure. The main drawback is a high capacity fading upon
cycling. As a comparison, layered NaTiO2 is electrochemically active at ca. 1 V vs. Na+/Na°
allowing the insertion of only 0.3-0.5 Na [77] and TiO2 in the form of amorphous nanowires
can be cycled at ca. 1.5 V vs. Na+/Na° and 0.4 Na at best [52]. An insertion potential of 1.5 V
vs. Na+/Na° is, however, too high for the cathodes available; the cell voltage becomes too
low. NaTi2(PO4)3, also a titanium based anode material, has a insertion potential even
higher, ca. 2.7 V vs. Na+/Na°.
Besides the titanium oxides, compounds exhibiting a redox mechanism not based on the
insertion of ions in the structure, but in its complete transformation (“conversion
reactions”) have been extensively studied. These materials always involve multiple electron
reactions, which translate into high specific capacities, yet the voltage hysteresis between
oxidation and reduction is a handicap. LIB and SIB conversion reaction materials share these
same features.
Oxide materials electrochemically forming alloys with sodium upon cycling, such as Sb2O4,
display high specific capacities, but have stability issues due to their high volumetric
expansion upon alloying. This problem may be alleviated, for example SnO2 nanoparticles
embedded in a soft-templated mesoporous carbon framework have been shown to exhibit
even better performance in SIB than in LIB cells [81]. In total these anodes show an efficient
alloying/dealloying mechanism, a low reaction potential vs. Na+/Na°, a high theoretical
capacity (ca. 667 mAhg-1), a low cost, and are environmental benign [81-83]. Also, the
cycling ability, capacity retention and coulombic efficiency was proven for more than 2000
cycles at a high current density. As for other materials layered sulphides have been used
[30, 33, 84, 85] and present up to 400 mAhg-1 at 0.84 V vs. Na+/Na°, but with very bad
cyclability [57, 86], while intermetallic or alloy materials (Sn/C, SnSb/C) have shown
capacities of up to 544 mAhg-1 [55, 87], but the large volumetric expansions of these
materials is yet a hurdle to overcome.
At last, SIB anodes based on organic compounds have shown some promise; for example
disodium terephthalate (Na2C8H4O4) has a specific capacity of 250-350 mAhg-1 at an
insertion potential of 0.29 V vs. Na+/Na° [69, 88]. Benzenediacrylates show relatively low
capacities of 45-50 mAhg-1 though constant for more than 100 cycles [89].

13
2.2.2 Cathodes
The cathode material usually has Na in its composition, thus serving the SIB with the needed
Na+ charge carriers and leading to the cell being assembled in the discharged state. These
Na are thus always extracted during the first charge, typically at high potential. SIB cathode
materials have been extensively studied in parallel to the various SIB anode materials –
several reviews exist [17, 34, 90-93].
Layered sodium transition oxides, NaxMO2 (M=transition metals) are promising candidates
for positive electrodes, sharing properties with their Li counterparts. The crystal structures
are built up by stacking sheets of edge-sharing MO6 octahedra and a notation was
developed by Delmas et al. [31] based on the coordination of Na ions in the interlayer space.
Two main structures have shown attractive electrochemical capacities, i.e. the O3-type and
the P2-type, where Na exhibit octahedral (O) and prismatic (P) coordination, respectively.
However, the P2-type cannot be stabilised with a Na stoichiometry larger than Na2/3MO2
[94]. Even if early studies from the 1970-1980’s of sodium containing layered electrodes can
be found for NaxMnO2 and NaxCoO2 [36, 37], the studies of layered oxides for SIBs was
greatly facilitated by the numerous earlier studies made on LIB materials such as LiCoO2 and
NMC. Hence, since the revival of SIBs by ca. 2010, many research groups have aimed to
improve the intercalation properties and the cycling performance of Na layered electrodes,
with a consistent argument being the LIB vs. SIB comparisons/similarities. Some properties,
such as the diffusion barriers of ions in XCoO2 (X=Li,Na) and the mechanical stability of O3-
XMO2, are in favour of SIBs as shown by Ceder et al. [44]. Another advantage of the use of
sodium is related to chromium phases (XCrO2), where the Li electrode is electrochemically
inactive while the Na electrode displays a reversible capacity of 120 mAhg-1 at 3 V vs.
Na+/Na° [95]. Layered electrodes with large capacities have recently been synthesized
where the O3 and P2 phases can be directly compared. As an example, O3-Na[Fe1/2Mn1/2]O2
and P2-Na2/3[Fe1/2Mn1/2]O2 revealed the O3 and P2 phases to have capacities of 110 mAhg-1
and 190 mAhg-1, respectively [96], while the Na analogue of NMC (Na[Ni1/3Mn1/3Co1/3]O2)
(O3-type) showed a capacity of 100 mAhg-1 (vs. 120 mAhg-1 for Li) and cycling stability for
150 cycles [97].
In addition to layered structures, 3D polyanionic frameworks, with the advantage of
enhanced structural stability, have also been studied as cathode materials for SIBs [98]The
olivine structured LiFePO4 is successfully used in commercial LIB cells, while for SIBs,
NaFePO4 exhibit maricite structure, electrochemically inactive, although the olivine
polymorph can be prepared from the lithium analogue. As alternatives, vanadium based
cathode materials have been studied, such as the NASICON (Na Super Ionic CONductor)
structure NaxV2(PO4)3 (NVP). NVP was initially synthesised by Delmas et al. [99] and exhibits
interesting electrochemical properties; two plateaus are observed at 3.4 V and 1.6 V vs.
Na+/Na° associated with the V4+/V3+ and V3+/V2+ redox reactions, respectively, in total
allowing the extraction of 1.7 Na. Studies made utilizing the window 2.7-3.8 V vs. Na+/Na°

14
have shown that it is possible to obtain a capacity of 93 mAhg-1 with excellent cyclability
[100]. We cycled NVP with our IL based electrolytes between 2.7-3.6 V vs. Na+/Na° and
obtained a capacity of ca. 80 mAhg-1 at a C/10 rate. The voltage range had to be reduced
due to the decomposition of the electrolyte at high voltages, hence the somewhat lower
capacity.
Table 6. Some SIB cathode materials with potentials for sodium insertion and resulting specific
capacities.
Cathode materials Potential of
insertion [V vs. Na+/Na°]
Specific Capacity [mAhg-1]
Reference
NaCrO2 3.0 125 [95] NaNi0.5Mn0.5O2 N/A 130 [43]
O3-NaVO2 2.5 120 [101] Na0.33V2O5 1.5-4.0 142 [102]
Na3V2(PO4)3 1.6 & 3.6 93-116 [99, 103] Na3V2(PO4)2F3 3.7 & 4.2 120 [104]
NaFeF3 1.5-4.5 150 [105] NaFePO4 2.5 120 [106] NaMnO2 2.63 185-190 [107-109] NaFeO2 3.3 85 [110] ϒ-Fe2O2 2.0 189 [80]
Na0.45Ni0.22Co0.11Mn0.66O2 4.2 135 [111] Na0.67Mn0.65Fe0.2Ni0.15O2 2.0 & 3.8 208 [112]
NaNi0.5Ti0.5O2 3.1 121 [113] Na2Fe2(SO4)3 3.8 100 [114] Na2FePO4F 3 89 [115]
NaVPO4 3.3 98 [116] Na(VO)2(PO4)2F 3.3, 3.6 & 4.0 105 [117] Na3MnCO3PO4 3.7 191 [118]
Na4Co3(PO4)P2O7 4.1-4.7 95 [119] Na7V4(P2O7)4PO4 3.9 82 [120]
NaMnFe(CN)6 3.0 134 [121]
Na3V2(PO4)2F3, or NVPF [122, 123], is a related 3D structure compound initially reported by
Barker et al. [124] where VPO4 was used as an intermediate phase (see Eq. 4).
(1) 1
2𝑉2𝑂5 + (𝑁𝐻4)2𝐻𝑃𝑂4 + 𝐶𝑠𝑝 →
3
2𝐻2𝑂 + 𝐶𝑂 + 𝑐 𝑉𝑃𝑂4 + 2𝑁𝐻3
(2) 2𝑐 𝑉𝑃𝑂4 + 3𝑁𝑎𝐹 → 𝑁𝑎3𝑉2(𝑃𝑂4)2𝐹3 (4)
The resulting crystal structure is a 3D framework of corner sharing (V2O8F3) bi-octahedral
and (PO4) tetrahedral units connected through oxygen atoms. NVPF exhibits two plateaus at
3.7 and 4.2 V, thus on average 3.95 V, and these both correspond to the redox couple
15
V4+/V3+. The capacity observed is higher than for NVP, ca. 120 mAhg-1 [104], and can thus be
coupled to HC to build a promising full SIB with a larger energy density than so far reached
for HC|NVP [21]. In III, NVPF is used as the cathode with organic solvent based electrolytes.
In contrast to NVP, decomposition of the IL based electrolytes tested occurred with NVPF at
potentials higher than 3.6 V vs. Na+/Na°. In the following sub-chapter the different types of
electrolytes available and their impact on the electrodes and the SIB in total will be outlined.
2.3 Electrolytes
Electrolytes are just as important as the electrodes and an indispensable part of the SIBs.
They usually consist of a combination of a sodium salt with a solvent or a solid – polymeric
or ceramic, allowing the conduction of sodium ions from one electrode to another. For
liquid electrolytes the ionic conductivity can be described by the Vogel-Tammann-Fulcher
(VTF) [125-127] derived equation:
𝜎 = 𝜎0 ∙ exp (−𝐵
𝑇−𝑇0) (4)
Where σ is the ionic conductivity, T0 a temperature associated with the glass transition
temperature (Tg), σ0 is the ionic conductivity at T0, T is the absolute temperature, and B is
the activation energy. As a comparison, polymers can follow either an Arrhenius (Eq. 5) or a
VTF trend depending on the conduction mechanism [128, 129]. The Arrhenius equation:
𝜎 = 𝜎0exp (−𝐸𝑎
𝑘𝐵𝑇) (5)
where σ0 is the conductivity at infinite T, Ea is the activation energy, kB the Boltzmann
constant, and T the temperature.
𝜎 can also be expressed as a function of the number of ions (ni), their mobilities (μi), and
their charge (qi) (Eq. 6) – the equation of total conductivity:
𝜎 = ∑ 𝑛𝑖𝑞𝑖𝜇𝑖𝑖 (6)
The ionic conductivity is in practice expected to need to be > 1 mScm-1 to facilitate ionic
transport and acceptable rate capability, and the SIB electrolytes utterly need to show low
electronic conductivities, act over a wide temperature range, and have large operative ESWs
– ideally exceeding both insertion potentials of the electrodes. At last, it is also important
that they exhibit generally appealing features for technological materials such as non-
toxicity, environmental “friendliness”, and low cost [130]. There are several types of
electrolyte concepts possible for SIBs, often based on the type of matrix used (Table 7).

16
Table 7. Comparison of different SIB electrolyte concepts.
Liquid Polymer Gel Polymer Ceramic IL
Example 1M NaClO4
in EC:PC:DMC
NaTFSI in PEO
NaCF3SO3 in Succinonitrile/PEO
Na-Zr-Si-P-O
NaTFSI in BMImTFSI
ESW [V vs. Na+/Na°]
1-(4-5)
1-(4-5)
N/A
1-8
1-7.5
Thermal stability + ++ +++ +++ +++ Ionic
conductivity @RT [mScm-1]
100-1000 0.1 1 0.3-1 1-10
Flammability + ++ ++ +++ ++ Reference [21] [131] [132] [133] [134]
The most common concept, the organic solvent based liquid electrolytes (LEs) can
potentially be hazardous based on their flammability and leakage potential. Solid state
electrolytes such as the ceramic β’’-Al2O3, widely used in high-temperature Na-S batteries,
can potentially improve the safety for SIBs, while performing decently [135]. However, Na-S
cells themselves, in contrast to SIBs, operate at 270-350°C and contain molten sulphur,
sodium, and polysulphide compounds which are highly corrosive, can create toxic gases
such as H2S, and necessitates resistant containers, why this technology is inappropriate for
transportation [136].
Gel polymer electrolytes (GPEs) in general consist of a high dielectric organic solvent
containing a sodium salt, thus mainly a LE, immobilized in a polymer matrix host. Several
GPE formulations have been reported where the poly(ethylene oxide) (PEO) [131] and
poly(vinyl alcohol) (PVA) [137] based have received the most attention. The main advantage
of GPEs lies in the improvements of the ionic mobility compared to “dry” solid polymer
electrolytes (SPEs), due to the liquid-like conductivity mechanism. Moreover, compared to
LEs, GPEs have superior mechanical properties, and can allow faster charge/discharging and
higher power densities [138-140]. The main disadvantage as compared to LEs is the
relatively low ion permeability due to the polymeric structure lowering the ion mobility
[141, 142]. The main reason why LEs still dominates is the high conductivities: > 10 mScm-1.

17
2.3.1 Organic Solvent Based Electrolytes
A solvent is by definition a substance which can dissolve another substance - the solute. For
SIBs one or several organic solvents are used to dissolve a Na-salt to create a LE. Large
dielectric constants (ε) of the organic solvents ease the salt dissolution [143, 144] and hence
allow a larger concentration of metal cations to be present in the solution. In more detail,
the degree of ion dissociation is dependent of the interaction strength between the cation,
Li+ or Na+, and the anion, carefully chosen in order to optimize the electrolyte and improve
the conductance, and the cation-solvent interaction. The interaction between ions is by
simple definitions inversely proportional to ε and a high ε solvent thus eases salt
dissociation and increases the conductivity. As an example, the study of ion-ion interactions
by Barthel et al. revealed that decreasing the interactions by 14% increased the conductivity
by 440% [145]. Furthermore, comparing several sodium and lithium salts, it was shown by
density functional theory (DFT) calculations [146] that going from Li to Na decreases the ion-
pair dissociation energy by ca. 15-20%, thus Na based electrolytes based on the same salts
should be more conductive than the Li analogues. This assumption is based on most charge
carriers being metal cations (i.e. Li+, Na+), suggesting also a high cation transport number
(Eq. 7), but does not take into account different solvent shells etc.
𝑡+ =𝜇+
𝜇++𝜇− (7)
As the solvents arrange around Li+/Na+ creating a stable 1st solvation shell, the cations have
lower ionic mobilities impacting on the total conductivity. Moreover, Li+ and Na+ are not
necessarily coordinated similarly (III), [146]. Therefore, the benefit of a lower dissociation
energy can be lost due to the formation of a different solvation shell. The solvation shell is
characterized by a solvation number (SN), the number of solvents contributing, and the
coordination number (CN), often the same as the SN, being the number of interacting
atoms/groups. For instance, in LEs Li+ usually has a CN of 4 [147-149], supported both by
DFT calculations and experimentally, while Na+ seems to have a slightly larger CN of ca. 6 in
the same LE solvents (c.f. Table 8). Such low-level details influence the conduction of the
charge carriers through the electrolyte and thus the general performance of the SIB cells.
Historically, in the 1980’s, propylene carbonate (PC) was the most popular organic solvent
for both LIB and SIB LEs, mainly due to its high dielectric constant (Table 8) and large
thermal stability. However, to use PC with graphite for LIBs was shown to be problematic as
PC co-intercalates in between the graphene sheets causing an irreversible exfoliation
damaging the electrode structure [150]. Therefore, PC was replaced by ethylene carbonate
(EC), which in contrast assists in the formation of a protective passive layer on the top of the
graphite electrode avoiding any undesired structural modification —the solid electrolyte
interphase (SEI) (section 2.4). However, EC cannot be used as a single electrolyte solvent
due to its high melting point (ca. 36°C), and therefore usually mixed with linear or cyclic co-
solvents (Table 8) with lower melting points. For SIBs, where HC replaces graphite as the

18
anode (section 2.2.1) PC can be used without damaging the electrode. Therefore, it is not
surprising that PC still is present in ca. 60% of the electrolytes reported in research related
to SIBs [22].
Table 8. Linear and cyclic solvents used in battery electrolytes.
Solvents Melting
Point (°C) ε (25°C)
Linear
Dimethyl carbonate DMC
5 3.1
Diethyl carbonate
DEC
-74 2.8
Ethyl methyl carbonate
EMC
-53 3.0
Dimethoxyethane (G1)
DME -58 7.2
Cyclic
Ethylene carbonate
EC
36 89.8
Propylene carbonate
PC
-49 64.9
SIB LEs use the sodium salts NaClO4, NaTFSI, or NaPF6 dissolved in the solvents of Table 8 or
others, for instance triglyme (G3) [72, 110, 151, 152]. Some compositions of these solvents,
often binary or ternary, exhibit excellent properties and more details on their thermal
stabilities, conductivities, viscosities and electrochemical stability windows can be found in
the study by Ponrouch [153] (Table 9). For instance, Komaba et al. studied electrolyte
formulations using 1 M of NaClO4 in EC:DEC or EC:PC and proved these combinations to
outperform EC:DMC and EC:EMC based LEs in terms of conductivity [43]. A similar study
from Vidal-Abarca et al. [154] showed the EC:DEC combination to improve the battery cell
capacity and cyclability compared to sole PC as solvent. PC alone is thus in general not
recommended as the general performance such as the maximum capacity and capacity
retention decreases, while a mixture of EC and PC or/and another solvent can set a stable
environment for the battery cell. At last, a new electrolyte was recently proposed by Hu et
al. [155]; 1 M of sodium bis(fluorosulfonyl)imide (NaFSI) in pure PC offering high storage
performance for a HC|NVP cell.

19
Table 9. Conductivity (σ), viscosity (η), ESW, and thermal stability of common SIB electrolytes.
2.3.2 Ionic Liquids
Figure 8. An ion pair of the IL BMImBF4
Ionic liquids are defined as “salts with a melting point below 100°C”. ILs used as electrolytes
are usually based on quaternary ammonium cations, and characterized by negligible vapour
pressure and not flammable [156]. They exhibit high conductivities, wide liquid temperature
ranges, large electrochemical windows, as well as many properties for safer application
useful for any batteries [157, 158]. Room temperature ionic liquids (RTIL), having melting
points below RT (Fig.8), have been extensively studied the last decade for ambient battery
applications [158-162]. Still though, the room temperature performance of IL based
electrolytes is less than encouraging and much reduced as compared to organic electrolytes
even if the ionic conductivities reported seem appealing. Indeed, all ions present in the
electrolytes are participating to the conduction, but it is the cation transport (i.e. Na+/Li+)
Electrolytes 1 M Na-salt
σ [mS.cm-1]
η [cP]
ESW [V vs. Na+/Na°]
Thermal stability
[°C]
NaTFSI – PC 6.2 7.4 0.1 – 3.4
NaClO4 – PC 6.5 7.7 0.1 – 5.0
NaPF6 – PC 8.0 7.7 0.1 – 5.0 -89 – 244
NaClO4 – G3 3.6 10.1 0.1 – 4.8
NaClO4 – EC:DEC 6.4 5.1 0.1 – 5.0 -43 – 99
NaClO4 – EC:G3 6.7 8.4 1.0 – 4.5
NaClO4 – EC:PC 8.2 9.1 0.1 – 5.1 -87 – 244
NaClO4 – EC:DMC 10.3 4.4 0.1 – 5.0 -14 – 65
NaClO4 – EC:DME 12.6 4.0 0.1 – 3.9

20
that is necessary for the cell cycling. At last, by the synthesis of sodium 2,5,8,11-
tetraoxatridecan-13-oate (NaTOTO), an IL with a Na cation has been made [163, 164]
Caution has to be taken, however, on the “environmentally friendly” qualification which is
overly used in the battery field to justify the presence of ILs in electrolytes. Indeed, to be
qualified as environmental friendly, a chemical compound has to satisfy several criteria such
as the energy to manufacture, the cumulative energy demand, the impact on health and
environment among others. Unfortunately, ILs are often not greener than the solvents they
are supposed to replace. For instance, BMImBF4 needs more than 30 steps to be synthesised
and waste such as hydrogen fluoride (HF) is created [165]. Another study using several
criteria stated that ILs were the least environmental friendly solvents among 7 different
solvents [166]. Therefore, ILs should be considered for their safety and electrochemical
properties more than their environmental properties.
2.3.2.1 Ionic Liquid Based Electrolytes
For SIBs the use of ILs with a fraction of sodium salt as the electrolyte is at a very early stage
of research, but certainly worth studying. Our review (IV) on SIB electrolytes can be
consulted for more details [22]. Pyrrolidinium (Pyr) and imidazolium (Im) based RTILs stand
out amongst the most used ILs as matrices for SIB electrolytes; starting with Pyr based ILs,
Ding et al. [167] reported NaFSI in Pyr13FSI (2:8) to have conductivities of 3.2 and 15.6
mScm-1 at 298 and 353 K, respectively, and an anodic ESW limit of 5.2 V vs. Na+/Na°. The
same group carried electrochemical tests [168] as capacity and rate capability of a Na/NaFSI
in Pyr13FSI/NaCrO2 cell using an optimized salt/IL ratio of the electrolyte as cited above.
Additionally, they characterized several Pyr type ILs for SIBs using the FSI and TFSI anions
[169-171] and concluded that the FSI based had a higher oxidation potential limit. The
electrochemical study of NaFSI in Pyr13FSI cycled at 90°C with HC by Nohira et al., revealed a
reversible capacity of ca. 274 mAhg−1, while maintaining 95.5% of the first discharge
capacity after 50 cycles, with an impressive 99.9% coulombic efficiency [172, 173].
NaTFSI in Pyr14TFSI has been studied by Noor et al. [174] reporting ionic conductivities of 1-2
mScm-1 at RT, and an onset of the Na plating on a Cu electrode at -0.2 V vs. Na+/Na° which
can be explained by the high viscosity of the electrolyte (ca. 100cP) usually impacting the
mass transport properties in IL based electrolytes. 23Na NMR spectroscopy was used by the
same group to characterize basic properties and specifically the ion transport of NaTFSI in
Pyr13FSI [175], and a cell with this electrolyte cycled vs. Na metal at temperatures up to
100°C with stable plating/stripping CVs on a Ni electrode. A different group also studied
NaTFSI in Pyr14TFSI [176] and reported a conductivity of 1 mScm-1 in accordance with the
previous results. This was complemented with a DSC analysis showing that the electrolyte
remained liquid until -30°C. Moreover, in the introduction of a new IL, Pyr24TFSI, was
advertised for the near future.

21
Very recently, cyclability tests of 0.45 M NaTFSI in Pyr14FSI [111], being composed of both
TFSI and FSI anions, vs. a Na0.45Ni0.22Co0.11Mn0.66O2 electrode in half cells against Na metal
was shown to outperform a 0.5 M NaPF6 in PC. This result was ascribed to the FSI anion
assisting in the formation of a more stable SEI, (section 2.4.1) together with a higher stability
at high potentials. Furthermore, effects of salt concentration (0.1 – 1 M) and rate variation
(0.05 – 5 C) have been studied by Wongittharom et al. [177] using NaTFSI in Pyr14TFSI, and
revealed a promising capacity retention of 87% after 100 cycles, with the LE 1 M NaClO4 in
EC:DEC having 62% under the same conditions. Reducing the salt concentration to 0.5 M
provided the same capacity retention at 50°C, which tentatively means that the charge
carrier nature/balance is modified, as explained in III and V.
The other major class of ILs (Im based) was extensively studied in this thesis; basic physico-
chemical properties comparing EMImTFSI and BMImTFSI ILs doped with NaTFSI and LiTFSI
were investigated together with electrochemical properties useful for SIB application. A
more detailed summary can be found in Chapter 4 as well as in III and V. In addition, a
recent communication from Nohira’s group [178] used NaFSI in EMImFSI to evaluate
electrochemical and physical properties in a Na half-cell, and confirmed systems containing
FSI anions to present wider ESWs in comparison to TFSI based, as previously shown for Pyr
IL based electrolytes [169-171].
2.3.3 Hybrid Electrolytes
Organic solvents are highly flammable, presenting as safety risk, and ILs are usually highly
viscous, with negative impact on the ionic conductivity (Eq. 4, section 2.3) [179]. Hybrid
electrolytes with ILs as additives or co-solvents together with organic solvents appear to
enable both safer electrolytes and high conductivities. While studies of hybrid electrolytes
are at an early stage and mainly concern LIBs, the results are promising as performance and
safety are truly improved [179-187]. Guerfi et al. [179] have shown that adding 40 % of
EMImTFSI to a LE of 1 M LiPF6 EC:DEC negatively impacts on the cycling performance for
rates not exceeding 2C, but no significant conclusion was made on any safety
improvements. Balducci’s group [181, 185] carried out several experiments using Pyr14TFSI
as the IL together with LiTFSI in PC and showed these hybrid electrolytes to provide
comparable performance to traditional LEs together with a better thermal stability. For SIBs,
no studies have yet been made apart from V, where only 2 % of Pyr13TFSI or BMImTFSI
added was shown to increase the safety significantly.

22
2.4 Electrolyte/Electrode Interfaces
The performance of a battery can be improved by developing new electrode materials and
hundreds of such articles are published every year [9, 66, 92, 93, 188-191]. However, the
exclusive optimisation of electrodes is not enough to build a successful cell with improved
performance. While the high capacities associated to LIBs or SIBs strongly depend on the
architecture and electronic behaviour of the electrodes, the side reactions taking place at
the electrode/electrolyte interfaces can be the cause of low capacities and low coulombic
efficiencies. Usually, the theoretical limits of the ESW are defined by the lowest unoccupied
molecular orbital (LUMO) and the highest occupied molecular orbital (HOMO) of the
electrolyte. However, passivation layers formed on the surfaces of the electrodes can
kinetically extend these thermodynamic limits and increase the operative ESW (Fig. 9) The
next two sections will highlight the importance of the electrolyte/electrode interfaces.
2.4.1 The Solid Electrolyte Interphase (SEI) and the Solid Permeable
Interface (SPI)
The SEI is a thin protective passivation layer [192] exclusively formed at the
anode/electrolyte interface by electrolyte decomposition in contact with the reducing
anode surface. The SEI is usually formed during the first charge/discharge cycle and
stabilized during the following 10-20 cycles. An efficient SEI should be permeable for the
charge carrying ions (Li+, Na+) while preventing any further electrolyte reduction by being
electronically insulating.
The understanding of the SEI is complex and laborious even though many studies have been
done for LIBs [192, 193]. Still there is no absolute parameter in order to normalize or
generalize the composition of the SEI; its properties, quality, and efficiency are dictated by a
combination of factors, as described in the review by Verma et al. dealing with SEIs of LIBs
[193]. In this review, major components of the SEI regularly observed are listed and seem to
be inorganic in the major part. Therefore, the reduction of the salt may form SEI
components such as (CH2OCO2Li)2 [194, 195], ROCO2Li [194, 195], Li2CO3 [194, 196], Li2O
[195], polycarbonates [197], LiOH [198], etc.
Recently, some studies of SIB SEIs have been also reported [21, 43, 72, 153, 199-201], but
yet it is too early to really identify clear useful trends on how to form a stable SEI. However,
some striking differences as compared to LIBs have been identified using several techniques.
XPS combined with TOF-SIMS on a fully sodiated or lithiated HC electrode using 1 M NaClO4
in PC revealed similar SEI compounds for LIB and SIB cells, with differences in the proportion
of inorganic compounds, significantly larger for the latter [154]. Using the same technique
the addition of EC in the electrolyte increased the quantity of C-O environment of carbon in
the SEI due to the ring opening of EC with formation of PEO oligomeric/polymeric species
[202], while presence of DMC did not modify the SEI composition. SEIs of non-carbonaceous

23
negative electrodes have been found to have similar compositions as for carbonaceous
negative electrodes [203]. Komaba et al. [43] has shown using SEM that the SEIs formed on
HC using 1M NaClO4 as the electrolyte had larger unevenly distributed particles on the
surface than the SEI formed using 1 M LiClO4 and an XPS analysis revealed the surface layer
to be thinner while mass spectroscopy showed the chemical composition to differ. Another
XPS analysis from Philippe et al. for SEIs formed on Fe2O3 using NaClO4 or LiClO4 in EC:DEC
showed the former SEI to be more homogenously distributed, while both were similar in
thickness and composition.
Figure 9. Schematic representation showing the difference between the intrinsic electrolyte ESW and
the extended ESW due to the electrode/electrolyte interfaces.
Electrode passivation does not exclusively occur on the anode side; the positive electrode
may also need a protective mechanism in order to stabilize the whole cell when operating at
high potentials – an SPI. Comparatively less attention has been paid to the SPI in comparison
to the SEI despite its similar vital role [204-210]. LIBs and by association SIBs are using
cathodes with high insertion potentials often exceeding the oxidation potential of the
electrolyte. Thus it is crucial to understand and develop methods to stabilize SPIs (Fig.9).
In order to minimise the electrolyte decomposition and improve the capacity retention,
different techniques to improve the SPI have been reported, primarily for LIBs. Coating the
cathode grains by encapsulating them with inorganic or organic phases was proven
successful for LiMn2O4, this minimizes the surface area of active material in direct contact
with the electrolyte [211-213]. For LiCoO2 a coating layer of ZrO2 was applied to improve the
rate performance [214].

24
2.5 Safety Concerns
In order to commercialize a battery, a manufacturer has to deal with many different safety
concerns; if the specifications in terms of toxicity, flammability, and chemical stability are
not fulfilled the product cannot be commercialized. Most of us enjoy technologies such as
smartphones, tablets and electric cars in spite of the potentially hazardous chemicals
contained inside the batteries. Indeed, the attractive high density energy of LIBs and SIBs
may backfire in case of a leakage, electronical, or other kinds of failure.
Starting with overcharging events i.e. when cells are inadvertently charged to a higher than
specified voltage, batteries with intercalation materials at the cathode side may be
“delithiated” by the absorption and storage of the overcharged energy. The positive
electrode active material may become unstable, decompose, and a large quantity of heat
released. This may cause the ignition of any flammable solvent present such as the organic
solvents of the electrolyte, followed by other materials. This issue is usually well managed in
commercial LIBs as the charging is well controlled; if a cell is overcharged, it is disconnected
automatically from the rest of the battery to avoid any further complications.
Over-heating is, however, a serious issue for all batteries. Three major scenarios can cause
this phenomenon; the cell can be exposed to high external temperatures, the cell can create
abnormal resistive heating (I2R) during cycling, and short circuit may occur. As soon as the
temperature exceeds 100°C the SEI (section 2.4.1) is dissolved and the electrolyte is
consumed on the anode side of the cell causing a thermal runaway. In the best case, the
reaction will be contained within the cell packaging, while in worst case a cell fire or
explosion occurs. The main problem in a large battery pack such as for EVs is the proximity
of the cells; if one cell goes into a thermal runaway, the event can propagate to the next
closest cells resulting in an even more severe failure and event.
Mechanical abuse is in general caused by crushing or penetration. This may happen during
transportation, road accidents, or during the installation of a stationary battery due to
mishandling. Mechanical abuse usually causes short circuits, thus leading to over-heating.
To estimate the safety of the SIB, our measurements were focused on the electrolyte
flammability. Avoiding, delaying, or shortening electrolyte ignition would greatly reduce the
probability of flame propagation to the whole battery pack. The flash point (FP) gives an
indication on the temperature necessary to ignite the electrolyte vapours. The higher the
FP, the safer is the electrolyte. Delaying the ignition can be important as a safety margin
after e.g. an accident – thus the ignition time (IT) is valuable to know. At last, the self-
extinguishing time (SET) defines the time needed for a created flame to die out, a reduced
SET means a safer electrolyte.

25
3 Experimental Methods
The methods presented here have all been extensively used to characterise the materials
and their resulting properties important for battery application. Dielectric spectroscopy,
differential scanning calorimetry (DSC), and Raman spectroscopy have been performed at
Chalmers in order to gain a better understanding of the ionic conductivities, the thermal
windows, and the molecular interactions occurring in the electrolytes. The three other
techniques presented; microwave (MW) synthesis, cyclic voltammetry (CV), and
galvanostatic cycling with potential limitation (GCPL), have been carried out at ICMAB-CSIC
to learn more about the electrochemical properties: the electrochemical stability windows
(ESWs), the specific capacities, and the battery cycling stability. In addition, safety
measurements were carried out at Chalmers to determine the FPs, SETs and ITs of the
electrolytes.
3.1 Dielectric Spectroscopy
The purpose of dielectric spectroscopy is to measure the complex dielectric function,
presented in Eq. 7, in the broadband frequency range 10-6 - 1012 Hz [215-217], using a
capacitor cell with a complex capacity C* made of two brass electrodes separated by a
Teflon spacer (Fig. 10).
휀∗(𝜔) = 휀′(𝜔) − 𝑖휀′′(𝜔) =𝐶∗(𝜔)
𝐶0 (8)
ε’(ω) and ε’’(ω) are the real and imaginary parts of the complex dielectric function, ω is the
angular frequency, Co is the vacuum capacitance, while T corresponds to the time for one
period:
𝜔 = 2𝜈 = 2𝑇−1 (9)
When a sinusoidal electric field E1*(ω) is applied to the cell, the resulting electric field of the
sample Es*(ω) is collected, but with a different direction. The current Is*(ω)=I0.exp(iωt+ϕ) (ϕ
being the phase) measured gives information on the polarization effects, while the phase
difference between E1*(ω) and Is*(ω) is explained by the time necessary to orient dipoles in
the studied sample. Therefore, knowing both resulting sample current and potential, it is
possible to define the complex impedance as:
𝑍𝑠∗(𝜔) =
𝑈𝑠∗(𝜔)
𝐼𝑠∗(𝜔)
(10)
Knowing that C*(ω) can be expressed as:
𝐶∗(𝜔) =1
𝑖𝜔𝑍∗(𝜔) (11)

26
a new expression of ε*(ω) can be derived, proportional to Zs*(ω) by combining (8), (10), and
(11):
휀∗(𝜔) =1
𝑖𝜔𝑍∗(𝜔)𝐶0 (12)
It is also possible to derive the ionic conductivity from ε*(ω) using the current density Js*(ω)
and the electric field Es*(ω) knowing that Co can be expressed as:
𝐶0 = 휀0𝐴
𝐿 (13)
with A the electrode surface area and L the distance between the electrodes. Thus, the
impedance can be written as:
𝑍𝑠∗(𝜔) =
𝐸𝑠∗(𝜔)
𝐽𝑠∗(𝜔)
𝜀0
𝐶0 (14)
Combining (10) and (12) gives:
휀∗(𝜔) =𝐽𝑠
∗(𝜔)
𝑖𝜔𝜀0𝐸𝑠∗(𝜔)
(15)
At last, the ionic conductivity of the sample can be derived from (15) as:
𝐽𝑠
∗(𝜔)
𝐸𝑠∗(𝜔)
=𝐼𝑠
∗(𝜔)
𝑈𝑠∗(𝜔)
𝐴
𝐿= 𝜎∗(𝜔) = 𝑖𝜔휀0휀∗(𝜔) (16)
The studies of the ionic conductivities were made over a wide temperature range;
increasing the temperature amplifies the random thermal motion of the molecules.
Additionally, the dipole alignment with the electric field will deviate more resulting in less
orientation polarisation of the material. Therefore, a modification of the conductivity will be
observed due to its proportionality to the dielectric function. An equilibration time is
necessary to obtain consistent results; if the temperature is not stabilized and the
equilibration time is too short, the dipoles will not reach their final orientation.

27
3.1.1 Data Interpretation
Once 𝑍𝑠∗(𝑡) and 휀∗(𝜔) have been obtained, it is possible to differentiate between three
different processes:
Microscopic fluctuations of molecular dipoles [218]
The propagation of mobile charge carriers; diffusion of electrons, holes, or ions
[219].
The separation of charges at interfaces; polarisation [219].
Figure 10. Dielectric spectroscopy cell used for all measurements in II and III.
Figure 11. Variation of the real part ε*(ω) (solid line) ε’(ω) and the imaginary part ε’’(ω) (dashed
line) of the complex dielectric function.

28
Pure conduction phenomena e.g. the ionic conductivity of the electrolyte defined above,
can be obtained by monitoring the frequency dependence of the real part of ε*(ω), i.e. ε’
(Fig. 11). Practically, the ionic conductivity or DC conductivity is defined as the constant
plateau value of ε’(ω) while the polarization contribution can be found at low frequency.
The temperature dependence of the ionic conductivity from 273 to 333 K as function of the
frequency is shown in Fig. 12. The plateaux observed in each measurement is clearly
modified with the temperature supporting the temperature dependence of the dielectric
properties.
Figure 12. Conductivity vs. frequency for different temperature of NaTFSI in BMImTFSI.
After collecting the conductivity for each temperature (Fig. 11), the conductivity can be
presented as functions of the inverse of the temperature. This representation is commonly
used in the battery field as the trend usually follows a well-defined path. For instance, for a
LE the trend follows a VTF behaviour (section 2.3), while polymers can follow either an
Arrhenius (Eq. 16) or a VTF trend depending on the conduction mechanism [128, 129]. In
this thesis, studies were carried on LEs having VTF behaviour (Fig. 13).

29
Figure 13. Ionic conductivity results for NaxEMIm(1-x)TFSI and NaxBMIm(1-x)TFSI for different molar
fractions (x = 0, 0.1, 0.2, and saturated).
3.2 Raman Spectroscopy
Even if inelastic scattering of light was predicted by Adolf Smekal already in 1923 [220], it
was not observed in practice before 1928 by C. V. Raman [221]. The therefore named
Raman spectroscopy relies on inelastic scattering of light in the visible, near infrared, or near
ultraviolet wavelengths and how photons, today often from a laser, interact with the
vibrational states of the material – often molecules.
3.2.1 Theory of Raman Scattering
Two types of theories can be used to explain the Raman scattering: the classical and the
quantum. The classical considers light as an electromagnetic radiation containing an
oscillating electric field that interact with a material (e.g. molecules) due to its polarizability,
while the quantum considers light as photons which hits molecular bonds creating inelastic
scattering.

30
3.2.1.1 Classical Wave Interpretation
Vibrational spectroscopy is a mutual term to describe Raman and infrared spectroscopy (IR).
Both techniques are non-destructive, they provide information on the molecular
composition, structure and interactions of the studied sample. Each chemical bond can be
characterized by the measures of vibrational energy levels that can be transcribed into a
unique spectrum equal to a fingerprint. Therefore, vibrational spectroscopy is extremely
useful to identify, characterise, and monitor reactions for a sample of any shape as long as it
is active in Raman or IR.
The simplest model for vibrations, for a diatomic molecule, is two masses m1 and m2
connected by a weightless spring with a stiffness constant k (Fig. 14).
Figure 14. Schematic of two masses m1 and m2 connected by a weightless spring with a stiffness
force k.
If a force F is applied to move the masses a distance x from their position of equilibrium this
is proportional to the constant k, Hooke’s law:
𝐹 = −𝑘𝑥 (17)
The negative sign is added as the force F always is in the opposite direction of the
elongation. When combined with Newton’s law, we obtain:
𝑚𝑑2𝑥
𝑑𝑡2 = −𝑘𝑥 (18)
Furthermore, the resolution of the second order differential equation can be written:
𝑥 = 𝑥0 cos(2𝜈𝑡 + 𝜑) (19)

31
with x0 being the amplitude, ν the frequency of the movement, and φ the phase constant.
Eq. 19 describes a sinusoidal movement relating a displacement x to a vibrational frequency.
Considering that the second derivative of x is:
𝑑2𝑥
𝑑𝑡2= −42𝜈2 𝑥0 cos(2𝜈𝑡 + 𝜑) = −42𝜈2𝑥 (20)
A combination with Eq.20 yields:
42𝜈2𝑚 = 𝑘 or 𝜈 =1
2√
𝑘
𝑚 (21)
This frequency of vibration, however, involves only one mass attached to a very large mass
connected by a spring. For our diatomic model, the reduced mass has to be introduced with
the masses m1 and m2 instead of m:
1
𝑚=
1
𝑚1+
1
𝑚2 (22)
Thus, the vibrational frequency of a diatomic molecule is:
𝜈 =1
2√𝑘(
1
𝑚1+
1
𝑚2) (23)
To summarize, this model is describing systems such as molecules vibrating in sinusoidal
pattern with a frequency proportional to the bond strength and inversely proportional to
the reduced mass.
3.2.1.2 Quantum Particle Theory
When a light quantum hν0 hits a molecule, there is a high probability that an elastic
scattering process occurs by emitting back the exact same amount of energy, i.e. hν0;
Rayleigh scattering. On the other hand, if the exchange process of vibrational energy is
inelastic, a different quanta of energy is emitted as hν0 ± hνs; Raman scattering. Therefore,
the origin of the modified frequencies in Raman is explained by the interaction between a
system and a radiation of wavenumber ν0 making an upward transition from a lower energy
level E0 to an upper energy level E1 or the opposite (i.e. from E1 to E0). Each transition passes
through an intermediate level; the excited state or the virtual state. If the molecules leaves
a quantum of lower energy (hν0 - hνs) the process is called Stokes scattering (with reference
to Stoke’s work on fluorescence [222]), and for a quantum of higher energy (hν0+ hνs) the
process is called anti-Stokes scattering (Fig. 15).

32
Figure 15. Description of the Stokes and anti-Stokes processes, where E0 and Ei are vibrational modes
while hv0 and hvs are photon energies.
It is possible to corroborate the quantum Raman effect to classical physics as follows: an
incident monochromatic light involves an electric field strength E fluctuating with time t:
𝐸 = 𝐸0 cos(2𝜈0𝑡) (24)
where 𝐸0 is the amplitude and 𝜈0 is the laser frequency which can be used to irradiate a
molecule and induce an electric dipole moment P:
𝑃 = 𝛼𝐸 = 𝛼𝐸0 cos(2𝜈0𝑡) (25)
with α being the polarizability. The nuclear displacement q when the molecule vibrates with
a frequency 𝜈𝑠 can be expressed as:
𝑞 = 𝑞0 cos(2𝜈𝑠𝑡) (26)
where 𝑞0 is the vibrational amplitude. If the amplitude of vibration is minute, 𝛼 is a linear
function of q, and can expanded in a Taylor series:
𝛼 = 𝛼0 + (𝑑𝛼
𝑑𝑞)0 𝑞0 + ⋯ (27)
Combining (25), (26) and (27) with the use of trigonometry identity the electric dipole
moment can be written as:

33
𝑃 = 𝛼0𝐸0 cos(2𝜈0𝑡) +1
2(
𝑑𝛼
𝑑𝑞)0 𝑞0𝐸0[cos(2(𝜈0 + 𝜈𝑠)𝑡) + cos(2(𝜈0 − 𝜈𝑠)𝑡)] (28)
The first term corresponds to the oscillating dipole of frequency 𝜈0 (Rayleigh scattering),
while the second term holds both the Raman scattering of frequency 𝜈0 + 𝜈𝑠 (anti-Stokes)
and 𝜈0 − 𝜈𝑠 (Stokes). Thus it also follows that if (𝑑𝛼
𝑑𝑞)0 is zero, the vibration is not Raman
active, which is therefore the selection rule for Raman spectroscopy. At last, small
perturbations of the vibrations can be seen as shifts in frequency, why also local
environment changes and weaker interactions than covalent bonds can be probed by
Raman spectroscopy.
For IR a vibrational mode is allowed if a change in the dipole moment is possible, this does
not necessarily imply the presence of a permanent dipole as the rule is valid for a dipole
moment modification. IR and Raman are thereby complementary techniques. For instance,
if a molecule has a centre of symmetry, modes which are Raman active would be IR inactive
and vice-versa (e.g. CO2). Moreover, some molecules may be both IR and Raman active. That
said, a mode being active in IR or Raman does not necessarily means that it can be analysed
as some signals may be intrinsically too weak to be observed even if allowed.
3.2.2 Molecular Vibrations
The total energy in any molecule includes translational, rotational, and vibrational energies.
Starting with the translational energy, a molecule can freely move toward an orthonormal
space where three vectors are 90° to each other leading to three degrees of freedom. This is
equally true for rotational energies which can also be described in three degrees of
freedom, with the exception of linear molecules only having two degrees of rotation as the
linear rotation around its molecular axis cannot be observed. Any other degree of freedom
is related to vibrational energies, which then can be calculated to be totally 3N-6 for any
nonlinear molecule containing N atoms and 3N-5 for linear molecules.
Each corresponding vibration is called normal mode or vibrational mode verifying several
assumptions: the vibration of atoms in the molecules have the same frequency while their
simultaneous displacement does not affect the mass centre, the amplitude of different
particles can be different, the vibrational modes do not interfere with each other, and the
number of modes is limited to 3N-6 or 3N-5. Every mode has its own pattern as presented in
Table 10 and the identification of vibrational modes allows the characterisation of bonds
within a molecule. If a vibrational mode is somehow modified by the environment, this will
be observable as a shift in frequency in the spectrum.

34
Table 10. Molecular vibration modes with their characteristics. The + and - signs correspond to
movements vs. the plane.
Modes Stretching Bending
Description Change in the length of a bond Change in the angle between the bonds
Types asymmetric symmetric Rocking Scissoring Wagging Twisting
Representation
Nomenclature 𝜈𝑎 𝜈𝑠 𝜌 𝛿 𝜔 𝜏
3.2.3 Raman Data Interpretation
A typical Raman spectrum from an hybrid electrolyte of 0.8 m NaTFSI in EC:PC:IL is the result
of interactions between the sodium cations, TFSI anions, and solvent molecules, and
expressed with the x-axis in wavenumbers and the y-axis in Raman intensity (Fig. 16). As
each vibrational mode depends on the atomic masses and the strength of the chemical
bond between them they can be used as fingerprints of the molecular structure. Overall,
contributions of light atoms in bonds such as C-H, C-O or N-H will appear in the high
wavenumber region, and as an example N-H stretching vibrations will always have higher
frequencies than the C-H stretching vibrations. Similarly, all functional
groups/bonds/vibrations can be localised and analysed based on their vibrational frequency
in the Raman spectra. Some characteristic wavenumbers of common functional groups are
presented in Table 11.

35
Figure 16. Raman spectra of (a) ECx:PCx:BMImTFSI(1-2x) and (b) ECx:PCx:Pyr13TFSI(1-2x), between 675-1075 cm-1.
Table 11. Functional groups/vibration modes and their approximate positions in a Raman spectrum.
Functional Group/Vibration Mode Wavenumber (cm-1)
ν(C-H) 2800 – 3000 ν(=(C-H)) 3000 – 3100
ν(C=C) 1500 – 1900 ν(N-H) 3300 – 3500 ν(C=O) 1680 – 1820 ν(S-S) 430 – 550
ν(C-Br) 500 – 700
All Raman spectra from condensed matter consist of peaks with band widths due to the
temperature and thereby resulting slightly different interactions within the sample (in
contrast to gases with almost no such interactions). Interpretation complications appear
when two or more peaks overlap (Fig. 17). Then deconvolution and fitting techniques have
to be used to reveal the contributions from each of the peaks. In our work, the
mathematical Voigt function (Eq. 29) [223], which is a convolution of a Lorentzian and a
Gaussian profile, has been applied to analyse Raman spectra and extract areas, peak
heights, as well as the full width at half maximum (FWHM). The rationale for the choice of a
Voigt profile is that the use of a Gaussian or Lorentzian function alone may not
appropriately match the bands. In a system composed of molecules, the vibrational
frequencies are influenced by the environment. The position, behaviour, and interactions
between each molecules result in different broadening and/or line-shape profiles. Two main
parameters can be used; the coherence lifetime, τc, corresponding to the time interval
within which the phase from a vibrating molecule is predictable, and the amplitude

36
correlation time, τa, which is the interval of time necessary for a molecule to fully relax
[224].
If the relaxation time is much shorter than the time interval necessary to predict the phase
of a vibrating molecule (i.e. τc >> τa), the line-shape will be a Gaussian profile. This is usually
the case for molecules in a solid where the environment is not in motion while the
molecules are separated by well-defined distances. If the relaxation time is much shorter
than the time interval necessary to predict the phase (i.e. τc << τa), the line-shape will be a
Lorentzian profile. It usually occurs within gases where the molecules are quickly moving,
colliding, and rotating. At last, liquids are in between these two cases. Indeed, molecules in
liquids are not located at fixed positions, while their motions are hindered by their
interactions. In this case, τa and τc are relatively similar, resulting into a broadening having
both Gaussian and Lorentzian line-shape contributions, hence justifying the use of Voigt
profiles for the Raman spectra analysis.
Line broadening can be also influenced by instrumental or atmospheric effects. The use of a
monochromator with rectangular slits results in a Gaussian profile [225]. In general, this
effect does not have a large influence on the line broadening for a liquid as the convolution
of two Gaussians is a Gaussian. Doppler broadening may also influence the line shape with
an additional Gaussian contribution [226].
𝑉(𝑥) =(
𝜔𝐿𝜔𝐺
)
3/2 ∫𝑒−(𝑥′/𝜔𝐺)2
(𝑥−𝑥′)2+𝜔𝐿2
∞
−∞𝑑𝑥′ (29)
𝜔𝐿 and 𝜔𝐺 are two normalized expressions of the Lorentzian and the Gaussian profiles
where:
𝜔𝐿
𝜔𝐺 ≡ √ln 2
𝛤𝐿
𝛤𝐺 (30)
with 𝛤𝐿 and 𝛤𝐺 being the FWHM of the Lorentzian and the Gaussian profiles, respectively.

37
Figure 17. Deconvolution and fitting of peaks of TFSI, EC, and PC between 680-770 cm-1 using Voigt
profiles. The red line is the experimental Raman data and the green lines are the resulting individual
peaks from the fitting procedure.
3.3 Differential Scanning Calorimetry (DSC)
Calorimetry is the science of analysing the evolution of chemical reactions, physical changes,
or phase transitions through the measurement of heat exchange. The generation or
consumption of heat is analysed in order to understand physical processes. Here we apply
calorimetry to obtain several measures of importance for a fundamental understanding of
our materials; glass transitions, melting, and crystallization temperatures.
3.3.1 Theoretical Foundation
Calorimetry analysis using DSC is a thermo-analytical analysis that associate the
temperature and heat flows to material phase transitions as function of time and
temperature. The set-up of a DSC chamber is represented in Fig. 18. During an experiment,
energy is transmitted simultaneously into the sample cell containing the sample and a
reference cell, which in our case is an empty sealed aluminium pan. The difference of energy
between the sample and the reference to match temperatures represent the amount of
excess heat absorbed or released by the sample. An alternative view is that a DSC
measurement monitors how the heat capacity (Cs) of the sample changes with temperature.
In general, the sample holder temperature increases linearly as a function of time defined
by the heating rate (e.g. 10°C min-1 in III) and monitored by the furnace temperature (TF).

38
As soon as the furnace is subject to a defined heating rate, heat flows from the furnace to
the sample (φFS) and reference (φFR). The temperature difference 𝛥𝑇 should equal zero as
the sample and the reference are heated equally. A differential signal is generated when the
state equilibrium is disturbed by a physical transition modifying 𝛥𝑇 and therefore the heat
flow(𝑑𝑄𝑠/𝑑𝑡):
𝑑𝑄𝑠
𝑑𝑡=
(𝑇𝑠−𝑇𝑅)
𝜆 (31)
with 𝑇𝑅 and 𝑇𝑠 the temperatures of the furnace and the sample, respectively, and λ the total
thermal resistance.
The heat flow to the sample can also be written as:
𝑑𝑄𝑠
𝑑𝑡= 𝐶𝑠 (
𝑑𝑇𝑠
𝑑𝑡) − (
𝑑𝐻𝑠
𝑑𝑡) (32)
where 𝐶𝑠 is the heat capacity of the sample together with the pan and 𝐻𝑠 is the sample
enthalpy.
Figure 18. Illustration of a DSC chamber with TS, TR, and TF the temperatures of the sample,
reference, and furnace, respectively. φFS and φFR are the heat flow rates from the furnace to the
sample, and from the furnace to the reference, respectively.

39
3.3.2 DSC Data Interpretation
In Fig. 19 a DSC trace of an IL based SIB electrolyte from III is displayed, within which three
main features can be observed; the glass transition temperature, the melting temperature,
and the crystallization temperature. The glass transition can be observed as a slight
modification of the base line, corresponding to the transition between the liquid phase and
the solid-like or glass phase where a change of heat capacity occurs. The more pronounced
peaks are ascribed to crystallisation (exothermic) and melting (endothermic) processes. The
integrated area of the peaks can be used to determine the enthalpy of each process.
Figure 19. DSC traces of NaxEMIm(1-x)TFSI for different molar fractions (x = 0, 0.1, 0.2, and saturated)
between -150 - 150°C. Typical glass transitions, crystallizations and meltings are highlighted.
3.4 Microwave Synthesis
In the field of chemical synthesis time and energy are both valuable and microwave (MW)
based synthesis is extremely beneficial with respect to both. The MW technique is expected
to play a fundamental role in a future environmentally friendly synthesis of nano-structured
materials [227, 228]. Technically, MW electromagnetic radiation is in the spectrum of
wavelengths from 1 mm to 1 m, corresponding to frequencies between 300 MHz and 300
GHz.
MW synthesis is considered as a “soft-chemistry” technique together with techniques such
as sol-gel [229] or emulsion drying [230] as they all use low working temperatures. The
attractiveness for electrode syntheses lies in the capacity to heat a material from the inside,
by converting an electromagnetic energy into heat [231]. Using the penetration potential of
the microwave it is possible to generate heat throughout the whole electrode material
volume preventing any temperature gradient. Thus, the eternal dilemma between
processing times and quality is solved by MW synthesis, as the overall quality for
electrochemical applications is enhanced and the time is reduced from days to minutes.
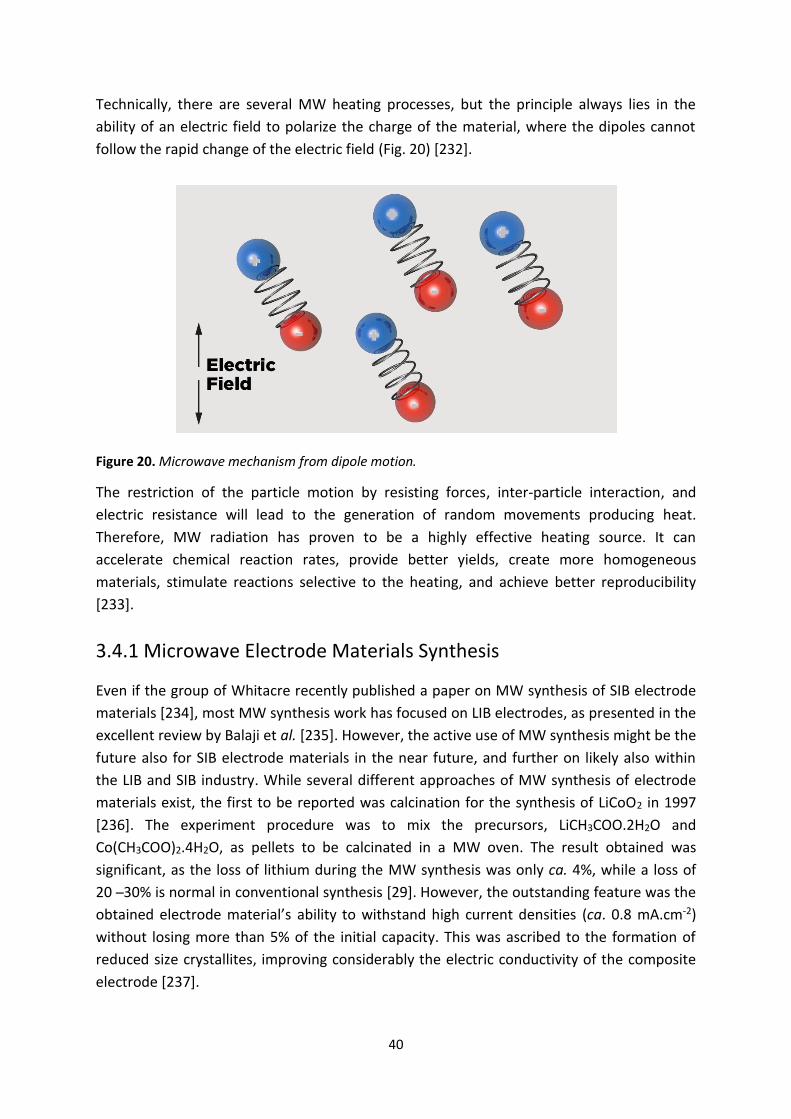
40
Technically, there are several MW heating processes, but the principle always lies in the
ability of an electric field to polarize the charge of the material, where the dipoles cannot
follow the rapid change of the electric field (Fig. 20) [232].
Figure 20. Microwave mechanism from dipole motion.
The restriction of the particle motion by resisting forces, inter-particle interaction, and
electric resistance will lead to the generation of random movements producing heat.
Therefore, MW radiation has proven to be a highly effective heating source. It can
accelerate chemical reaction rates, provide better yields, create more homogeneous
materials, stimulate reactions selective to the heating, and achieve better reproducibility
[233].
3.4.1 Microwave Electrode Materials Synthesis
Even if the group of Whitacre recently published a paper on MW synthesis of SIB electrode
materials [234], most MW synthesis work has focused on LIB electrodes, as presented in the
excellent review by Balaji et al. [235]. However, the active use of MW synthesis might be the
future also for SIB electrode materials in the near future, and further on likely also within
the LIB and SIB industry. While several different approaches of MW synthesis of electrode
materials exist, the first to be reported was calcination for the synthesis of LiCoO2 in 1997
[236]. The experiment procedure was to mix the precursors, LiCH3COO.2H2O and
Co(CH3COO)2.4H2O, as pellets to be calcinated in a MW oven. The result obtained was
significant, as the loss of lithium during the MW synthesis was only ca. 4%, while a loss of
20 ̶ 30% is normal in conventional synthesis [29]. However, the outstanding feature was the
obtained electrode material’s ability to withstand high current densities (ca. 0.8 mA.cm-2)
without losing more than 5% of the initial capacity. This was ascribed to the formation of
reduced size crystallites, improving considerably the electric conductivity of the composite
electrode [237].

41
MW synthesis is possible only if the material can absorb the electromagnetic energy, and if
the material absorbs MWs only sparsely, a preheating of the materials or the utilization of a
MW amplifier vessel can be used. The MW synthesis in I was carried out in a liquid. At the
time, it was one of the first reports dealing with a liquid state MW based synthesis of an
electrochemical active electrode material; TiO2. The precursors, tetra-butyl ortho-titanate
(TBOT) and benzyl alcohol, were initially mixed in a MW active solvent and the final product
was obtained in only 20 minutes using a MW effect of 200 W and an amplifier vessel at
200°C. Furthermore, the electrochemical properties of the obtained electrode material such
as the cyclability and the capacity retention at high current density were promising.
3.5 Cyclic voltammetry (CV)
Cyclic voltammetry (CV) is a dynamic electrochemical method for acquiring qualitative and
quantitative information about the redox processes occurring within an electrochemical cell
by scanning the potential at a given sweep rate (usually measured in mV/s) and recording
the resulting current. The cell consists of 3 electrodes: a working electrode (WE), a reference
electrode (RE) (Na+/Na° in our case), and a counter electrode (CE) (stainless steel (SS) in our
case) (Fig. 21). All the electrodes are in contact with the electrolyte.
Figure 21. Three electrodes Swagelok cell setup.

42
The current is measured between the WE and the CE, while no current passes through the
RE which serves to monitor the potential of the WE. During the experiment, a linear
potential ramp is applied to the WE. The potential sweep starts from the initial open circuit
potential V0 to an imposed potential E1. Subsequently the scanning direction is reversed to
reach another potential E2. Often several cycles are performed during a single experiment in
order to observe the stability/evolution of the system. E1 and E2 are chosen to match the
ESW and observe the electrolyte behaviour at the stability limits. In general, a reduction
process takes place at E1 ascribed to a current decrease while an oxidation process at E2
ascribed to a current increase (Fig. 22). If an increase or decrease of current is not observed,
the electrolyte is stable between the potential limits.
Figure 22. CV of EC0.40:PC0.40:EMImTFSI0.20 ((E1=0.005) – (E2=4) V vs. Na+/Na°) at a sweep rate of 1
mV/s using an Al WE; V0=2 V vs. Na+/Na°
3.5.1 Theoretical Foundation
For a better understanding of CV Nernst equation [26] is introduced. It mathematically
describes a model with the electrode potential (E1, E2) and the oxidant/reductant species
concentration (Eq. 27), directly derived from the Gibbs free energy (Eq. 1). As the
connection between the two equations is not trivial, a detailed explanation is written below.
Under standard conditions, the Gibbs free energy is written:
Δ𝐺0 = −𝑛𝐹𝐸0 (33)
A reaction would thus be spontaneous if E0 is positive and non-spontaneous is E0 is negative.
From a thermodynamic point of view, ΔG can be expressed as:
Δ𝐺 = Δ𝐺0 + 𝑅𝑇𝑙𝑛𝑄 (34)
with Q being the concentration quotient of the sample species. Furthermore, combining (1)
and (33), (34) can be turned into:

43
−𝑛𝐹𝐸 = −𝑛𝐹𝐸0 + 𝑅𝑇𝑙𝑛𝑄 (35)
Equation (35) can also be rewritten into the usual Nernst equation representation:
𝐸 = 𝐸0 −𝑅𝑇
𝑛𝐹ln 𝑄 = 𝐸0 −
𝑅𝑇
𝑛𝐹ln (
𝐶𝑅
𝐶𝑂) (36)
with CO and CR being the concentrations of the oxidized and reduced species, respectively, T
the temperature, n the number of electrons, F Faraday’s constant, R the gas constant, and
EO the standard potential.
As can be seen, Nernst equation provides a relation between a potential and a
concentration. Therefore, in order to relate a potential to a current – which is the usual CV
representation – a relation between the current and the concentration CO and CR is given by:
𝑖 =𝑑𝑄
𝑑𝑡= −𝑛𝐹
𝑑𝑁
𝑑𝑡= 𝑛𝐹𝐴𝐷 (
𝜕𝐶
𝜕𝑥)
𝑥=0 (37)
where D is the diffusion coefficient for the species being transported to the electrode
surface, (𝜕𝐶
𝜕𝑥)
𝑥=0 is the partial derivative of the concentration of the species with respect to
the distance, n the number of transferred electrons, F Faraday’s constant, N the number of
moles of reductant or oxidant species, and Q the current flux.

44
3.5.2 CV Data Interpretation
In a cyclic voltammogram the current is typically plotted against the WE potential and each
peak observed is associated to a redox process, where the sign of the current determines if
it corresponds to an oxidation (positive) or a reduction (negative) process. The peak
intensities differ depending of the number of electrons involved, which is related to the
concentration of electrochemically active species at the surface of the electrode (Eq. 37). If
the redox couple is fully reversible, two peaks will be observed symmetrically, starting at the
same onset potential upon oxidation and reduction with equal surface areas i.e. the same
number of electrons is exchanged. This is, however, rarely encountered since either kinetic
or thermodynamic factors can induce an over-potential and hence a certain hysteresis will
be observed. Moreover, some processes may be fully irreversible, such as the SEI-formation
in the case of SIBs, and hence only one peak will be observed. Such reactions can also
modify the nature of the WE surface and hence differences will be observed between the
first and further CV cycles. A cyclic voltammogram of an IL, with the purpose of determining
its ESW, the domain within which the IL is neither oxidized nor reduced, is presented in Fig.
23.
Figure 23. CV of 10 cycles (20 sweeps) for EMImTFSI (0-3 V vs. Na+/Na°) at a sweep rate of 1 mV/s
using a SS WE.

45
3.6 Chronopotentiometry
Chronopotentiometry is an electrochemical method consisting of applying a constant
current (i) to the WE and recording its potential as a function of time. This technique is
useful to characterize the electrochemical properties of insertion materials for battery
application [32, 51, 56, 95]. Within the battery research field, the method entails the
successive application of positive and negative currents within threshold potential values;
galvanostatic cycling with potential limitation (GCPL). By GCPL the specific cell capacity
(often in mAhg-1 of active material) and stability upon cycling can be assessed (Fig. 24). The
presence of steps or plateaus in the voltage profile indicate two-phase (heterogeneous)
redox processes, while a gradual decay is related to single phase (homogeneous)
mechanisms.
Typically the GCPL experiments are performed at different currents (corresponding to
different C-rates) to collect information about the kinetics of the redox process(es) (Fig. 25).
Indeed, slower kinetics results in a larger decrease of capacity with increasing applied
current. In addition, differences in the coulombic efficiency (c.f. II, V), by the ratio between
the capacities observed for the oxidation and reduction, can give additional information
about the presence of any irreversible additional redox process(es) such as electrolyte
decomposition or SEI formation.
Figure 24. GCPL data for a half cell of NVP of 0.8m NaTFSI in EC0.45:PC0.45:Pyr13TFSI0.10 electrolyte
cycled at different C-rates.
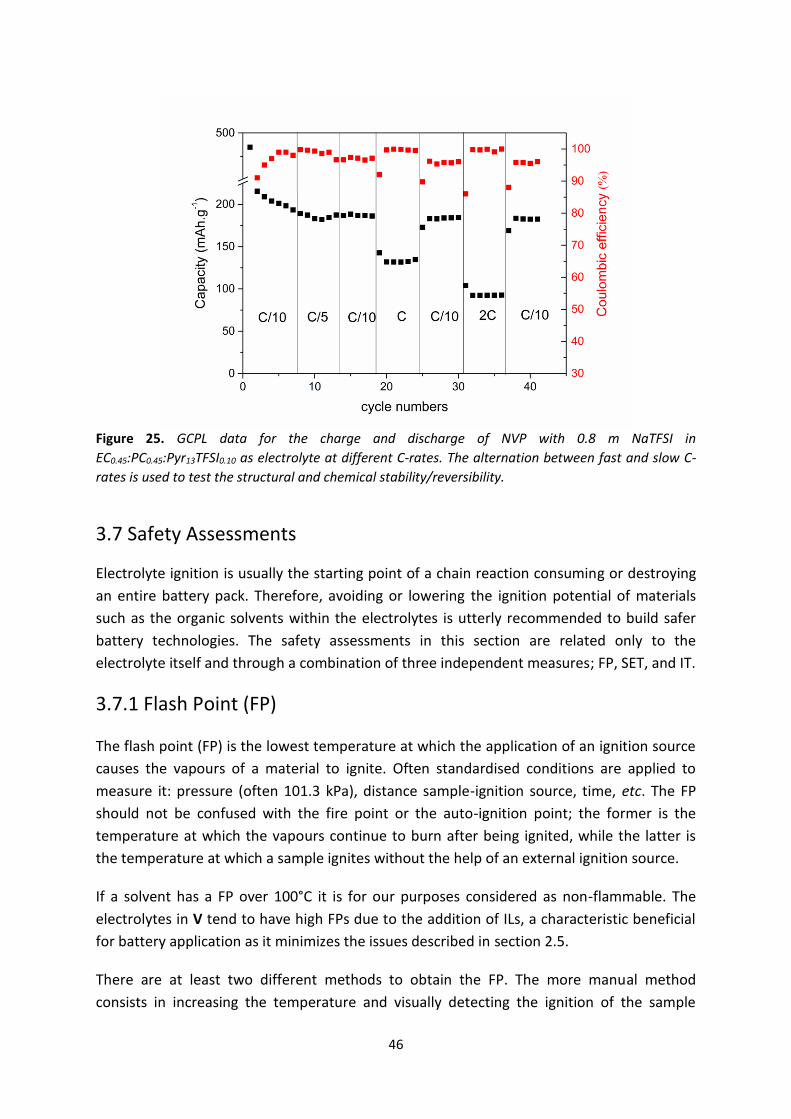
46
Figure 25. GCPL data for the charge and discharge of NVP with 0.8 m NaTFSI in
EC0.45:PC0.45:Pyr13TFSI0.10 as electrolyte at different C-rates. The alternation between fast and slow C-
rates is used to test the structural and chemical stability/reversibility.
3.7 Safety Assessments
Electrolyte ignition is usually the starting point of a chain reaction consuming or destroying
an entire battery pack. Therefore, avoiding or lowering the ignition potential of materials
such as the organic solvents within the electrolytes is utterly recommended to build safer
battery technologies. The safety assessments in this section are related only to the
electrolyte itself and through a combination of three independent measures; FP, SET, and IT.
3.7.1 Flash Point (FP)
The flash point (FP) is the lowest temperature at which the application of an ignition source
causes the vapours of a material to ignite. Often standardised conditions are applied to
measure it: pressure (often 101.3 kPa), distance sample-ignition source, time, etc. The FP
should not be confused with the fire point or the auto-ignition point; the former is the
temperature at which the vapours continue to burn after being ignited, while the latter is
the temperature at which a sample ignites without the help of an external ignition source.
If a solvent has a FP over 100°C it is for our purposes considered as non-flammable. The
electrolytes in V tend to have high FPs due to the addition of ILs, a characteristic beneficial
for battery application as it minimizes the issues described in section 2.5.
There are at least two different methods to obtain the FP. The more manual method
consists in increasing the temperature and visually detecting the ignition of the sample

47
using a glowing wire, a flame, or an electric arc. This approach is usually not very accurate
and poorly reproducible. In our, more automated case, a specific FP tester has been used
where the sample is placed in a heatable cup placed in a closed chamber. The temperature
of the sample is then slowly increased while an electric arc is activated periodically above
the cup surface. Upon ignition the pressure in the chamber increases and this determines
the FP. In general, the so-obtained flame covers at least 75% of the surface at this
temperature in order for the FP to be assigned.
3.7.2 Ignition Time (IT)
Upon contact with an ignition source the sample might not be ignited immediately - several
seconds may be necessary before the flame appears. The IT is relatively easy to collect by
the experimentator; for LP30 and EC:DMC based electrolytes, the sample ignition was
relatively quick (ca. 2-3 seconds) as a continuous flame was obtained nearly immediately
after the utilisation of the flaming butane torch. The result corroborates to the ITs obtained
by Wilken et al. [238]. However, the use of EC:PC and furthermore ILs, greatly modified (i.e.
10-18 seconds) the IT and several seconds were necessary to permanently ignite the
electrolyte. The IT could here not be associated only to the appearance of a flame as it was
not as clear as for the EC:DMC based electrolytes. Therefore, a different protocol was
chosen and the IT was decided to be calibrated as the time necessary to have a sustainable
flame. As a verification an exposure time below the calibrated IT did not generate the
permanent flame necessary for the SET experiments (3.7.3). In general, an increased IT can
be due to the presence of additives e.g. ILs that lower the vapour pressure and hence the
amount of ignitable vapour, which of course improves the safety.
3.7.3 Self-Extinguishing Time (SET)
The SET is based on the ability of a material to cease burning once the ignition source has
been removed; the shorter the SET – the safer the electrolyte. The SET can be significantly
reduced if the ignitable radicals in the emanating vapour are consumed or inhibited by use
of proper electrolyte additives e.g. flame-retardants [239]. In practice, in the case of an
abuse situation of a battery, a fire self-extinguished after only a few seconds has less
likelihood to propagate to the surrounding materials/cells – making a short SET extremely
important. In V a defined amount, less than a gram, of electrolyte, was placed on a watch
glass and ignited with the help of a flaming butane torch. The amount is important as the
mass will affect the SET (thus measured in s.g-1). As soon as the vapour started to burn, the
time was recorded until the flame disappeared – thus a manual method with reproducibility
errors why all samples were measured at least 6 times. Despite the manual SET
determination method, the standard deviation was relatively low.

48

49
4 Results and Discussions
A brief summary of the results contained in the appended papers of this thesis is presented
in this chapter. This section is, however, not following a chronologically or paper based
order; instead a joint scientific reasoning is used intending to help the reader to go further
in understanding the findings, by the topics of the sub-paragraphs composing this chapter.
First, the many physical properties of imidazolium and pyrrolidinium type ILs and their
electrolytes will be discussed including viscosity, ionic conductivity, thermal stability,
density, and safety properties. Concise explanations will be developed including the
influence of the salt concentration, the effect of the specific choice of IL, the temperature
dependence, and a discussion on safety assessments. These results are compared to organic
solvent based electrolytes to examine the viability of ILs as solvents/components of
electrolytes for SIB application.
Second, studies of the Na+ cation solvation with the help of Raman spectroscopy will be
presented. This includes discussions on the molecular arrangements about the Na+ and its
solvation shell, as supported by DFT calculations for pure ILs, and extending also to the
complexation in hybrid electrolytes of both organic solvents and ILs.
At last, a short discussion is made on the synthesis of the SIB anode material TiO2 using
MWs, and the advantages this technique can provide for any type of battery electrode
materials and technology. The electrochemical properties of full and half-cells of SIBs such
as the ESW exemplified by the cycling properties of HC and NVPF electrodes, potentially to
be used in the next generation of SIBs, will also be discussed.
4.1 Physical Properties of IL Based SIB Electrolytes
ILs based electrolytes have received a lot of attention in recent years as described in IV.
However, most of the early focus was placed on the physical properties such as ionic
conductivity, thermal stability, density, viscosity – including ours (II, V). With the help of
these characterization studies the aim was to make it possible to identify IL based
electrolytes as performant as typical organic solvent based electrolytes.
Starting with the Na-salt concentration effects in the ILs EMImTFSI and BMImTFSI, the total
conductivity is in general only slightly affected with the addition of Na-salt. As the ILs are
exclusively composed of ions, the ionic conductivity reported in all our papers is not
representing the migration of Li+/Na+ charge carriers, but overwhelmed by all the IL ions
present (section 2.3.2). As an example from III, a slight difference of 1.7 mS.cm-1 at RT
between the pure BMImTFSI IL and the saturated NaXBMIm1-XTFSI electrolyte was recorded,
as well as an almost linear conductivity decreasing trend (Fig. 26) – a trend observable also

50
in the literature [174, 176, 240-243]. In contrast, this behavior is not found for organic
solvent based electrolytes (e.g. EC, PC, DMC, etc…), which usually present local conductivity
maxima at ca. 0.5-0.8 M and 1 M, for appropriate Na and Li-salts dissolved, respectively
[244, 245]. Then, focusing again on the IL properties, the influence of the IL cation alkyl
chain length seems to be moderate as moving from BMIm to EMIm based electrolytes has
only a very slight effect on the total ionic conductivity. That said, all ion conductivities
recorded at RT for IL based electrolytes were above 1 mS.cm-1, which is the usually quoted
target battery applications such as LIBs and SIBs. The results presented are similar to those
found for LIBs [154, 240, 241, 246], with the exception of the Na+ conducting electrolytes
displaying slightly better conductivities, despite the LixEMIm(1-x)TFSI system being less
viscous than the corresponding NaxEMIm(1-x)TFSI system (III). The latter is most probably due
to the large IL cation/anion contribution, together with the beneficial properties of Na+
containing complexes being [Na(TFSI)n]-(n-1) as compared to [Li(TFSI)n]-(n-1).
Figure 26. Isotherms of the conductivity for (a) NaxEMIm(1-x)TFSI and (b) NaxBMIm(1-x)TFSI for different
molar fractions (x = 0.025, 0.05, 0.075, 0.1, 0.15, 0.2, and saturated). (III)
Modifications of the conductivity are also noticeable when the IL percentage is modified as
in the organic solvent /IL hybrid electrolytes. In V, the conductivities of hybrid electrolytes
based on EC, PC, Pyr13TFSI and BMImTFSI, all with 0.8 m NaTFSI were studied. Adding 10-
20% of IL slightly increases the (total) ionic conductivity in parallel with increasing the
viscosity (Figs. 26 and 27).

51
Figure 27. Conductivities of (a) ECx:PCx:BMImTFSI(1-2x) and (b) ECx:PCx:Pyr13TFSI(1-2x) as functions of
temperature. (V)
This observation is re-joining the statement emphasizing the IL ions’ contribution to the
total conductivity of IL based electrolytes. As the IL contents reaches 50% the conductivities
fall drastically, most probably due to the large increases in viscosities. ILs have relatively
high viscosities in comparison to organic solvents (II, III, V), problematic for electrochemical
application as this usually leads to slower charge displacement and higher heat generation
due to resistive heating. The temperature dependence of the ionic conductivity between the
organic based EC0.50:PC0.50 and the IL based EC0.40:PC0.40:CatTFSI0.20 or EC0.45:PC0.45:CatTFSI0.10
electrolytes show a general trend that is similar at low temperatures where the
conductivities are quasi equal, while there are noticeable differences at higher
temperatures. This is a result strongly influenced by the viscosity – as the viscosities differ
less at the higher temperatures (Fig. 28).
Figure 28. Viscosity of (a) ECx:PCx:BMImTFSI(1-2x) and (b) ECx:PCx:Pyr13TFSI(1-2x) as functions of
temperature. (V)
Thermal properties of electrolytes are important as a stable electrolyte over a large range of
temperature is very useful. The thermal range stretches from the Tg to the decomposition
temperature, assuming the electrolyte to remain liquid in this range. In III, the Tg was shown
to increase as a function of the salt concentration, from -93.7 to -73.4 °C for BMImTFSI and
EMImTFSI based electrolytes. This could tentatively mean two different processes taking
place: i) Na+ complexes with low mobility are formed and/or ii) Na+ induced dynamic cross

52
linking is introduced. Furthermore, the BMImTFSI based electrolytes do not present any
crystalline phases, while the EMImTFSI systems do (Fig. 29) – and thus a reduced
temperature stability range. It is therefore probable that different Na+ complexes are
formed (I, II, III, V), and this is the topic of the following section.
Figure 29. Isotherms of the conductivity for (a) NaxEMIm(1-x)TFSI and (b) NaxBMIm(1-x)TFSI for different
molar fractions (x = 0.025, 0.05, 0.075, 0.1, 0.15, 0.2, and saturated). (III)
Safety is a requirement for any SIB electrolyte, and to use ILs as additives to improve the
flammability properties without severely decreasing the general performance is one
approach taken (V). Properties such as the FP, IT, and SET for both Li+ and Na+ conducting
hybrid electrolytes were measured, and for example the FPs of electrolytes with IL contents
of 2% to 80% increase from 140°C to 180°C (Fig. 30). Moving to the ITs of EC:PC and EC:PC:IL
these are 10 s and 18 s, respectively, and a regular electrolyte(LP30) has >16 s shorter IT
than the hybrid electrolytes (Fig 30b). At last, the SET data are in the line with the other
safety improvements; any type of IL added decrease the SET linearly over the full range, but
most notably the initial addition of 2% of IL reduced the SET by half.
At last, the origins of the safety enhancements have been investigated using the Raman
bands from the organic solvents such as EC and PC, before and after safety tests. These
bands decrease in intensity, thus a sign of these solvents to be preferentially consumed,
while the IL band shapes remain identical with only a minor increase in relative intensity.

53
Figure 30. Various safety measures as functions of the electrolyte IL content: (a) FP, (b) IT, and (c)
SET. Reference data for 1M MPF6 in EC:DMC (M=Na, Li) are represented by horizontal lines. (V)
4.2 Sodium Ion Solvation and Coordination The Na+ or Li+ solvation in battery electrolytes is a basic requirement to allow for charge
carrier of interest to be transported through the electrolyte and between the electrodes.
Depending on the composition of the electrolyte, different complexes can be formed,
ultimately influencing properties such as the ionic conductivity and the viscosity. In this
thesis Raman spectroscopy and DFT calculations have been used, often jointly, in order to
characterize these complexes – in liquid i.e. organic solvent based (II), IL based (III), and
hybrid organic solvent / IL based (V) electrolytes.
As a few examples, in III, the formation of Na[(TFSI)n]-(n-1) was investigated for imidazolium
cation IL based electrolytes and compared to the already studied Li[(TFSI)n]-(n-1) complexes
arising from the analogous Li system [247-250]. The strong Raman band located at 730-765
cm-1, known as the best solvation probe for TFSI [247, 249, 251-254], was examined in detail
and deconvoluted into two different bands (e.g. “free” TFSI and coordinated TFSI) (Fig. 31,
insert). Going from the pure ILs to the highly salt concentrated IL based electrolytes induces
a shift from 742 cm-1 to 744 cm-1 of the convoluted band, due to the formation of ion-pairs,
Na+-TFSI, and higher aggregates Na[(TFSI)n]-(n-1).

54
Moreover, the cation impacts strongly on the location of the M+-TFSI band (M = Li, Na),
where the Li+-TFSI and Na+-TFSI bands are located at 748 cm-1 and 746 cm-1 , respectively.
This is due to the different charge/radius ratios, with the Na+-TFSI interaction being slightly
weaker. Therefore, depending on the impact of the respective bands, the average
convolution can be located from 742 to 744 cm-1 as stated above. For the Na[(TFSI)n]-(n-1)
complexes the method developed by Lassègues [250] for LIBs and particularly for
Li[(TFSI)n]-(1-n) was used and adapted (III); the analysis of the intensity (area) ratio
I746/(I746+I742) for the two TFSI bands revealed that the most representative complex for Na+
seems to be Na[(TFSI)3]2- over the entire concentration range, while for the analogous Li+
system it was Li[(TFSI)2]- [250]. Comparing conductivities and viscosities for Na and Li
conducting IL based electrolytes (III), the Na based electrolytes were found to have lower
conductivities and higher viscosities, in accordance with a larger Na complex formed. This
was also supported by DFT calculations showing Na[(TFSI)3]2- (and Na[(TFSI)2]-) to be
energetically favoured (III).
Figure 31. Raman spectra of NaxEMIm(1-x)TFSI and NaxBMIm(1-x)TFSI between 725-765 cm-1 for
different molar fractions with the deconvolution and fitting for NaxEMIm(1-x)TFSI, x=sat, as insert.
In both II and V studies on liquid and hybrid electrolytes were carried out to determine the
composition of the Na+ solvation shell. In contrast to III the salt concentration was kept
constant while the proportions of the solvents in the electrolytes were modified. In II the
liquid electrolytes contained NaTFSI, EC, PC, and DMC, while the hybrid electrolytes in V
were composed of NaTFSI, EC, PC, and various ILs. Both in II and V the Raman spectroscopy
analysis of the EC ring bending mode band at 714 cm-1 [255-258] and the EC breathing mode
band at 893 cm-1 [255, 259], shifting to 724 cm-1 and 900 cm-1 upon sodium cation
coordination (Fig. 32), respectively, revealed that the solvation shells were constituted
mainly of EC. Considering the other potential contribution in II, DMC, the band located at

55
915 cm-1 presented a very weak intensity shoulder/band at 925 cm-1 assignable to Na+-DMC
(Fig. 28a), suggesting its contribution to the solvation shell to be minor. The PC band located
at 712 cm-1 did not show any change suggesting none or only a weak contribution to the Na+
solvation.
In II the TFSI contribution to the solvation shell was minor and constant, proportional to the
1 M salt concentration, while in V, the ILs provided a large amount of TFSI enhancing the
contribution. Therefore, the solvation shells in V were mainly constituted of EC and TFSI for
all the hybrid electrolytes (Tables 12 and 13). In more detail the addition of IL increased the
SNTFSI contribution, decreased the SNEC, and decreased the SNTotal. The latter could be due to
steric effects hindering EC and TFSI to coordinate Na+ simultaneously.
Figure 32. Raman spectra of 1 M NaTFSI in ECx:PCx:DMC(1-2x) between 880-940 cm-1 for different
electrolyte compositions (x= 0.25, 0.33, 0.45, and 0.50).
Table 12. Associated vibrational modes to bands used in the analysis of hybrid electrolytes.
Vibrational mode 𝝂𝑺𝑵𝑺 𝝂𝒓𝒊𝒏𝒈 𝒃𝒓𝒆𝒂𝒕𝒉𝒊𝒏𝒈
Species TFSI Na+-TFSI EC Na+-EC
Experimental Frequency [cm-1] 741±1 744±1 893±1 901±1
Computed Raman Activity [amu Å-4] 20 19.2 13.7 18.3

56
Table 13. Solvation number analysis of hybrid electrolytes for two different types of ILs.
Electrolytes 𝑨𝑵𝒂+−𝑬𝑪
𝑨𝑻𝒐𝒕𝒂𝒍
𝑨𝑵𝒂+−𝑻𝑭𝑺𝑰
𝑨𝑻𝒐𝒕𝒂𝒍 𝑺𝑵𝑬𝑪 𝑺𝑵𝑻𝑭𝑺𝑰 𝑺𝑵𝑻𝒐𝒕𝒂𝒍
EC0.45PC0.45BMImTFSI0.10 0.41 0.27 2.16 0.35 2.52
EC0.25PC0.25BMImTFSI0.50 0.47 0.31 1.42 0.79 2.21
EC0.10PC0.10BMImTFSI0.80 0.54 0.31 0.67 1.07 1.73
EC0.45PC0.45Pyr13TFSI0.10 0.37 0.30 1.98 0.40 2.38
EC0.25PC0.25Pyr13TFSI0.50 0.55 0.27 1.71 0.70 2.41
EC0.10PC0.10Pyr13TFSI0.80 0.58 0.34 0.72 1.20 1.92
4.3 Electrode Synthesis and SIB Performance
The electrode synthesis plays a major role in the mechanical and electrochemical
performance of any battery type e.g. LIB, SIB [260]. In this thesis, the MW synthesis have
been chosen due to its attractiveness to produce inorganic nanoparticles and more
specifically TiO2 anode nanoparticles [235, 261]. The MW technique allows a much faster
synthesis of the active TiO2 material with smaller particle sizes and a higher yield.
Furthermore, the synthesis was made in a liquid environment and at the time of the
publication it was the first known TiO2 electrode made with this set-up and technique. The
final results were impressive as only two minutes were necessary to synthesize particles of
sizes ranging between 3-15 nm, while other techniques would need several days to obtain
larger sized particles [262, 263]. Aside the amount of time saved, generally commercially
attractive, the particle size reduction usually affects the electronic and ionic diffusion of the
electrode to improve the electrochemical properties [264]. TiO2 anatase have been also
synthesized using a domestic MW and it has been shown that the particle size were larger
than the liquid phase synthesis. In I the electrochemical performance for the MW
synthesized TiO2 active anatase (Fig. 33) showed capacities of 155 mAhg-1 at C/15 with a
good capacity retention were observed at high C-rates, 70 mAhg-1.

57
Figure 33. Capacity versus cycle number for MWA200 (green inverted triangles), MWA200500 (red
triangles), DMWBTMA (black circles), DMWTEA (blue squares) (left), and capacity versus cycle number of
DMWBTMA (black circles) and DMWTEA (blue squares) (right) all cycled at C/15-rate.(I)
Figure 34. Typical behaviour of the anatase TiO2 anode material (MW200500) between 1-3 V vs. Li+/Li°.
In II and V the HC anode material was extensively studied. While the study on TiO2 was
more focused on the influence of the synthesis on the electrochemical performance, the
studies on HC were oriented towards the influence of the electrolytes compositions on the
electrochemical properties such as specific capacity and rate capability (Fig. 35), and safety.
In II 1 M NaClO4 in EC:PC:DMC with different solvent proportions were used, as the main
purpose was to observe the influence of DMC content. It was revealed that while DMC does
not take a major part in the Na+ solvation, only 10% of DMC was enough to decrease the
overpotential between charge and discharge cycles together with an improvement of the
rate capability, remaining at above 300 mAhg-1. Adding more DMC decreased the coulombic
efficiency, probably due to the poor electrochemical stability of DMC at low potentials.
Moreover, the SEI study using XPS revealed EC to be the main contributor to the SEI.

58
Figure 35. (a) 1st cycle voltage vs. normalized capacity profiles for HC using 1 M NaClO4 in EC:PC:DMC
electrolytes with various amounts of DMC recorded at C/20-rate, (b) discharge capacity and (c)
coulombic efficiency vs. cycle number for the corresponding half-cells.

59
The strategy in V was slightly different as the major aim was to improve the safety
properties of the SIBs without too much negative impact on the electrochemical properties
such as specific capacities and capacity retention. Therefore, DMC was replaced by ILs,
BMImTFSI, EMImTFSI, or Pyr13TFSI, which are known for their beneficial properties for safety
(section 2.3.2) and cycled in cells with electrolytes of the composition 0.8 m NaTFSI in
EC:PC:IL. The CV experiments revealed that adding more than 10% of IL impacts negatively
on the ESW at low potentials, likely due to IL decomposition. However, the addition of ILs in
the electrolyte composition can also be beneficial as the corrosion potential of Al was
shifted to a higher voltage; from 3.5 to 4.5 V vs. Na+/Na° [265, 266]. From all the
compositions tested, the EC0.45:PC0.45:Pyr13TFSI0.10 hybrid electrolyte was selected for further
cycling studies with HC. Here the 1st cycle exhibited a large irreversible capacity leading to a
coulombic efficiency of mere 40%, while for the subsequent 7 cycles the capacity was found
to only slightly decrease with concomitant increase in the coulombic efficiency, indicative of
continuous SEI formation (Fig 36).
Figure 36. (a) Coulombic efficiency and discharge capacity vs. cycle number for HC electrodes tested
at C/10, C/5, 1C, and 2C-rates and a EC0.45:PC0.45:Pyr13TFSI0.10 electrolyte and (b) Potential vs. capacity
profiles at different C-rates for HC and a EC0.45:PC0.45:Pyr13TFSI0.10 electrolyte.

60
A good capacity retention was obtained for HC in EC0.45:PC0.45:Pyr13TFSI0.10 with a specific
capacity of 185 mAhg-1 at C/10 over 50 cycles. Several factors could explain the differences
of specific capacities obtained in II and V. The IL may modify the SEI composition as
compared to EC:PC:DMC, possibly detrimental to the system stability and increasing the
electrolyte decomposition processes at low potentials and negatively impact the diffusion of
Na+ due to a different composition. Yet another reason could be that the HCs were not
identically treated.
Moving to the positive electrode tests, carbon-coated NVPF was studied using 1 M NaPF6
and 1 M NaClO4 in EC0.45:PC0.45:DMC0.10 as the electrolytes An excellent capacity retention
was achieved with stable specific capacity of 110 mAhg-1 at C/20 for 80 cycles. In addition an
impressive rate capability was achieved with more than 90 mAhg-1 at 20C (II). Therefore, by
assembling a full cell of HC, NVPF, and 1 M NaX (X= PF6, ClO4) in EC0.45:PC0.45:DMC0.10, it was
possible to make a fully operative SIB with a very low polarisation and excellent capacity
retention upon cycling with 97 mAhg-1 over 120 cycles (Fig. 37).
Figure 37. (a) Voltage vs. capacity profiles for HC ||NVPF full SIB cells cycled with 1 M NaPF6 or 1 M
NaClO4 in EC0.45:PC0.45:DMC0.1 electrolytes recorded at C/5-rate (b) Voltage vs. capacity profiles for HC
|| NVPF full SIB cells cycled with 1 M NaPF6 in EC0.45:PC0.45:DMC0.10 electrolytes at different C-rates.

61
5 Conclusions and Outlook
It is possible to run full SIB cells exhibiting excellent properties using electrode
materials of today, despite these still being under optimisation.
From simulations of cells SIBs and LIBs can have similar energy densities. It would not
be surprising to see the amount of SIB investigations to increase further in the near
future.
Lithium and sodium conducting electrolytes and storing electrodes behave
differently, which holds promise as electrode materials electrochemically inactive for
lithium can be active for sodium.
Ionic liquid based, or hybrid, electrolytes are viable for battery applications and may
bring a higher degree of safety, a far from negligible factor for commercialisation.
The mode of electrode material synthesis can change the reactivity of a material and
MW based synthesis is a promising route to improved SIB performance. The short
processing time can be of interest and importance for mass production.
The outlook is primarily based on the results of the papers presented:
Paper I: It would be interesting to apply the MW synthesis route for other SIB
electrode materials, both anodes and cathodes, as it has been proven so efficient for
the anatase TiO2 anode materials.
Paper II: The results obtained with liquid organic solvent based electrolytes is a good
omen also for a possible application with ILs as safety enhancing additives, even if
the ionic conductivities would be slightly reduced.
Paper III: The spectroscopic characterization of IL based electrolytes will be a future
tool for increased understanding also of the formation of the SEI within SIBs. Indeed,
it would be interesting in the future to focus on the SEI formation to select the most
appropriate ILs for each available electrode material.

62
Paper IV: This review focused on SIB electrolytes summarizes the revival of SIB
interest since the 2000s. Inspired by LIBs, the future of this technology seem to be
bright while accomplished prototypes already appeared in the battery field [267].
SIBs are considered as the best alternative to LIBs and are expected to grow very
quickly in the future.
Paper V: ILs as additives have been shown to improve the safety properties of
electrolytes, utterly important for future commercialization. However, it would be
interesting to use pure IL based electrolytes with good electrochemical properties in
a full SIB cell. Larger ESWs and low potential limit upon reduction are the key
features to develop further.

63
Acknowledgements
I would like to thank my supervisors Patrik and Rosa giving me the opportunity to work on
an interesting project between Sweden and Spain. The healthy working environment and
the quality of facilities have made my PhD a fascinating experience. The financial support
from the Swedish Energy Agency, the Swedish Science Council (VR), Stiftelsen Olle Engkvist
Byggmästare, and Chalmers Areas of Advance of Materials and Energy, are all gratefully
acknowledged.
Thanks to the whole KMF group for the support that it can bring when everything goes
wrong, and particularly to Luis, Johan, Susanne, Maciej, Benson, Khalid, Ezio and Erlendur
who have welcomed me the very first days of my Swedish journey; they are my old guard.
Also, I would like to give a special mention to the two Asian ninjas who occupied MY office
when I came back from Barcelona. I have no idea how they manage to stand me for two
years.
Also I am really grateful to all the people I have worked with in Spain. El ICMAB is an
amazing institute where I could share many ideas and pull out an impressive amount of
results which could not be possible to achieve only in Sweden. Muchas gracias, Alex y Jess
para vuestra bondad y generosidad durante el año que he pasado en Barcelona.
Je remercie également ma famille et tout particulièrement mes parents pour m’avoir permis
d’être ce que je suis à présent.

64
Bibliography
[1] G.C. Allen, Econ J, 77 (1967) 138-140. [2] D. Altschiller, Libr J, 132 (2007) 94-94. [3] H. Heaton, Am Hist Rev, 64 (1959) 351-353. [4] R. Rohd, R. Muller, Berkeley Earth, (2015) http://berkeleyearth.org/wp-content/uploads/2015/2008/China-Air-Quality-Paper-July-2015.pdf. [5] IEA, International Energy Agency, (Key World Energy Statistics, 2014) 28, 29, 44. [6] Y. Nishi, Chem Rec, 1 (2001) 406-413. [7] S. Megahed, B. Scrosati, J Power Sources, 51 (1994) 79-104. [8] Y. Nishi, J Power Sources, 100 (2001) 101-106. [9] J.M. Tarascon, M. Armand, Nature, 414 (2001) 359-367. [10] IEA, International Energy Agency, (Key World Energy Statistics, 2012) 6, 24, 28. [11] IEA, International Energy Agency, (Key World Energy Statistics, 2013) 6, 24, 28. [12] A. Shibata, K. Sato, Power Eng J, 13 (1999) 130-135. [13] D. Aurbach, Y. Gofer, Z. Lu, A. Schechter, O. Chusid, H. Gizbar, Y. Cohen, V. Ashkenazi, M. Moshkovich, R. Turgeman, E. Levi, J Power Sources, 97-8 (2001) 28-32. [14] K.F. Blurton, A.F. Sammells, J Power Sources, 4 (1979) 263-279. [15] Organisation Internationale des Constructeurs Automobiles, (OICA) http://www.oica.net/. [16] U.S. Geological Survey, 2013 (Mineral Commodity Summaries 2013). [17] M.D. Slater, D. Kim, E. Lee, C.S. Johnson, Adv Funct Mater, 23 (2013) 947-958. [18] E.J. Cairns, Encyclopedia of Energy, 1 (2004) 117-126. [19] J. Kopera, Inside the Nickel Metal Hydride Battery, (2004). [20] D. Linden, T.B. Reddy, Handbook of Batteries, Chapter 26 (2011). [21] A. Ponrouch, R. Dedryvere, D. Monti, A.E. Demet, J.M.A. Mba, L. Croguennec, C. Masquelier, P. Johansson, M.R. Palacin, Energ Environ Sci, 6 (2013) 2361-2369. [22] A. Ponrouch, D. Monti, A. Boschin, B. Steen, P. Johansson, M.R. Palacin, J Mater Chem A, 3 (2015) 22-42. [23] A. Volta, Philosophical Transactions Royal Society London, 90 (1800) 403. [24] E. Quartarone, P. Mustarelli, A. Magistris, Solid State Ionics, 110 (1998) 1-14. [25] K. Kubota, S. Komaba, J Electrochem Soc, 162 (2015) A2538-A2550. [26] A.J. Bard, L.R. Faulkner, Electrochemical methods - Fundamentals and Applications, Wiley, 2001. [27] M.R. Palacin, Chem Soc Rev, 38 (2009) 2565-2575. [28] M.M. Thackeray, J.T. Vaughey, C.S. Johnson, A.J. Kropf, R. Benedek, L.M.L. Fransson, K. Edstrom, J Power Sources, 113 (2003) 124-130. [29] K. Mizushima, P.C. Jones, P.J. Wiseman, J.B. Goodenough, Mater Res Bull, 15 (1980) 783-789. [30] A.S. Nagelberg, W.L. Worrell, J Solid State Chem, 29 (1979) 345-354. [31] C. Delmas, C. Fouassier, P. Hagenmuller, Physica B & C, 99 (1980) 81-85. [32] J.J. Braconnier, C. Delmas, C. Fouassier, P. Hagenmuller, Mater Res Bull, 15 (1980) 1797-1804. [33] M.S. Whittingham, Prog Solid State Ch, 12 (1978) 41-99. [34] H.L. Pan, Y.S. Hu, L.Q. Chen, Energ Environ Sci, 6 (2013) 2338-2360. [35] B.L. Ellis, L.F. Nazar, Curr Opin Solid St M, 16 (2012) 168-177. [36] J.P. Parant, R. Olazcuag, M. Devalett, C. Fouassie, P. Hagenmul, J Solid State Chem, 3 (1971) 1-11. [37] C. Delmas, J.J. Braconnier, C. Fouassier, P. Hagenmuller, Solid State Ionics, 3-4 (1981) 165-169. [38] J.J. Braconnier, C. Delmas, P. Hagenmuller, Mater Res Bull, 17 (1982) 993-1000. [39] M.S. Whittingham, J Chem Soc Chem Comm, (1974) 328-329. [40] M.S. Whittingham, R.A. Huggins, J Chem Phys, 54 (1971) 414-416. [41] M.S. Whittingham, Science, 192 (1976) 1126-1127.

65
[42] T. Nagaura, K. Tozawa, Progress in Batteries and Solar Cells, 9 (1990) 209-213. [43] S. Komaba, W. Murata, T. Ishikawa, N. Yabuuchi, T. Ozeki, T. Nakayama, A. Ogata, K. Gotoh, K. Fujiwara, Adv Funct Mater, 21 (2011) 3859-3867. [44] S.P. Ong, V.L. Chevrier, G. Hautier, A. Jain, C. Moore, S. Kim, X.H. Ma, G. Ceder, Energ Environ Sci, 4 (2011) 3680-3688. [45] S.Y. Hong, Y. Kim, Y. Park, A. Choi, N.S. Choi, K.T. Lee, Energ Environ Sci, 6 (2013) 2067-2081. [46] Y. Liu, F.F. Fan, J.W. Wang, Y. Liu, H.L. Chen, K.L. Jungjohann, Y.H. Xu, Y.J. Zhu, D. Bigio, T. Zhu, C.S. Wang, Nano Lett, 14 (2014) 3445-3452. [47] D.P. Divincenzo, E.J. Mele, Phys Rev B, 32 (1985) 2538-2553. [48] J. Sangster, J Phase Equilib Diff, 28 (2007) 571-579. [49] D.A. Stevens, J.R. Dahn, J Electrochem Soc, 147 (2000) 1271-1273. [50] J. Zhao, L.W. Zhao, K. Chihara, S. Okada, J. Yamaki, S. Matsumoto, S. Kuze, K. Nakane, J Power Sources, 244 (2013) 752-757. [51] P. Senguttuvan, G. Rousse, V. Seznec, J.M. Tarascon, M.R. Palacin, Chem Mater, 23 (2011) 4109-4111. [52] H. Xiong, M.D. Slater, M. Balasubramanian, C.S. Johnson, T. Rajh, J Phys Chem Lett, 2 (2011) 2560-2565. [53] A.V. Chadwick, S.L.P. Savin, S. Fiddy, R. Alcantara, D.F. Lisbona, P. Lavela, G.F. Ortiz, J.L. Tirado, J Phys Chem C, 111 (2007) 4636-4642. [54] Q. Sun, Q.Q. Ren, H. Li, Z.W. Fu, Electrochem Commun, 13 (2011) 1462-1464. [55] L.F. Xiao, Y.L. Cao, J. Xiao, W. Wang, L. Kovarik, Z.M. Nie, J. Liu, Chem Commun, 48 (2012) 3321-3323. [56] S. Il Park, I. Gocheva, S. Okada, J. Yamaki, J Electrochem Soc, 158 (2011) A1067-A1070. [57] J.S. Kim, H.J. Ahn, H.S. Ryu, D.J. Kim, G.B. Cho, K.W. Kim, T.H. Nam, J.H. Ahn, J Power Sources, 178 (2008) 852-856. [58] C.B. Zhu, X.K. Mu, P.A. van Aken, Y. Yu, J. Maier, Angew Chem Int Edit, 53 (2014) 2152-2156. [59] T.F. Zhou, W.K. Pang, C.F. Zhang, J.P. Yang, Z.X. Chen, H.K. Liu, Z.P. Guo, Acs Nano, 8 (2014) 8323-8333. [60] Y. Kim, Y. Kim, A. Choi, S. Woo, D. Mok, N.S. Choi, Y.S. Jung, J.H. Ryu, S.M. Oh, K.T. Lee, Adv Mater, 26 (2014) 4139-4144. [61] J. Fullenwarth, A. Darwiche, A. Soares, B. Donnadieu, L. Monconduit, J Mater Chem A, 2 (2014) 2050-2059. [62] V.L. Chevrier, G. Ceder, J Electrochem Soc, 158 (2011) A1011-A1014. [63] A. Darwiche, C. Marino, M.T. Sougrati, B. Fraisse, L. Stievano, L. Monconduit, J Am Chem Soc, 134 (2012) 20805-20811. [64] S.M. Oh, S.T. Myung, C.S. Yoon, J. Lu, J. Hassoun, B. Scrosati, K. Amine, Y.K. Sun, Nano Lett, 14 (2014) 1620-1626. [65] M.C. Lopez, P. Lavela, G.F. Ortiz, J.L. Tirado, Electrochem Commun, 27 (2013) 152-155. [66] M. Valvo, F. Lindgren, U. Lafont, F. Bjorefors, K. Edstrom, J Power Sources, 245 (2014) 967-978. [67] S. Hariharan, K. Saravanan, P. Balaya, Electrochem Commun, 31 (2013) 5-9. [68] S. Yuan, X.L. Huang, D.L. Ma, H.G. Wang, F.Z. Meng, X.B. Zhang, Adv Mater, 26 (2014) 2273-2279. [69] L. Zhao, J.M. Zhao, Y.S. Hu, H. Li, Z.B. Zhou, M. Armand, L.Q. Chen, Adv Energy Mater, 2 (2012) 962-965. [70] M.M. Doeff, Y.P. Ma, S.J. Visco, L.C. Dejonghe, J Electrochem Soc, 140 (1993) L169-L170. [71] M.M. Doeff, M.Y. Peng, Y.P. Ma, L.C. Dejonghe, J Electrochem Soc, 141 (1994) L145-L147. [72] A. Ponrouch, A.R. Goni, M.R. Palacin, Electrochem Commun, 27 (2013) 85-88. [73] D.A. Stevens, J.R. Dahn, J Electrochem Soc, 148 (2001) A803-A811. [74] P. Thomas, D. Billaud, Electrochim Acta, 47 (2002) 3303-3307. [75] R. Alcantara, J.M. Jimenez-Mateos, P. Lavela, J.L. Tirado, Electrochem Commun, 3 (2001) 639-642.

66
[76] T. Kikuchi, K. Kurakane, T. Yamamoto, T. Hattori, M. Makidera, U.S. Patent, US 2010/0248041 A1, (2010). [77] C. Delmas, A. Maazaz, P. Hagenmuller, Solid State Ionics, 9-10 (1983) 83-88. [78] R. Alcantara, M. Jaraba, P. Lavela, J.L. Tirado, Chem Mater, 14 (2002) 2847-2848. [79] S. Komaba, T. Mikumo, A. Ogata, Electrochem Commun, 10 (2008) 1276-1279. [80] B. Koo, S. Chattopadhyay, T. Shibata, V.B. Prakapenka, C.S. Johnson, T. Rajh, E.V. Shevchenko, Chem Mater, 25 (2013) 245-252. [81] A. Jahel, C.M. Ghimbeu, A. Darwiche, L. Vidal, S. Hajjar-Garreau, C. Vix-Guterl, L. Monconduit, J Mater Chem A, 3 (2015) 11960-11969. [82] P. Wu, N. Du, H. Zhang, J.X. Yu, Y. Qi, D.R. Yang, Nanoscale, 3 (2011) 746-750. [83] Y. Wang, D.W. Su, C.Y. Wang, G.X. Wang, Electrochem Commun, 29 (2013) 8-11. [84] T.B. Kim, J.W. Choi, H.S. Ryu, G.B. Cho, K.W. Kim, J.H. Ahn, K.K. Cho, H.J. Ahn, J Power Sources, 174 (2007) 1275-1278. [85] X.J. Liu, S. Kang, J. Kim, H. Ahn, S. Lim, I. Ahn, Rare Metals, 30 (2011) 5-10. [86] T.B. Kim, W.H. Jung, H.S. Ryu, K.W. Kim, J.H. Ahn, K.K. Cho, G.B. Cho, T.H. Nam, I.S. Ahn, H.J. Ahn, J Alloy Compd, 449 (2008) 304-307. [87] J.F. Qian, Y. Chen, L. Wu, Y.L. Cao, X.P. Ai, H.X. Yang, Chem Commun, 48 (2012) 7070-7072. [88] Y. Park, D.S. Shin, S.H. Woo, N.S. Choi, K.H. Shin, S.M. Oh, K.T. Lee, S.Y. Hong, Adv Mater, 24 (2012) 3562-3567. [89] V.A. Mihali, S. Renault, L. Nyholm, D. Brandell, Rsc Adv, 4 (2014) 38004-38011. [90] S.W. Kim, D.H. Seo, X.H. Ma, G. Ceder, K. Kang, Adv Energy Mater, 2 (2012) 710-721. [91] V. Palomares, P. Serras, I. Villaluenga, K.B. Hueso, J. Carretero-Gonzalez, T. Rojo, Energ Environ Sci, 5 (2012) 5884-5901. [92] L.P. Wang, L.H. Yu, X. Wang, M. Srinivasan, Z.C.J. Xu, J Mater Chem A, 3 (2015) 9353-9378. [93] M. Sawicki, L.L. Shaw, Rsc Adv, 5 (2015) 53129-53154. [94] D. Kim, E. Lee, M. Slater, W.Q. Lu, S. Rood, C.S. Johnson, Electrochem Commun, 18 (2012) 66-69. [95] S. Komaba, C. Takei, T. Nakayama, A. Ogata, N. Yabuuchi, Electrochem Commun, 12 (2010) 355-358. [96] N. Yabuuchi, M. Kajiyama, J. Iwatate, H. Nishikawa, S. Hitomi, R. Okuyama, R. Usui, Y. Yamada, S. Komaba, Nat Mater, 11 (2012) 512-517. [97] M. Sathiya, K. Hemalatha, K. Ramesha, J.M. Tarascon, A.S. Prakash, Chem Mater, 24 (2012) 1846-1853. [98] C. Masquelier, L. Croguennec, Chem Rev, 113 (2013) 6552-6591. [99] D.B. Porter, R. Olazcuaga, C. Delmas, F. Cherkaoui, R. Brochu, G. Leflem, Rev Chim Miner, 17 (1980) 458-465. [100] Z.L. Jian, L. Zhao, H.L. Pan, Y.S. Hu, H. Li, W. Chen, L.Q. Chen, Electrochem Commun, 14 (2012) 86-89. [101] C. Didier, M. Guignard, C. Denage, O. Szajwaj, S. Ito, I. Saadoune, J. Darriet, C. Delmas, Electrochem Solid St, 14 (2011) A75-A78. [102] H.M. Liu, H.S. Zhou, L.P. Chen, Z.F. Tang, W.S. Yang, J Power Sources, 196 (2011) 814-819. [103] K. Saravanan, C.W. Mason, A. Rudola, K.H. Wong, P. Balaya, Adv Energy Mater, 3 (2013) 444-450. [104] R.A. Shakoor, D.H. Seo, H. Kim, Y.U. Park, J. Kim, S.W. Kim, H. Gwon, S. Lee, K. Kang, J Mater Chem, 22 (2012) 20535-20541. [105] M. Nishijima, I.D. Gocheva, S. Okada, T. Doi, J. Yamaki, T. Nishida, J Power Sources, 190 (2009) 558-562. [106] Y.L. Liu, Y.H. Xu, X.G. Han, C. Pellegrinelli, Y.J. Zhu, H.L. Zhu, J.Y. Wan, A.C. Chung, O. Vaaland, C.S. Wang, L.B. Hu, Nano Lett, 12 (2012) 5664-5668. [107] X.H. Ma, H.L. Chen, G. Ceder, J Electrochem Soc, 158 (2011) A1307-A1312. [108] J. Billaud, R.J. Clement, A.R. Armstrong, J. Canales-Vazquez, P. Rozier, C.P. Grey, P.G. Bruce, J Am Chem Soc, 136 (2014) 17243-17248.

67
[109] I.H. Jo, H.S. Ryu, D.G. Gu, J.S. Park, I.S. Ahn, H.J. Ahn, T.H. Nam, K.W. Kim, Mater Res Bull, 58 (2014) 74-77. [110] J. Zhao, L.W. Zhao, N. Dimov, S. Okada, T. Nishida, J Electrochem Soc, 160 (2013) A3077-A3081. [111] L.G. Chagas, D. Buchholz, L.M. Wu, B. Vortmann, S. Passerini, J Power Sources, 247 (2014) 377-383. [112] D.D. Yuan, X.H. Hu, J.F. Qian, F. Pei, F.Y. Wu, R.J. Mao, X.P. Ai, H.X. Yang, Y.L. Cao, Electrochim Acta, 116 (2014) 300-305. [113] H.J. Yu, S.H. Guo, Y.B. Zhu, M. Ishida, H.S. Zhou, Chem Commun, 50 (2014) 457-459. [114] P. Barpanda, G. Oyama, S. Nishimura, S.C. Chung, A. Yamada, Nat Commun, 5 (2014). [115] Y. Kawabe, N. Yabuuchi, M. Kajiyama, N. Fukuhara, T. Inamasu, R. Okuyama, I. Nakai, S. Komaba, Electrochem Commun, 13 (2011) 1225-1228. [116] Y. Lu, S. Zhang, Y. Li, L.G. Xue, G.J. Xu, X.W. Zhang, J Power Sources, 247 (2014) 770-777. [117] P. Serras, V. Palomares, P. Kubiak, L. Lezama, T. Rojo, Electrochem Commun, 34 (2013) 344-347. [118] H.L. Chen, Q. Hao, O. Zivkovic, G. Hautier, L.S. Du, Y.Z. Tang, Y.Y. Hu, X.H. Ma, C.P. Grey, G. Ceder, Chem Mater, 25 (2013) 2777-2786. [119] M. Nose, H. Nakayama, K. Nobuhara, H. Yamaguchi, S. Nakanishi, H. Iba, J Power Sources, 234 (2013) 175-179. [120] S.Y. Lim, H. Kim, J. Chung, J.H. Lee, B.G. Kim, J.J. Choi, K.Y. Chung, W. Cho, S.J. Kim, W.A. Goddard, Y. Jung, J.W. Choi, P Natl Acad Sci USA, 111 (2014) 599-604. [121] L. Wang, Y.H. Lu, J. Liu, M.W. Xu, J.G. Cheng, D.W. Zhang, J.B. Goodenough, Angew Chem Int Edit, 52 (2013) 1964-1967. [122] R.K.B. Gover, A. Bryan, P. Burns, J. Barker, Solid State Ionics, 177 (2006) 1495-1500. [123] M. Bianchini, N. Brisset, F. Fauth, F. Weill, E. Elkaim, E. Suard, C. Masquelier, L. Croguennec, Chem Mater, 26 (2014) 4238-4247. [124] J. Barker, M.Y. Saidi, J. Swoyer, U.S. Patent 6,387,568, (2002). [125] H. Vogel, Phys Z, 22 (1921) 645-646. [126] G. Tammann, W. Hesse, Z Anorg Allg Chem, 156 (1926). [127] G.S. Fulcher, J Am Ceram Soc, 8 (1925) 339-355. [128] F. Croce, G.B. Appetecchi, L. Persi, B. Scrosati, Nature, 394 (1998) 456-458. [129] F. Croce, L. Settimi, B. Scrosati, D. Zane, J New Mat Electr Sys, 9 (2006) 3-9. [130] K. Xu, Chem Rev, 104 (2004) 4303-4417. [131] V.M. Mohan, V. Raja, P.B. Bhargav, A.K. Sharma, V.V.R.N. Rao, J Polym Res, 14 (2007) 283-290. [132] M. Patel, K.G. Chandrappa, A.J. Bhattacharyya, Solid State Ionics, 181 (2010) 844-848. [133] J.W. Hoj, J. Engell, Mat Sci Eng B-Solid, 19 (1993) 228-233. [134] D. Monti, E. Jónsson, M.R. Palacin, P. Johansson, J Power Sources, 245 (2014) 630-636. [135] J.T. Kummer, N. Weber, Sae Transactions, 76 (1968) 88-99. [136] K.B. Hueso, M. Armand, T. Rojo, Energ Environ Sci, 6 (2013) 734-749. [137] P.B. Bhargav, V.M. Mohan, A.K. Sharma, V.V.R.N. Rao, Ionics, 13 (2007) 441-446. [138] S. Link, M.A. El-Sayed, J Phys Chem B, 103 (1999) 4212-4217. [139] K. Koga, T. Ikeshoji, K. Sugawara, Phys Rev Lett, 92 (2004). [140] S.K. Ghosh, T. Pal, Chem Rev, 107 (2007) 4797-4862. [141] E. Peled, C. Menachem, D. BarTow, A. Melman, J Electrochem Soc, 143 (1996) L4-L7. [142] K.H. Su, Q.H. Wei, X. Zhang, J.J. Mock, D.R. Smith, S. Schultz, Nano Lett, 3 (2003) 1087-1090. [143] G. Akerlof, J Am Chem Soc, 54 (1932) 4125-4139. [144] M. Salomon, Pure Appl Chem, 70 (1998) 1905-1912. [145] J. Barthel, H.J. Gores, R. Neueder, A. Schmid, Pure Appl Chem, 71 (1999) 1705-1715. [146] E. Jonsson, P. Johansson, Phys Chem Chem Phys, 14 (2012) 10774-10779. [147] Y. Ikezawa, H. Nishi, Electrochim Acta, 53 (2008) 3663-3669. [148] S.K. Jeong, M. Inaba, Y. Iriyama, T. Abe, Z. Ogumi, Electrochim Acta, 47 (2002) 1975-1982. [149] M. Morita, Y. Asai, N. Yoshimoto, M. Ishikawa, J Chem Soc Faraday T, 94 (1998) 3451-3456.

68
[150] R. Fong, U. Vonsacken, J.R. Dahn, J Electrochem Soc, 137 (1990) 2009-2013. [151] X. Xia, J.R. Dahn, J Electrochem Soc, 159 (2012) A647-A650. [152] X. Xia, J.R. Dahn, J Electrochem Soc, 159 (2012) A1048-A1051. [153] A. Ponrouch, E. Marchante, M. Courty, J.M. Tarascon, M.R. Palacin, Energ Environ Sci, 5 (2012) 8572-8583. [154] C. Vidal-Abarca, P. Lavela, J.L. Tirado, A.V. Chadwick, M. Alfredsson, E. Kelder, J Power Sources, 197 (2012) 314-318. [155] Z.L. Jian, W.Z. Han, X. Lu, H.X. Yang, Y.S. Hu, J. Zhou, Z.B. Zhou, J.Q. Li, W. Chen, D.F. Chen, L.Q. Chen, Adv Energy Mater, 3 (2013) 156-160. [156] H. Olivier-Bourbigou, L. Magna, J Mol Catal a-Chem, 182 (2002) 419-437. [157] M. Armand, F. Endres, D.R. MacFarlane, H. Ohno, B. Scrosati, Nat Mater, 8 (2009) 621-629. [158] J.P. Hallett, T. Welton, Chem Rev, 111 (2011) 3508-3576. [159] S.J. Zhang, N. Sun, X.Z. He, X.M. Lu, X.P. Zhang, J Phys Chem Ref Data, 35 (2006) 1475-1517. [160] T. Welton, Chem Rev, 99 (1999) 2071-2083. [161] M. Galinski, A. Lewandowski, I. Stepniak, Electrochim Acta, 51 (2006) 5567-5580. [162] A. Lewandowski, M. Galinski, General properties of ionic liquids as electrolytes for carbon-based double layer capacitors, Springer, The Netherland, (2006). [163] O. Zech, M. Kellermeier, S. Thomaier, E. Maurer, R. Klein, C. Schreiner, W. Kunz, Chem-Eur J, 15 (2009) 1341-1345. [164] O. Zech, J. Hunger, J.R. Sangoro, C. Iacob, F. Kremer, W. Kunz, R. Buchner, Phys Chem Chem Phys, 12 (2010) 14341-14350. [165] P.G. Jessop, Green Chem, 13 (2011) 1391-1398. [166] Y. Zhang, B.R. Bakshi, E.S. Demessie, Environ Sci Technol, 42 (2008) 1724-1730. [167] C.S. Ding, T. Nohira, K. Kuroda, R. Hagiwara, A. Fukunaga, S. Sakai, K. Nitta, S. Inazawa, J Power Sources, 238 (2013) 296-300. [168] C.S. Ding, T. Nohira, R. Hagiwara, K. Matsumoto, Y. Okamoto, A. Fukunaga, S. Sakai, K. Nitta, S. Inazawa, J Power Sources, 269 (2014) 124-128. [169] T. Nohira, T. Ishibashi, R. Hagiwara, J Power Sources, 205 (2012) 506-509. [170] A. Fukunaga, T. Nohira, Y. Kozawa, R. Hagiwara, S. Sakai, K. Nitta, S. Inazawa, J Power Sources, 209 (2012) 52-56. [171] T. Yamamoto, T. Nohira, R. Hagiwara, A. Fukunaga, S. Sakai, K. Nitta, S. Inazawa, J Power Sources, 217 (2012) 479-484. [172] A. Fukunaga, T. Nohira, R. Hagiwara, K. Numata, E. Itani, S. Sakai, K. Nitta, S. Inazawa, J Power Sources, 246 (2014) 387–391. [173] C. Ding, T. Nohira, R. Hagiwara, A. Fukunaga, S. Sakai, K. Nitta, Electrochim Acta, 176 (2015) 344-349. [174] S.A.M. Noor, P.C. Howlett, D.R. MacFarlane, M. Forsyth, Electrochim Acta, 114 (2013) 766-771. [175] H. Yoon, H.J. Zhu, A. Hervault, M. Armand, D.R. MacFarlane, M. Forsyth, Phys Chem Chem Phys, 16 (2014) 12350-12355. [176] J.S. Moreno, G. Maresca, S. Panero, B. Scrosati, G.B. Appetecchi, Electrochem Commun, 43 (2014) 1-4. [177] N. Wongittharom, T.C. Lee, C.H. Wang, Y.C. Wang, J.K. Chang, J Mater Chem A, 2 (2014) 5655-5661. [178] K. Matsumoto, T. Hosokawa, T. Nohira, R. Hagiwara, A. Fukunaga, K. Numata, E. Itani, S. Sakai, K. Nitta, S. Inazawa, J Power Sources, 265 (2014) 36-39. [179] A. Guerfi, M. Dontigny, P. Charest, M. Petitclerc, M. Lagace, A. Vijh, K. Zaghib, J Power Sources, 195 (2010) 845-852. [180] R.S. Kuhnel, A. Balducci, J Phys Chem C, 118 (2014) 5742-5748. [181] S. Menne, R.S. Kuhnel, A. Balducci, Electrochim Acta, 90 (2013) 641-648. [182] S. Wilken, S.Z. Xiong, J. Scheers, P. Jacobsson, P. Johansson, J Power Sources, 275 (2015) 935-942.

69
[183] T. Sato, T. Maruo, S. Marukane, K. Takagi, J Power Sources, 138 (2004) 253-261. [184] M. Montanino, M. Moreno, M. Carewska, G. Maresca, E. Simonetti, R. Lo Presti, F. Alessandrini, G.B. Appetecchi, J Power Sources, 269 (2014) 608-615. [185] T. Vogl, S. Menne, A. Balducci, Phys Chem Chem Phys, 16 (2014) 25014-25023. [186] L. Lombardo, S. Brutti, M.A. Navarra, S. Panero, P. Reale, J Power Sources, 227 (2013) 8-14. [187] B.B. Yang, C.H. Li, J.H. Zhou, J.H. Liu, Q.L. Zhang, Electrochim Acta, 148 (2014) 39-45. [188] A.S. Arico, P. Bruce, B. Scrosati, J.M. Tarascon, W. Van Schalkwijk, Nat Mater, 4 (2005) 366-377. [189] P.G. Bruce, B. Scrosati, J.M. Tarascon, Angew Chem Int Edit, 47 (2008) 2930-2946. [190] J.B. Goodenough, Y. Kim, Chem Mater, 22 (2010) 587-603. [191] C. Liu, F. Li, L.P. Ma, H.M. Cheng, Adv Mater, 22 (2010) E28-E62. [192] E. Peled, H. Yamin, Israel J Chem, 18 (1979) 131-135. [193] P. Verma, P. Maire, P. Novak, Electrochim Acta, 55 (2010) 6332-6341. [194] D. Aurbach, B. Markovsky, A. Shechter, Y. EinEli, H. Cohen, J Electrochem Soc, 143 (1996) 3809-3820. [195] D. Aurbach, M.D. Levi, E. Levi, A. Schechter, J Phys Chem B, 101 (1997) 2195-2206. [196] D. Aurbach, A. Zaban, J Electroanal Chem, 348 (1993) 155-179. [197] A.M. Andersson, K. Edstrom, J Electrochem Soc, 148 (2001) A1100-A1109. [198] A. Kominato, E. Yasukawa, N. Sato, T. Ijuuin, H. Asahina, S. Mori, J Power Sources, 68 (1997) 471-475. [199] N. Weadock, N. Varongchayakul, J.Y. Wan, S. Lee, J. Seog, L.B. Hu, Nano Energy, 2 (2013) 713-719. [200] M.A. Munoz-Marquez, M. Zarrabeitia, E. Castillo-Martinez, A. Eguia-Barrio, T. Rojo, M. Casas-Cabanas, Acs Appl Mater Inter, 7 (2015) 7801-7808. [201] S. Wenzel, T. Hara, J. Janek, P. Adelhelm, Energ Environ Sci, 4 (2011) 3342-3345. [202] L. Vogdanis, B. Martens, H. Uchtmann, F. Hensel, W. Heitz, Makromol Chem, 191 (1990) 465-472. [203] A. Abouimrane, W. Weng, H. Eltayeb, Y.J. Cui, J. Niklas, O. Poluektov, K. Amine, Energ Environ Sci, 5 (2012) 9632-9638. [204] R. Dedryvere, D. Foix, S. Franger, S. Patoux, L. Daniel, D. Gonbeau, J Phys Chem C, 114 (2010) 10999-11008. [205] R. Dedryvere, M. Maccario, L. Croguennec, F. Le Cras, C. Delmas, D. Gonbeau, Chem Mater, 20 (2008) 7164-7170. [206] H. Duncan, D. Duguay, Y. Abu-Lebdeh, I.J. Davidson, J Electrochem Soc, 158 (2011) A537-A545. [207] M. Broussely, P. Biensan, F. Bonhomme, P. Blanchard, S. Herreyre, K. Nechev, R.J. Staniewicz, J Power Sources, 146 (2005) 90-96. [208] A.M. Andersson, D.P. Abraham, R. Haasch, S. MacLaren, J. Liu, K. Amine, J Electrochem Soc, 149 (2002) A1358-A1369. [209] I. Yamada, K. Miyazaki, T. Fukutsuka, Y. Iriyama, T. Abe, Z. Ogumi, J Power Sources, 294 (2015) 460-464. [210] D. Aurbach, K. Gamolsky, B. Markovsky, G. Salitra, Y. Gofer, U. Heider, R. Oesten, M. Schmidt, J Electrochem Soc, 147 (2000) 1322-1331. [211] Y.F. Yuan, H.M. Wu, S.Y. Guo, J.B. Wu, J.L. Yang, X.L. Wang, J.P. Tu, Appl Surf Sci, 255 (2008) 2225-2229. [212] J.W. Lee, S.M. Park, H.J. Kim, Electrochem Commun, 11 (2009) 1101-1104. [213] X.F. Li, Y.L. Xu, Appl Surf Sci, 253 (2007) 8592-8596. [214] J.S. Kim, C.S. Johnson, J.T. Vaughey, S.A. Hackney, K.A. Walz, W.A. Zeltner, M.A. Anderson, M.M. Thackeray, J Electrochem Soc, 151 (2004) A1755-A1761. [215] N.E. Hill, W. Vaughan, A. Price, M. Davis, Dielectric properties and molecular behaviour, Van Nostrand, London, 1969. [216] A.R. Blythe, Electrical properties of polymers, Cambridge University Press, 1979.

70
[217] J. Chamberlain, G.W. Chantry, High frequency dielectric measurement, IPC Science and Technology Press,Guildford, 1973. [218] C.J.F. Böttcher, P. Bordewijk, Theory of electric polarization, vol II. Dielectrics in time-dependent fields, Elsevier, Oxford New York, 1978. [219] F. Kremer, A. Schönhals, Brodband Dielectric spectroscopy, Springer, 2003. [220] A. Smekal, Naturwissenschaften, 11 (1923) 873-875. [221] C.V. Raman, K.S. Krishnan, Nature, 121 (1928) 501-502. [222] G.G. Stokes, Mathematical and Physical Papers, (1880) Cambridge. [223] H.O. Di Rocco, D.I. Iriarte, J. Pomarico, Appl Spectrosc, 55 (2001) 822-826. [224] M. Bradley, Curve Fitting in Raman and IR Spectroscopy: Basic Theory of Line Shapes and Applications, Thermo Fischer Scientific, (2007). [225] R.J. Meier, Vib Spectrosc, 39 (2005) 266-269. [226] M.J. Hollas, Modern Spectroscopy, (1998) 35-36. [227] D.M.P. Mingos, D.R. Baghurst, Chem Soc Rev, 20 (1991) 1-47. [228] I. Bilecka, M. Niederberger, Nanoscale, 2 (2010) 1358-1374. [229] S.H. Kang, J.B. Goodenough, J Electrochem Soc, 147 (2000) 3621-3627. [230] K.T. Hwang, W.S. Um, H.S. Lee, J.K. Song, K.W. Chung, J Power Sources, 74 (1998) 169-174. [231] D.M.P. Mingos, A.G. Whittaker, Van Eldik R, Hubbard C.D, (eds) Chemistry under extreme or non-classical conditions, Wiley, New York, 1996. [232] P. Chantrey, Electron Power, 29 (1983) 659-659. [233] D. Stuerga, K. Gonon, M. Lallemant, Tetrahedron, 49 (1993) 6229-6234. [234] W. Wu, A. Mohamed, J.F. Whitacre, J Electrochem Soc, 160 (2013) A497-A504. [235] S. Balaji, D. Mutharasu, N. Sankara Subramanian, K. Ramanathan, Ionics, 15 (2009) 765-777. [236] H.W. Yan, X.J. Huang, Z.H. Lu, H. Huang, R.J. Xue, L.Q. Chen, J Power Sources, 68 (1997) 530-532. [237] H. Li, Z.H. Lu, H. Huang, X.J. Huang, L.Q. Chen, Ionics, 2 (1996) 259-265. [238] S. Wilken, S.Z. Xiong, J. Scheers, P. Jacobsson, P. Johansson, J Power Sources, 283 (2015) 531-531. [239] S. Wilken, P. Johansson, P. Jacobsson, B. Scrosati, K.M. Abraham, W. Schalkwijk, J. Hassoun, Lithium Batteries: Advanced Technologies and Applications, Wiley, Chapter 3 (2013). [240] B. Garcia, S. Lavallee, G. Perron, C. Michot, M. Armand, Electrochim Acta, 49 (2004) 4583-4588. [241] S. Seki, Y. Ohno, Y. Kobayashi, H. Miyashiro, A. Usami, Y. Mita, H. Tokuda, M. Watanabe, K. Hayamizu, S. Tsuzuki, M. Hattori, N. Terada, J Electrochem Soc, 154 (2007) A173-A177. [242] J.K. Kim, A. Matic, J.H. Ahn, P. Jacobsson, J Power Sources, 195 (2010) 7639-7643. [243] H. Yoon, A.S. Best, M. Forsyth, D.R. MacFarlane, P.C. Howlett, Phys Chem Chem Phys, 17 (2015) 4656-4663. [244] M.S. Ding, T.R. Jow, J Electrochem Soc, 151 (2004) A2007-A2015. [245] A. Bhide, J. Hofmann, A.K. Durr, J. Janek, P. Adelhelm, Phys Chem Chem Phys, 16 (2014) 1987-1998. [246] S. Seki, Y. Kobayashi, H. Miyashiro, Y. Ohno, A. Usami, Y. Mita, N. Kihira, M. Watanabe, N. Terada, J Phys Chem B, 110 (2006) 10228-10230. [247] J.C. Lassegues, J. Grondin, D. Talaga, Phys Chem Chem Phys, 8 (2006) 5629-5632. [248] S. Duluard, J. Grondin, J.L. Bruneel, I. Pianet, A. Grelard, G. Campet, M.H. Delville, J.C. Lassegues, J Raman Spectrosc, 39 (2008) 627-632. [249] Y. Umebayashi, T. Mitsugi, S. Fukuda, T. Fujimori, K. Fujii, R. Kanzaki, M. Takeuchi, S.I. Ishiguro, J Phys Chem B, 111 (2007) 13028-13032. [250] J.C. Lassegues, J. Grondin, C. Aupetit, P. Johansson, J Phys Chem A, 113 (2009) 305-314. [251] D. Brouillette, D.E. Irish, N.J. Taylor, G. Perron, M. Odziemkowski, J.E. Desnoyers, Phys Chem Chem Phys, 4 (2002) 6063-6071. [252] M. Castriota, T. Caruso, R.G. Agostino, E. Cazzanelli, W.A. Henderson, S. Passerini, J Phys Chem A, 109 (2005) 92-96.

71
[253] A. Bakker, S. Gejji, J. Lindgren, K. Hermansson, M.M. Probst, Polymer, 36 (1995) 4371-4378. [254] L. Edman, J Phys Chem B, 104 (2000) 7254-7258. [255] B. Fortunat, P. Mirone, G. Fini, Spectrochimica Acta, A 27 (1971) 1917-1927. [256] K.L. Dorris, J.E. Boggs, A. Danti, L.L. Altpeter, J Chem Phys, 46 (1967) 1191-1193. [257] J.R. Durig, G.L. Coulter, D.W. Wertz, J Mol Spectrosc, 27 (1968) 285-295. [258] J.L. Allen, O. Borodin, D.M. Seo, W.A. Henderson, J Power Sources, 267 (2014) 821-830. [259] B. Klassen, R. Aroca, M. Nazri, G.A. Nazri, J Phys Chem B, 102 (1998) 4795-4801. [260] L.W. Ji, Z. Lin, M. Alcoutlabi, X.W. Zhang, Energ Environ Sci, 4 (2011) 2682-2699. [261] M.H. Bhat, B.P. Chakravarthy, P.A. Ramakrishnan, A. Levasseur, K.J. Rao, B Mater Sci, 23 (2000) 461-466. [262] S. Mahshid, M. Askari, M.S. Ghamsari, J Mater Process Tech, 189 (2007) 296-300. [263] A.K. Rai, L.T. Anh, J. Gim, V. Mathew, J. Kang, B.J. Paul, J. Song, J. Kim, Electrochim Acta, 90 (2013) 112-118. [264] D. Zhang, J.P. Tu, J.Y. Xiang, Y.Q. Qiao, X.H. Xia, X.L. Wang, C.D. Gu, Electrochim Acta, 56 (2011) 9980-9985. [265] R.S. Kuhnel, M. Lubke, M. Winter, S. Passerini, A. Balducci, J Power Sources, 214 (2012) 178-184. [266] C.X. Peng, L. Yang, B.F. Wang, Z.X. Zhang, N. Li, Chinese Sci Bull, 51 (2006) 2824-2830. [267] L. Cailloce, A battery revolution in motion, (accessed 2015-12-15), https://news.cnrs.fr/articles/a-battery-revolution-in-motion.