Innovative Desalination Design: Location, Pre-treament ... · Today Desalination Plant Procurement...
90
Innovative Desalination Design: Location, Pre-treament, Intake and Outfall 7 December 2018
Transcript of Innovative Desalination Design: Location, Pre-treament ... · Today Desalination Plant Procurement...
Innovative Desalination Design: Location, Pre-treament, Intake and Outfall
7 December 2018

TodayDesalination
PlantProcurement
EvaluationFIDIC Gold
Book
Risk Allocation Summary
Desalination Plant
1. Water supply Augmentation
2. Desalination as an Option
3. Desalination Processes
4. Desalination Plant Components

Water
Shortage
Why
Augment?
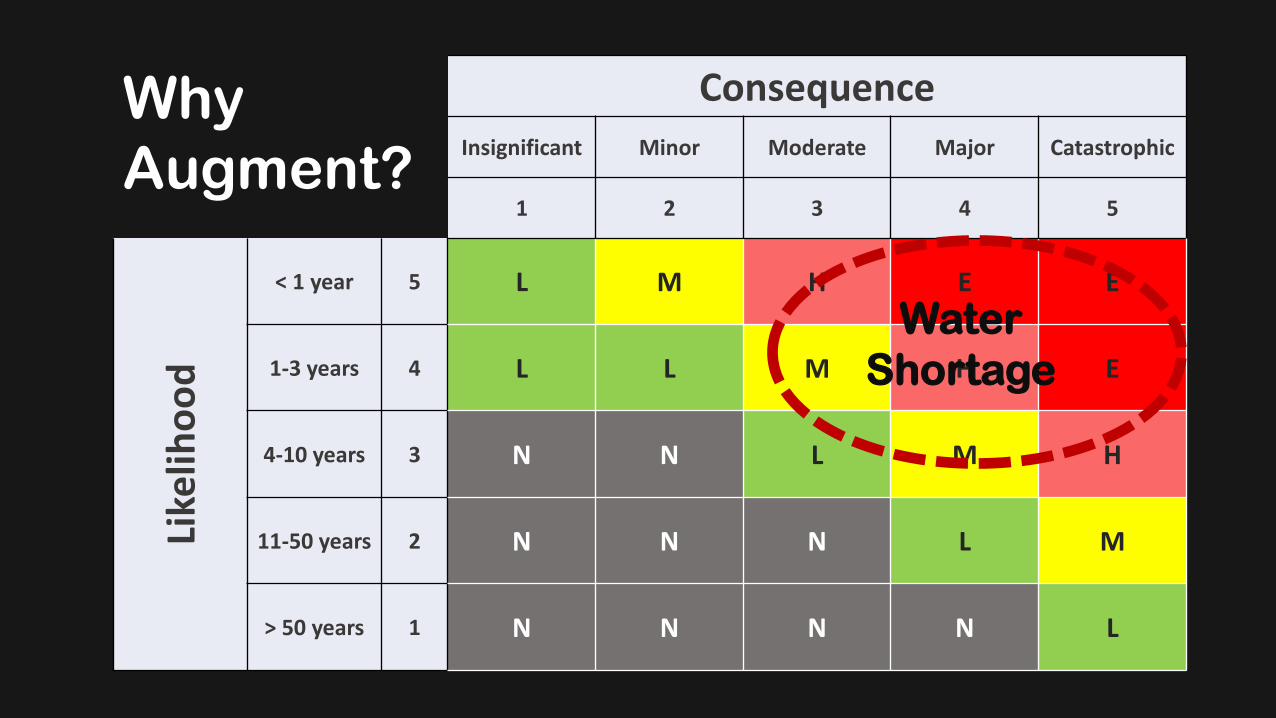
Consequence
Insignificant Minor Moderate Major Catastrophic
1 2 3 4 5Li
kelih
oo
d
< 1 year 5 L M H E E
1-3 years 4 L L M H E
4-10 years 3 N N L M H
11-50 years 2 N N N L M
> 50 years 1 N N N N L
Water
Shortage
Why
Augment?
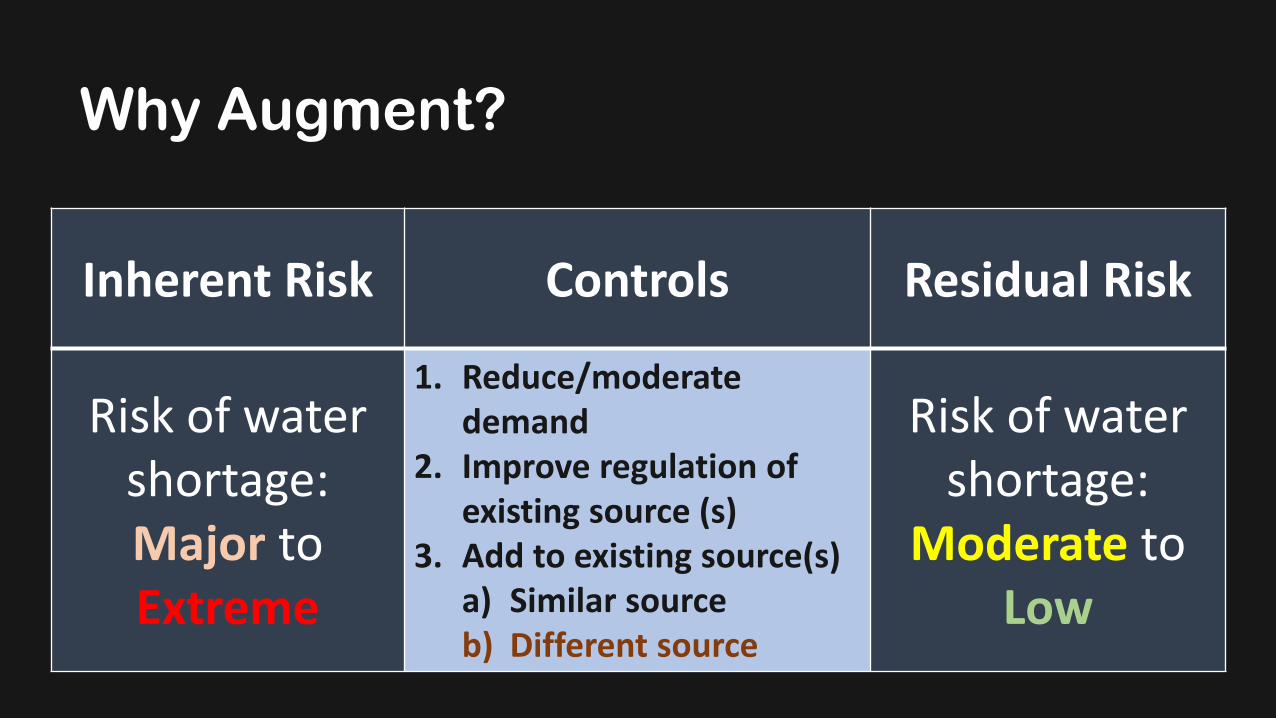
Inherent Risk Controls Residual Risk
Risk of water shortage: Major to Extreme
1. Reduce/moderate demand
2. Improve regulation of existing source (s)
3. Add to existing source(s)a) Similar sourceb) Different source
Risk of water shortage:
Moderate to Low
Why Augment?

Consequence
Insignificant Minor Moderate Major Catastrophic
1 2 3 4 5Li
kelih
oo
d
< 1 year 5 L M H E E
1-3 years 4 L L M H E
4-10 years 3 N N L M H
11-50 years 2 N N N L M
> 50 years 1 N N N N L
Why
Augment?
Sufficient
Water

Why Desalination?
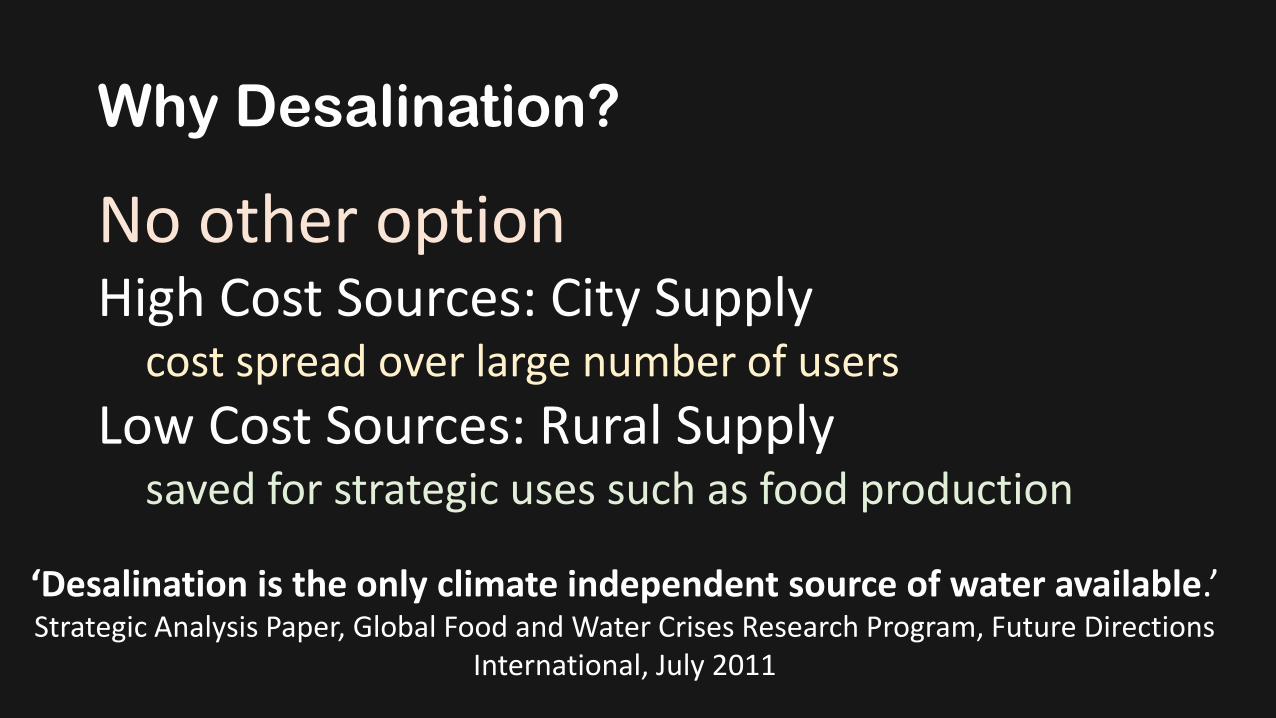
No other optionHigh Cost Sources: City Supply
cost spread over large number of users
Low Cost Sources: Rural Supplysaved for strategic uses such as food production
Why Desalination?
‘Desalination is the only climate independent source of water available.’Strategic Analysis Paper, Global Food and Water Crises Research Program, Future Directions
International, July 2011
Why Reverse Osmosis?
Multi-Stage FlashMulti Effect DistillationMechanical Vapour CompressionReverse Osmosis

Process
MSF MED MVC RO
Multi-Stage Flash
Multi-Effect Distillation
Mechanical Vapour
Compression
Reverse Osmosis
Technique Thermal Thermal Thermal Pressure
Total Equivalent Electrical Energy(kWh/m3)
13.5 to 25.5 6.5 to 11 7.0 to 12 2.6 to 7.5
Why Reverse Osmosis? Lowest Energy
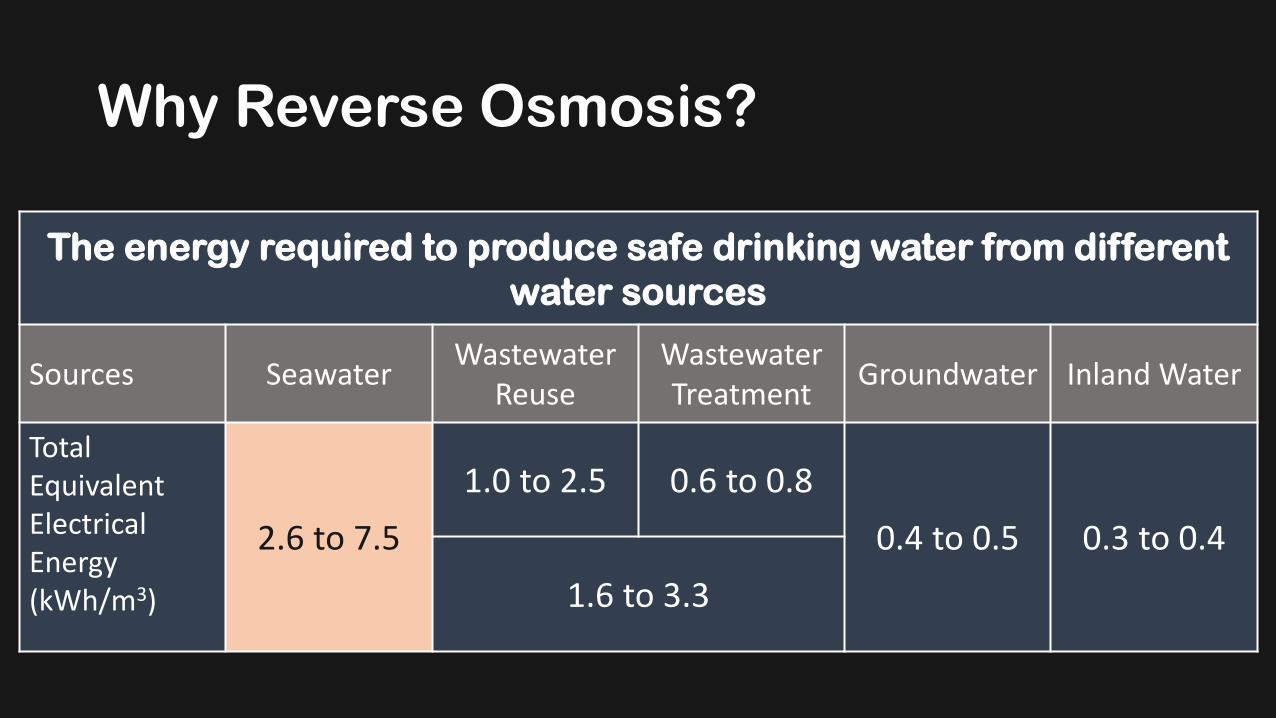
The energy required to produce safe drinking water from different
water sources
Sources SeawaterWastewater
ReuseWastewater Treatment
Groundwater Inland Water
Total Equivalent Electrical Energy(kWh/m3)
2.6 to 7.5
1.0 to 2.5 0.6 to 0.8
0.4 to 0.5 0.3 to 0.4
1.6 to 3.3
Why Reverse Osmosis?

Why Reverse Osmosis? Lowest Cost
Small <0.1 MLD
Medium <0.2 MLD
Large >0.2 MLD
Small <5 MLD
Medium <30 MLD
Large <100 MLD
Very Large >150 MLD
M&E Works
24 MLD
Civil Works
48 MLD
MSF Multi Stage Flash
MD Membrane Distillation
MED Multi-Effect Distillation
RO Reverse Osmosis
True Cost
Literature
MG
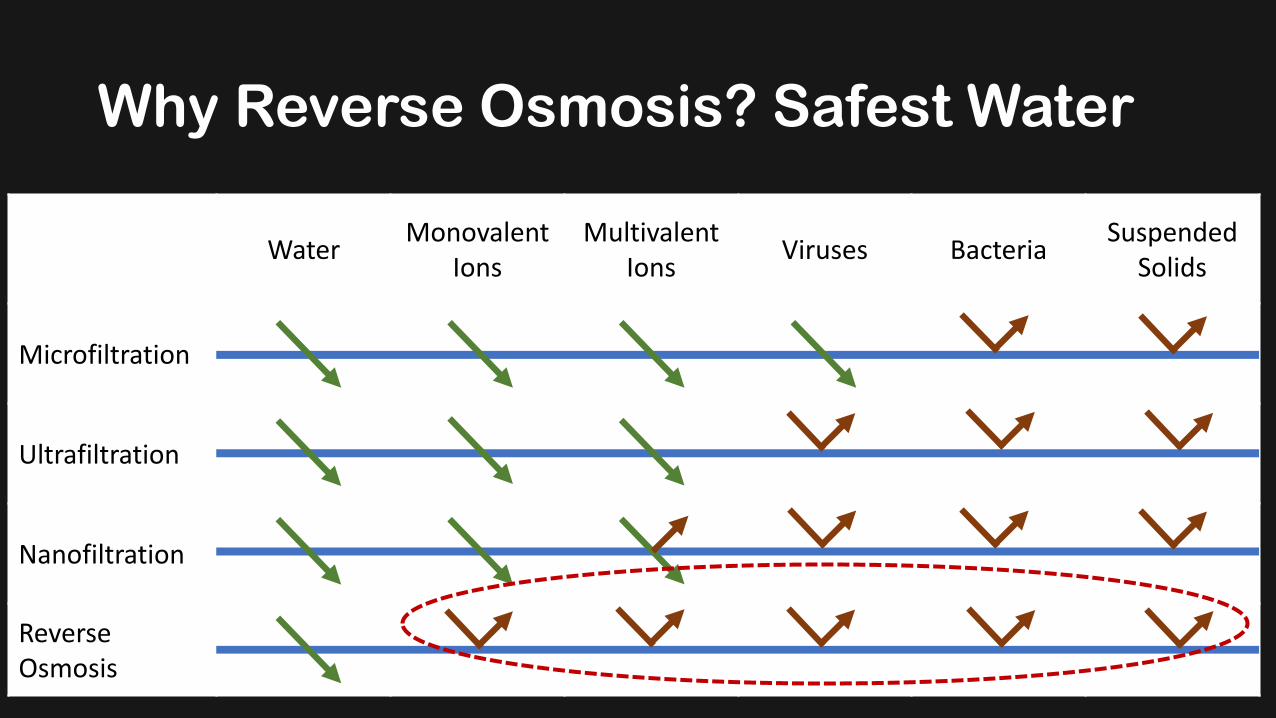
Why Reverse Osmosis? Safest Water
WaterMonovalent
IonsMultivalent
IonsViruses Bacteria
Suspended Solids
Microfiltration
Ultrafiltration
Nanofiltration
Reverse Osmosis

Possible Jaffna SWRO Plant

Post-treatment
System
Reverse Osmosis System
Pre Treatment
System
Treatment system
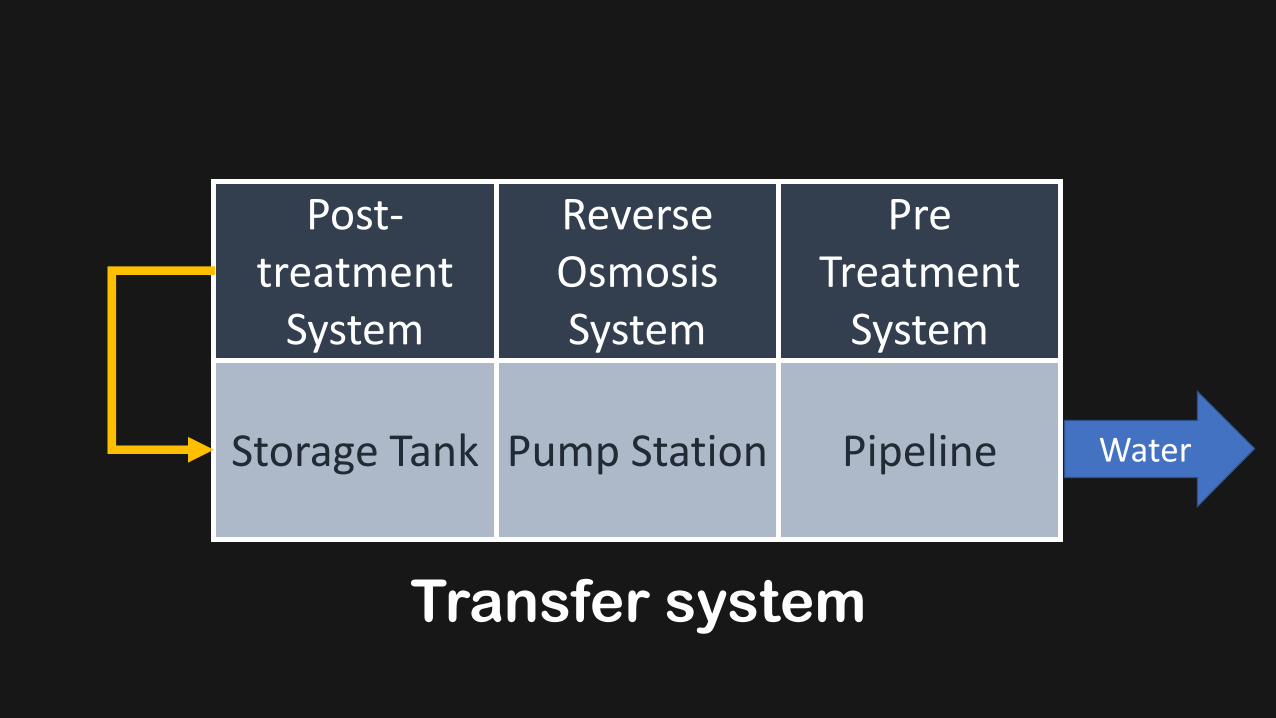
Post-treatment
System
Reverse Osmosis System
Pre Treatment
System
PipelinePump StationStorage Tank Water
Transfer system

Post-treatment
System
Reverse Osmosis
Membranes
Pre Treatment
System
PipelinePump StationStorage Tank
Intake TowerIntake
Pipeline
Intake Pump Station and
Screens
Seawater
Water
Intake system

Post-treatment
System
Reverse Osmosis System
Pre Treatment
System
PipelinePump StationStorage Tank
Intake TowerIntake
Pipeline
Intake Pump Station and
Screens
DiffuserOutfallNeutralisation
Tank
Seawater
Water
Brine
Ou
tfall s
ys
tem

Post-treatment
System
Reverse Osmosis System
Pre Treatment
System
PipelinePump StationStorage Tank
Intake TowerIntake
Pipeline
Intake Pump Station and
Screens
DiffuserOutfallNeutralisation
Tank
Seawater
Water
Brine

Post-treatment
System
Reverse Osmosis System
Pre Treatment
System
PipelinePump StationStorage Tank
Intake TowerIntake
Pipeline
Intake Pump Station and
Screens
DiffuserOutfallDetention
Tank
Seawater
Water
Brine
Marine Works
Marine Works
Desalination Works
Pipeline Works
Post-treatment
System
Reverse Osmosis System
Pre Treatment
System
PipelinePump StationStorage Tank
Intake TowerIntake
Pipeline
Intake Pump Station and
Screens
DiffuserOutfallDetention
Tank
Seawater
Water
Brine
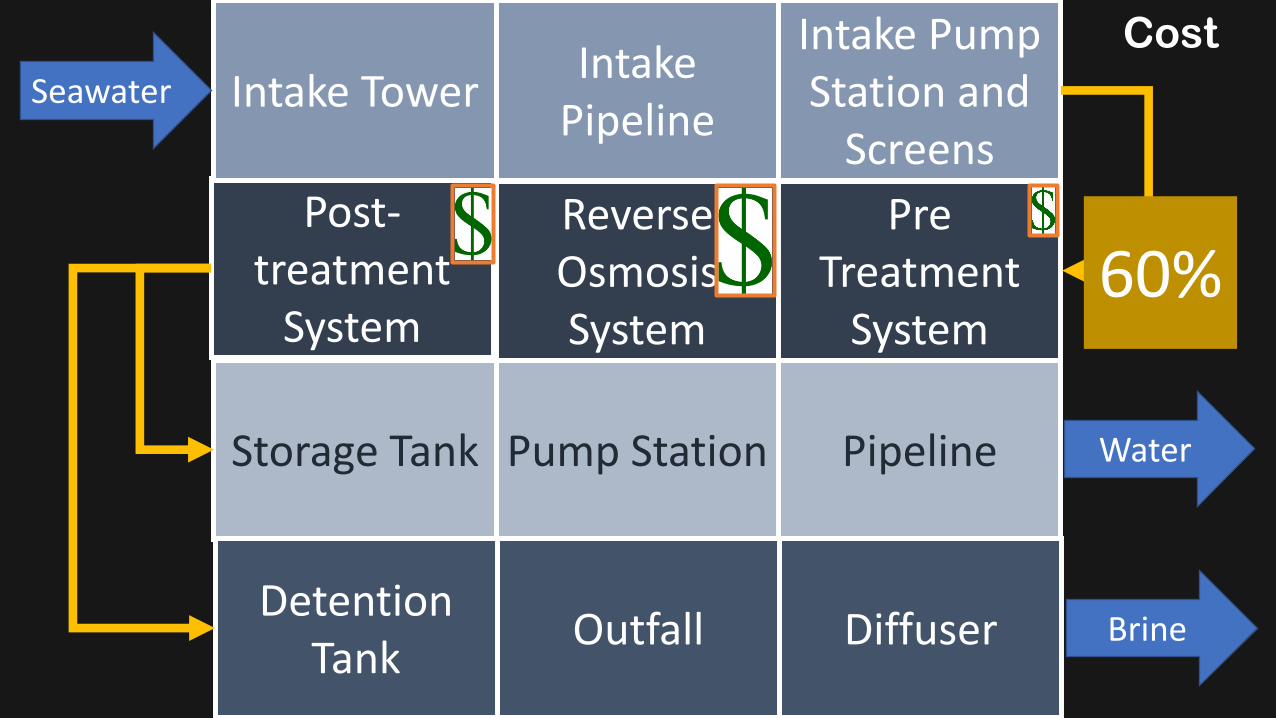
60%
Cost

Post-treatment
System
Reverse Osmosis System
Pre Treatment
System
PipelinePump StationStorage Tank
Intake TowerIntake
Pipeline
Intake Pump Station and
Screens
DiffuserOutfallDetention
Tank
Seawater
Water
Brine
Cost

Post-treatment
System
Reverse Osmosis System
Pre Treatment
System
PipelinePump StationStorage Tank
Intake TowerIntake
Pipeline
Intake Pump Station and
Screens
DiffuserOutfallDetention
Tank
Seawater
Water
Brine
Interest

Post-treatment
System
Reverse Osmosis System
Pre Treatment
System
PipelinePump StationStorage Tank
Intake TowerIntake
Pipeline
Intake Pump Station and
Screens
DiffuserOutfallDetention
Tank
Seawater
Water
Brine
Interest

Post-treatment
System
Reverse Osmosis
Membranes
Pre Treatment
System
PipelinePump StationStorage Tank
Intake TowerIntake
Pipeline
Intake Pump Station and
Screens
DiffuserOutfallDetention
Tank
Seawater
Water
Brine
Marine Works
Marine Works
Desalination Works
Pipeline Works

Typical Desalination Plant: Cartridge Filters
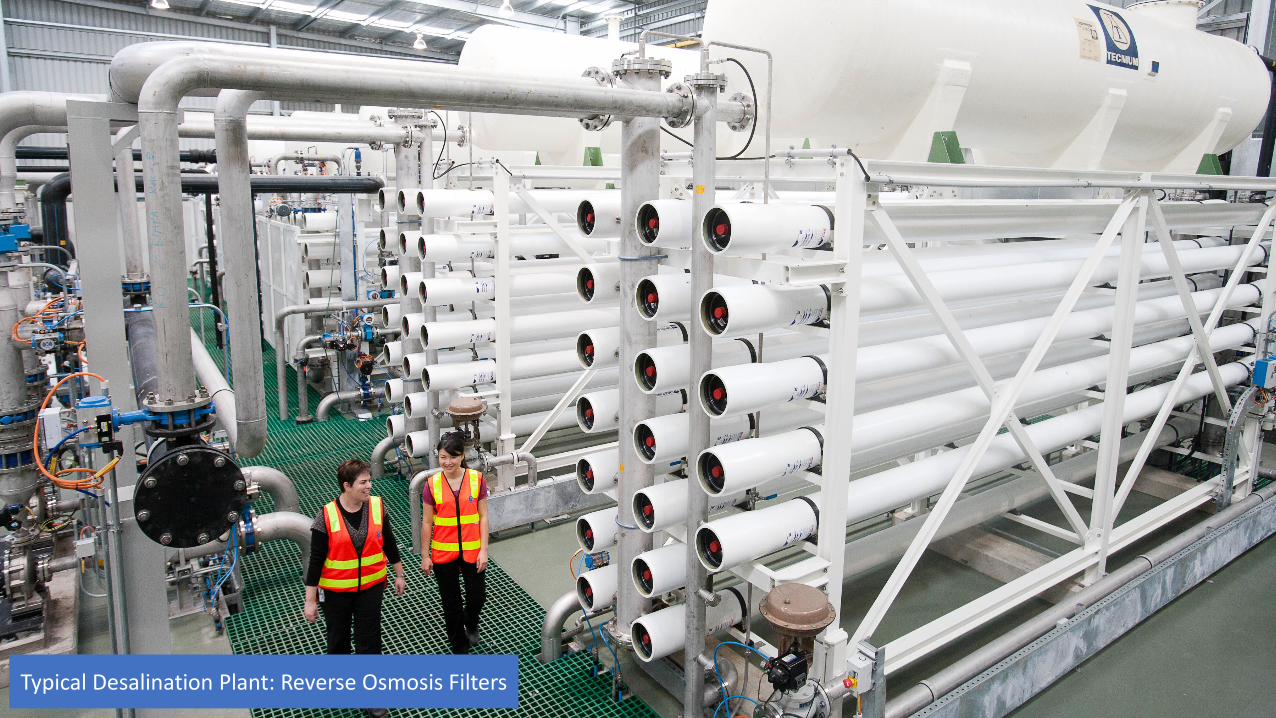
Typical Desalination Plant: Reverse Osmosis Filters
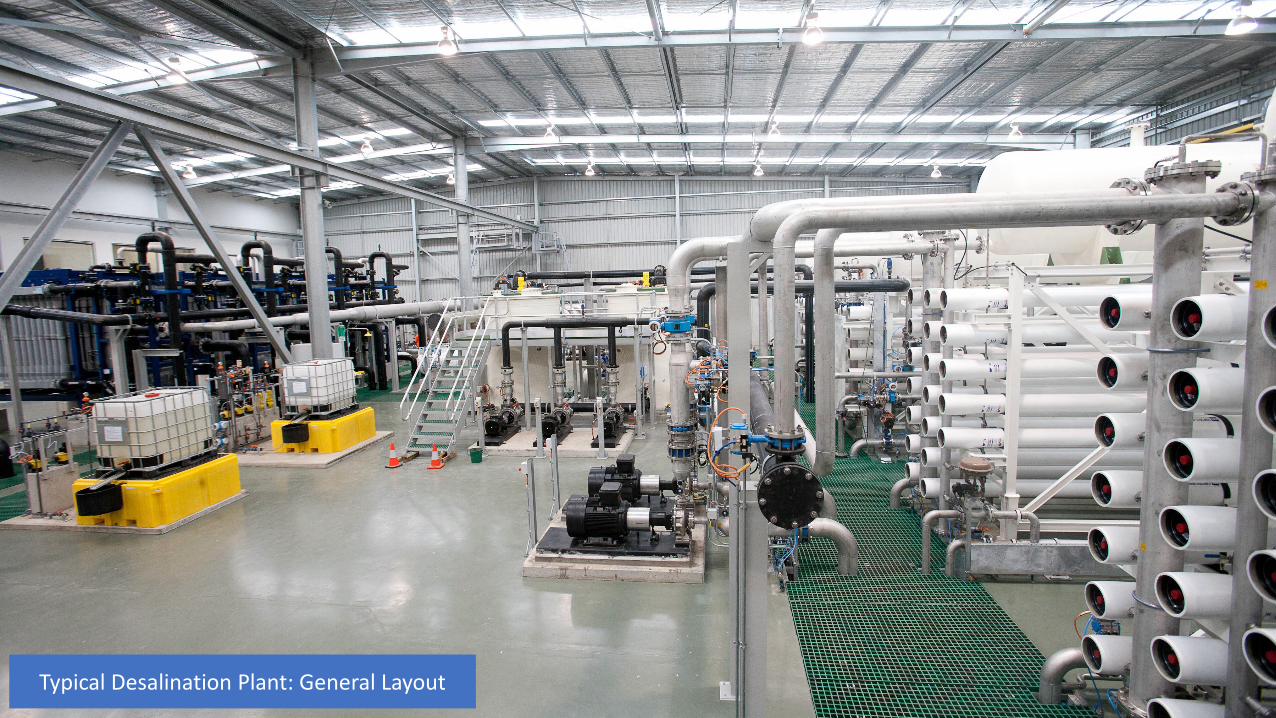
Typical Desalination Plant: General Layout

Supply to Customers
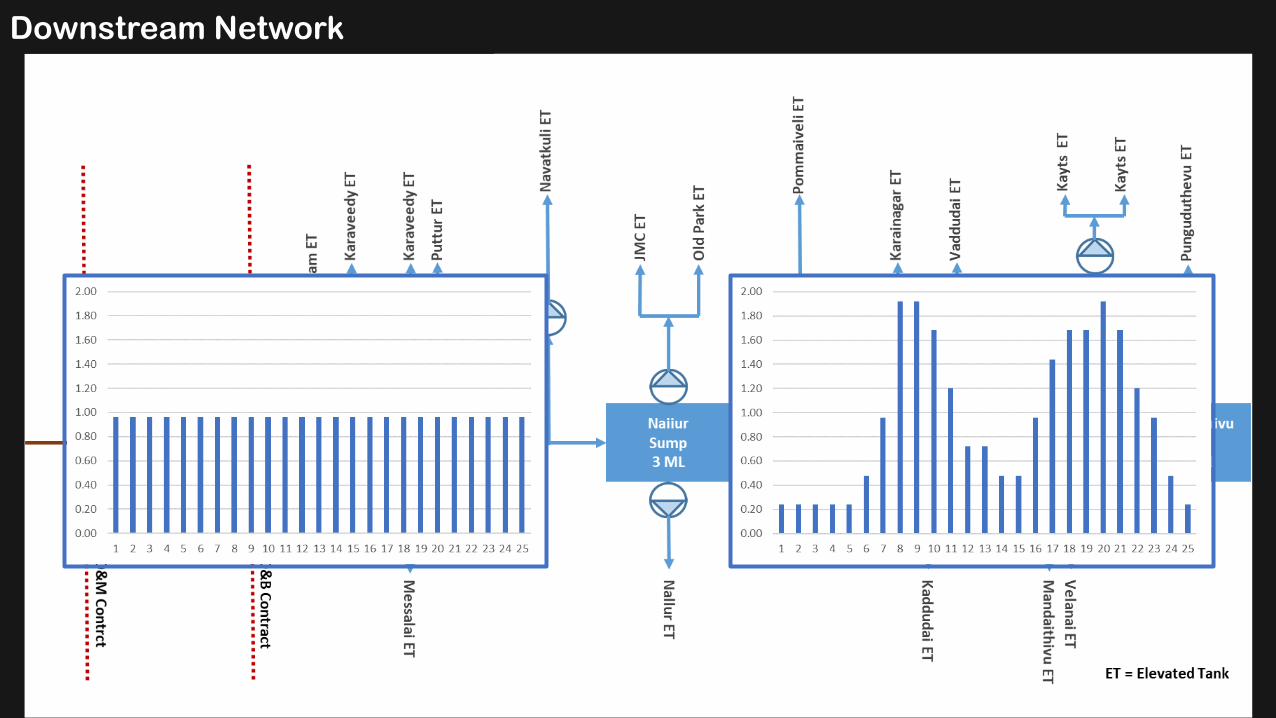
Downstream Network

Project Context
• Single source of supply
• No local desalination experience
• Limited in-country market
• Little local allied industry
• 400km from port facilities (Colombo)
• 40km from nearest town (Jaffna)
• Selection by qualification and price only
• Medium desalination plant
Simplest pre-
treatment system
that can prepare
the seawater for
the reverse
osmosis
membranes

Marine Works
• Functional design
• Construction method
• Address social and environmental safeguards
• Supporting hydraulic calculations
• Common trenching for intake and outfall pipelines
• Online monitoring

Treatment Plant Works
• Outcome based
• Processes and equipment selection
• Supporting design calculations and drawings
• All forms of waste
• Consider project risks
• Address social and environmental safeguards

Pipeline Works
• 8 km pipeline
• Construction method
• Single access road
• Waterway crossings
• Supporting calculations
• Address social and environmental mitigation measures
• Interface to network
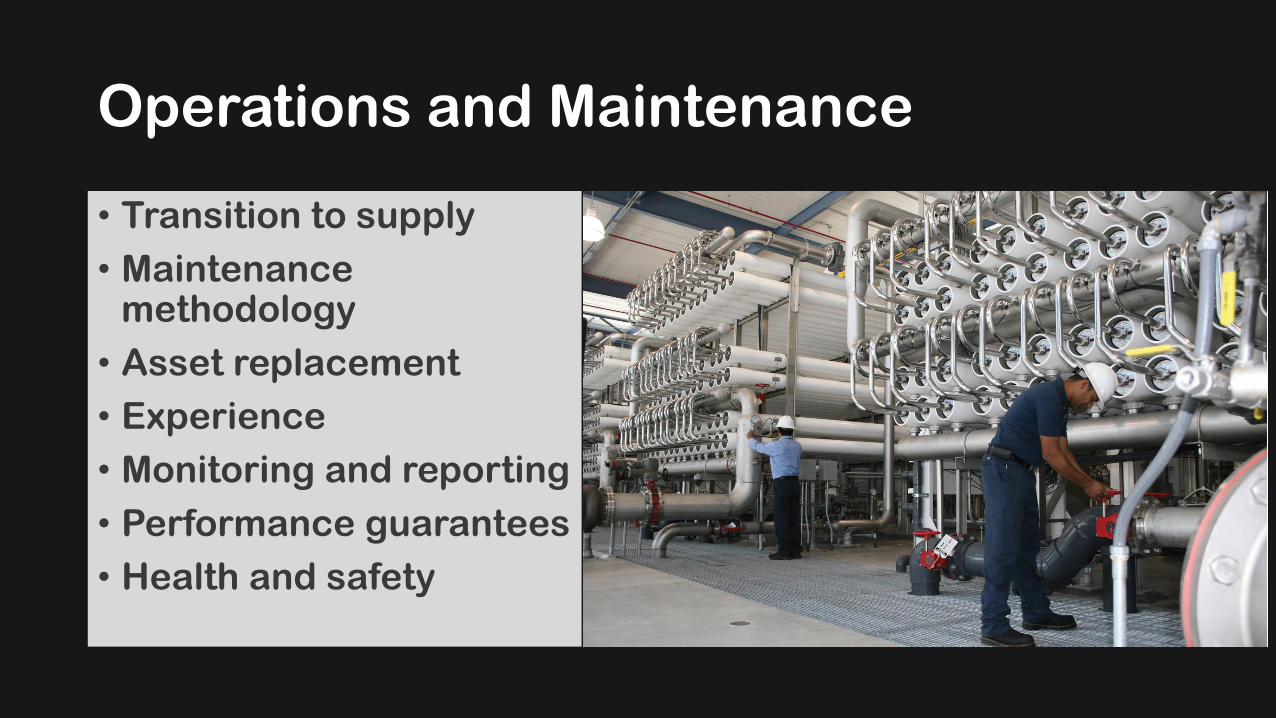
Operations and Maintenance
• Transition to supply
• Maintenance methodology
• Asset replacement
• Experience
• Monitoring and reporting
• Performance guarantees
• Health and safety
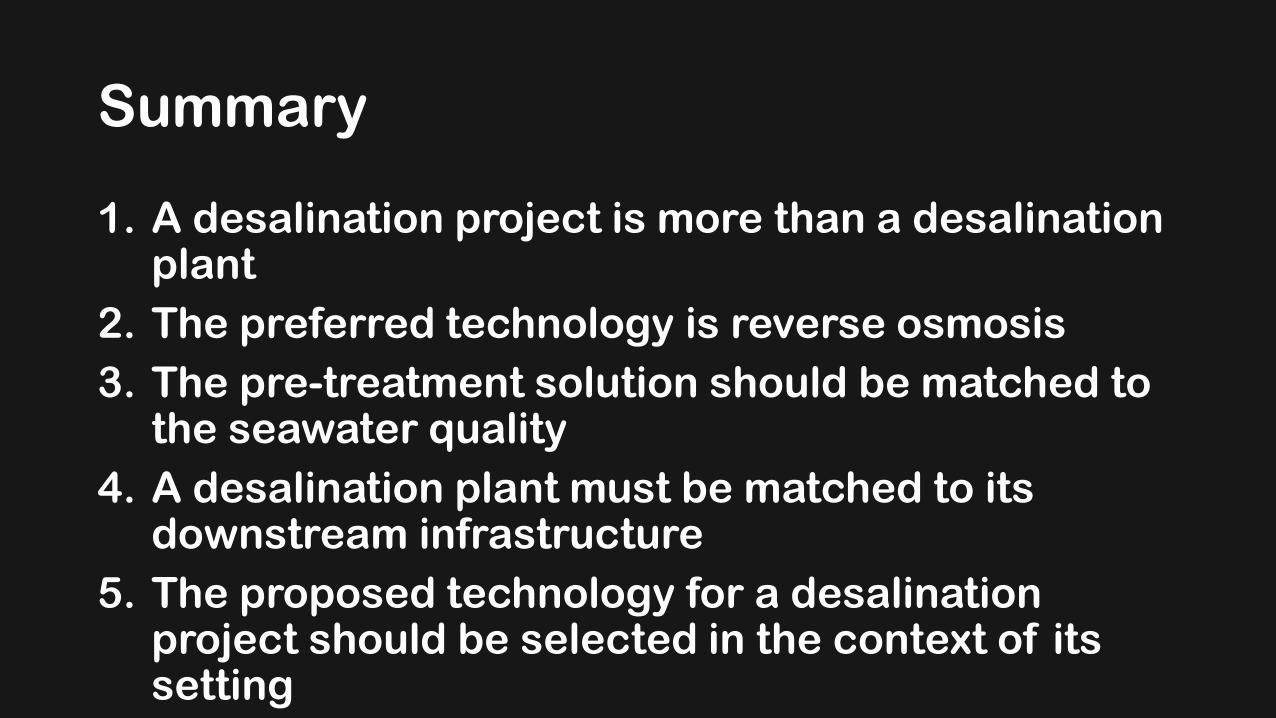
Summary
1. A desalination project is more than a desalination plant
2. The preferred technology is reverse osmosis
3. The pre-treatment solution should be matched to the seawater quality
4. A desalination plant must be matched to its downstream infrastructure
5. The proposed technology for a desalination project should be selected in the context of its setting

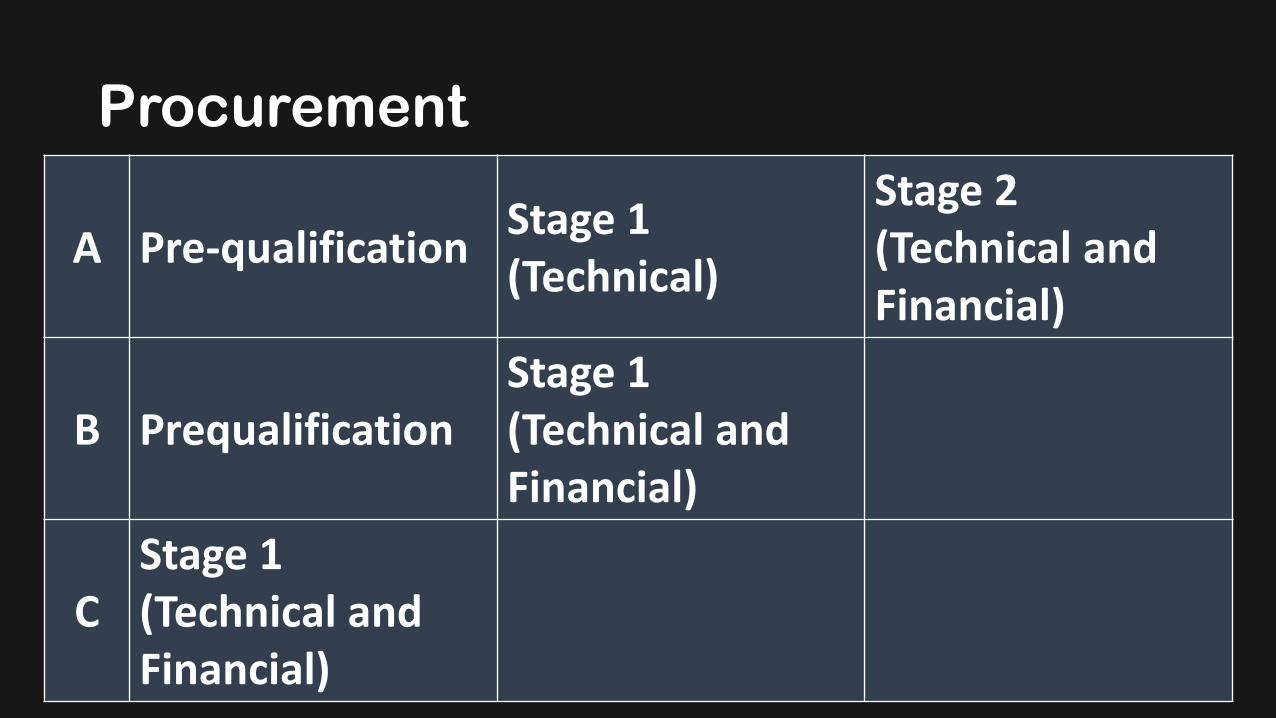
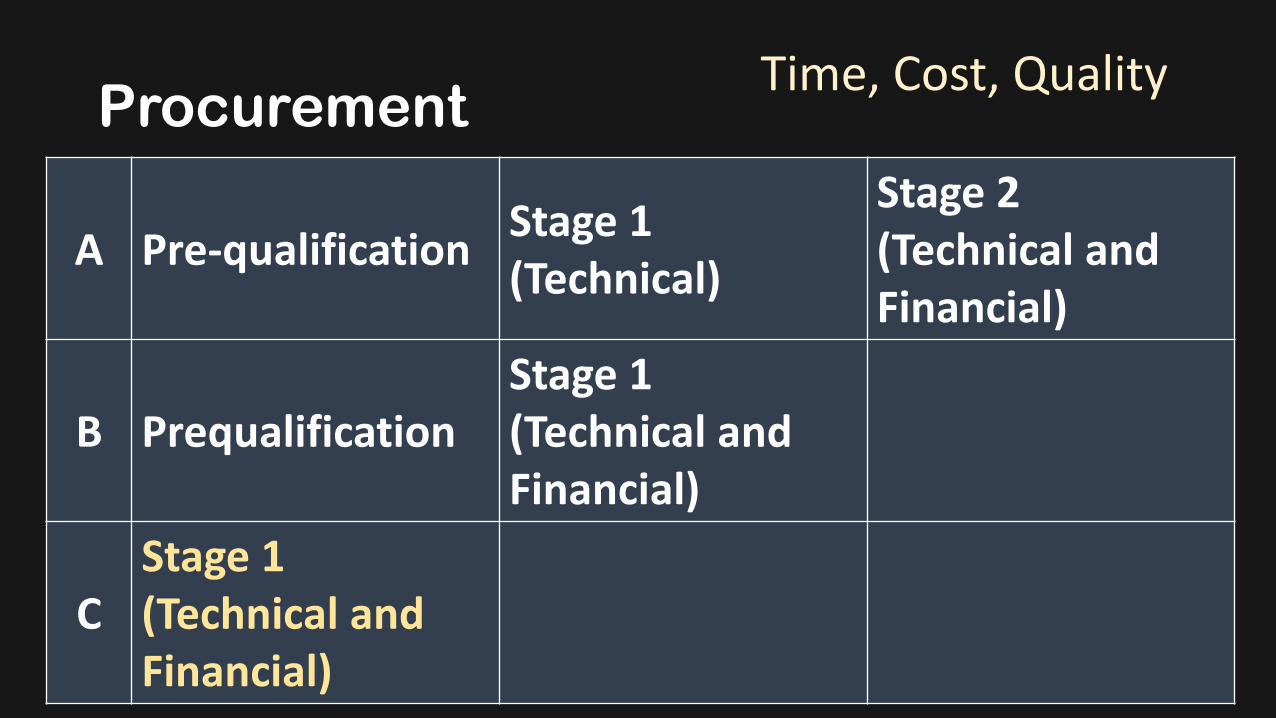
Procurement

Procurement
1. Market Assessment
2. PQ and One or Two Stage
3. Time to Bid
4. Operation Service Period

Market Assessment
• Veolia• Doosan• GE• Fisia• Degremont• IDE• Acciona• Hydro Chem• Befesa• Sadyt
• Global• Proprietary• Competitive• Financing• DBOM• 80% RO• Asian
Interest
Procurement
A Pre-qualificationStage 1 (Technical)
Stage 2 (Technical and Financial)
B PrequalificationStage 1 (Technical and Financial)
CStage 1 (Technical and Financial)

Factors to consider?If
mo
st
bo
xe
s a
re t
ick
ed
us
e a
tw
o s
tag
e p
roc
es
s
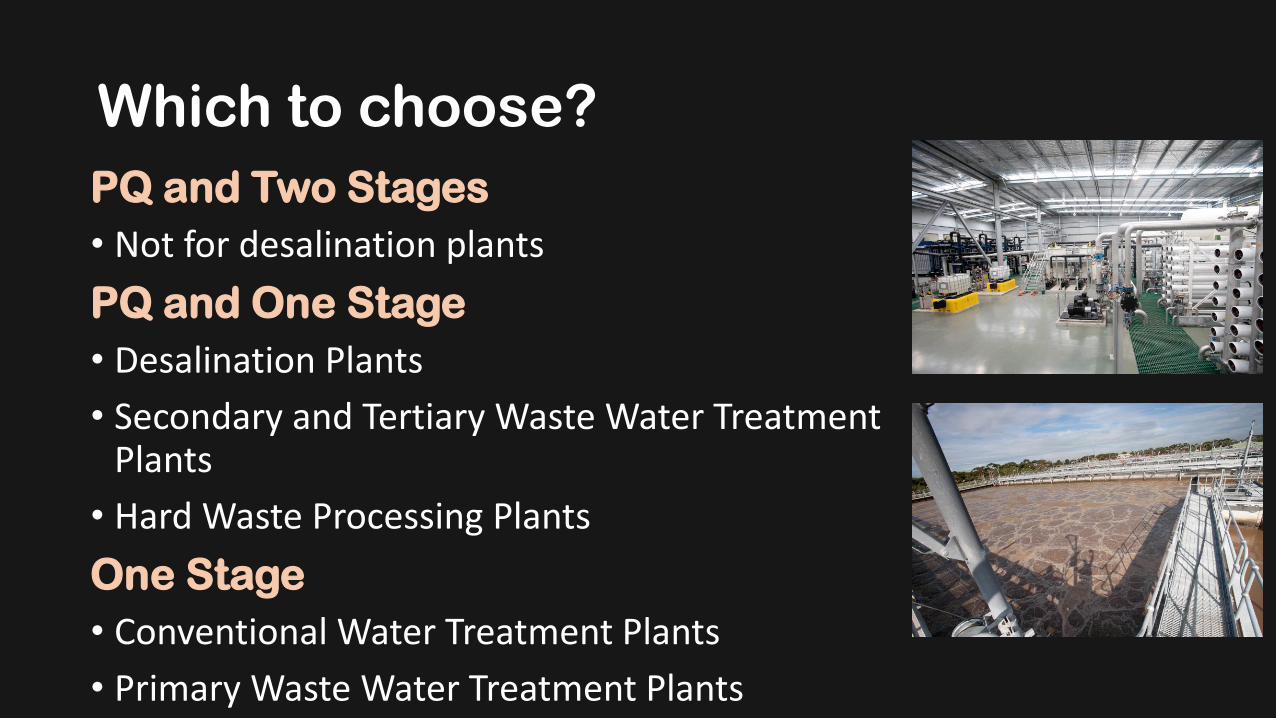
Which to choose?
PQ and Two Stages
• Not for desalination plants
PQ and One Stage
• Desalination Plants
• Secondary and Tertiary Waste Water Treatment Plants
• Hard Waste Processing Plants
One Stage
• Conventional Water Treatment Plants
• Primary Waste Water Treatment Plants
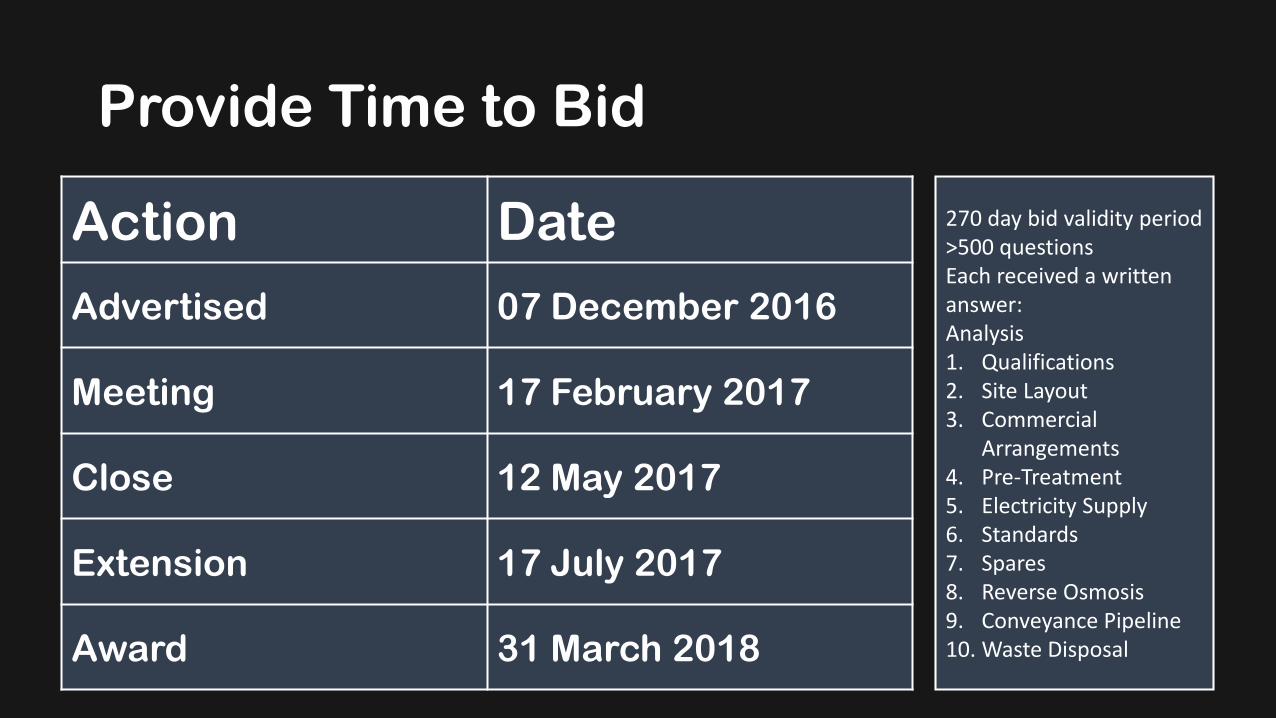
Provide Time to Bid
Action Date
Advertised 07 December 2016
Meeting 17 February 2017
Close 12 May 2017
Extension 17 July 2017
Award 31 March 2018
270 day bid validity period>500 questionsEach received a written answer: Analysis1. Qualifications2. Site Layout3. Commercial
Arrangements4. Pre-Treatment5. Electricity Supply6. Standards7. Spares8. Reverse Osmosis9. Conveyance Pipeline10. Waste Disposal

Operation Service Period
What is the preferred duration of the operation service period for a desalination plant?
10 years?
15 years?
25 years?

Operation Service Period
Case for long duration
operation service periods
Case for against long
duration operation service
periods
• International contractors• Certainty• Asset Replacement Fund• Core business• Expertise• Re-bid costs
• Locked to service provider• Uncertainty (demand,
technology)• Locked to annual payments• Capacity building
Seven to ten years is a good period to choose (WB ten years)
• Privately Financed (>25 years) • Size/Experience
Procurement
A Pre-qualificationStage 1 (Technical)
Stage 2 (Technical and Financial)
B PrequalificationStage 1 (Technical and Financial)
CStage 1 (Technical and Financial)
Time, Cost, Quality
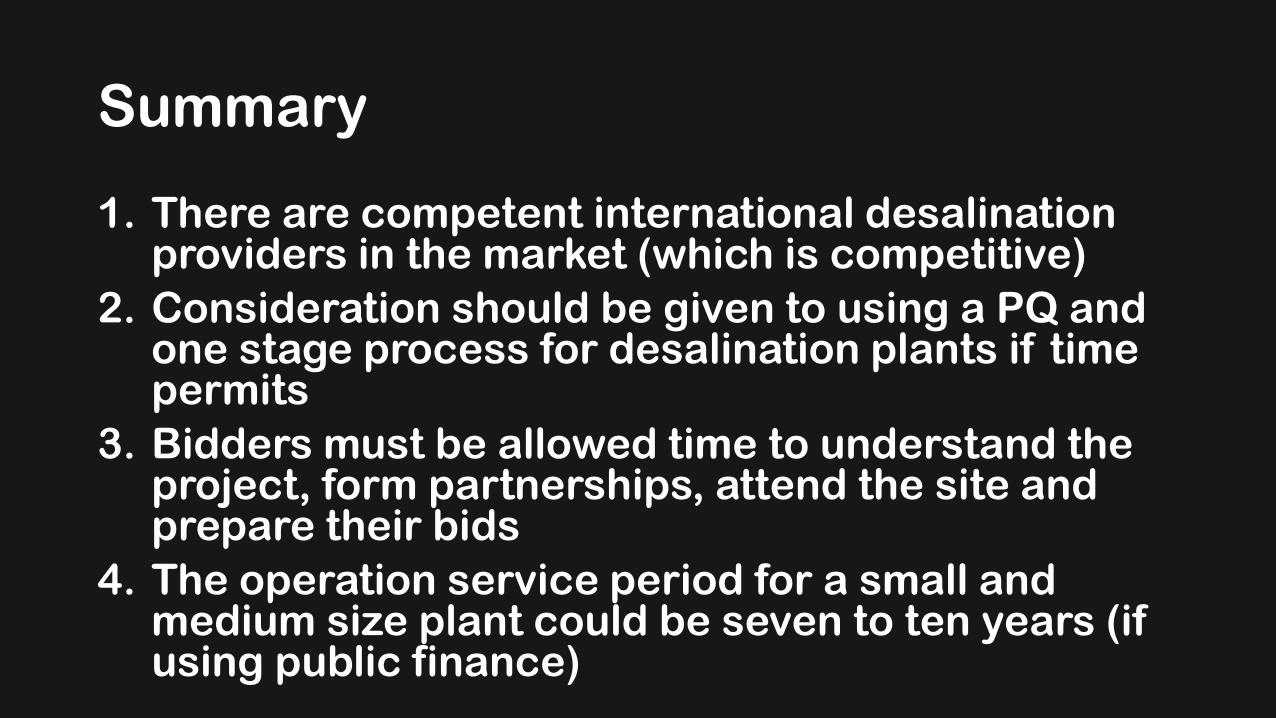
Summary
1. There are competent international desalination providers in the market (which is competitive)
2. Consideration should be given to using a PQ and one stage process for desalination plants if time permits
3. Bidders must be allowed time to understand the project, form partnerships, attend the site and prepare their bids
4. The operation service period for a small and medium size plant could be seven to ten years (if using public finance)

Evaluation
1. Technical
2. Financial

Evaluation
Technical Evaluation
1. Qualification Criteria
2. Technical Criteria
3. Performance Guarantees
4. Employer’s Requirements

Technical EvaluationQualification Criteria

Qualification Criteria
Holding Company
Asset Company
Management Company
Services Company(s)
Regional Company(s)
Design
Commissioning
Consultants
Bidding Vehicle(s)
Europe
South America
Asia
• Parent Company
• Sibling Company
• Child Company
Financial Requirements1. Historical Performance2. Average Annual Turnover3. Financial ResourcesBidder’s Experience1. Similar Size and Nature2. Key ActivitiesSubcontractors

Qualification Criteria
• 3 technologies / 3 skill sets
• 3 histories
•Multiple combinations of companies• Medium-sized Companies: specialise
(joint venture)
• Large-sized Companies: organise (and subcontract)
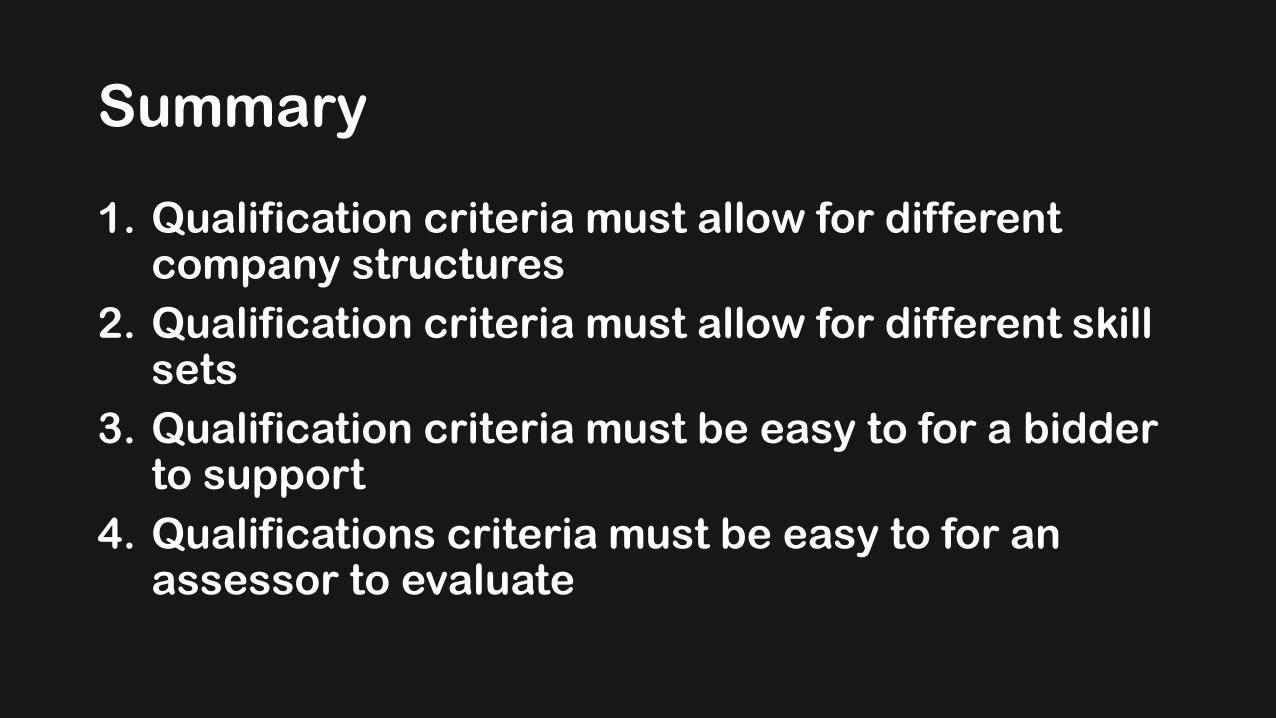
Summary
1. Qualification criteria must allow for different company structures
2. Qualification criteria must allow for different skill sets
3. Qualification criteria must be easy to for a bidder to support
4. Qualifications criteria must be easy to for an assessor to evaluate

Technical EvaluationTechnical Criteria

Technical Evaluation
1. Should we evaluate the bidders’ technical proposals (Section 6) and use the results in the decision making?
2. Should we use a scoring system?

Technical CriteriaHistory shows many desalination plants fail to:
• Deliver required output
• Deliver required water quality
• Deliver required reliability
• Run over time
• Cost more to run than anticipated
• Suffer early technical problems
• Suffer reduced asset lives
Technical criteria should address the underlying
causes

Section 6 Employers
RequirementsPurpose and Scope
Supporting Data
Technical Requirements
• Design-Build
• Operation Service
Project Management
Asset Management
Audit Body
Minimum Resources
• People
• Equipment
Social Safeguards
Environmental Safeguards
Section 3 Qualification
CriteriaEligibility
Litigation/Arbitration
Financial Position
• Historical Performance
• Turnover
Experience
• Similar Contracts
• Key Activities
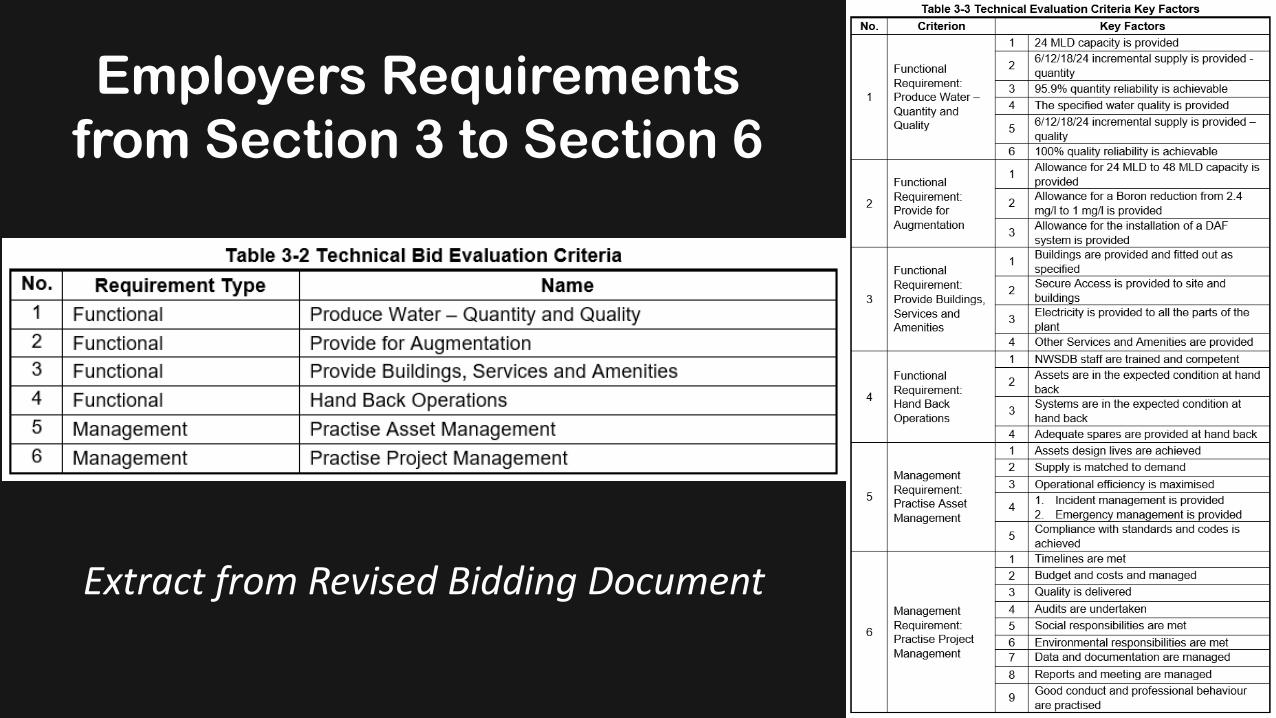
Employer’s Requirements

Extract from Revised Bidding Document
Employers Requirements
from Section 3 to Section 6
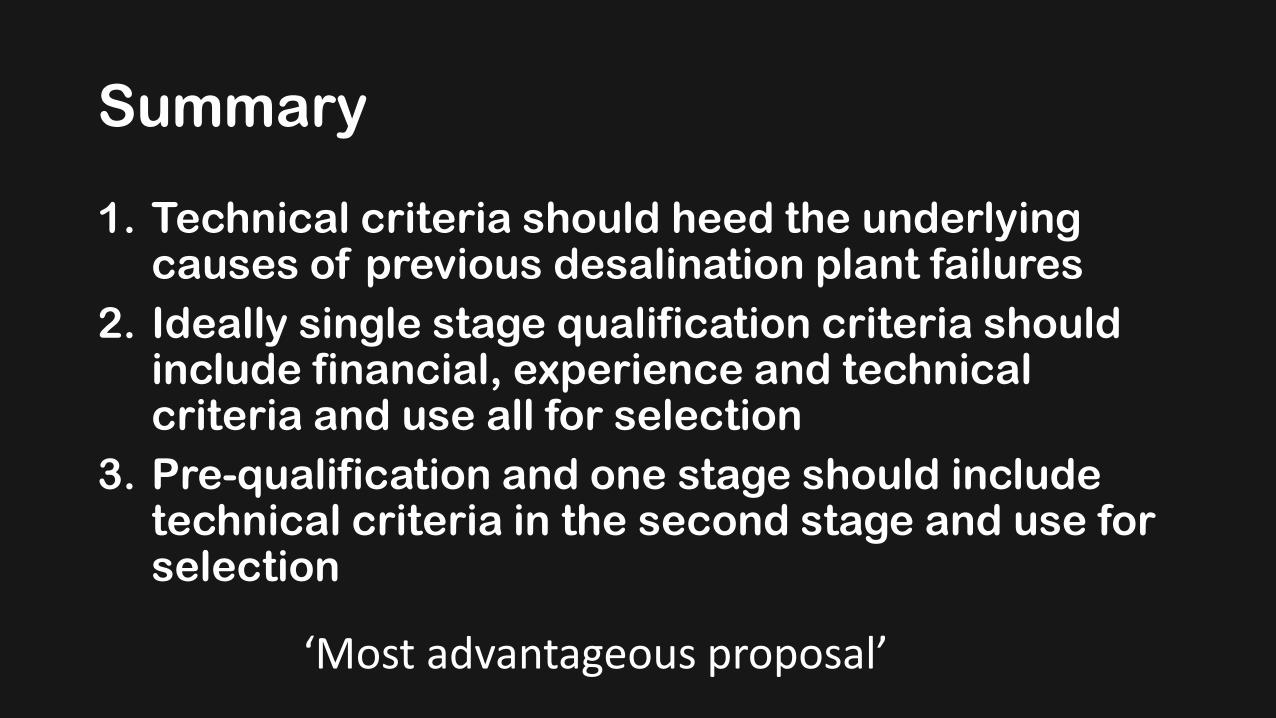
Summary
1. Technical criteria should heed the underlying causes of previous desalination plant failures
2. Ideally single stage qualification criteria should include financial, experience and technical criteria and use all for selection
3. Pre-qualification and one stage should include technical criteria in the second stage and use for selection
‘Most advantageous proposal’

Technical EvaluationPerformance Guarantees

Performance GuaranteesPerformance Measure Damage
Water Production Quantity Payment reduced if water not provided
Payment reduced if supply is unreliable
Water Production Quality Payment reduced if out of specification
Payment reduced if water quality not tested
Payment reduced if discharge licence breached
Energy Usage – SWRO Payment reduced by 1.5 times excess over cap
Energy Usage – Other Payment reduced by 1.5 times excess over cap
Chemical Usage Payment capped at bid chemical usage
Replacement of ultrafilters Payment only made in accordance with asset
replacement fund
Replacement of cartridge
filters
Payment only made in accordance with asset
replacement fund
Sp
ec
ifie
dB
id

Performance Guarantees (Bid)
Bidders were required to provide:•designs and • calculations
to show how the performance guarantees would be achieved
Total
(HP)% Total kWh/m3
Total
(HP)% Total kWh/m3
Desalination Plant Intake Pump Station
Seawater Intake Pumps 4 1 100 400 7.77 0.249 150 600 9.32 0.373
4 1 100 400 7.77 0.249 150 600 9.32 0.373
First Stage Gravity Filters
Gravity Filters - Blowers 2 1 30 24 0.47 0.015 30 24 0.37 0.015
Gravity Filters - Backwash Pumps 2 1 60 48 0.93 0.03 60 48 0.75 0.03
Other Pre-filtration Pretreatment Equipment 4 4 5 20 0.39 0.012 5 20 0.31 0.012
Interim Pumps 4 1 25 100 1.94 0.062 60 240 3.73 0.149
12 7 120 192 3.73 0.119 155 332 5.16 0.206
Second Stage Pressure Filter
Pressure Filters - Blowers 2 1 40 32 0.62 0.02 40 32 0.5 0.02
Pressure Filters - Backwash Pumps 2 1 80 64 1.24 0.04 80 64 0.99 0.04
Other Pre-filtration Pretreatment Equipment 4 4 8 32 0.62 0.02 8 40 0.62 0.025
Filtered Water Pumps 4 1 65 260 5.05 0.162 110 440 6.83 0.274
12 7 193 388 7.53 0.242 238 576 8.94 0.359
Reverse Osmosis System (Single Pass)
High Pressure RO Feed Pumps 8 0 400 3,200 62.12 1.989 450 3,600 55.9 2.238
ERI Booster Pumps 8 0 25 200 3.88 0.124 30 240 3.73 0.149
16 0 425 3400 66 2.113 480 3840 59.63 2.387
Product Water Delivery Pumps
Product Water Delivery Pumps 4 1 40 160 3.11 0.099 60 240 3.73 0.149
4 1 40 160 3.11 0.099 60 240 3.73 0.149
Solids Handling Facilities
Waste Discharge Pumps 4 1 2.5 10 0.19 0.006 5 20 0.31 0.012
Retention Tank Discharge Mixers 4 0 20 80 1.55 0.05 20 80 1.24 0.05
8 1 22.5 90 1.74 0.056 25 100 1.55 0.062
Membrane Cleaning System
Membrane Cleaning Pumps 2 1 2 4 0.08 0.002 2 4 0.06 0.002
Flush Pumps 2 1 2.5 5 0.1 0.003 2.5 5 0.08 0.003
Mechanical Mixers for Chemical Batch Tank 2 0 0.5 1 0.02 0.001 0.5 1 0.02 0.001
Chemical Cleaning System 2 0 4 8 0.16 0.005 4 8 0.12 0.005
8 2 9 18 0.36 0.011 9 18 0.28 0.011
Chemical Feed Equipment
Coagulant Feed System 2 1 5 10 0.19 0.006 20 40 0.62 0.025
Polymer Feed System 2 1 1 2 0.04 0.001 2 4 0.06 0.002
Sulfuric Acid Feed System 2 1 0.1 0.2 0 0 0.8 2 0.025 0.001
Calcium Hypochlorite Feed System 1 1 5 5 0.1 0.003 0.8 1 0.01 0
Sodium Bisulfide Feed System 2 1 1 2 0.04 0.001 4 8 0.12 0.005
Sodium Hydroxide Feed System 2 1 6 5 0.1 0.003 8 16 0.25 0.01
Antiscalant Feed System 2 1 2 4 0.08 0.002 8 16 0.25 0.01
Lime/CO2 Feed System 6 3 2.5 15 0.29 0.009 8 48 0.75 0.03
19 10 22.6 43.2 0.84 0.025 51.6 135 2.085 0.083
Service Facilities
HVAC 1 0 60 60 1.16 0.037 100 100 1.55 0.062
Lightning 1 0 80 80 1.55 0.05 100 120 1.86 0.075
Controls and Automation 1 0 50 50 0.97 0.031 80 80 1.24 0.05
Service Air Compressors 5 5 10 50 0.97 0.031 10 50 0.78 0.031
Other Miscellaneous/Contingency 220 220 4.27 0.137 250 250 3.88 0.155
8 5 420 460 8.92 0.286 540 600 9.31 0.373
Total 91 34 1352.1 5151.2 100 3.2 1708.6 6441 100.005 4.003
Maximum Power Use
Item
Number
of Duty
Units
Number
of
Standby
Units
Average
Power
Use
Average Power UseMaximu
m Power
Use (HP)
En
gin
ee
r’s
Es
tim
ate
of
En
erg
y U
sa
ge
for
a 2
4 M
LD
SW
RO

Performance Guarantee
Engineer’s estimate 3.84 kWh/m3
Energy: SWRO
kWh/m3 2.78 3.40 3.452.71 to
2.633.23
Energy: Other
kWh/year 963,600 1,399,789 2,715,600 N/A 5,680,032
Total kWh/m3 2.89 3.61 3.76 N/A 3.88

Summary
1. The demonstrated achievement of performance guarantees should be one of the assessed technical criteria

Technical EvaluationEmployer’s Requirements
Extract from Revised Bidding Document
Employers Requirements
from Section 3 to Section 6
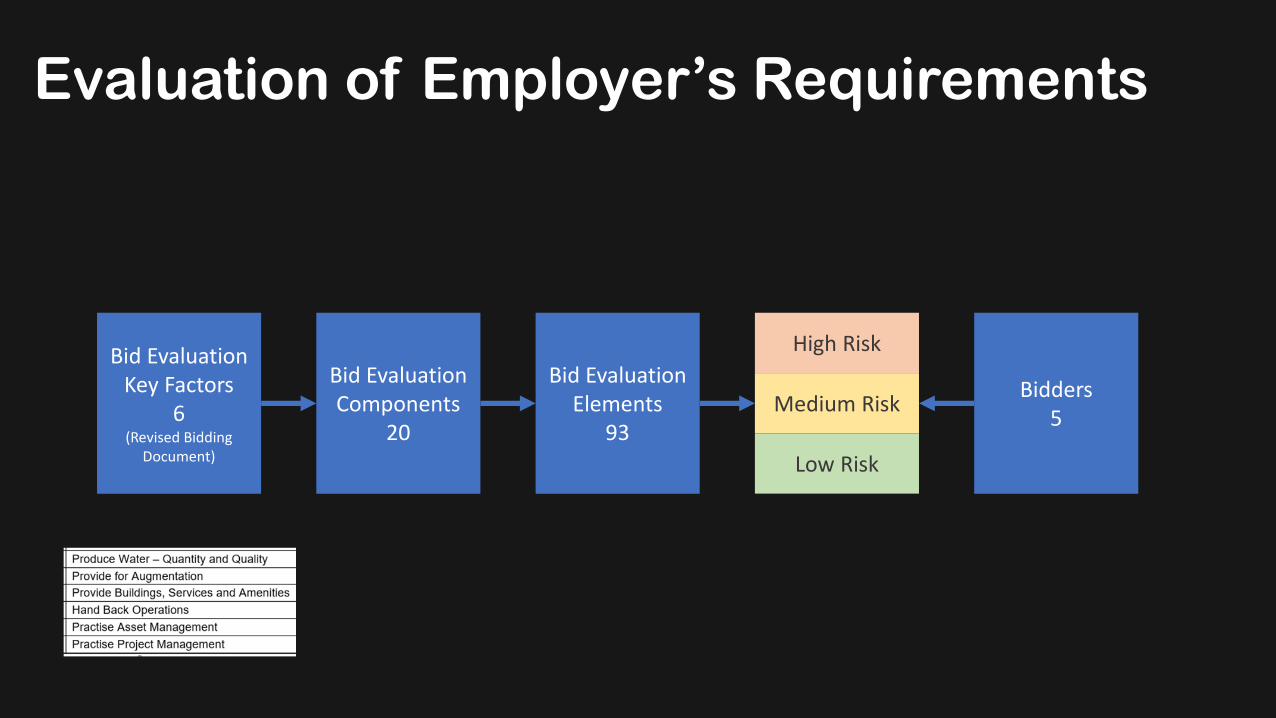
Bid Evaluation Key Factors
6(Revised Bidding
Document)
Bid Evaluation Components
20
Bid Evaluation Elements
93
Bidders5
High Risk
Medium Risk
Low Risk
Evaluation of Employer’s Requirements
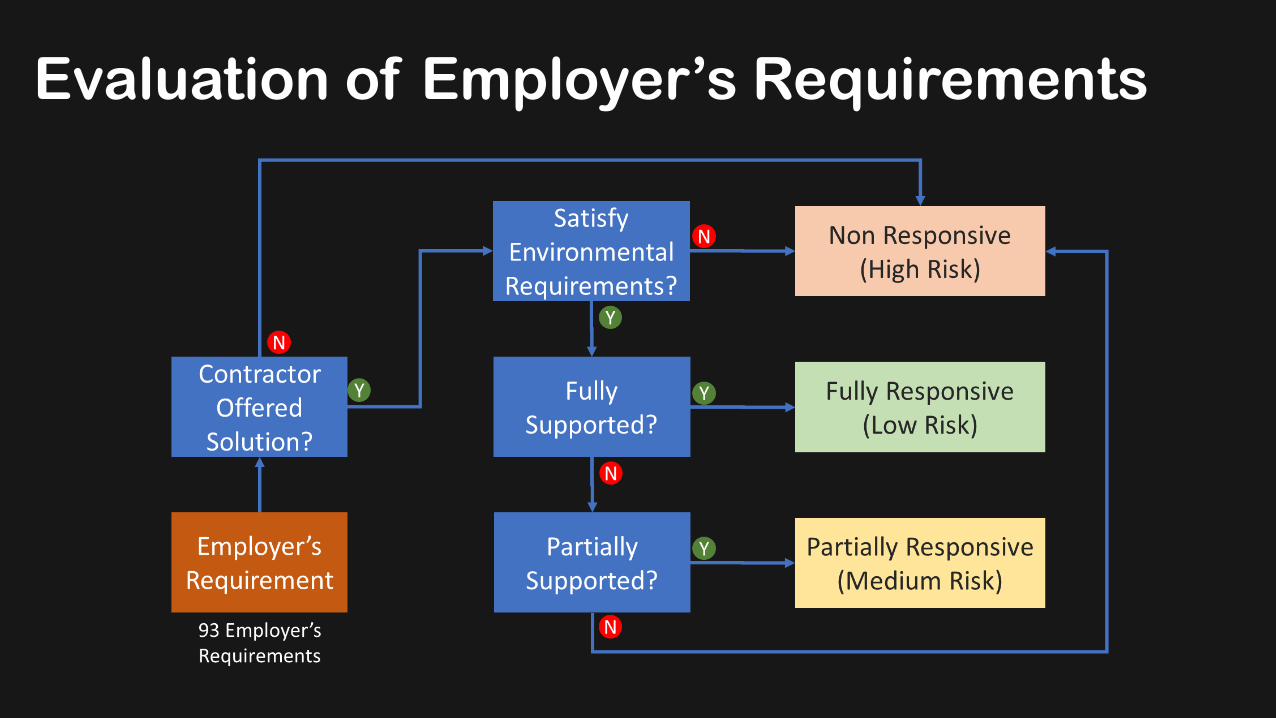
Evaluation of Employer’s Requirements

Evaluation of Employer’s Requirements

Summary
1. Ideally a technical evaluation should use an objective assessment method (especially when sole source of supply)
2. Each assessment element should be assessed by the same person (who has expertise in that element), and confirmed by a second person
3. A technical evaluation provides a valuable insight into each contractor’s proposal and each contractor itself

Evaluation
Financial Evaluation
1. Methodology
2. Real Costs
3. Discounting
4. Comparison of Bids

Real Dollars
Real Dollars of today
Nominal Dollars of the day
Bidders to price in real dollars
Include an economic adjustment mechanism
movements

Discounting?
Business Case
Bid Evaluation
Cost Recovery (Pricing)
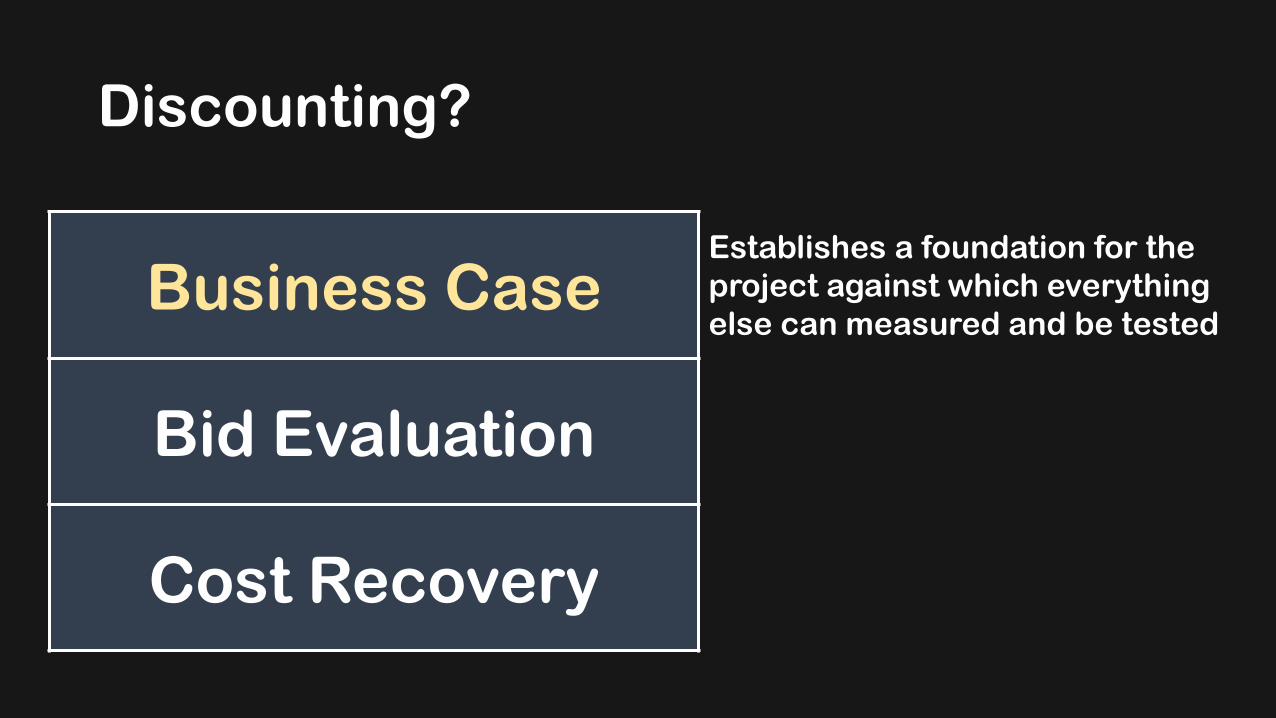
Discounting?
Business Case
Bid Evaluation
Cost Recovery
Establishes a foundation for the
project against which everything
else can measured and be tested

Discounting?
Item Purpose Financial Factors Time Period
Business Case Determine the preferred optionSeek project approval
Forecast growthCapital expensesOperational expensesDiscount rate
30 to 50 years
Bid Evaluation Determine the preferred contractorSeek approval to award
Capital pricesOperational prices
Life of contract
Water Pricing Determine the unit price of waterEstablish a water tariff
Operational expensesReturn on capitalReturn of capitalTaxes
Life of pricing period
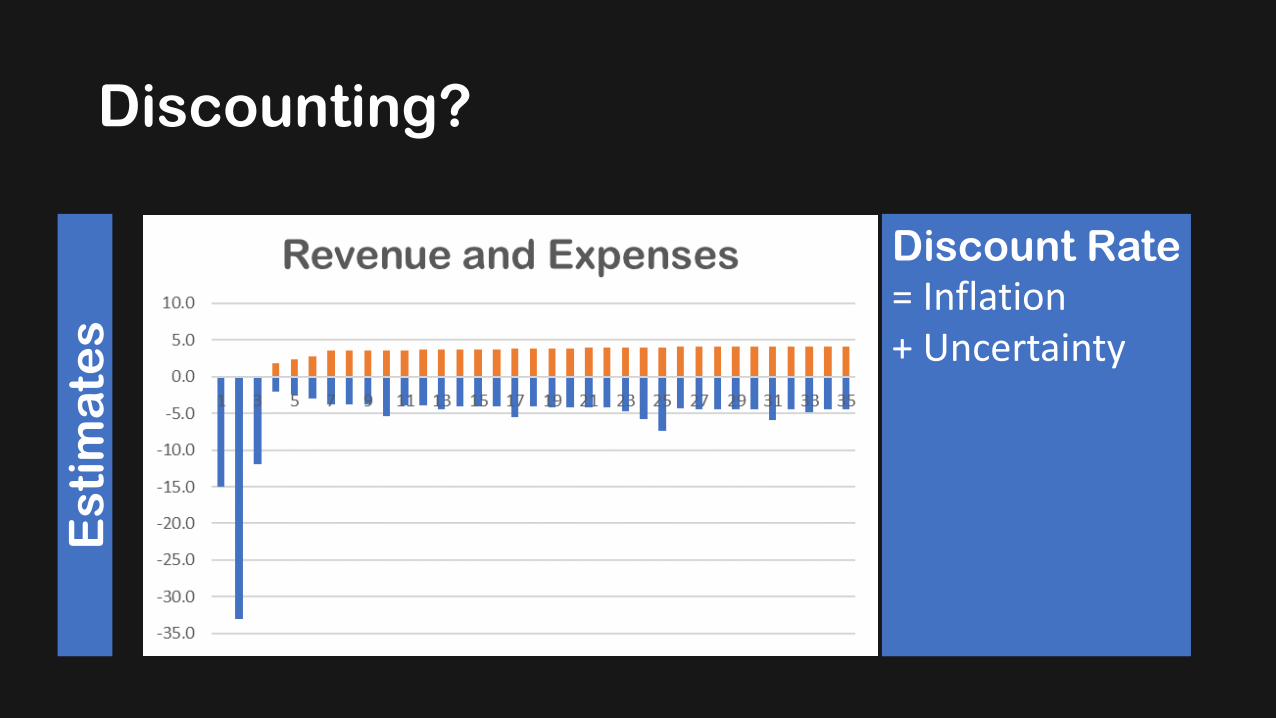
Discounting?
Discount Rate= Inflation+ Uncertainty
Es
tim
ate
s
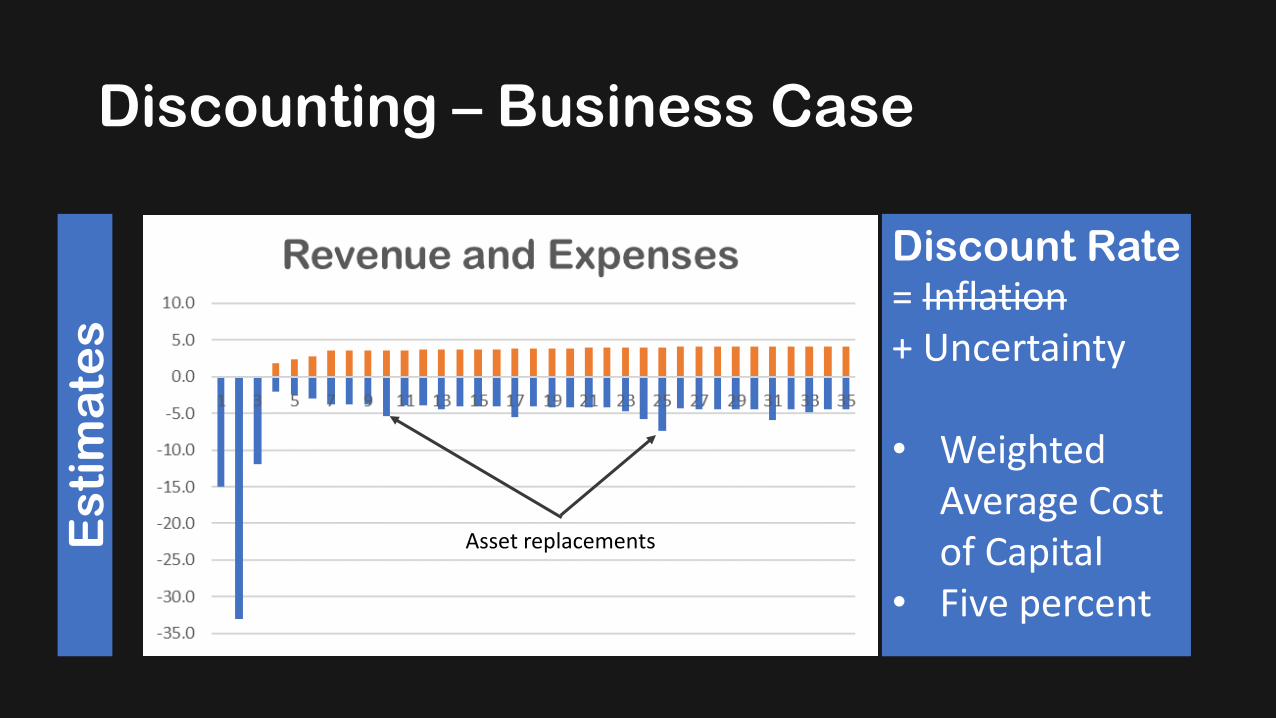
Discounting – Business Case
Discount Rate= Inflation+ Uncertainty
• Weighted Average Cost of Capital
• Five percent
Es
tim
ate
s
Asset replacements
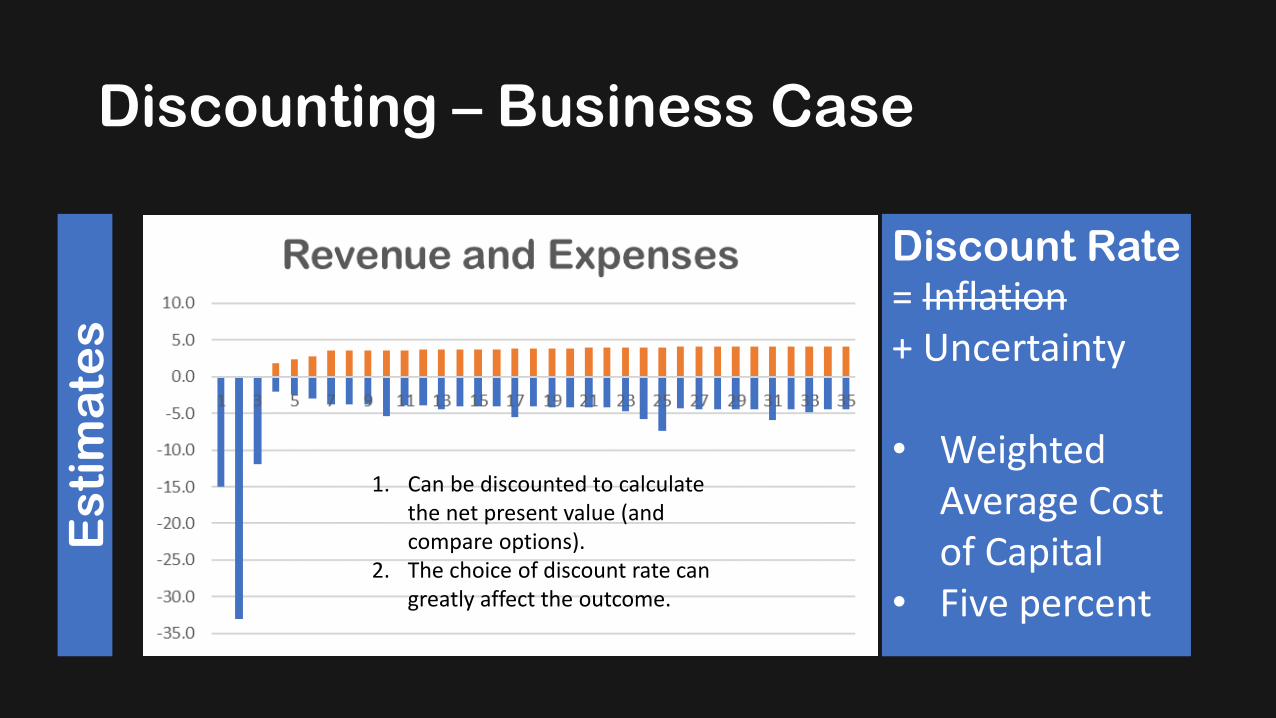
Discounting – Business Case
Discount Rate= Inflation+ Uncertainty
• Weighted Average Cost of Capital
• Five percent
Es
tim
ate
s
1. Can be discounted to calculate the net present value (and compare options).
2. The choice of discount rate can greatly affect the outcome.

Discounting – Bidding
Discount Rate= Inflation+ Uncertainty
• Weighted Average Cost of Capital
• Zero percent
Bid
Pri
ce
s

Discounting - Bidding
Discount Rate= Inflation+ Uncertainty
• Weighted Average Cost of Capital
• Zero percent
Bid
Pri
ce
s
1. A bidder has not priced these items
2. The items that have been priced are certain
3. Keep the evaluation process objective

Discounting – Impact of Bid on Business Case (Change in NPV?)

Comparison of Bids
Business Case
Award Price
Bid Price
Spend Approval
Project Overheads
Contingencies
Provisions
Which do you
compare?
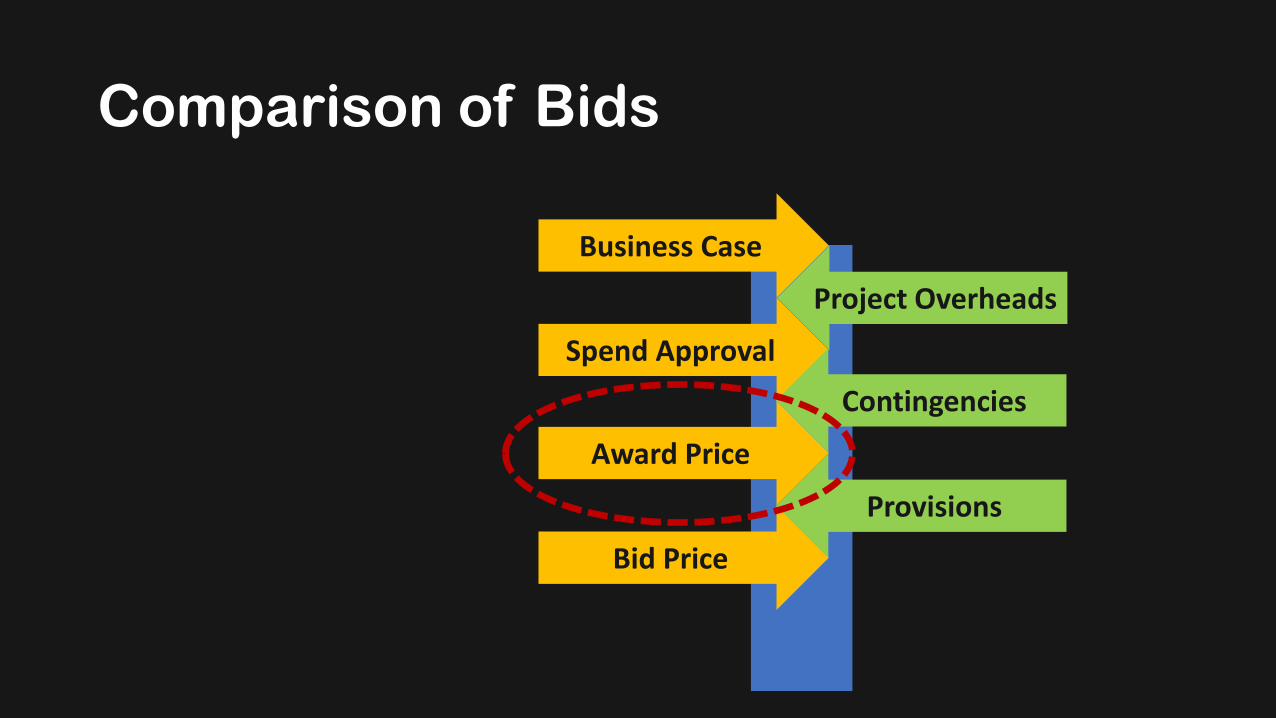
Comparison of Bids
Business Case
Award Price
Bid Price
Spend Approval
Project Overheads
Contingencies
Provisions

Comparison of Bids
Business Case
Award Price
Bid Price
Spend Approval
Project Overheads
Contingencies
Provisions
Variations used to include
contingencies and adjust the contract price
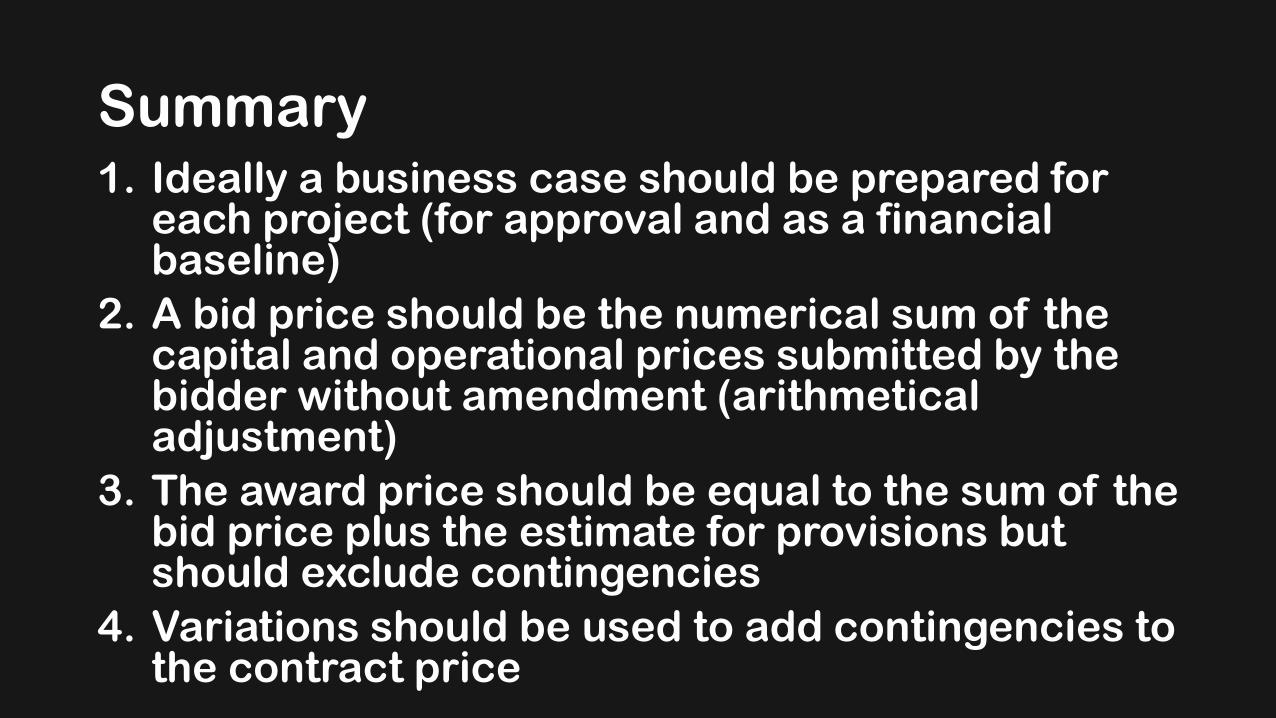
Summary1. Ideally a business case should be prepared for
each project (for approval and as a financial baseline)
2. A bid price should be the numerical sum of the capital and operational prices submitted by the bidder without amendment (arithmetical adjustment)
3. The award price should be equal to the sum of the bid price plus the estimate for provisions but should exclude contingencies
4. Variations should be used to add contingencies to the contract price

Summary Learned - Summary
1. 24 Observations2. Develop into a Knowledge Project3. Still much to learn about DBO
contracts4. Need to continue to provide guidance
and train Project Management Units in:a) Procurement, b) Bid Evaluation, c) DBO Contracts, and d) What’s Important

Which two countries have the highest installed desalination plant capacity in the world?

Highest: Saudi Arabia
Second Highest: United States of America
5 million m3/day
2.8 million m3/day