
INNOVATIVE CLEANER PRODUCTION TECHNIQUE: FOAM GLASS ...
126
THE AMERICAN UNIVERSITY IN CAIRO SCHOOL OF SCIENCES AND ENGINEERING INNOVATIVE CLEANER PRODUCTION TECHNIQUE: FOAM GLASS PRODUCTION FROM LEAD CRYSTAL GLASS SLUDGE BY HUSSEIN ABDEL FATTAH MOHAMED RAMADAN ELKERSH B.Sc. Mechanical Power Engineering A thesis submitted in partial fulfillment of the requirements for the degree of Master of Science in Mechanical Engineering Under the supervision of: Dr. Salah M. El Haggar Professor, Department of Mechanical Engineering The American University in Cairo January 2014
Transcript of INNOVATIVE CLEANER PRODUCTION TECHNIQUE: FOAM GLASS ...

THE AMERICAN UNIVERSITY IN CAIRO
SCHOOL OF SCIENCES AND ENGINEERING
INNOVATIVE CLEANER PRODUCTION TECHNIQUE:
FOAM GLASS PRODUCTION FROM LEAD CRYSTAL GLASS SLUDGE
BY
HUSSEIN ABDEL FATTAH MOHAMED RAMADAN ELKERSH
B.Sc. Mechanical Power Engineering
A thesis submitted in partial fulfillment of the requirements for the degree of
Master of Science in Mechanical Engineering
Under the supervision of:
Dr. Salah M. El Haggar
Professor, Department of Mechanical Engineering The American University in Cairo
January 2014

ii
ACKNOWLEDGMENT
I would like to dedicate this work to my parents whom without their encouragement
this work would not have been possible. I would like to profoundly thank Dr. Salah El-
Haggar for his continuous guidance and support throughout the thesis work. I would like to
thank Mr. Mohamed Saeed (Waste Management Lab), Mr. Zakaria Yehia (Materials Testing
Lab) and Mr. Ahmed Saad (Environmental Lab). I am also thankful to ASFOUR Crystal
team for their cooperation and support for this research.
iii
ABSTRACT
An innovative cleaner production technique that adopts open-recycling system of the
grinding and polishing sludge of lead crystal glass was applied in this study. Foam glass with
good properties that can be used in the thermal insulation applications was produced from the
grinding and polishing sludge. The leaching test of the sludge showed that it is a hazardous
waste because its leachate has a lead concentration of 7.5 mg/l, while the leachate of the
produced foam glass was proved to have a negligible lead concentration of less than 0.02
mg/l. The effect of the heating method, sintering temperature, holding time and additives of
Silicon Carbide SiC and granite powder on the properties of the foam glass was investigated.
The investigated properties are foam bulk density, porosity percentage, compressive strength
and thermal conductivity. Sintering the samples by direct insertion to the oven resulted in
lower compressive strength and lower density compared to the low heating rate of around 1.5
oC/min adopted in this study. Sintering temperature of 750
oC at a holding time of 30 minutes
produced foam glass with bulk density of 0.485 g/cm3, porosity of 84.6%, compressive
strength of 2.21 MPa and thermal conductivity of 0.051 W/m. K. These properties are
comparable to those of commercial foam glass. Lower temperatures resulted in foam glass
with significantly higher bulk density, while higher temperatures led to deterioration in the
foam glass properties due to the coalescence phenomenon.
The addition of SiC leads to increase foam glass porosity and reduce its bulk density,
compressive strength and thermal conductivity. Adding SiC from 2 to 8 wt.% produced a
foam glass with porosity 89.4-91.9%, bulk density 0.256-0.334 g/cm3, compressive strength
0.89-1.44 MPa and thermal conductivity 0.039-0.058 W/m.K. In contrast, the addition of
granite powder reduces the foam glass porosity and increases its bulk density, compressive
strength and thermal conductivity. Adding granite powder from 2 to 8 wt.% produced a foam
glass with porosity 76.1-83.2%, bulk density 0.529-0.747 g/cm3, compressive strength 2.43-
5.09 MPa, thermal conductivity 0.074-0.135 W/m. K. It can be concluded that the foam glass
prepared by adding SiC is suitable to the applications that need very low thermal
conductivity, while the foam glass prepared by adding granite powder is suitable to the
applications where compressive strength is of more importance.
iv
TABLE OF CONTENTS
ABSTRACT ………………………………………………………….…..…....
LIST OF TABLES ……………………………………………………..…….
LIST OF FIGURES …………………………………………………....…….
LIST OF ABBREVIATIONS …………………………………………………
NOMENCLATURE ……………………………………………………………
CHAPTER 1: INTRODUCTION ……………………………………………
1.1 Glass …………………………………………………………..…..………
1.2 Glass Types, Compositions and Applications………………………….…….
1.2.1 Soda-lime glass ………………………………….……….……….…
1.2.2 Borosilicate glass ………………………………….……..…….……
1.2.3 Lead glass ………………………………………………….………...
1.3 Lead in the Crystal Glass Industry ………………………………...….……
1.4 Health Hazardous Associated with Lead ……………………..……………
1.4.1 Lead dust in lead crystal manufacturing ……………………………..
1.4.2 Lead release from lead crystal to food and beverages ……………….
1.5 Lead-Free Crystal Glass ……………………………………………………
1.6 Viscosity-Temperature Characteristics of Glass …………………………
1.7 Glass Manufacturing ………………………………………………………
1.7.1 Batch preparation …………………………………….………………
1.7.2 Melting ……………………………………………………..………..
1.7.3 Forming ………………………………………………………..………
1.7.4 Annealing ………………………………………………………..…...
1.7.5 Finishing …………………………………………………………..….
1.8 Pollution Associated with Glass Manufacturing …………………………..
1.8.1 Air emissions ………………………………………………….…….
1.8.2 Wastewater ………………………………………………….……….
1.8.3 Solid waste …………………………………………………..……….
CHAPTER 2: LITERATURE REVIEW …………………………….…….
2.1 Cleaner Production Techniques in Lead Crystal Glass ………………….
2.1.1 Air emissions …………………………………………………………
2.1.2 Wastewater ……………………………………………….…………..
iii
vii
ix
xiii
xiv
1
1
2
3
3
3
5
7
9
10
11
13
14
15
15
15
17
17
18
18
19
20
22
22
23
24
v
2.1.3 Solid waste ………………………………………………….………….
2.2 Utilization of Grinding Sludge to Produce Foam Glass ……………..……
2.3 Foam Glass ………………………………………………………..………..
2.3.1 Foaming agents ……………………………………………..………...
2.3.2 Foam Glass Properties ……………………………………….……….
2.3.3 Compressive stress model for open and closed cells ………….……..
2.4 Parameters Affecting the Properties of Foam Glass ……………….………
2.4.1 Heating & cooling rate ……………………………….……………….
2.4.2 Amount of foaming agent ……………………………………………
2.4.3 Holding time …………………………………………….……………
2.4.4 Sintering temperature …………………………………….……….……
2.5 Measuring Compressive Strength ……………………………….…………
2.5.1 Stress-strain curve of foam glass ……………………………………..
2.5.2 Sample size and cross head speed …………………………….…..…..
2.6 Leaching of Lead Silicate Glass ………………………………..….…...….
CHAPTER 3: Experimental Procedure ……………………….……..…..….
3.1 Characteristics of Raw Material ………………………………..…..……
3.1.1 Chemical analysis ………………………………………………..….
3.1.2 Particle size analysis …………………………………………….….
3.1.3 Powder density measurement …………………………………..……
3.1.4 Leaching test …………………………………………………….…..
3.2 Foam Glass Preparation Procedure ………………………………….…….
3.3 Experimental Matrix ……………………………………………….……..
3.4 Testing of the Produced Foam Glass ……………………………………
3.4.1 Compression test ………………………………………………...…
3.4.2 Bulk density measurement ………………………………………….
3.4.3 Thermal conductivity measurement ………………………….……..
3.4.4 Leaching test …………………………………………………….….
CHAPTER 4: RESULTS AND DISCUSSION ……………………..……...
4.1 Physical Properties of Powders …………………………………….……...
4.2 The Effect of Low Heating Rate vs. Direct Insertion ……………...………..
4.3 The Effect of Sintering Temperature on the Foam Glass Properties ………
26
28
28
29
30
34
36
36
39
41
43
47
47
51
52
60
60
60
60
62
62
67
73
74
74
75
75
75
76
76
78
80
vi
4.4 The Effect of Holding Time on the Foam Glass Properties .……………..….
4.5 The Effect of Silicon Carbide Additive on the Foam Glass Properties……...
4.6 The Effect of Granite Additive on the Foam Glass Properties…………..…..
4.7 Compressive Strength-Relative Density Relationship …………………..…
4.8 Leaching Test Results ………………………………………………...……
CHAPTER 5: CONCLUSION AND RECOMMENDATIONS ………...…
5.1 Conclusion ……………………………………………………………..…..
5.2 Recommendations for Future Work ………………………………………..
REFERENCES …………………………………………………………..……
APPENDIX A: SIEVE ANALYSIS OF SLUDGE POWDER …………..…
84
88
92
96
98
100
100
102
104
111
vii
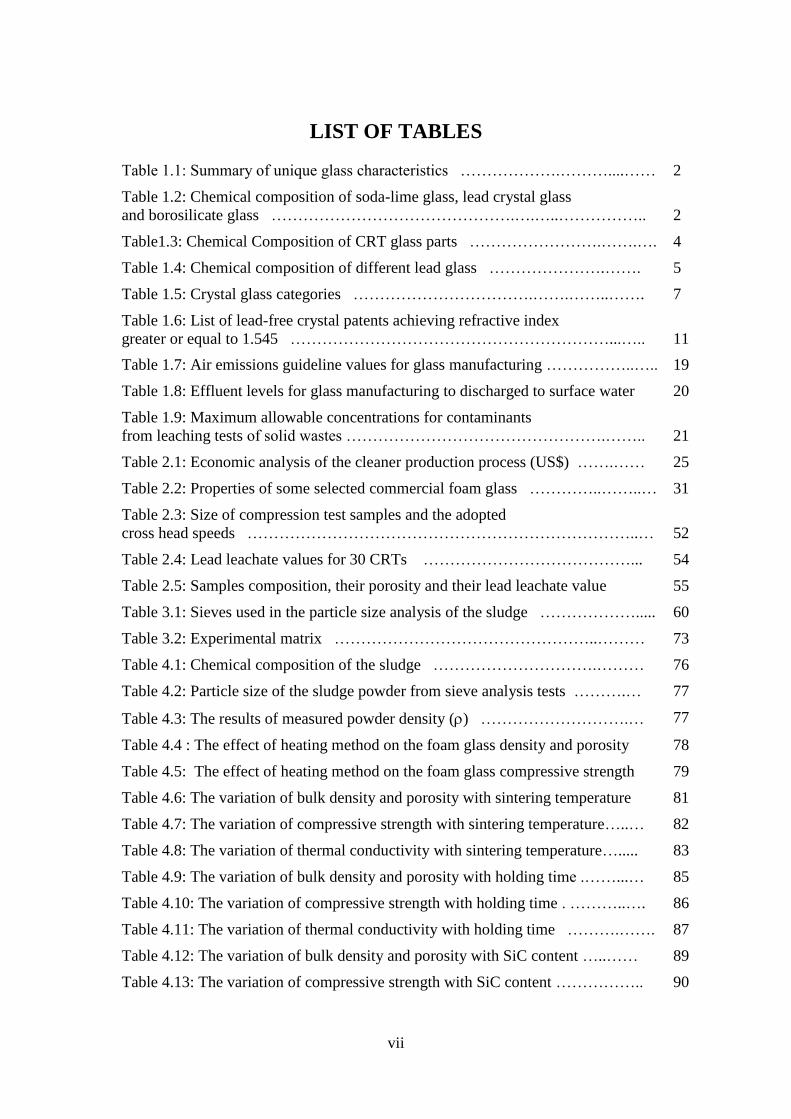
LIST OF TABLES
Table 1.1: Summary of unique glass characteristics ……………….………....…… 2
Table 1.2: Chemical composition of soda-lime glass, lead crystal glass
and borosilicate glass ……………………………………….….…..……………..
2
Table1.3: Chemical Composition of CRT glass parts …………………….…….…. 4
Table 1.4: Chemical composition of different lead glass ………………….……. 5
Table 1.5: Crystal glass categories …………………………….…….……..……. 7
Table 1.6: List of lead-free crystal patents achieving refractive index
greater or equal to 1.545 ……………………………………………………...…..
11
Table 1.7: Air emissions guideline values for glass manufacturing ……………..….. 19
Table 1.8: Effluent levels for glass manufacturing to discharged to surface water 20
Table 1.9: Maximum allowable concentrations for contaminants
from leaching tests of solid wastes ………………………………………….……..
21
Table 2.1: Economic analysis of the cleaner production process (US$) …….…… 25
Table 2.2: Properties of some selected commercial foam glass …………..……..… 31
Table 2.3: Size of compression test samples and the adopted
cross head speeds ………………………………………………………………..…
52
Table 2.4: Lead leachate values for 30 CRTs …………………………………... 54
Table 2.5: Samples composition, their porosity and their lead leachate value 55
Table 3.1: Sieves used in the particle size analysis of the sludge ………………..... 60
Table 3.2: Experimental matrix …………………………………………..……… 73
Table 4.1: Chemical composition of the sludge ………………………….……… 76
Table 4.2: Particle size of the sludge powder from sieve analysis tests ……….… 77
Table 4.3: The results of measured powder density () ……………………….… 77
Table 4.4 : The effect of heating method on the foam glass density and porosity 78
Table 4.5: The effect of heating method on the foam glass compressive strength 79
Table 4.6: The variation of bulk density and porosity with sintering temperature 81
Table 4.7: The variation of compressive strength with sintering temperature…..… 82
Table 4.8: The variation of thermal conductivity with sintering temperature…..... 83
Table 4.9: The variation of bulk density and porosity with holding time .……...… 85
Table 4.10: The variation of compressive strength with holding time . ………..…. 86
Table 4.11: The variation of thermal conductivity with holding time ……….……. 87
Table 4.12: The variation of bulk density and porosity with SiC content …..…… 89
Table 4.13: The variation of compressive strength with SiC content …………….. 90

viii
Table 4.14: The variation of thermal conductivity with SiC content …………..... 91
Table 4.15: The variation of bulk density and porosity with granite content …..… 93
Table 4.16: The variation of compressive strength with granite content ……..….. 94
Table 4.17: The variation of thermal conductivity with granite content …….….. 95
Table 4.18: The variation of compressive strength with relative density…………... 97
Table 4.19: Measured pH value and Pb concentration of the sludge leachate……… 98
Table 4.20: Measured pH value and Pb concentration of the leachate
of foam glass sample#2 ………….…………………………………………...……
99

ix
LIST OF FIGURES
Figure 1.1: Behavior of crystalline and non-crystalline materials during cooling 1
Figure 1.2: Components of CRTs ……………………………………………. 4
Figure 1.3: The relationship between glass density, refractive index
and lead content ………………………………………………………..………
6
Figure 1.4: The organ systems affected by lead exposure …………..……..…... 8
Figure 1.5: The lowest observable levels for lead concentration in blood
in adults and children resulting in negative health effects ……………….……..
9
Figure 1.6: Relationship between concentration of BaCO3 and
refractive index of glass ………………….…………………………………….
12
Figure 1.7: The effect of temperature on the viscosity of glass ………..……… 13
Figure 1.8: Overview of glass manufacturing ……………………….………… 14
Figure 1.9: Producing glass bottle by using the blowing method ……….…….. 16
Figure 1.10: Schematic diagram showing the float process
for making sheet glass …………………………………………………..………
17
Figure 1.11: Conventional treatment process for wastewater
in the glass industry …………………………………………………….………
20
Figure 2.1: Proposed membrane system to recycle the wastewater
in glass industry ……………………………………………………………..….
24
Figure 2.2: Typical manufacturing process and conventional wastewater
treatment system in crystal glass industry …………………………………..….
24
Figure 2.3: Cleaner production zero-discharge wastewater
system in crystal glass industry ……………………………….………………..
25
Figure 2.4: Schematic diagram for utilizing polishing waste
of lead crystal glass …………………………………………………….……….
26
Figure 2.5: Schematic diagram for utilizing grinding waste of
lead crystal glass ……………………………………………………….……….
27
Figure 2.6: The range of properties for foams …………………………...…….. 31
Figure 2.7: Variation of compressive strength and density of
glass foams with the strut thickness of cells ………………………………….
32
Figure 2.8: Variation of compressive strength with the
square root of the pore diameter ……………………………………………...….
33
Figure 2.9: The relationship between thermal conductivity and porosity …….… 33
Figure 2.10: Cubic cell model for open and closed cells ………………….…… 34
Figure 2.11: Comparison between the experimental results of foam
glass prepared from CRT glass with Gibson and Ashby model ………….…..
35

x
Figure 2.12: Comparison between the experimental results of foam
glass prepared from soda-lime glass with Gibson and Ashby model ………….
36
Figure 2.13: Morphology of foam glass sintered at 725 oC and holding
time 15 minute prepared by a) Heating rate 20 oC/min b) Direct insertion………
38
Figure 2.14: The variation of the mechanical strength
with different SiC content ………………………………………………………
39
Figure 2.15 Morphology of foam glass with different content
of SiC: a) 1 wt% b) 5 wt% c) 9 wt% …………………………………..…….…
40
Figure 2.16: The variation of foam glass density with different
content of foaming agent egg shell containing 95wt% CaCO3 …………..…..…
41
Figure 2.17: Morphology of foam glass at different holding time:
a) 5 minutes b) 10 minutes c) 15 minutes d) 30 minutes …………….………..
42
Figure 2.18: Morphology of foam glass at different holding time:
30 minutes b) 60 minutes c) 90 minutes ………………………….……..……..
43
Figure 2.19: Morphology of foam glass at sintering temperature:
a) 750 oC b) 850
oC c) 950
oC ……………………………….…………..……..
43
Figure 2.20: Morphology of foam glass at sintering temperature:
a) 600 oC b) 700
oC …………………………………………………..……….
44
Figure 2.21: The variation of a) density b) compressive
strength with sintering temperature ………………………………..…………..
44
Figure 2.22: Effect of sintering temperature on relative density
under various pressures ………………………………………………..………
45
Figure 2.23: The morphology of foam glass prepared from soda-lime
glass at: (a) 750 oC, (b) 800
oC, (c) 850
oC (d) 900
oC ………………………..
46
Figure 2.24: Metal lead content in wt% of unreduced lead initially
present before foaming vs. the sintering temperature …………………….……
47
Figure 2.25: Compressive stress-strain curve for elastic-brittle foams …………. 47
Figure 2.26: Compression stress-strain curve for foam glass
prepared from soda-lime glass ………………………………………………….
49
Figure 2.27: Compression stress-strain curve for different samples of
foam glass prepared from soda-lime glass, aluminosilicate glass powder
and SiC as foaming agent ……………………………………………………..
49
Figure 2.28 Compression stress-strain curve for foam glass with
different particle size prepared from soda-lime glass with 12wt%
sodium silicate at sintering temperature of 850 oC , holding time 30 minutes…..
50
Figure 2.29: Compression stress-strain curve for foam glass prepared from
CRT panel and funnel glass with SiC and TiN as foaming agent ……………….
51
Figure 2.30: Metal lead content in wt% of unreduced lead initially
present before foaming vs. the foaming agent content …………………….…...
56
xi
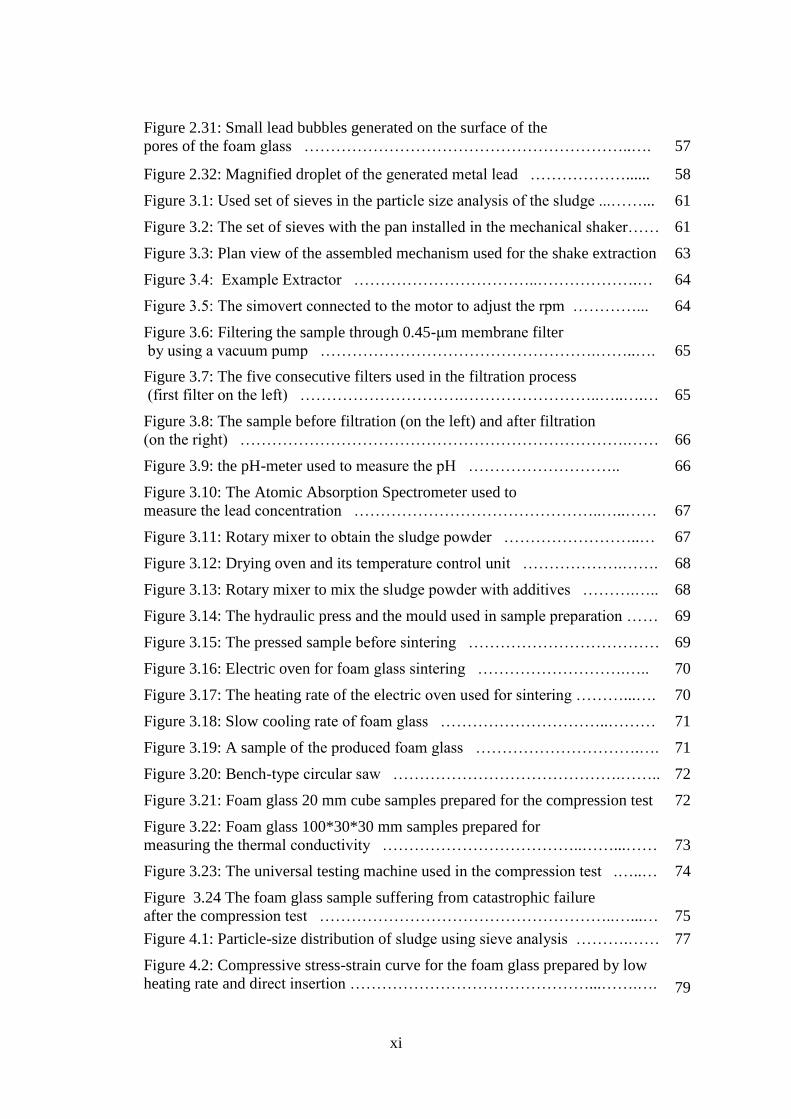
Figure 2.31: Small lead bubbles generated on the surface of the
pores of the foam glass ……………………………………………………..….
57
Figure 2.32: Magnified droplet of the generated metal lead ………………...... 58
Figure 3.1: Used set of sieves in the particle size analysis of the sludge ...……... 61
Figure 3.2: The set of sieves with the pan installed in the mechanical shaker…… 61
Figure 3.3: Plan view of the assembled mechanism used for the shake extraction 63
Figure 3.4: Example Extractor ……………………………..……………….… 64
Figure 3.5: The simovert connected to the motor to adjust the rpm …………... 64
Figure 3.6: Filtering the sample through 0.45-μm membrane filter
by using a vacuum pump …………………………………………….……..….
65
Figure 3.7: The five consecutive filters used in the filtration process
(first filter on the left) ………………………….……………………..…..….…
65
Figure 3.8: The sample before filtration (on the left) and after filtration
(on the right) ……………………………………………………………….……
66
Figure 3.9: the pH-meter used to measure the pH ……………………….. 66
Figure 3.10: The Atomic Absorption Spectrometer used to
measure the lead concentration ………………………………………..…..…… 67
Figure 3.11: Rotary mixer to obtain the sludge powder ……………………..… 67
Figure 3.12: Drying oven and its temperature control unit ……………….……. 68
Figure 3.13: Rotary mixer to mix the sludge powder with additives ……….….. 68
Figure 3.14: The hydraulic press and the mould used in sample preparation …… 69
Figure 3.15: The pressed sample before sintering ……………………………… 69
Figure 3.16: Electric oven for foam glass sintering ……………………….….. 70
Figure 3.17: The heating rate of the electric oven used for sintering ………...…. 70
Figure 3.18: Slow cooling rate of foam glass …………………………..……… 71
Figure 3.19: A sample of the produced foam glass ………………………….…. 71
Figure 3.20: Bench-type circular saw …………………………………….…….. 72
Figure 3.21: Foam glass 20 mm cube samples prepared for the compression test 72
Figure 3.22: Foam glass 100*30*30 mm samples prepared for
measuring the thermal conductivity ………………………………..……...……
73
Figure 3.23: The universal testing machine used in the compression test .…..… 74
Figure 3.24 The foam glass sample suffering from catastrophic failure
after the compression test ………………………………………………..…...…
75
Figure 4.1: Particle-size distribution of sludge using sieve analysis ……….…… 77
Figure 4.2: Compressive stress-strain curve for the foam glass prepared by low
heating rate and direct insertion ………………………………………...…….….
79
xii
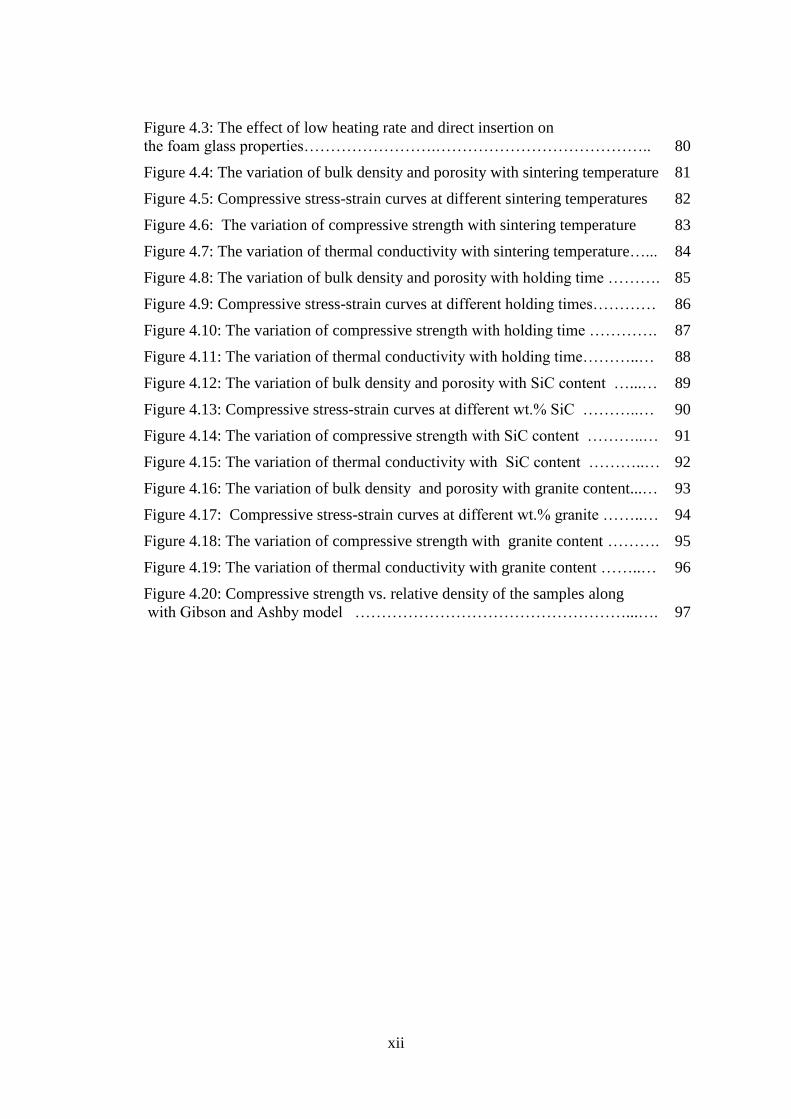
Figure 4.3: The effect of low heating rate and direct insertion on
the foam glass properties…………………….…………………………………..
80
Figure 4.4: The variation of bulk density and porosity with sintering temperature 81
Figure 4.5: Compressive stress-strain curves at different sintering temperatures 82
Figure 4.6: The variation of compressive strength with sintering temperature 83
Figure 4.7: The variation of thermal conductivity with sintering temperature…... 84
Figure 4.8: The variation of bulk density and porosity with holding time ………. 85
Figure 4.9: Compressive stress-strain curves at different holding times………… 86
Figure 4.10: The variation of compressive strength with holding time …………. 87
Figure 4.11: The variation of thermal conductivity with holding time………..… 88
Figure 4.12: The variation of bulk density and porosity with SiC content …...… 89
Figure 4.13: Compressive stress-strain curves at different wt.% SiC ………..… 90
Figure 4.14: The variation of compressive strength with SiC content ………..… 91
Figure 4.15: The variation of thermal conductivity with SiC content ………..… 92
Figure 4.16: The variation of bulk density and porosity with granite content...… 93
Figure 4.17: Compressive stress-strain curves at different wt.% granite ……..… 94
Figure 4.18: The variation of compressive strength with granite content ………. 95
Figure 4.19: The variation of thermal conductivity with granite content ……..… 96
Figure 4.20: Compressive strength vs. relative density of the samples along
with Gibson and Ashby model ……………………………………………...….
97
xiii
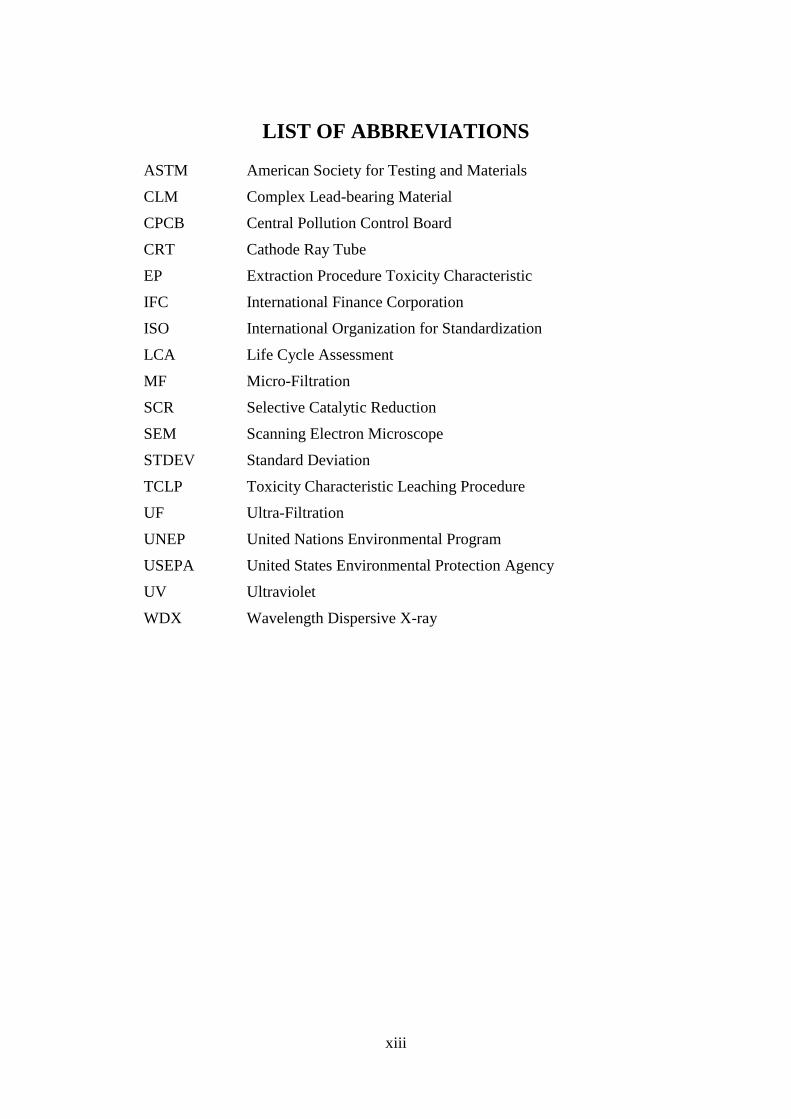
LIST OF ABBREVIATIONS
ASTM American Society for Testing and Materials
CLM Complex Lead-bearing Material
CPCB Central Pollution Control Board
CRT Cathode Ray Tube
EP Extraction Procedure Toxicity Characteristic
IFC International Finance Corporation
ISO International Organization for Standardization
LCA Life Cycle Assessment
MF Micro-Filtration
SCR Selective Catalytic Reduction
SEM Scanning Electron Microscope
STDEV Standard Deviation
TCLP Toxicity Characteristic Leaching Procedure
UF Ultra-Filtration
UNEP United Nations Environmental Program
USEPA United States Environmental Protection Agency
UV Ultraviolet
WDX Wavelength Dispersive X-ray
xiv
NOMENCLATURE
A Mass of sample after drying, g
B Original mass of sample, g
M Mass fraction
m Mass, g
S Solid content
V Volume, cm3
Powder density, g/cm3
b Foam glass bulk density, g/cm3
rel Relative density
cr Crushing/ compressive strength of foam glass, MPa
bs Bending strength of solid glass, MPa
Fraction of the solid contained in the cell edges

1
CHAPTER 1
INTRODUCTION
1.1 Glass
Glass is a ceramic material made from inorganic materials at high temperature.
The solidification behavior of glass is what makes it non-crystalline (amorphous)
material as it is cooled without crystallization. When cooling a crystalline material it
solidifies at its specified melting temperature Tm with a significant decrease in its
specific volume. However, when cooling glass the liquid transforms to glass at the
glass transition temperature Tg. At this temperature the liquid changes from rubbery
soft plastic state to a brittle rigid glass state (Callister and Rethwisch, 2009; Smith,
1996). This is presented in Figure 1.1.
Figure 1.1: Behavior of crystalline and non-crystalline materials
during cooling (Callister and Rethwisch, 2009)
Glass has some unique characteristics. It’s necessary to know these
characteristics in order to properly choose the suitable applications for glass. Table1.1
qualitatively summarizes these characteristics.

2
Table 1.1: Summary of unique glass characteristics
Source: (Energetics, 2002)
1.2 Glass Types, Compositions and Applications
Silicon dioxide (SiO2) derived from sand is the main constituent of glass.
Glass can be classified based on its chemical composition to three main types that
represent more than 95% of the produced glass. These three types are; soda-lime
glass, lead glass, borosilicate glass (Vieitez et al., 2011). Table 1.2 shows the
chemical composition of these three types.
Table 1.2: Chemical composition of soda-lime glass, lead crystal glass
and borosilicate glass
Soda-lime glass Borosilicate glass Lead glass
Silicon dioxide (SiO2) 71-75% 70-80% 54-65%
Boron trioxide (B2O3) 7-15%
Lead oxide (PbO) 25-30%
Sodium oxide (Na2O) 12-16% 4-8% 13-15%
Potassium oxide (K2O)
Calcium oxide (CaO) 10-15%
Aluminum trioxide (Al2O3) 7%
Source: (Vieitez et al., 2011)

3
1.2.1 Soda-lime glass
The main constituents of soda–lime glass, other than silicon dioxide, are Na2O
derived from sodium carbonates Na2CO3 (soda ash) and CaO from Calcium carbonate
CaCO3 (limestone). The function of Na2O is to lower the melting point of silica to
1500 oC while CaO is added to enhance the chemical durability of the glass. Soda-
lime glass is used in three main applications: Container glass (packing bottles and
jars), flat glass (windows of buildings and automotive) and domestic glass (drinkware
and dishes) (Vieitez et al., 2011).
1.2.2 Borosilicate glass
As shown in Table 1.2 borosilicate glass contains 7-15% Boron trioxide.
Adding boron provides superior durability and resistance against chemicals and heat.
It also changes the viscosity of glass which facilitates the manufacturing process.
Typical applications of borosilicate glass can be found in laboratories and
pharmaceutical tools such as syringes, ampoules and vials. It’s also used in cookware
and as bulbs for high-power lamps and in the fire protection windows (Vieitez et al.,
2011).
1.2.3 Lead glass
Lead oxides PbO (litharge) and Pb3O4 (red lead) are added to glass to increase
the refractive index which gives brilliance to glass. It also eases the workability of
handmade glass by lowering the required working temperature and viscosity (Vieitez
et al., 2011). Table 1.2 shows that the typical lead oxide PbO content in lead glass is
about 25-30%, however higher percentage can be found in certain applications like
optical glasses. There are four main applications of lead glass (Hynes and Jonson,
1997):
Lead Crystal: According to the European Community Directive on crystal
glass 69/493/EEC, in order to market glass as ‘full crystal’, the glass should
contain at least 24% PbO with a minimum refractive index and density of
1.545 and 2.9 g/cm3, respectively (EU Directive 69/493/EEC, 1969). This will
be discussed later in more details.
Cathode ray tube CRT: Lead is added to CRT to absorb the UV and X-ray
radiation produced by the electron gun. It should be noticed however that CRT
4
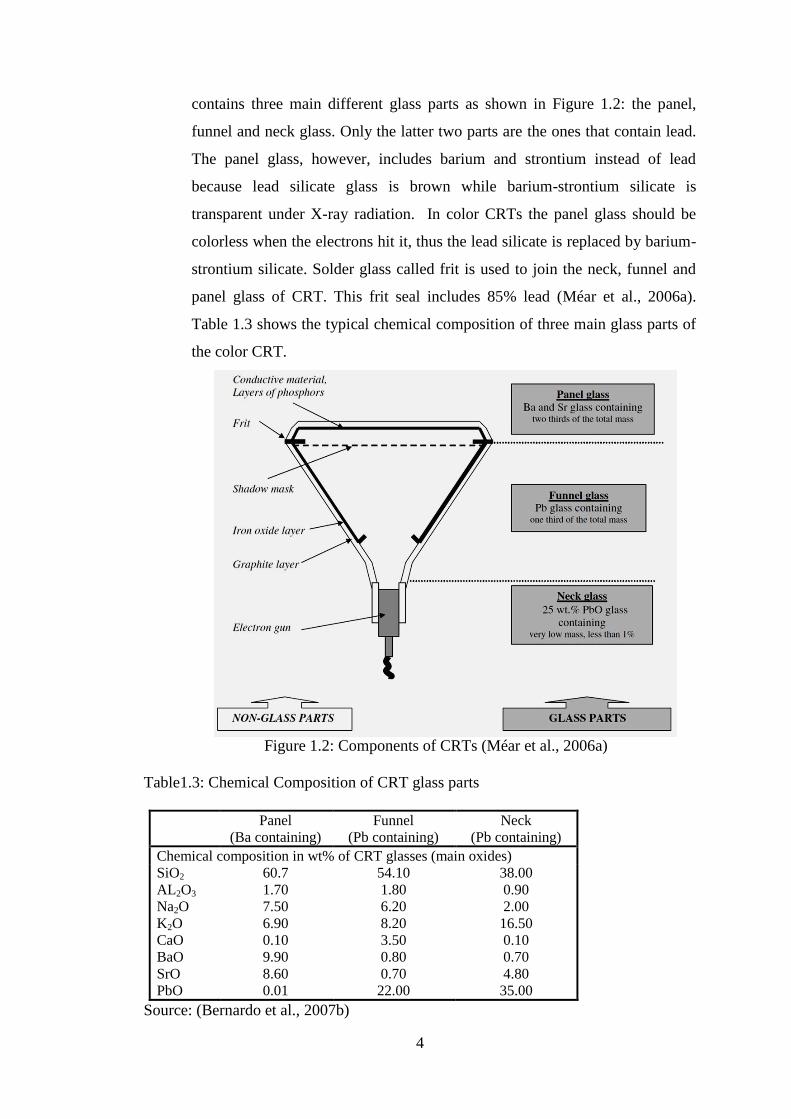
contains three main different glass parts as shown in Figure 1.2: the panel,
funnel and neck glass. Only the latter two parts are the ones that contain lead.
The panel glass, however, includes barium and strontium instead of lead
because lead silicate glass is brown while barium-strontium silicate is
transparent under X-ray radiation. In color CRTs the panel glass should be
colorless when the electrons hit it, thus the lead silicate is replaced by barium-
strontium silicate. Solder glass called frit is used to join the neck, funnel and
panel glass of CRT. This frit seal includes 85% lead (Méar et al., 2006a).
Table 1.3 shows the typical chemical composition of three main glass parts of
the color CRT.
Figure 1.2: Components of CRTs (Méar et al., 2006a)
Table1.3: Chemical Composition of CRT glass parts
Panel
(Ba containing)
Funnel
(Pb containing)
Neck
(Pb containing)
Chemical composition in wt% of CRT glasses (main oxides)
SiO2
AL2O3
Na2O
K2O
CaO
BaO
SrO
PbO
60.7
1.70
7.50
6.90
0.10
9.90
8.60
0.01
54.10
1.80
6.20
8.20
3.50
0.80
0.70
22.00
38.00
0.90
2.00
16.50
0.10
0.70
4.80
35.00
Source: (Bernardo et al., 2007b)
5
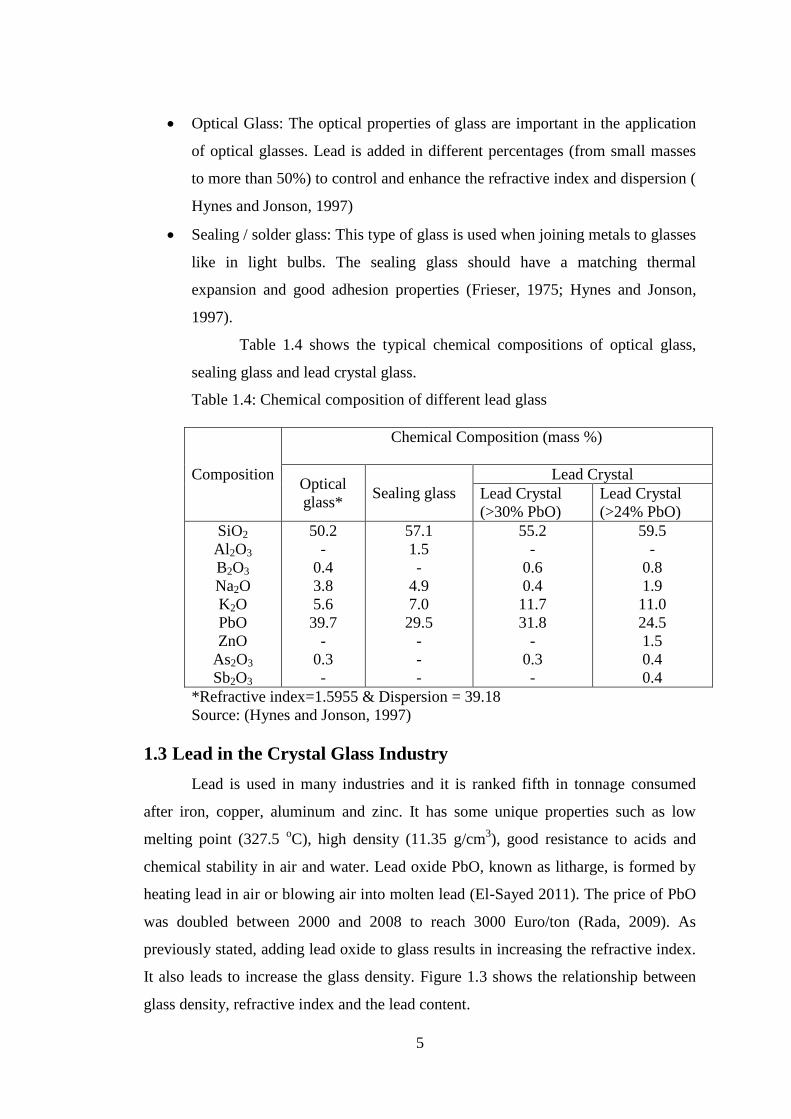
Optical Glass: The optical properties of glass are important in the application
of optical glasses. Lead is added in different percentages (from small masses
to more than 50%) to control and enhance the refractive index and dispersion (
Hynes and Jonson, 1997)
Sealing / solder glass: This type of glass is used when joining metals to glasses
like in light bulbs. The sealing glass should have a matching thermal
expansion and good adhesion properties (Frieser, 1975; Hynes and Jonson,
1997).
Table 1.4 shows the typical chemical compositions of optical glass,
sealing glass and lead crystal glass.
Table 1.4: Chemical composition of different lead glass
Composition
Chemical Composition (mass %)
Optical
glass* Sealing glass
Lead Crystal
Lead Crystal
(>30% PbO)
Lead Crystal
(>24% PbO)
SiO2
Al2O3
B2O3
Na2O
K2O
PbO
ZnO
As2O3
Sb2O3
50.2
-
0.4
3.8
5.6
39.7
-
0.3
-
57.1
1.5
-
4.9
7.0
29.5
-
-
-
55.2
-
0.6
0.4
11.7
31.8
-
0.3
-
59.5
-
0.8
1.9
11.0
24.5
1.5
0.4
0.4
*Refractive index=1.5955 & Dispersion = 39.18
Source: (Hynes and Jonson, 1997)
1.3 Lead in the Crystal Glass Industry
Lead is used in many industries and it is ranked fifth in tonnage consumed
after iron, copper, aluminum and zinc. It has some unique properties such as low
melting point (327.5 oC), high density (11.35 g/cm
3), good resistance to acids and
chemical stability in air and water. Lead oxide PbO, known as litharge, is formed by
heating lead in air or blowing air into molten lead (El-Sayed 2011). The price of PbO
was doubled between 2000 and 2008 to reach 3000 Euro/ton (Rada, 2009). As
previously stated, adding lead oxide to glass results in increasing the refractive index.
It also leads to increase the glass density. Figure 1.3 shows the relationship between
glass density, refractive index and the lead content.

6
Figure 1.3: The relationship between glass density,
refractive index and lead content (Davison, 2003)
The European Community Directive on crystal glass 69/493/EEC set certain
criteria for glass to be marketed as “full crystal” or “crystal” (KEMI, 2007; UNEP,
2010). The directive divides crystal glass into four categories. In the first two
categories the content of lead oxide PbO must be greater than or equal to 30% and
24% with density greater than or equal to 3 and 2.9 g/cm2 respectively and a refractive
index greater than or equal to 1.545. These two categories can be marketed as “full
crystal” with a gold round label. In the second two categories lead oxide PbO and/or
other oxides such as Barium Oxide BaO and Potassium Oxide K2O can be used with a
total percentage of 10% (EU Directive 69/493/EEC, 1969). The crystal glass
categories as decided by the European Community directive on crystal glass are
shown in Table 1.5

7
Table 1.5: Crystal glass categories
Description Metal
oxide%
Density
(g/cm3)
Refractive
index
Surface
Hardness
Label
Full Crystal PbO 30% 3 1.545 Round golden
label
Full Crystal PbO 24% 2.9 1.545 Round golden
label
Crystal ZnO, BaO,
PbO, K2O
single or
together
10%
2.45 1.52 Square silver
label
Crystal BaO, PbO,
K2O single
or together
10%
2.4 Vickers
500 + 20
Equilateral
triangle silver
label
Source: (EU Directive 69/493/EEC, 1969 ; KEMI, 2007)
The UNEP review of scientific information on lead describes the European
Community directive on crystal glass as a directive that advocates the use of lead
(UNEP, 2010). This is because the directive asks for certain amounts of lead oxide to
be used in order to market crystal glass as “full crystal” with the round golden label.
This can conflict with the environmental policies in countries that try to minimize the
usage of such toxic substances. For example, the Swedish government indicates that
the requirements in this directive clash with the Swedish environmental policy and
thus the Swedish government aims to change this crystal directive (KEMI, 2007).
Rada (2009) proposed alternative directive that doesn’t ask for using lead oxide, but it
specifies other important parameters. These parameters include impact resistance,
chemical durability, absence of bubbles and cores as well as the refractive index. In
contrary to the European Community Directive on crystal glass, the proposed
directive didn’t include density in its criteria.
1.4 Health Hazardous Associated with Lead
Lead is considered as pure toxic element and it has no beneficial effects to the
body (UNEP, 2013). Figure 1.4 shows the human organ systems that can be affected
by exposure to lead. Countries such as Germany, Australia and Canada have
guidelines to lead levels in blood as low as 10-15 g/dl for general population
(UNEP, 2013).

8
Figure 1.4: The organ systems affected by lead exposure (UNEP, 2013)
Studies have shown that there is no threshold for safe exposure to lead since
even the lowest dose can affect the human nervous system (UNEP, 2013). However,
Figure 1.5 shows the lowest observable levels of lead in blood that can cause negative
health effects in adults as well as children.
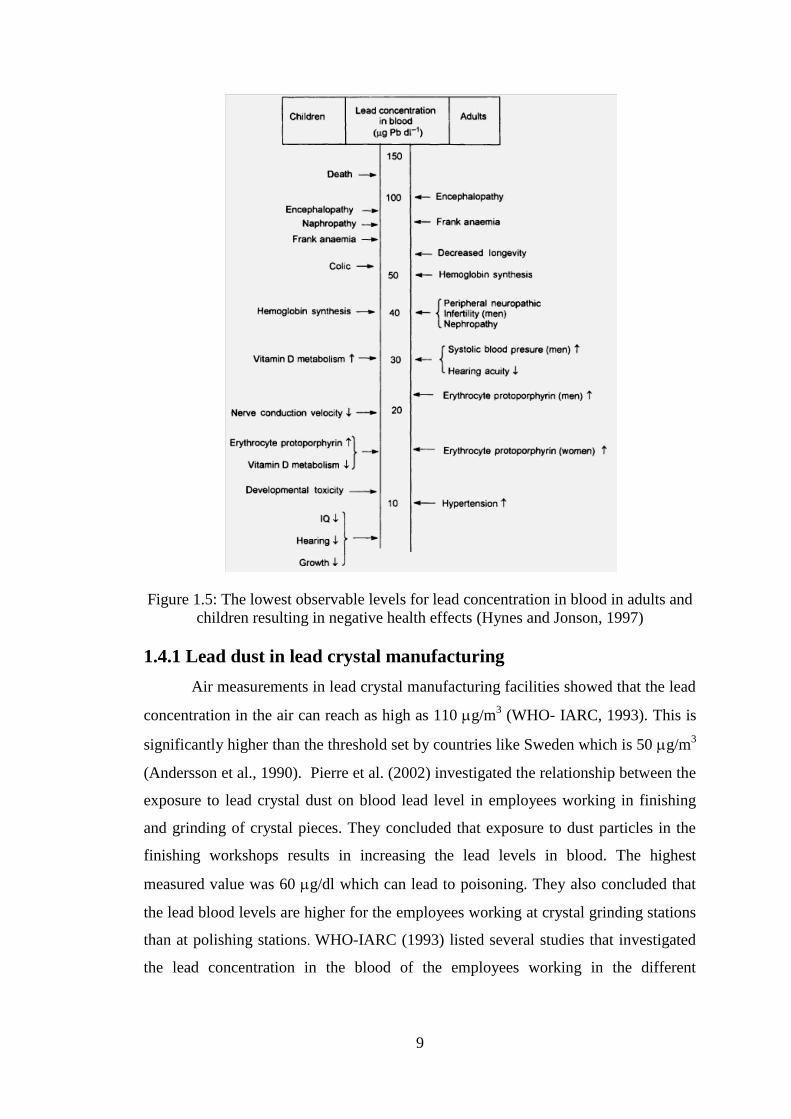
9
Figure 1.5: The lowest observable levels for lead concentration in blood in adults and
children resulting in negative health effects (Hynes and Jonson, 1997)
1.4.1 Lead dust in lead crystal manufacturing
Air measurements in lead crystal manufacturing facilities showed that the lead
concentration in the air can reach as high as 110 g/m3 (WHO- IARC, 1993). This is
significantly higher than the threshold set by countries like Sweden which is 50 g/m3
(Andersson et al., 1990). Pierre et al. (2002) investigated the relationship between the
exposure to lead crystal dust on blood lead level in employees working in finishing
and grinding of crystal pieces. They concluded that exposure to dust particles in the
finishing workshops results in increasing the lead levels in blood. The highest
measured value was 60 g/dl which can lead to poisoning. They also concluded that
the lead blood levels are higher for the employees working at crystal grinding stations
than at polishing stations. WHO-IARC (1993) listed several studies that investigated
the lead concentration in the blood of the employees working in the different

10
segments of the lead crystal manufacturing industry. The studies showed high lead
levels in the blood of the workers.
1.4.2 Lead release from lead crystal to food and beverages
Lead can be released to the food and beverages when stored in lead crystal
glass. Acidic foods and beverages such as pickles and fruit juices have an increased
potential for releasing lead, while less acidic foods and beverages, such as cheese and
milk have less potential (Health Canada, 2003). Also increasing the storage
temperature and/or the storage duration can result in increasing the potential for lead
release (So, 1997). Several studies have investigated the release of lead from lead
crystal glass used to store beverages, especially wine, and they concluded that lead is
released when the lead crystalware get in contact with acidic beverages (Graziano and
Blum, 1991; Jones et al., 1992; Barbee and Constantine, 1994 ; Hight, 1996; So,
1997; Guadagnino et al., 2000). Such release of lead to food and beverages can cause
health risks, however certain coatings can be used to coat the internal surface of the
lead crystalware to reduce the amount of the released lead (Ahmed et al., 1998). The
quantity of the released lead depends on four main factors (Health Canada, 2003; So,
1997):
1. The amount of lead in the glass
2. The type of food or beverage
3. The duration which the lead crystalware is in contact with the food or beverage
4. The storage temperature
Testing the release of lead from lead glass used to store drinks or foods is
usually done in accordance with ISO 7086-1 “Glass hollowware in contact with food-
Release of lead and cadmium- Part 1: Test method” (ISO 7086-1, 2000). The new
version of this standard was released in 2000 and its second part ISO 7086-2 “Glass
hollowware in contact with food- Release of lead and cadmium-Part 2: Permissible
limits” provides guideline values that should not be exceeded as follows (ISO 7086-2,
2000):
1.5 mg/l for small hollowware (<600 ml volume)
0.75 mg/l for large hollowware (> 600 ml volume but less than 3000 ml )
0.5 mg/l for very large hollowware (> 3000 ml volume)
11
It should be noted, however, that the earlier version of ISO 7086-2 released in
1982 provided higher guideline values (5 mg/l for small hollowware and 2.5 for large
hollowware) (ISO 7086-2, 1982), which were significantly higher than the maximum
permissible limits set by many countries like Canada and Australia (0.2 mg/l) (So,
1997).
The aforementioned discussion shows the necessity to produce lead free
crystal glass to eliminate the health hazardous associated with using lead in
manufacturing full crystal glass.
1.5 Lead-Free Crystal Glass
There are two ways that can be adopted to manufacture lead-free crystal glass
with high refractive index. The first way is to use a certain group of oxides, while the
second way is to use barium compounds (Hynes and Jonson, 1997). There are many
patents that used alternative group of oxides to PbO and managed to achieve
refractive index greater than or equal to 1.545 as required by the European
Community Directive on crystal glass 69/493/EEC. A list of some of these patents are
presented in Table 1.6
Table 1.6: List of lead-free crystal patents achieving refractive index
greater or equal to 1.545
Patent Applicant Main oxides Refractive
index
Density
(g/cm3)
EP 0553586 A1 Baccarat ZnO, SrO, CaO 1.545 2.9
GB 2280432 A British
Glass
Bi2O3, TiO2, SrO 1.55 2.7
EP 0797550 A1 Calp ZnO, BaO, Bi2O3, La2O3,
Nb2O5, TiO2 1.545 2.9
EP 0657391 A1 Corning BaO, SrO, ZnO 1.545 2.9
US 7202188 B2 Swarovski ZnO, CaO, Al2O3, B2O3,
TiO2, La2O3 1.55 2.7
EP 0594422 A1 Toyo Glass BaO, ZnO, TiO2 1.55 2.9
EP 0893417 A1 Toyo Glass BaO, CaO, TiO2 1.55 2.9
Source: (Rada, 2009)
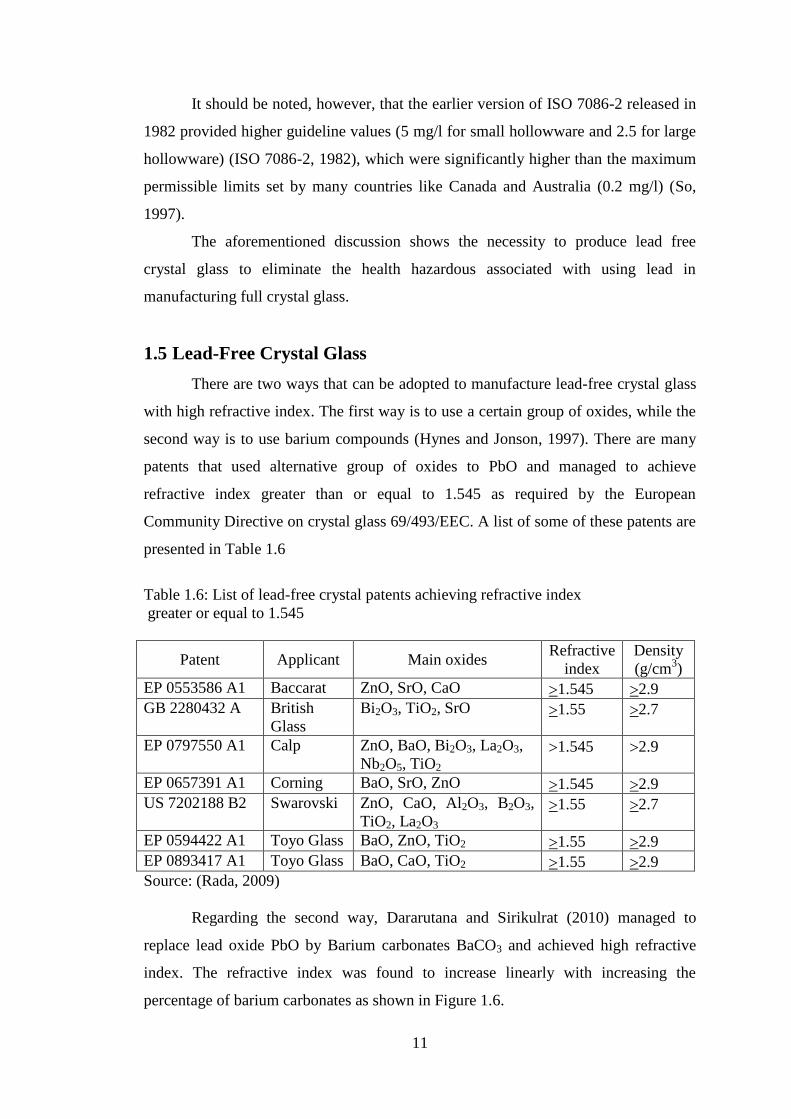
Regarding the second way, Dararutana and Sirikulrat (2010) managed to
replace lead oxide PbO by Barium carbonates BaCO3 and achieved high refractive
index. The refractive index was found to increase linearly with increasing the
percentage of barium carbonates as shown in Figure 1.6.
12
20 25 30 35 40 45
Concentration of Barium carbonate (weight-%)
1.54
1.56
1.58
1.6
1.62
1.64
1.66
Refr
active index o
f gla
ss
Figure 1.6: Relationship between concentration of BaCO3 and
refractive index of glass (Dararutana and Sirikulrat, 2010)
Rada (2009) suggests that the approach of lead-free crystal can be a possible
solution to the problems associated with manufacturing lead crystal such as the
volatilization of lead dust, the disposal of hazardous toxic slurries coming from glass
grinding and polishing as well as the disposal of contaminated refractories from shut-
down furnaces. However, Hynes et. al (2004) indicate that some of the components
used as alternatives for lead oxide might prove to be toxic as well. For example, the
toxicity of soluble barium compounds hinders the widespread of using them as
alternative to lead oxide (Hynes and Jonson, 1997). There is a need to carry out
assessments in order to decide whether lead-free crystals will enhance the workers
and environmental safety in comparison with lead crystals or not (Hynes et. al, 2004).
One more important point regarding switching from lead crystals to lead-free crystals
is the major changes that will be required in processes like cutting, grinding and
polishing. This is because these processes have been already well-established and
optimized for the lead crystals and switching to lead-free crystals that have different
surface properties will require major changes in these processes (Hynes and Jonson,
1997).

13
1.6 Viscosity-Temperature Characteristics of Glass
The viscosity–temperature characteristics of glass are important in glass
manufacturing. Figure 1.7 shows the relationship between viscosity and temperature
for different glass types. Four points are indicated in the figure that correspond to
certain viscosity values (Callister and Rethwisch, 2009; Smith, 1996):
Figure 1.7: The effect of temperature on the viscosity of glass
(Callister and Rethwisch, 2009)
Melting point (at 10 Pa.s): At this point the glass becomes fluid enough to be
considered as a liquid.
Working point (at 103 Pa.s): Glass is easily deformed at this viscosity and this
is the reason why the glass fabrication operations are carried out at this point.
Softening point (4x10⁶ Pa.s): Represents the maximum temperature at which a
glass piece may be handled without resulting in significant dimensional
changes. At this point the glass can flow under its own weight.
14
Annealing point (1012
Pa.s): At this temperature internal stresses can be
removed within 15 minutes. This temperature is 565 oC for borosilicate glass,
552 oC for soda-lime glass and 450
oC for full lead crystal (Cummings, 1997)
Strain point (3x10¹³
Pa.s): The annealing range of glass is the interval between
this point and the annealing point. The strain temperature is 530 oC for
borosilicate glass, 525 oC for soda-lime glass and 420
oC for full lead crystal
(Cummings, 1997). The glass transition temperature is higher than the strain
point below which glass becomes rigid and can easily be fractured.
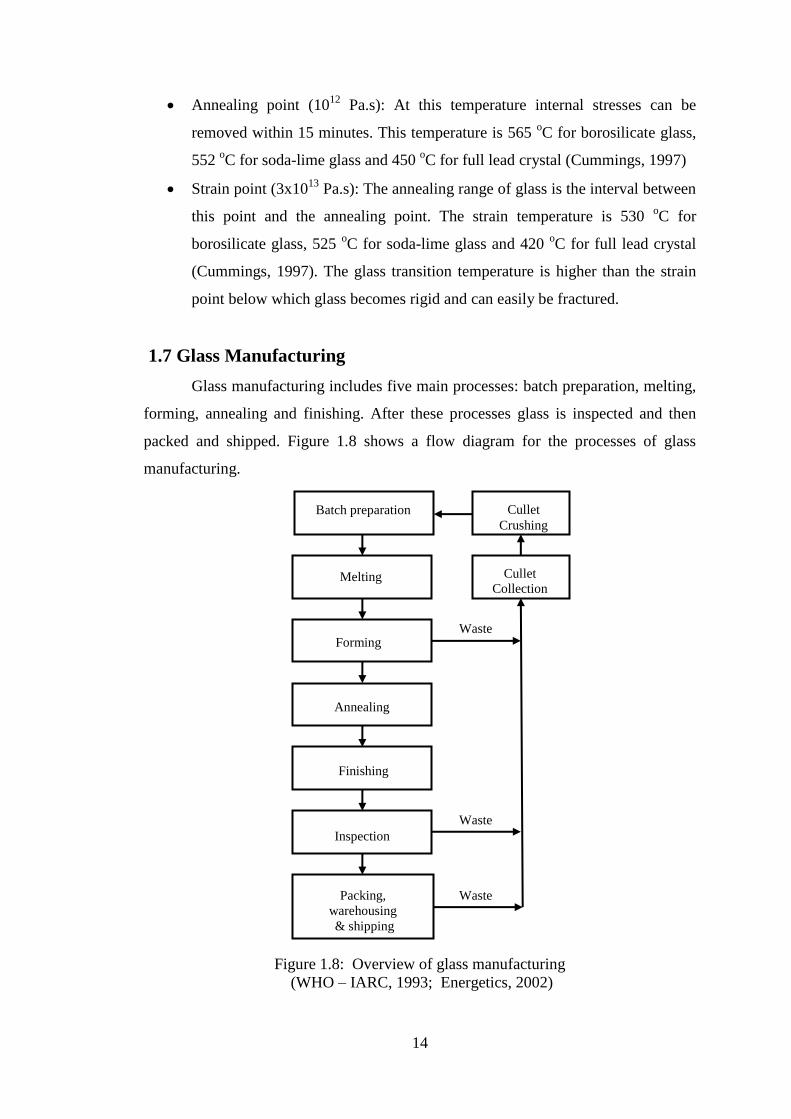
1.7 Glass Manufacturing
Glass manufacturing includes five main processes: batch preparation, melting,
forming, annealing and finishing. After these processes glass is inspected and then
packed and shipped. Figure 1.8 shows a flow diagram for the processes of glass
manufacturing.
Figure 1.8: Overview of glass manufacturing
(WHO – IARC, 1993; Energetics, 2002)
Forming
Melting
Annealing
Finishing
Inspection
Packing,
warehousing
& shipping
Batch preparation Cullet
Crushing
Cullet
Collection
Waste
Waste
Waste
15
1.7.1 Batch preparation
Silica sand is the major constituent of almost all glasses. Other additives such
as soda ash or limestone can be added to achieve certain required properties of the
produced glass. Waste glass or cullet is added to the batch to facilitate the melting
process. Raw materials are crushed, ground, and sieved before being delivered to the
glass plant. Efficient mixing of materials is necessary because inefficient mixing can
result in increasing the melting time and reducing the glass quality. Efficient mixing is
usually assured by mechanical stirring (WHO – IARC, 1993; Energetics, 2002).
1.7.2 Melting
The cold batch is then charged to the melting furnace and melted at 1200-1650
oC. Generally there are two main types of melting furnaces: discontinuous and
continuous furnaces. The discontinuous furnaces are used with small glass production
quantities (less than five tons per day) while continuous furnaces are used with larger
production quantities and are designed to be used continuously over a period of years.
Melting rate depends on the furnace temperature, composition of the batch, particle
size of the batch ingredients, amount of cullet, and homogeneity of the batch. The
smaller the particle size is, the quicker the melting occurs. Imperfections that are
described as cords or stones in the produced glass can happen because of the large
particle size or due to the inefficient mixing of the batch. Such imperfections as well
as any gas bubbles should be eliminated (WHO – IARC, 1993; Energetics, 2002).
1.7.3 Forming
In this process the molten glass coming out of the melting furnace is formed in
order to have its final shape. The forming process should be carried out quickly
because molten glass becomes rigid as it cools. Five forming methods are used
depending on the required shape of the produced glass; pressing, blowing, drawing,
sheet forming and fiber forming. These methods can be summarized as follows
(Callister and Rethwisch, 2009):
Pressing: Glasses with thick-wall such as plates or dishes can be formed by
pressing. Pressure is applied by using cast iron molds coated with graphite.
Different shapes of molds can be used depending on the desired shape of the
produced glass.
16
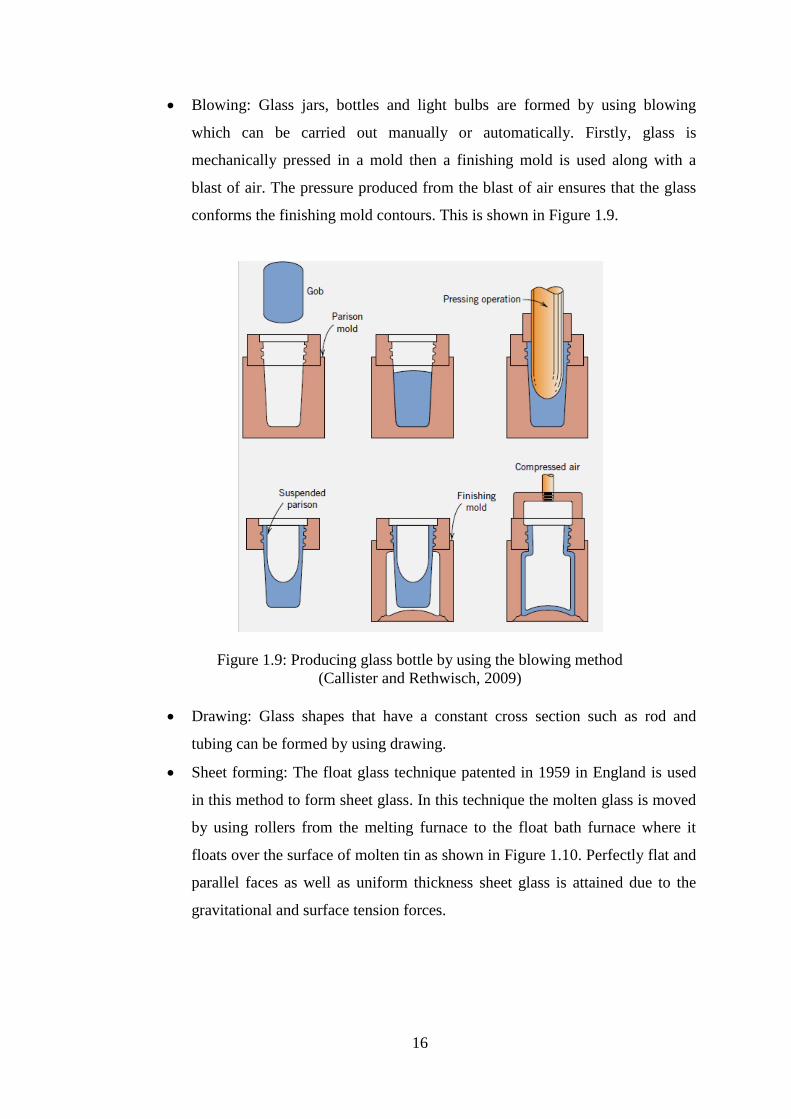
Blowing: Glass jars, bottles and light bulbs are formed by using blowing
which can be carried out manually or automatically. Firstly, glass is
mechanically pressed in a mold then a finishing mold is used along with a
blast of air. The pressure produced from the blast of air ensures that the glass
conforms the finishing mold contours. This is shown in Figure 1.9.
Figure 1.9: Producing glass bottle by using the blowing method
(Callister and Rethwisch, 2009)
Drawing: Glass shapes that have a constant cross section such as rod and
tubing can be formed by using drawing.
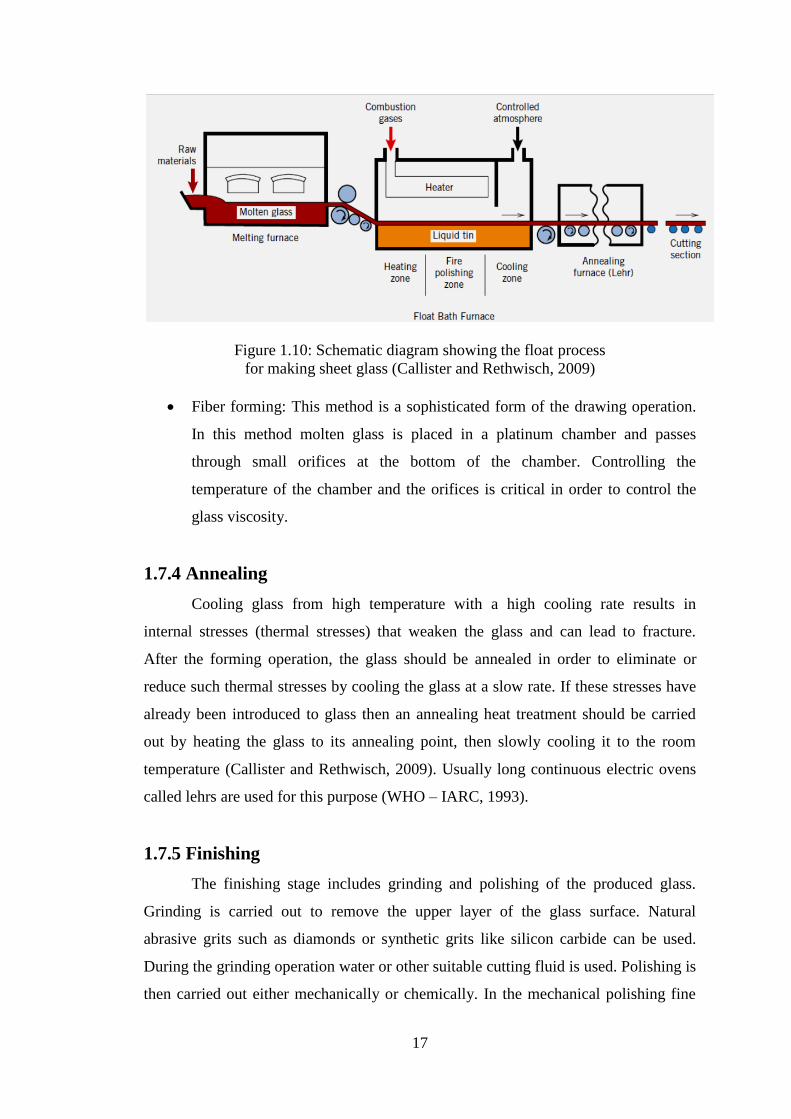
Sheet forming: The float glass technique patented in 1959 in England is used
in this method to form sheet glass. In this technique the molten glass is moved
by using rollers from the melting furnace to the float bath furnace where it
floats over the surface of molten tin as shown in Figure 1.10. Perfectly flat and
parallel faces as well as uniform thickness sheet glass is attained due to the
gravitational and surface tension forces.
17
Figure 1.10: Schematic diagram showing the float process
for making sheet glass (Callister and Rethwisch, 2009)
Fiber forming: This method is a sophisticated form of the drawing operation.
In this method molten glass is placed in a platinum chamber and passes
through small orifices at the bottom of the chamber. Controlling the
temperature of the chamber and the orifices is critical in order to control the
glass viscosity.
1.7.4 Annealing
Cooling glass from high temperature with a high cooling rate results in
internal stresses (thermal stresses) that weaken the glass and can lead to fracture.
After the forming operation, the glass should be annealed in order to eliminate or
reduce such thermal stresses by cooling the glass at a slow rate. If these stresses have
already been introduced to glass then an annealing heat treatment should be carried
out by heating the glass to its annealing point, then slowly cooling it to the room
temperature (Callister and Rethwisch, 2009). Usually long continuous electric ovens
called lehrs are used for this purpose (WHO – IARC, 1993).
1.7.5 Finishing
The finishing stage includes grinding and polishing of the produced glass.
Grinding is carried out to remove the upper layer of the glass surface. Natural
abrasive grits such as diamonds or synthetic grits like silicon carbide can be used.
During the grinding operation water or other suitable cutting fluid is used. Polishing is
then carried out either mechanically or chemically. In the mechanical polishing fine
18
abrasive powders such as ferric oxide and cerium oxide are used and they operate on
the same principle as the abrasives used in the grinding operation. In chemical
polishing the glass is subjected to a mixture of acids such as hydrofluoric and
concentrated sulfuric acids (WHO – IARC, 1993).
1.8 Pollution Associated with Glass Manufacturing
The pollution associated with glass manufacturing can be categorized in three
elements: air emissions, wastewater and solid waste (IFC, 2007). It is worth noticing
that in the case of lead crystal glass manufacturing a substantial amount of lead is
released to the environment during the manufacturing process. Typically at least 15%
of lead escapes during batch preparation and transportation. Another 10-14% of lead
compounds are released during the melting process in the furnaces while additional 2-
3% of lead is discharged to wastewater after the grinding and polishing process
(Pechnikov et al., 1996). This means that around 30% of the lead used in the
production of lead crystal is released to the environment during its manufacturing.
Pechnikov et al. (1996) investigated the lead pollution around a lead crystal
manufacturing plant in Russia that produces 7325 tons/year of crystal having a lead
oxide content of 18%. They found that around 408 tons/year of lead is released to the
environment.
1.8.1 Air emissions
The air emissions in glass industry include sulfur dioxide, nitrogen oxides,
carbon dioxide as well as Particulate Matter PM that may have some metals. The PM
from lead crystal plants may have a lead content of 20–60%. Melting furnaces are
considered the main contributor to air emissions since almost 80-90% of the total
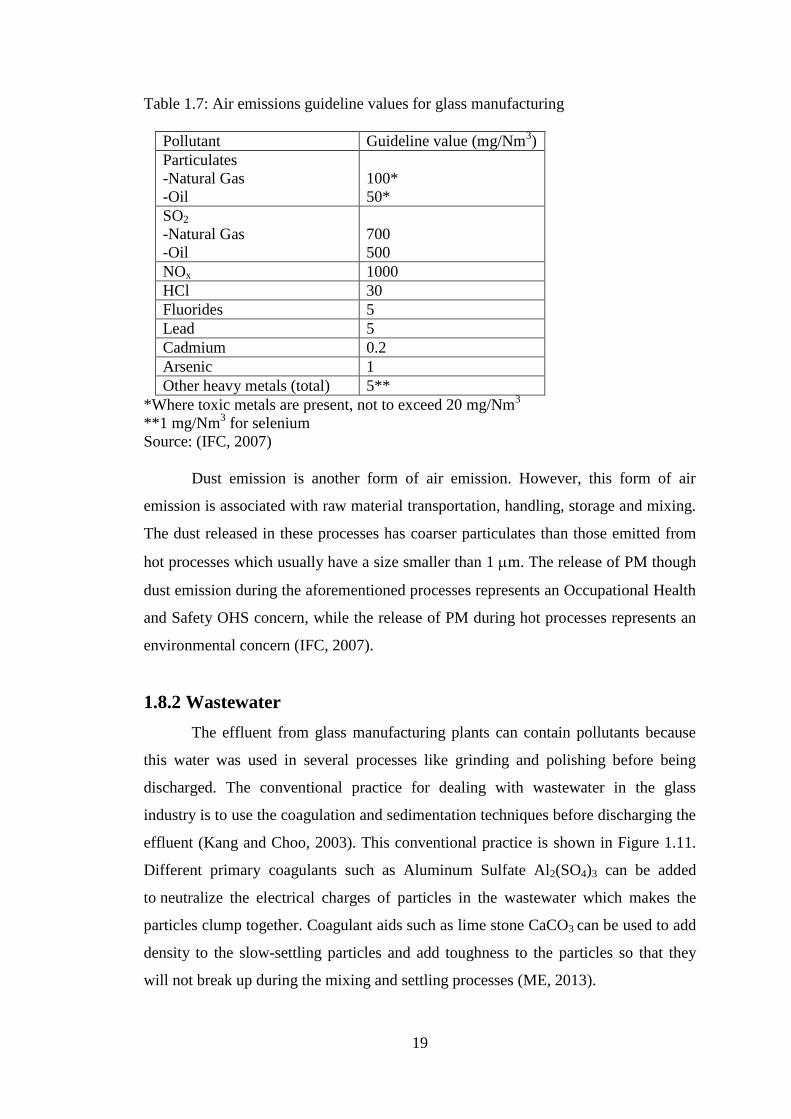
plant air emissions are because of these furnaces (IFC, 2007). Table1.7 shows the
World Bank group guideline values of air emissions in glass industry.
19
Table 1.7: Air emissions guideline values for glass manufacturing
Pollutant Guideline value (mg/Nm3)
Particulates
-Natural Gas
-Oil
100*
50*
SO2
-Natural Gas
-Oil
700
500
NOx 1000
HCl 30
Fluorides 5
Lead 5
Cadmium 0.2
Arsenic 1
Other heavy metals (total) 5**
*Where toxic metals are present, not to exceed 20 mg/Nm3
**1 mg/Nm3 for selenium
Source: (IFC, 2007)
Dust emission is another form of air emission. However, this form of air
emission is associated with raw material transportation, handling, storage and mixing.
The dust released in these processes has coarser particulates than those emitted from
hot processes which usually have a size smaller than 1 m. The release of PM though
dust emission during the aforementioned processes represents an Occupational Health
and Safety OHS concern, while the release of PM during hot processes represents an
environmental concern (IFC, 2007).
1.8.2 Wastewater
The effluent from glass manufacturing plants can contain pollutants because
this water was used in several processes like grinding and polishing before being
discharged. The conventional practice for dealing with wastewater in the glass
industry is to use the coagulation and sedimentation techniques before discharging the
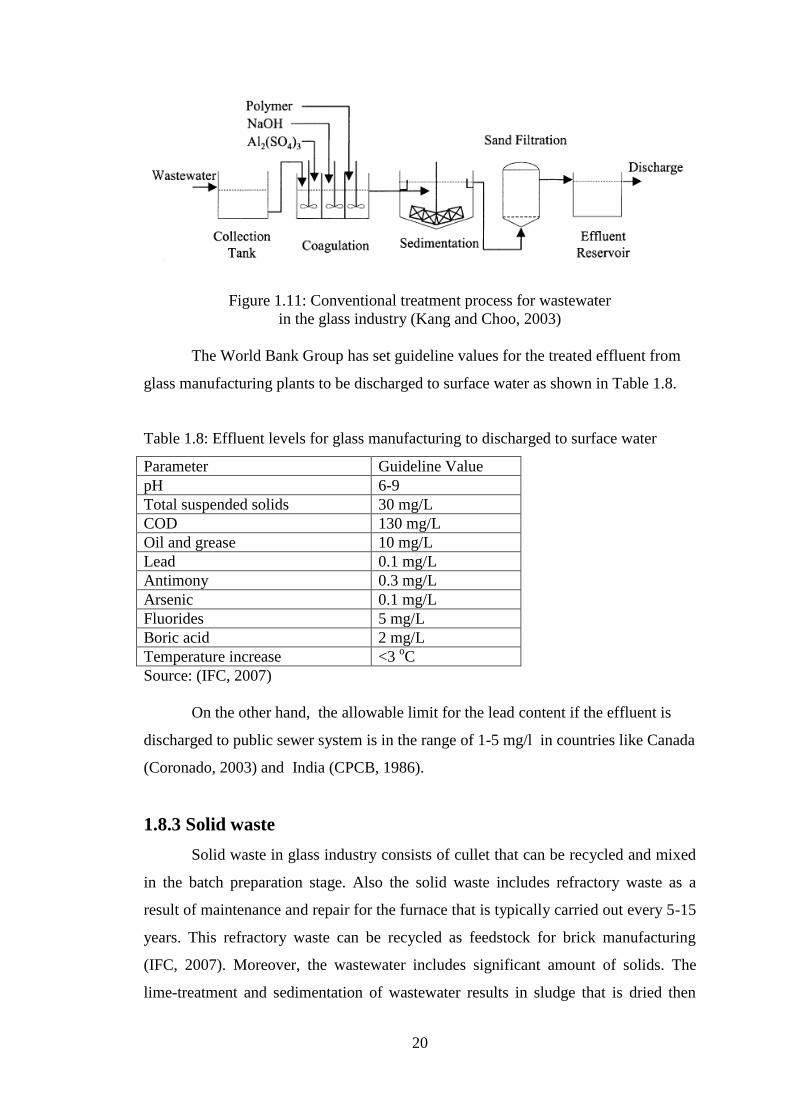
effluent (Kang and Choo, 2003). This conventional practice is shown in Figure 1.11.
Different primary coagulants such as Aluminum Sulfate Al2(SO4)3 can be added
to neutralize the electrical charges of particles in the wastewater which makes the
particles clump together. Coagulant aids such as lime stone CaCO3 can be used to add
density to the slow-settling particles and add toughness to the particles so that they
will not break up during the mixing and settling processes (ME, 2013).
20
Figure 1.11: Conventional treatment process for wastewater
in the glass industry (Kang and Choo, 2003)
The World Bank Group has set guideline values for the treated effluent from
glass manufacturing plants to be discharged to surface water as shown in Table 1.8.
Table 1.8: Effluent levels for glass manufacturing to discharged to surface water
Parameter Guideline Value
pH 6-9
Total suspended solids 30 mg/L
COD 130 mg/L
Oil and grease 10 mg/L
Lead 0.1 mg/L
Antimony 0.3 mg/L
Arsenic 0.1 mg/L
Fluorides 5 mg/L
Boric acid 2 mg/L
Temperature increase <3 oC
Source: (IFC, 2007)
On the other hand, the allowable limit for the lead content if the effluent is
discharged to public sewer system is in the range of 1-5 mg/l in countries like Canada
(Coronado, 2003) and India (CPCB, 1986).
1.8.3 Solid waste
Solid waste in glass industry consists of cullet that can be recycled and mixed
in the batch preparation stage. Also the solid waste includes refractory waste as a
result of maintenance and repair for the furnace that is typically carried out every 5-15
years. This refractory waste can be recycled as feedstock for brick manufacturing
(IFC, 2007). Moreover, the wastewater includes significant amount of solids. The
lime-treatment and sedimentation of wastewater results in sludge that is dried then
21
sent to landfills. If the sludge contains heavy metals such as Pb then there are
concerns that these heavy metals can leach and be released to groundwater causing
serious environmental problems. It is necessary to carry out leaching test for any lead
glass or any glass containing heavy metals to determine if it’s safe to landfill it in the
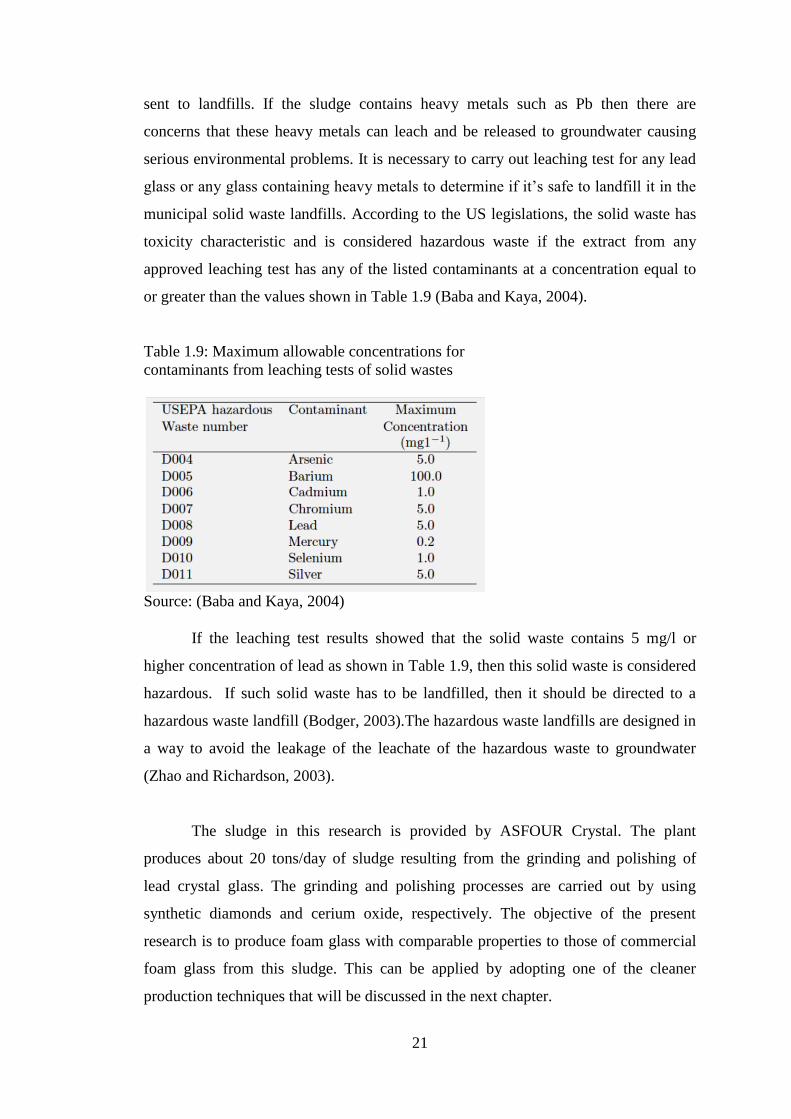
municipal solid waste landfills. According to the US legislations, the solid waste has
toxicity characteristic and is considered hazardous waste if the extract from any
approved leaching test has any of the listed contaminants at a concentration equal to
or greater than the values shown in Table 1.9 (Baba and Kaya, 2004).
Table 1.9: Maximum allowable concentrations for
contaminants from leaching tests of solid wastes
Source: (Baba and Kaya, 2004)
If the leaching test results showed that the solid waste contains 5 mg/l or
higher concentration of lead as shown in Table 1.9, then this solid waste is considered
hazardous. If such solid waste has to be landfilled, then it should be directed to a
hazardous waste landfill (Bodger, 2003).The hazardous waste landfills are designed in
a way to avoid the leakage of the leachate of the hazardous waste to groundwater
(Zhao and Richardson, 2003).
The sludge in this research is provided by ASFOUR Crystal. The plant
produces about 20 tons/day of sludge resulting from the grinding and polishing of
lead crystal glass. The grinding and polishing processes are carried out by using
synthetic diamonds and cerium oxide, respectively. The objective of the present
research is to produce foam glass with comparable properties to those of commercial
foam glass from this sludge. This can be applied by adopting one of the cleaner
production techniques that will be discussed in the next chapter.

22
CHAPTER 2
LITERATURE REVIEW
2.1 Cleaner Production Techniques in Lead Crystal Glass
Applying Life Cycle Assessment LCA for crystal glass can be beneficial. LCA
is a methodology for assessing the environmental impacts related to any product. It
evaluates these impacts for the entire life cycle of products starting from collecting
raw materials, until all residuals are returned to the earth for “disposal” based on the
cradle-to-grave life cycle (El-Haggar, 2007). Applying LCA in any industry helps to
identify the critical aspects from an energetic and environmental point of view. The
first documented LCA for crystal glass was carried out by Pulselli et al. (2009). The
LCA showed that the manufacturing stage is the one with the highest environmental
impacts and that it accounts for about 89% of the energy consumption and 93% of the
material use.
Adopting the cleaner production techniques in the manufacturing stage can
minimize the environmental impacts associated with production of lead crystal.
Cleaner production can be defined as “the continuous application of an integrated
preventive environmental strategy to processes, products and services to increase
overall efficiency and to reduce risks to humans and the environment” (UNEP, 2002).
Cleaner production techniques can be broadly classified to three techniques: pollution
reduction, product modification and recycling (El-Haggar, 2007). The recycling
technique means using materials in closed loop system (cradle-to-cradle) instead of
the linear open system (cradle-to-grave) to save resources and mitigate negative
environmental impacts. This can be attained by adopting either open or closed-
recycling systems. In closed-recycling systems products waste is used to further re-
manufacture the same products, while in open-recycling systems the waste is used to
manufacture other products (Heart, 2008). On-site recycling and off-site recycling is
another classification for the recycling systems. In on-site recycling the waste
materials are returned within the same factory as an input material to the original
process or another process. In off-site recycling the recycling process is carried out
outside the factory usually by another party to produce other products (El-Haggar,
2007). Adopting any of these recycling systems in the manufacturing of lead crystal
23
can mitigate the negative environmental impacts due to air emissions, wastewater and
solid waste and achieve many economical benefits.
2.1.1 Air emissions
Recycling techniques can be adopted with regard to air emissions. There are
already some practical applications that have been successfully carried out to produce
useful products from harmful emissions. A good example is the industrial symbiosis
of Kalundborg in Denmark where sulfur emissions are used to manufacture liquid
fertilizers and synthetic gypsum (El-Haggar, 2007). Another example is the
innovative proprietary technology developed by the California based company
“Calera” to manufacture useful products such as Calcium Carbonate cement out of the
CO2 emissions (Calera, 2013). With regard to the specific industry of lead crystal, the
filter dust of the flue gases can be recycled. When sulfur-containing oil is used in the
lead crystal furnaces, lead sulfate is released as one of the main air emissions
components. This lead sulfate can be chemically treated to remove the sulfate content
and obtain lead carbonate that can be used to partially replace the lead oxide used in
the manufacturing of lead crystal (Porcham, 1995).
Several pollution reduction techniques can also be used to reduce air
emissions in the manufacturing of glass in general. Such techniques include using
low NOx burners or selective catalytic reduction (SCR), choosing fuels with low
sulfur and carbon content especially natural gas, and installing waste heat recovery
units from furnace flue gases (IFC, 2007). Moreover, using cyclones or cloth bag
filters can be used to remove the particulate matter from the flue gas emissions
(Pechnikov et al., 1996).
Several specific techniques exist in the area of lead crystal manufacturing to
avoid lead loss that happens due to air emissions during batch preparation and
transportation to the melting furnaces. These techniques include compaction of batch
material and using enclosed automatic conveyor to transport the batch material
directly to the furnace (Pechnikov et al., 1996). In addition, enclosed silos can be used
to store the batch material. Furthermore, the amount of fine particles can be reduced
by humidifying the batch with water or with alkali solution such as sodium hydroxide
NaOH or sodium carbonate Na2CO3 (IFC, 2007).

24
2.1.2 Wastewater
Several researches have been carried out to investigate the practicality of
recycling the wastewater in the glass industry to reuse it in the manufacturing process.
Kang and Choo (2003) investigated the use of a hybrid system of Microfiltration
(MF) and Ultrafiltration (UF) membrane to reclaim the glass industry wastewater as
shown in Figure 2.1.
Figure 2.1: Proposed membrane system to recycle the wastewater
in glass industry (Kang and Choo, 2003)
Lee et al. (1997) managed to recycle the wastewater of a lead crystal
manufacturing plant in Korea by replacing the conventional treatment system shown
in Figure 2.2 with a new cleaner production technique that uses microfiltration /
nanofilteration hybrid system as shown in Figure 2.3. This system resulted in zero
discharge of wastewater. It’s worth noting, however, that although this cleaner
production technique managed to recycle all the wastewater, it resulted in sludge that
is directed to landfills without any recycling.
Figure 2.2: Typical manufacturing process and conventional wastewater
treatment system in crystal glass industry (Lee et al., 1997)

25
Figure 2.3: Cleaner production zero-discharge wastewater
system in crystal glass industry (Lee et al., 1997)
This cleaner production system had an investment of $137000 for 10 m3/day
of generated wastewater with a payback period of less than two years as shown in
Table 2.1. This system ensured not to violate the strict effluent standards in Korea that
has a limit of 3 ppm of fluoride and 0.2 ppm of lead. Such strict limits were very
difficult to comply with by using the conventional system (Lee et al., 1997).
Table 2.1: Economic analysis of the cleaner production process (US$)
Conventional
process
Cleaner
production process
Investment 137000
Operating cost per year
Raw materials
Energy
Miscellaneous expenditure
Membrane exchange
Pollution penalties
16000
1300
128000
0
5000
15200
5000
48600
4900
0
Total operating cost 150300 73700
Payback Period 1.8 years
Source: (Lee et al., 1997)
26
2.1.3 Solid waste
Several cleaner production techniques exist that can utilize or recycle the
sludge that results from lime-treatment and sedimentation of wastewater instead to
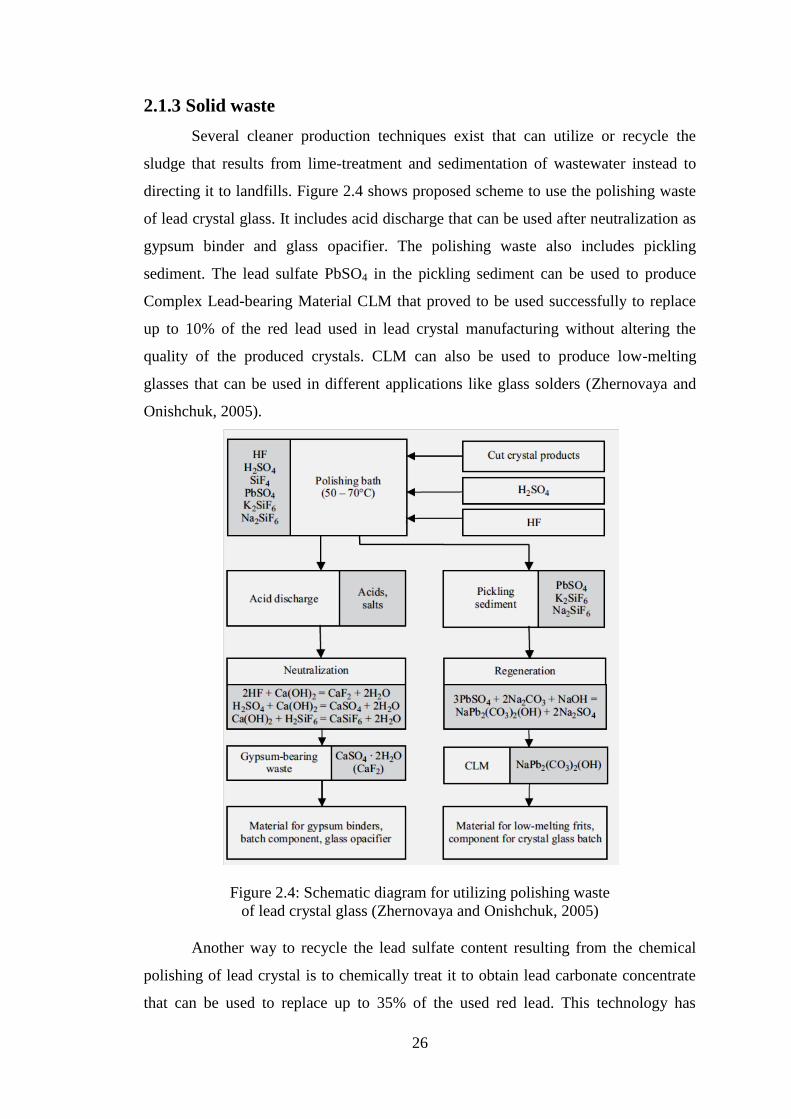
directing it to landfills. Figure 2.4 shows proposed scheme to use the polishing waste
of lead crystal glass. It includes acid discharge that can be used after neutralization as
gypsum binder and glass opacifier. The polishing waste also includes pickling
sediment. The lead sulfate PbSO4 in the pickling sediment can be used to produce
Complex Lead-bearing Material CLM that proved to be used successfully to replace
up to 10% of the red lead used in lead crystal manufacturing without altering the
quality of the produced crystals. CLM can also be used to produce low-melting
glasses that can be used in different applications like glass solders (Zhernovaya and
Onishchuk, 2005).
Figure 2.4: Schematic diagram for utilizing polishing waste
of lead crystal glass (Zhernovaya and Onishchuk, 2005)
Another way to recycle the lead sulfate content resulting from the chemical
polishing of lead crystal is to chemically treat it to obtain lead carbonate concentrate
that can be used to replace up to 35% of the used red lead. This technology has
27
already been adopted many years ago by Swarovski which is one of the world leading
crystal glass manufacturers. Over 18 years the company managed to process 3500
tons of polishing sludge to produce 1400 tons of lead carbonate concentrate that saved
900 tons of the red lead used in the manufacturing of lead crystal. This technology has
already been licensed to other companies in Europe and Asia (Porcham, 1995).
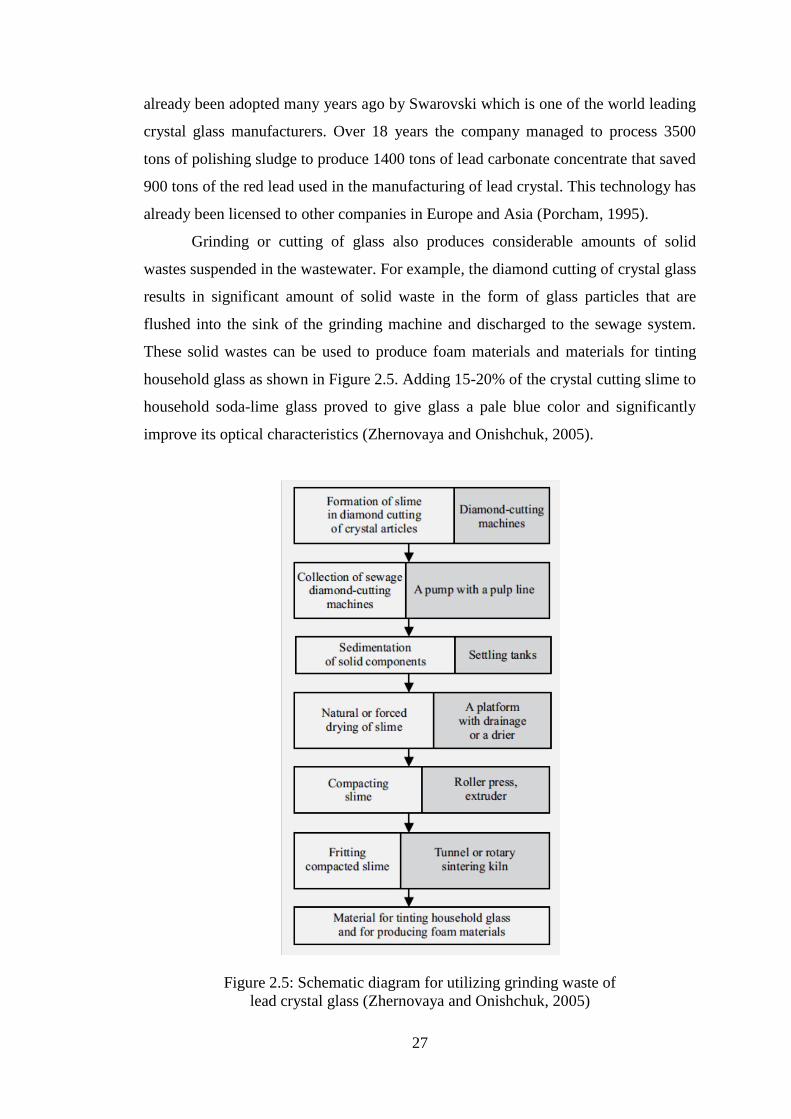
Grinding or cutting of glass also produces considerable amounts of solid
wastes suspended in the wastewater. For example, the diamond cutting of crystal glass
results in significant amount of solid waste in the form of glass particles that are
flushed into the sink of the grinding machine and discharged to the sewage system.
These solid wastes can be used to produce foam materials and materials for tinting
household glass as shown in Figure 2.5. Adding 15-20% of the crystal cutting slime to
household soda-lime glass proved to give glass a pale blue color and significantly
improve its optical characteristics (Zhernovaya and Onishchuk, 2005).
Figure 2.5: Schematic diagram for utilizing grinding waste of
lead crystal glass (Zhernovaya and Onishchuk, 2005)
28
2.2 Utilization of Grinding and Polishing
Sludge to Produce Foam Glass
Solid waste in the form of the sludge resulting from the grinding and polishing
processes of lead crystal can be used to manufacture foam glass. This is considered as
an open-recycling technique that has many advantages in comparison with landfilling.
Utilization of waste materials in closed loops either through closed-recycling or open-
recycling is a far better practice than landfilling. This is true from an environmental
and economical point of view. From an environmental point of view waste utilization
saves resources and eliminates potential risks that can be associated with improper
waste disposal. From economical point of view, it provides free raw material to
produce products. It also eliminates the costs associated with waste landfilling
especially if the waste leaching results were above the regulatory limits, which means
it has to be directed to a special landfill as explained in Chapter 1. Moreover, waste
utilization ensures that manufacturers will avoid any penalties with regard to improper
waste disposal (El Kersh and El-Haggar, 2012).
To the best of the author knowledge there is no literature available about the
characteristics of the foam glass that can be produced from the grinding and polishing
sludge of lead crystal. The chemical composition of lead crystal is similar to the
funnel and neck glass used in CRT as described in Chapter 1. Thus, the literature
about the foam glass produced from the funnel and neck glass of CRT glass will be
presented. Also the literature about the foam glass produced from CRT panel glass
which has barium-strontium silicate instead of lead silicate will be included. This is
because both barium and lead are toxic metals that can be used to produce crystal
glass with high refractive index as previously discussed. Literature about foam glass
produced from other waste glass like soda-lime glass will also be considered when
necessary for comparison and illustration purposes.
2.3 Foam Glass
Foam glass from waste glass is usually produced by using gas-generating
agents that are called foaming agents. These foaming agents usually include carbon
and are dry mixed with the glass powder then heated to a temperature at which gas
evolves from these foaming agents. The evolved gas results in forming small
29
spherical bubbles that expand under the increasing gas pressure to form pores in the
produced foam glass (Scarinci et al., 2006).
2.3.1 Foaming agents
Literature shows that two foaming agent groups are used to produce foam
glass from waste glass: neutralization and redox agents (Spiridonov and Orlova, 2003)
The neutralization agents release the gas that causes the foaming effect by
thermal decomposition. This includes Calcium Carbonates CaCO3 that thermally
decomposes by heating resulting in the release of CO2 (Spiridonov and Orlova, 2003;
Scarinci et al., 2006) as shown in the following equation (Bernardo et al., 2005):
CaCO3 CaO + CO2
This type of foaming agents has intense gas release during the decomposition
which results in breaking the walls of the individual pores leading to create maze-like
cavities. The produced foam glass by using this type of foaming agents has high water
absorption and is usually used in the soundproof applications (Spiridonov and Orlova,
2003). Several studies have been carried out to produce foam glass from CRT glass
by using CaCO3 (Brusatin et al., 2004; Bernardo et al., 2005; Bernardo and Albertini,
2006; Fernandes et al., 2013).
On the other hand, the foaming process happens in the redox agents like
Silicon Carbide SiC and Titanium nitride TiN through chemical reactions (Scarinci et
al., 2006). This type of foaming agents is usually used to produce foams with
prevailing closed pores that are used in the thermal insulation applications. Gases are
released because of the oxidation reaction of the foaming agent (Spiridonov and
Orlova, 2003). Several studies have been carried out to produce foam glass from CRT
glass by using redox agents (Méar et al., 2005a; Méar et al., 2005b; Méar et al.,
2006b; Méar et al., 2006c; Méar et al., 2007; Yot and Méar, 2009; Guo et al., 2010a;
Guo et al., 2010b; Chen et al., 2011). When using SiC with glass that contains lead,
CO2 is released as shown in the following equation (Yot and Méar, 2009):
2PbO(s) + SiC (s) + O2(g) 2Pb(s) + SiO2(s) + CO2(g)
And when using TiN, N2 is released as shown in the following equation (Yot and
Méar, 2009):
2PbO(s) + 2TiN(s) + O2(g) 2Pb(s) + 2TiO2(s) + N2(g)
30
On the other hand, Brusatin et al. (2004) stated that redox agents are not
preferable to be used as foaming agents of lead silicate glass because they may
interact with large amounts of the dissolved oxygen in the lead silicate or with PbO
resulting in lacking of the oxidative conditions. Regarding the lack of oxidative
condition Bernardo et al. (2010) stated that the oxygen present in the glass while
softening may be insufficient to complete the oxidation reaction of redox agents, so
they added Manganese Dioxide MnO2 as “oxidation promoter” to provide extra
oxygen. MnO2 can decompose into Mn2O3, Mn3O4 or MnO along with oxygen. For
the largest release of oxygen, MnO2 will decompose to MnO and oxygen as shown in
the following equation:
2MnO2→ 2MnO+ O2
When using SiC as foaming agent MnO2 can participate in the oxidation
reaction to release CO2 as follows (Bernardo et al., 2010):
SiC + 4MnO2 → SiO2+ CO2+ 4MnO
Because MnO2 is not the only source of oxygen that takes part in the oxidation
reaction of SiC, then the amount of MnO2 needed can be significantly lower than the
predicted amount as per the aforementioned reaction. Bernardo et al. (2007a) used
MnO2/SiC ratios of 1:5 and 1:3, and Bernardo et al. (2010) used a ratio of 1:3. It
should be noted, however, that the research carried out to investigate the combination
of MnO2 and SiC as foaming agent was in the area of foam glass production from
waste soda-lime glass. The adoption of this combination was not investigated to
produce foam glass from CRT glass. However, Méar et al. (2006c) used a
combination of SiC and Magnesium Oxide MgO at MgO/SiC ratio of 0.6 as a
foaming agent to produce foam glass from CRT funnel and panel glass.
Using redox agents results in the formation of metal lead. This has been
confirmed in various studies while using redox agents such as SiC and TiN (Yot and
Méar, 2009; Méar et al., 2005a; Méar et al., 2005b). Guo et al. (2010a) stated that the
precipitation and distribution of Pb micro-crystals reinforces the glass foam and
provides higher mechanical strength.
2.3.2 Foam Glass Properties
The most important properties of the produced foam glass are: density,
thermal conductivity and mechanical strength. Figure 2.6 shows the range of
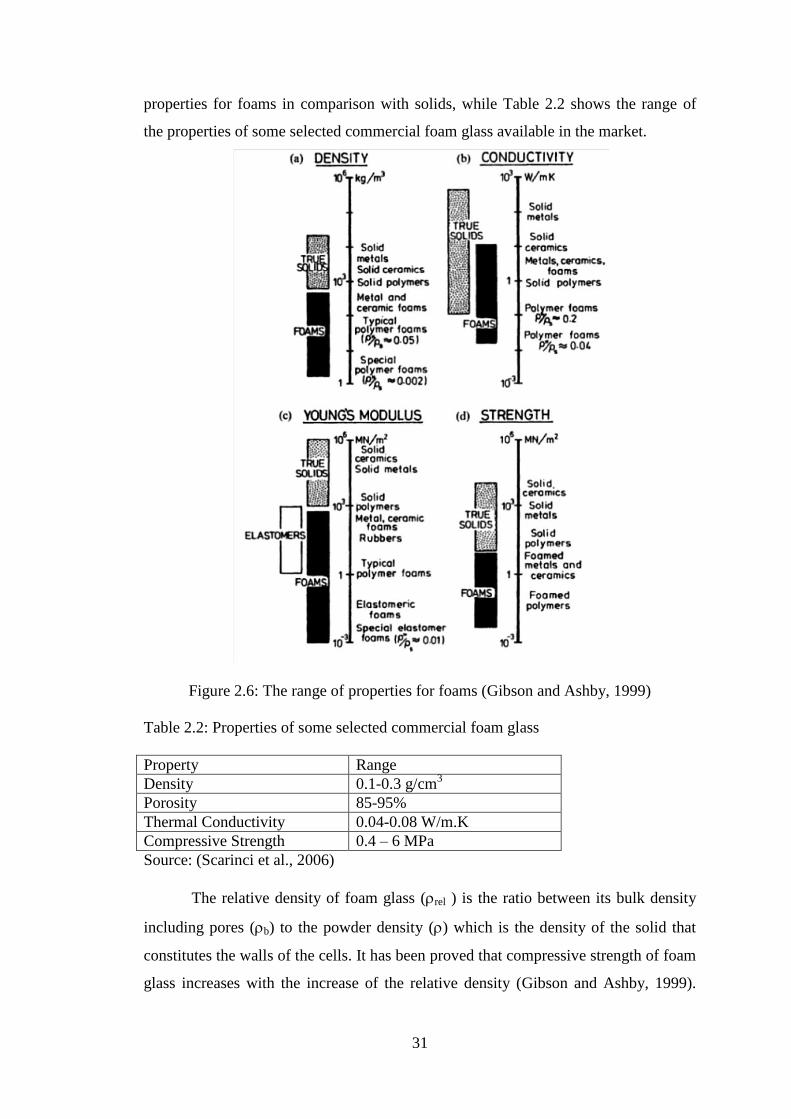
31
properties for foams in comparison with solids, while Table 2.2 shows the range of
the properties of some selected commercial foam glass available in the market.
Figure 2.6: The range of properties for foams (Gibson and Ashby, 1999)
Table 2.2: Properties of some selected commercial foam glass
Property Range
Density 0.1-0.3 g/cm3
Porosity 85-95%
Thermal Conductivity 0.04-0.08 W/m.K
Compressive Strength 0.4 – 6 MPa
Source: (Scarinci et al., 2006)
The relative density of foam glass (rel ) is the ratio between its bulk density
including pores (b) to the powder density () which is the density of the solid that
constitutes the walls of the cells. It has been proved that compressive strength of foam
glass increases with the increase of the relative density (Gibson and Ashby, 1999).

32
Also Brusatin et al. (2004) confirmed that the compressive strength of all foams
usually increases with the increase of the foam bulk density.
In certain cases, however, the known trend of increasing the compressive
strength with increasing the foam density is inversed. This can be attributed to the
thickness of the struts of the cells. Sometimes more dense foams have larger cells
with thicker struts. These thicker struts have larger voids that decrease the struts
resistance and thus decrease the compressive strength of the foam as shown in Figure
2.7 (Brusatin et al., 2004). This usually happens due to the coalescence phenomenon
in which the cellular structure is coarsened due to dissolving of smaller pores with
larger ones (Bernardo et al., 2007a).
Figure 2.7: Variation of compressive strength and density of
glass foams with the strut thickness of cells (Brusatin et al., 2004)
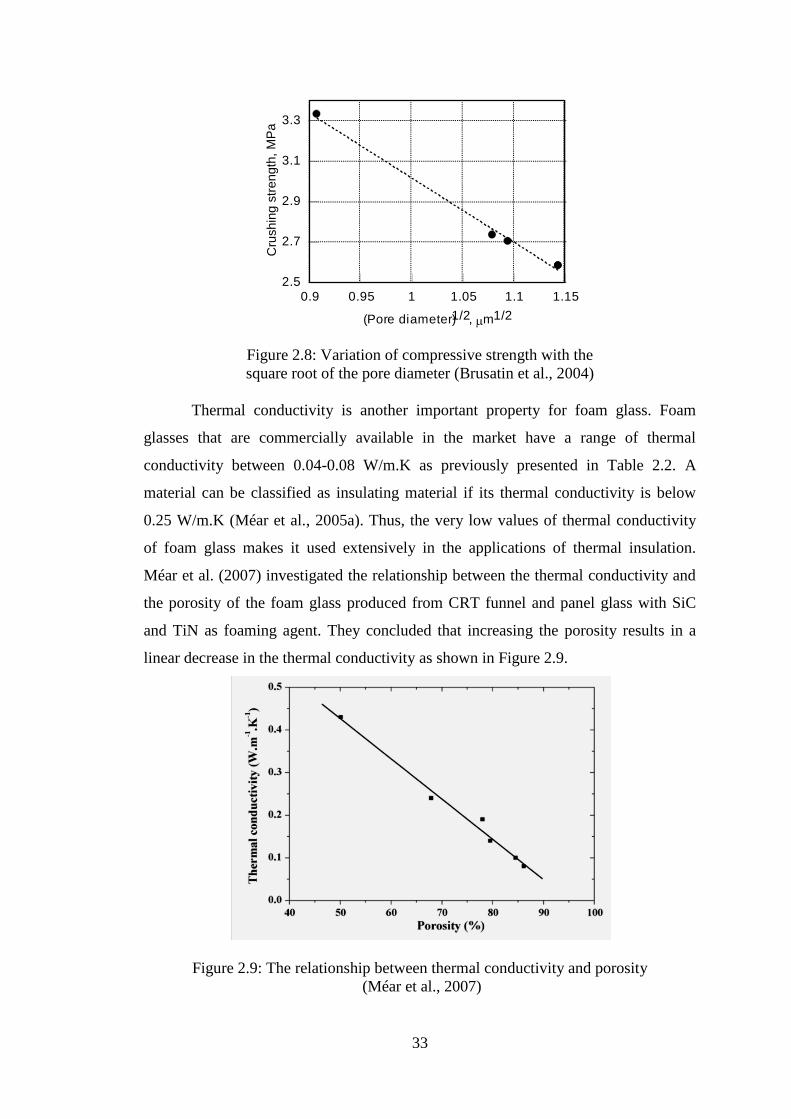
The compressive strength of foam glass was found to be inversely
proportional with square root of the cell size (Morgan et al., 1981). Figure 2.8 shows
the plotting of the compressive strength of foam glass produced from soda-lime glass
with Silicon Carbide SiC as foaming agent versus the square root of the pore size.
33
0.9 0.95 1 1.05 1.1 1.15
(Pore diameter) 1/2, m1/2
2.5
2.7
2.9
3.1
3.3
Cru
sh
ing
str
eng
th,
MP
a
Figure 2.8: Variation of compressive strength with the
square root of the pore diameter (Brusatin et al., 2004)
Thermal conductivity is another important property for foam glass. Foam
glasses that are commercially available in the market have a range of thermal
conductivity between 0.04-0.08 W/m.K as previously presented in Table 2.2. A
material can be classified as insulating material if its thermal conductivity is below
0.25 W/m.K (Méar et al., 2005a). Thus, the very low values of thermal conductivity
of foam glass makes it used extensively in the applications of thermal insulation.
Méar et al. (2007) investigated the relationship between the thermal conductivity and
the porosity of the foam glass produced from CRT funnel and panel glass with SiC
and TiN as foaming agent. They concluded that increasing the porosity results in a
linear decrease in the thermal conductivity as shown in Figure 2.9.
Figure 2.9: The relationship between thermal conductivity and porosity
(Méar et al., 2007)

34
Abdel Alim (2009) also found that there is an inverse relationship between the
thermal conductivity and the porosity of the foam glass produced from soda-lime
glass with sodium silicate as foaming agent. The lowest thermal conductivity of 0.053
W/m.K was achieved at 91% porosity, while the highest thermal conductivity of
0.092 W/m.K was achieved at 76% porosity. The percentage of porosity is simply
calculated by using the following equation (Méar et al., 2007):
% Porosity= (1- rel) x 100 (2.1)
where rel is the relative density=b/
The equation shows that porosity percentage is inversely proportional to the
relative density. Thus, it can be concluded that increasing the relative density of foam
glass results to increase its thermal conductivity.
2.3.3 Compressive stress model for open and closed cells
Gibson and Ashby (1999) proposed a model for the compressive stress of
foam materials. In their model the cells can be either open or closed cells. Figure 2.10
shows the cubic cell model for open and closed cells.
(a) Open-cell foam (b) Closed-cell foam
Figure 2.10: Cubic cell model for open and closed cells (Gibson and Ashby, 1999)
The crushing /compressive strength of brittle foams in this model is expressed
as follows:
(2.2)
where cr is the crushing/ compressive strength of foam, bs is the bending strength of
the utilized glass and rel is relative density of the foam. In a closed-cell foam, is the
fraction of the solid contained in the cell edges and the remaining fraction (1-) is in
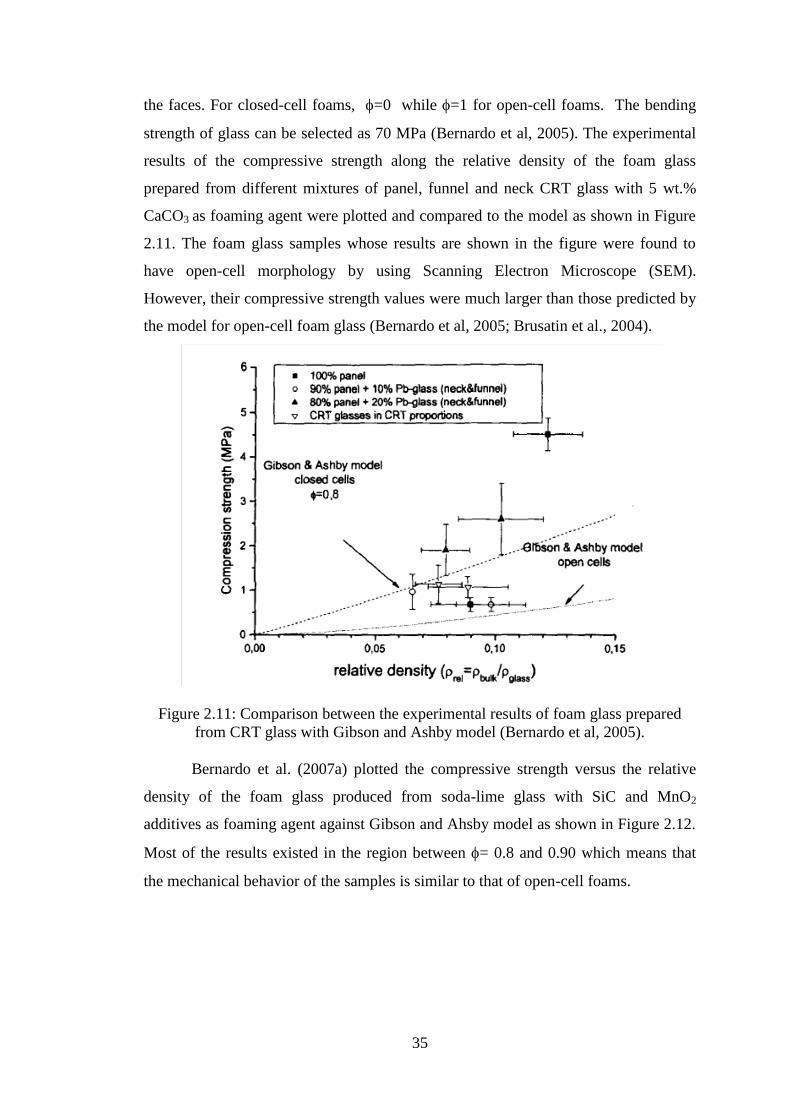
35
the faces. For closed-cell foams, =0 while =1 for open-cell foams. The bending
strength of glass can be selected as 70 MPa (Bernardo et al, 2005). The experimental
results of the compressive strength along the relative density of the foam glass
prepared from different mixtures of panel, funnel and neck CRT glass with 5 wt.%
CaCO3 as foaming agent were plotted and compared to the model as shown in Figure
2.11. The foam glass samples whose results are shown in the figure were found to
have open-cell morphology by using Scanning Electron Microscope (SEM).
However, their compressive strength values were much larger than those predicted by
the model for open-cell foam glass (Bernardo et al, 2005; Brusatin et al., 2004).
Figure 2.11: Comparison between the experimental results of foam glass prepared
from CRT glass with Gibson and Ashby model (Bernardo et al, 2005).
Bernardo et al. (2007a) plotted the compressive strength versus the relative
density of the foam glass produced from soda-lime glass with SiC and MnO2
additives as foaming agent against Gibson and Ahsby model as shown in Figure 2.12.
Most of the results existed in the region between = 0.8 and 0.90 which means that
the mechanical behavior of the samples is similar to that of open-cell foams.
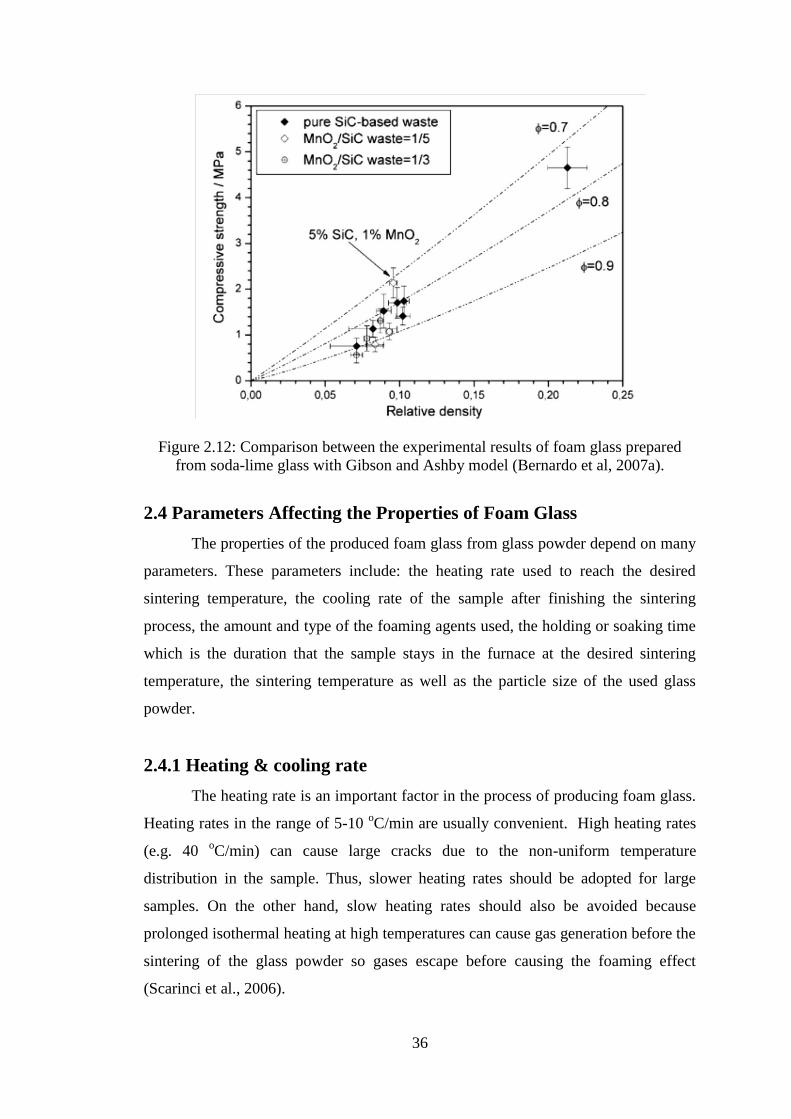
36
Figure 2.12: Comparison between the experimental results of foam glass prepared
from soda-lime glass with Gibson and Ashby model (Bernardo et al, 2007a).
2.4 Parameters Affecting the Properties of Foam Glass
The properties of the produced foam glass from glass powder depend on many
parameters. These parameters include: the heating rate used to reach the desired
sintering temperature, the cooling rate of the sample after finishing the sintering
process, the amount and type of the foaming agents used, the holding or soaking time
which is the duration that the sample stays in the furnace at the desired sintering
temperature, the sintering temperature as well as the particle size of the used glass
powder.
2.4.1 Heating & cooling rate
The heating rate is an important factor in the process of producing foam glass.
Heating rates in the range of 5-10 oC/min are usually convenient. High heating rates
(e.g. 40 oC/min) can cause large cracks due to the non-uniform temperature
distribution in the sample. Thus, slower heating rates should be adopted for large
samples. On the other hand, slow heating rates should also be avoided because
prolonged isothermal heating at high temperatures can cause gas generation before the
sintering of the glass powder so gases escape before causing the foaming effect
(Scarinci et al., 2006).
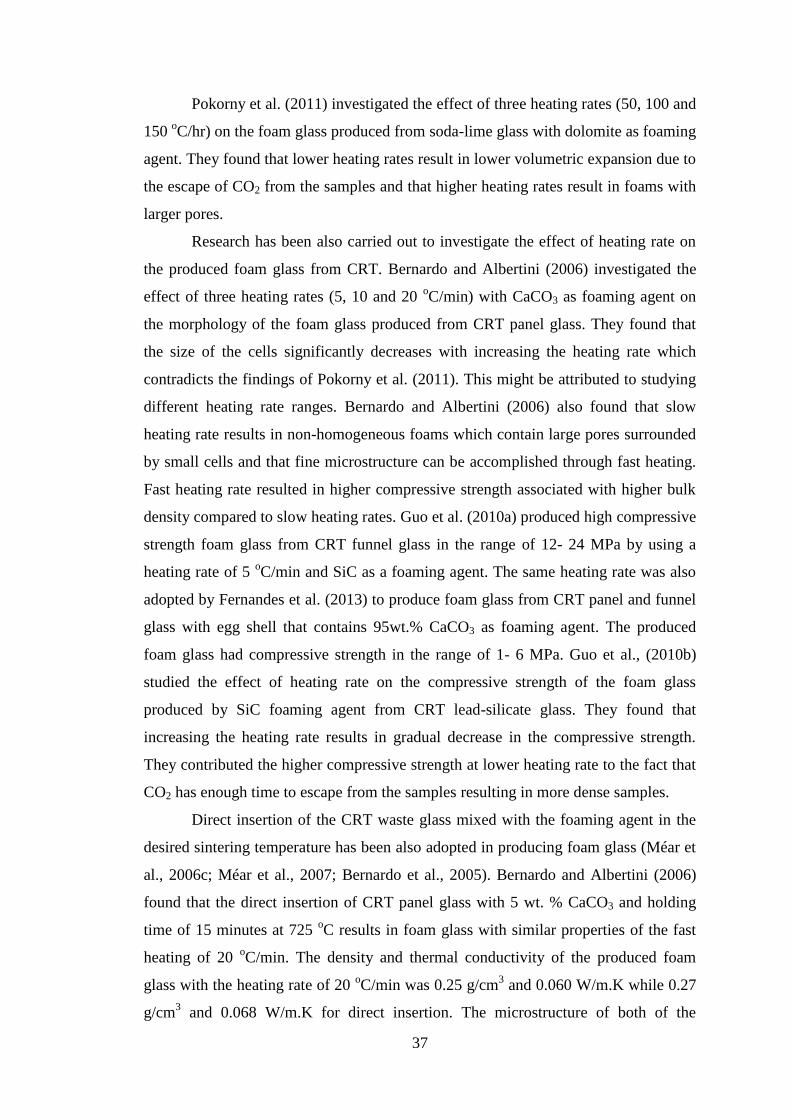
37
Pokorny et al. (2011) investigated the effect of three heating rates (50, 100 and
150 oC/hr) on the foam glass produced from soda-lime glass with dolomite as foaming
agent. They found that lower heating rates result in lower volumetric expansion due to
the escape of CO2 from the samples and that higher heating rates result in foams with
larger pores.
Research has been also carried out to investigate the effect of heating rate on
the produced foam glass from CRT. Bernardo and Albertini (2006) investigated the
effect of three heating rates (5, 10 and 20 oC/min) with CaCO3 as foaming agent on
the morphology of the foam glass produced from CRT panel glass. They found that
the size of the cells significantly decreases with increasing the heating rate which
contradicts the findings of Pokorny et al. (2011). This might be attributed to studying
different heating rate ranges. Bernardo and Albertini (2006) also found that slow
heating rate results in non-homogeneous foams which contain large pores surrounded
by small cells and that fine microstructure can be accomplished through fast heating.
Fast heating rate resulted in higher compressive strength associated with higher bulk
density compared to slow heating rates. Guo et al. (2010a) produced high compressive
strength foam glass from CRT funnel glass in the range of 12- 24 MPa by using a
heating rate of 5 oC/min and SiC as a foaming agent. The same heating rate was also
adopted by Fernandes et al. (2013) to produce foam glass from CRT panel and funnel
glass with egg shell that contains 95wt.% CaCO3 as foaming agent. The produced
foam glass had compressive strength in the range of 1- 6 MPa. Guo et al., (2010b)
studied the effect of heating rate on the compressive strength of the foam glass
produced by SiC foaming agent from CRT lead-silicate glass. They found that
increasing the heating rate results in gradual decrease in the compressive strength.
They contributed the higher compressive strength at lower heating rate to the fact that
CO2 has enough time to escape from the samples resulting in more dense samples.
Direct insertion of the CRT waste glass mixed with the foaming agent in the
desired sintering temperature has been also adopted in producing foam glass (Méar et
al., 2006c; Méar et al., 2007; Bernardo et al., 2005). Bernardo and Albertini (2006)
found that the direct insertion of CRT panel glass with 5 wt. % CaCO3 and holding
time of 15 minutes at 725 oC results in foam glass with similar properties of the fast
heating of 20 oC/min. The density and thermal conductivity of the produced foam
glass with the heating rate of 20 oC/min was 0.25 g/cm
3 and 0.060 W/m.K while 0.27
g/cm3 and 0.068 W/m.K for direct insertion. The microstructure of both of the
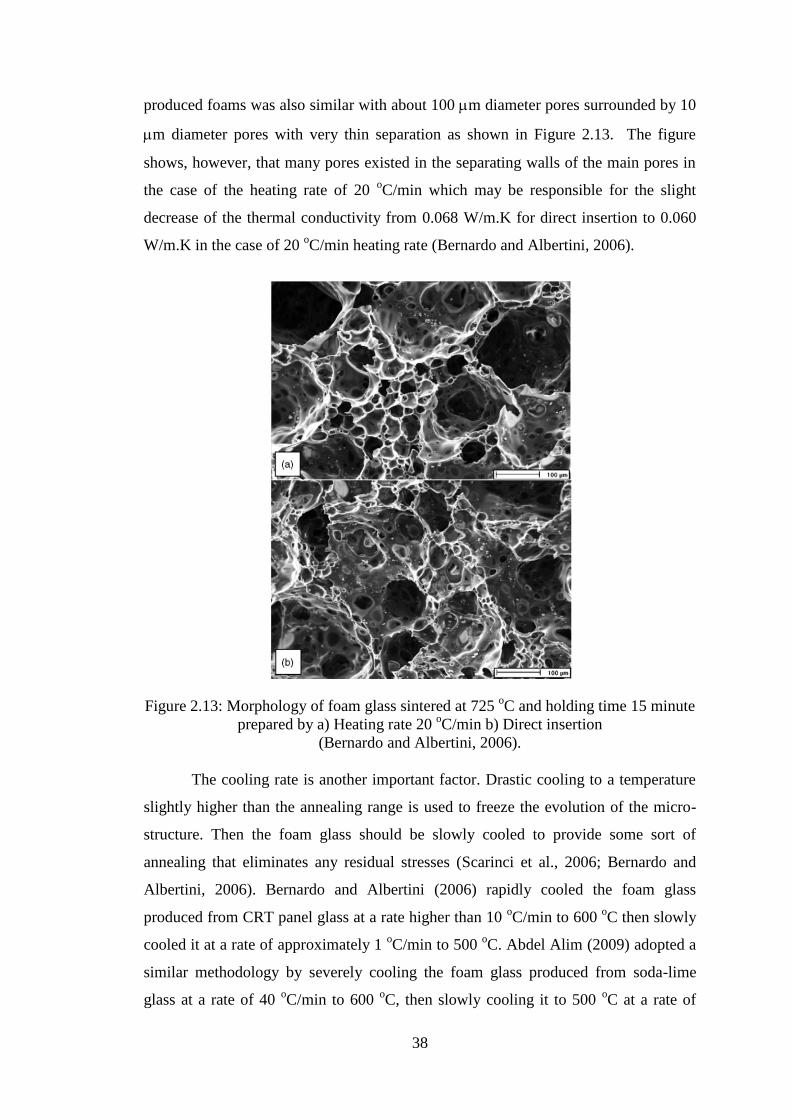
38
produced foams was also similar with about 100 m diameter pores surrounded by 10
m diameter pores with very thin separation as shown in Figure 2.13. The figure
shows, however, that many pores existed in the separating walls of the main pores in
the case of the heating rate of 20 oC/min which may be responsible for the slight
decrease of the thermal conductivity from 0.068 W/m.K for direct insertion to 0.060
W/m.K in the case of 20 oC/min heating rate (Bernardo and Albertini, 2006).
Figure 2.13: Morphology of foam glass sintered at 725 oC and holding time 15 minute
prepared by a) Heating rate 20 oC/min b) Direct insertion
(Bernardo and Albertini, 2006).
The cooling rate is another important factor. Drastic cooling to a temperature
slightly higher than the annealing range is used to freeze the evolution of the micro-
structure. Then the foam glass should be slowly cooled to provide some sort of
annealing that eliminates any residual stresses (Scarinci et al., 2006; Bernardo and
Albertini, 2006). Bernardo and Albertini (2006) rapidly cooled the foam glass
produced from CRT panel glass at a rate higher than 10 oC/min to 600
oC then slowly
cooled it at a rate of approximately 1 oC/min to 500
oC. Abdel Alim (2009) adopted a
similar methodology by severely cooling the foam glass produced from soda-lime
glass at a rate of 40 oC/min to 600
oC, then slowly cooling it to 500
oC at a rate of
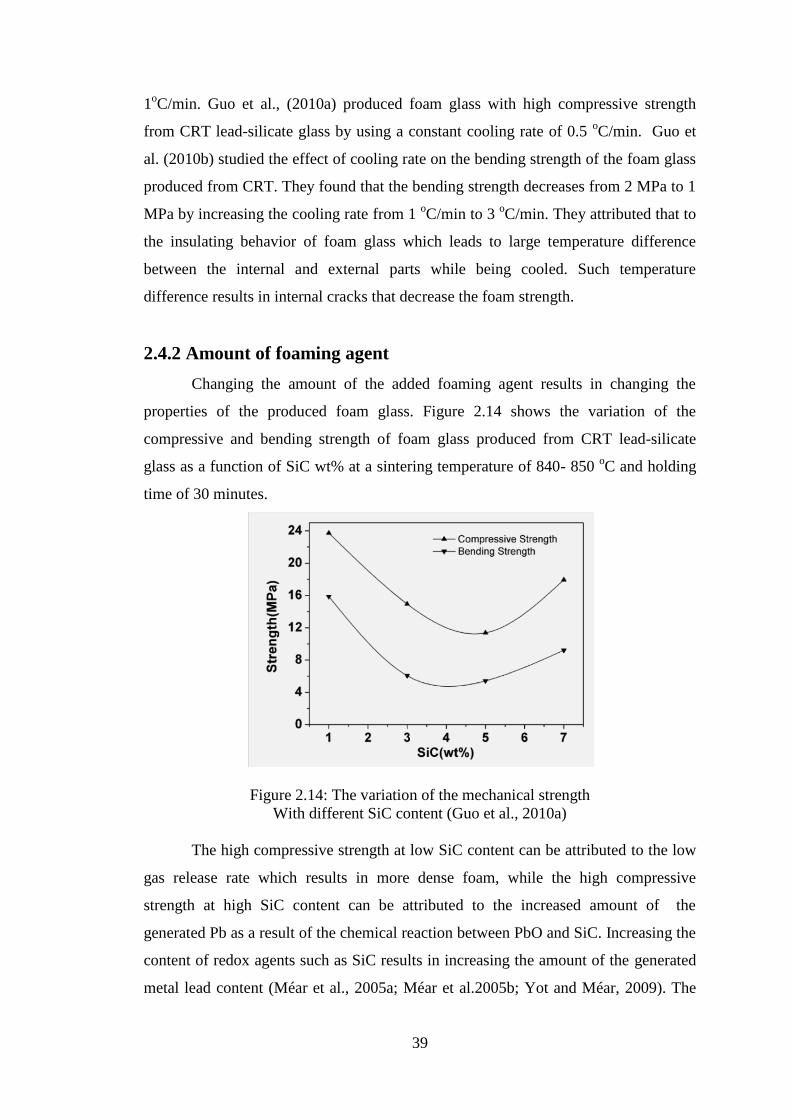
39
1oC/min. Guo et al., (2010a) produced foam glass with high compressive strength
from CRT lead-silicate glass by using a constant cooling rate of 0.5 oC/min. Guo et
al. (2010b) studied the effect of cooling rate on the bending strength of the foam glass
produced from CRT. They found that the bending strength decreases from 2 MPa to 1
MPa by increasing the cooling rate from 1 oC/min to 3
oC/min. They attributed that to
the insulating behavior of foam glass which leads to large temperature difference
between the internal and external parts while being cooled. Such temperature
difference results in internal cracks that decrease the foam strength.
2.4.2 Amount of foaming agent
Changing the amount of the added foaming agent results in changing the
properties of the produced foam glass. Figure 2.14 shows the variation of the
compressive and bending strength of foam glass produced from CRT lead-silicate
glass as a function of SiC wt% at a sintering temperature of 840- 850 oC and holding
time of 30 minutes.
Figure 2.14: The variation of the mechanical strength
With different SiC content (Guo et al., 2010a)
The high compressive strength at low SiC content can be attributed to the low
gas release rate which results in more dense foam, while the high compressive
strength at high SiC content can be attributed to the increased amount of the
generated Pb as a result of the chemical reaction between PbO and SiC. Increasing the
content of redox agents such as SiC results in increasing the amount of the generated
metal lead content (Méar et al., 2005a; Méar et al.2005b; Yot and Méar, 2009). The
40
presence of the heavy metal of Pb in the crystal phase gives higher mechanical
properties (Guo et al., 2010a).
Méar et al. (2006 b) investigated the effect of three amounts of SiC (1 wt%, 5
wt% and 9 wt%) on the pore size and homogeneity of the foam glass produced from
CRT funnel glass. They found that increasing the content of SiC results in increasing
the pore size from 50 m with homogeneous distribution to 100-300 m with
heterogeneous distribution as shown in Figure 2.15. The figure shows the morphology
of the foam glass produced at sintering temperature of 850 oC and holding time of 60
minutes with three weight percentages of SiC; 1%, 5% and 9%. Fernandes et al.
(2013) used a different foaming agent (egg shell containing 95 wt% CaCO3) to
produce foam glass from CRT funnel and panel glass, and also reached the same
conclusion that increasing the dosage of foaming agent results in larger pore size.
Figure 2.15 Morphology of foam glass with different content
of SiC: a) 1 wt% b) 5 wt% c) 9 wt% (Méar et al., 2006 b)
Regarding the relationship between the density of the produced foam glass
from CRT and the amount of the added foaming agent, Bernardo and Albertini (2006)
showed that increasing the amount of CaCO3 leads to decreasing the density of the
foam glass produced from CRT panel glass. Also Fernandes et al. (2013) found that
increasing the content of the foaming agent (egg shell containing 95 wt% CaCO3)
results in decreasing the foam density produced from CRT funnel and panel glass as
shown in Figure 2.16. The figure shows the relationship between the density and the
amount of the foaming agent at a sintering temperature of 700 oC and 15 minutes
holding time. Bernardo et al. (2007a) showed a similar trend for the foam glass
prepared from soda-lime glass prepared by SiC as foaming agent. However, further
increase of the amount of added SiC beyond 12.5 wt% resulted in an increase of the
density due to the coalescence phenomenon.
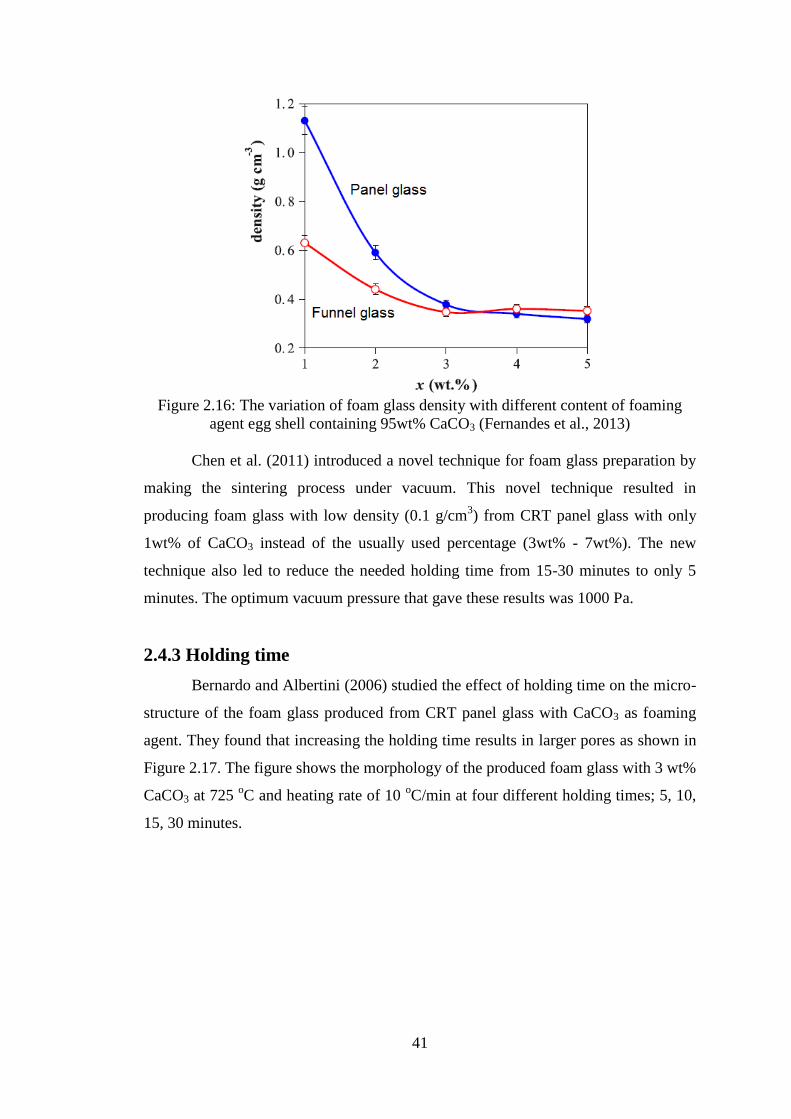
41
Figure 2.16: The variation of foam glass density with different content of foaming
agent egg shell containing 95wt% CaCO3 (Fernandes et al., 2013)
Chen et al. (2011) introduced a novel technique for foam glass preparation by
making the sintering process under vacuum. This novel technique resulted in
producing foam glass with low density (0.1 g/cm3) from CRT panel glass with only
1wt% of CaCO3 instead of the usually used percentage (3wt% - 7wt%). The new
technique also led to reduce the needed holding time from 15-30 minutes to only 5
minutes. The optimum vacuum pressure that gave these results was 1000 Pa.
2.4.3 Holding time
Bernardo and Albertini (2006) studied the effect of holding time on the micro-
structure of the foam glass produced from CRT panel glass with CaCO3 as foaming
agent. They found that increasing the holding time results in larger pores as shown in
Figure 2.17. The figure shows the morphology of the produced foam glass with 3 wt%
CaCO3 at 725 oC and heating rate of 10
oC/min at four different holding times; 5, 10,
15, 30 minutes.

42
Figure 2.17: Morphology of foam glass at different holding time: a) 5 minutes
b) 10 minutes c) 15 minutes d) 30 minutes (Bernardo and Albertini, 2006)
It can be noticed from Fig. 2.17 that the sample with the least holding time
(i.e. 5 minutes) has the finest and most homogenous structure. This made the sample
have the highest compressive strength (2.5 MPa) with the highest foam glass bulk
density (around 0.39 g/cm3).
The research carried out by Méar et al. (2006b) confirms the findings of
Bernardo and Albertini (2006). Méar et al. (2006b) used different foaming agents
(SiC and TiN) and longer holding times, but also found that increasing the holding
time for the foam glass produced from CRT funnel glass results in heterogeneous
structure with larger pores as shown in Figure 2.18. The figure shows the morphology
of the produced foam glass with 5wt% SiC at 850oC at three different holding times;
30, 60, 90 minutes.

43
Figure 2.18: Morphology of foam glass at different holding time:
a) 30 minutes b) 60 minutes c) 90 minutes (Méar et al., 2006b)
Generally increasing the holding time results in decreasing the foam density
due to the generation of larger pores, however after a certain holding time the density
starts to increase due to the coalescence phenomenon (Scarinci et al., 2006).
2.4.4 Sintering temperature
Méar et al. (2006b) investigated the effect of sintering temperature on the
micro-structure of the foam glass produced from CRT funnel glass with SiC as
foaming agent. They found that increasing the sintering temperature results in
increasing the pore size as shown in Figure 2.19. The figure shows the morphology of
the produced foam glass with 5 wt% SiC and holding time of 90 minutes at three
different temperatures; 750 oC, 850
oC and 950
oC. Similar results were obtained at
the same conditions with 4 wt% TiN (Méar et al., 2006b).
Figure 2.19: Morphology of foam glass at sintering temperature:
a) 750 oC b) 850
oC c) 950
oC (Méar et al., 2006b)
This finding is confirmed by the research carried out by Fernandes et al.
(2013) who used a different foaming agent (egg shell containing 95 wt% CaCO3) and
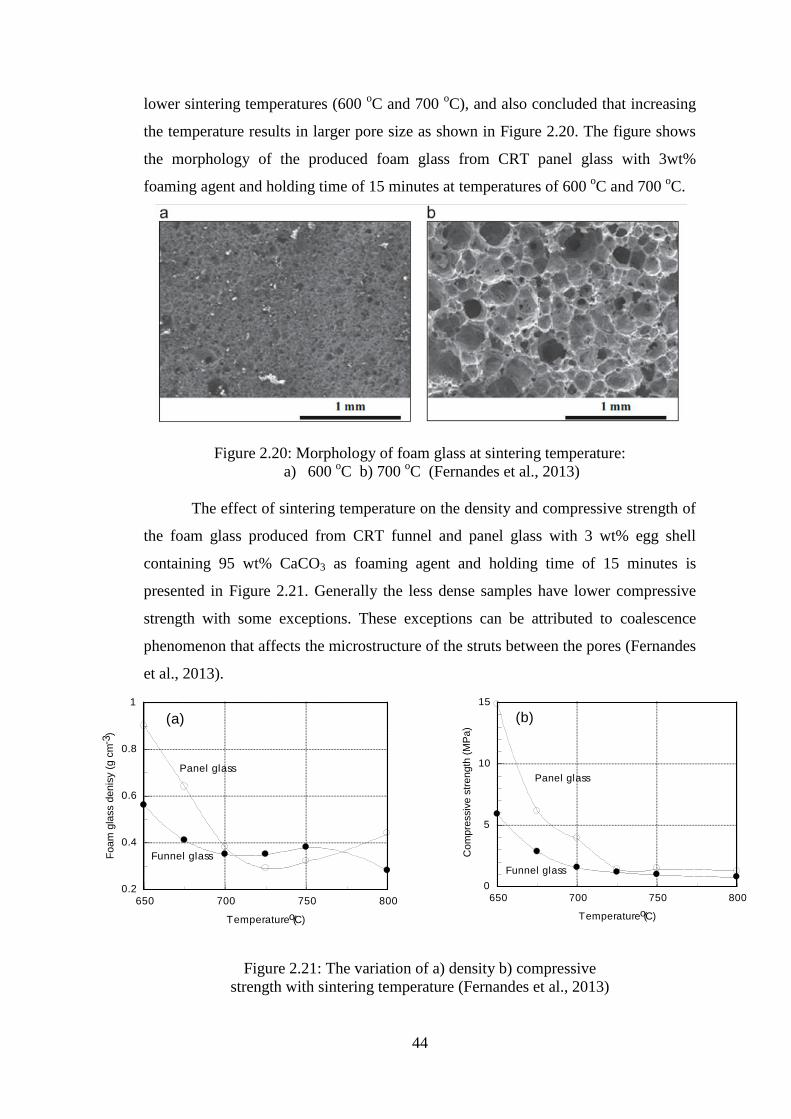
44
lower sintering temperatures (600 oC and 700
oC), and also concluded that increasing
the temperature results in larger pore size as shown in Figure 2.20. The figure shows
the morphology of the produced foam glass from CRT panel glass with 3wt%
foaming agent and holding time of 15 minutes at temperatures of 600 oC and 700
oC.
Figure 2.20: Morphology of foam glass at sintering temperature:
a) 600 oC b) 700
oC (Fernandes et al., 2013)
The effect of sintering temperature on the density and compressive strength of
the foam glass produced from CRT funnel and panel glass with 3 wt% egg shell
containing 95 wt% CaCO3 as foaming agent and holding time of 15 minutes is
presented in Figure 2.21. Generally the less dense samples have lower compressive
strength with some exceptions. These exceptions can be attributed to coalescence
phenomenon that affects the microstructure of the struts between the pores (Fernandes
et al., 2013).
650 700 750 800
Temperature (oC)
0.2
0.4
0.6
0.8
1
Foam
gla
ss d
enis
y (
g c
m-3
)
Panel glass
Funnel glass
(a)
650 700 750 800
Temperature (oC)
0
5
10
15
Com
pre
ssiv
e s
tre
ngth
(M
Pa)
Panel glass
Funnel glass
(b)
Figure 2.21: The variation of a) density b) compressive
strength with sintering temperature (Fernandes et al., 2013)

45
The density variation with sintering temperature of the foam glass prepared
from CRT panel glass by the novel technique of making the sintering process under
vacuum innovated by Chen et al. (2011) is presented in Figure 2.22. The figure shows
the density variation with the sintering temperature for the foam glass prepared from
CRT panel glass with 3wt% CaCO3 foaming agent and holding time of 30 minutes
under different vacuum pressures.
Figure 2.22: Effect of sintering temperature on relative density
under various pressures (Chen et al., 2011)
It can be noticed that the density of the prepared foam from CRT panel glass
generally decreases with the increase of the sintering temperature till a certain
temperature then starts to increase. Figure 2.23 shows the morphology of the
produced foam glass from soda-lime glass at different sintering temperatures. The
coalescence phenomenon was clear at the temperature of 900 oC as marked by the two
circles in Figure 2.23 (d).

46
Figure 2.23: The morphology of foam glass prepared from soda-lime glass at:
(a) 750 oC, (b) 800
oC, (c) 850
oC (d) 900
oC (Abdel Alim, 2009).
Guo et al. (2010a) found that the best mechanical strength of the foam glass
produced from lead silicate CRT glass with 5 wt % SiC is achieved at a sintering
temperature of 780 oC. They attributed this to the fact that at this temperature the
reaction between PbO and SiC that starts at 600 oC is intensified resulting in
generation of lead that exists in crystal phase. The precipitation and distribution of Pb
micro-crystals provides higher mechanical strength because it reinforces the produced
foam. It should be noted, however, that further increase in the sintering temperature
leads to generation of more metal lead as shown in Figure 2.24. The figure shows the
reduced metal lead content Pb (0) as wt% of the unreduced lead Pb (+II) that was
initially present in the glass before foaming versus the sintering temperature for SiC
and TiC content of 5wt% and holding time of 60 minutes. As shown in the figure, by
increasing the temperature to around 950 oC, 40% wt. of the lead initially present in
the glass is reduced to lead metal. However, the mechanical strength would be
expected to be reduced at this high temperature due the coalescence phenomenon as
previously explained.
b a
c d
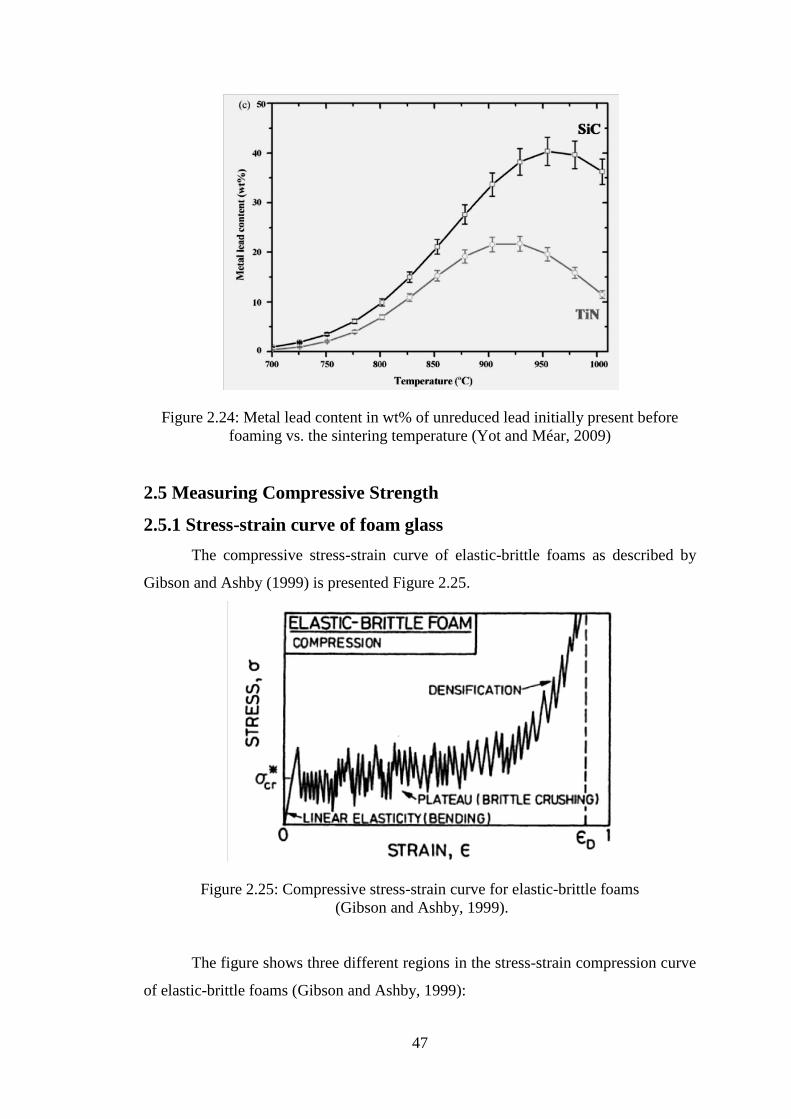
47
Figure 2.24: Metal lead content in wt% of unreduced lead initially present before
foaming vs. the sintering temperature (Yot and Méar, 2009)
2.5 Measuring Compressive Strength
2.5.1 Stress-strain curve of foam glass
The compressive stress-strain curve of elastic-brittle foams as described by
Gibson and Ashby (1999) is presented Figure 2.25.
Figure 2.25: Compressive stress-strain curve for elastic-brittle foams
(Gibson and Ashby, 1999).
The figure shows three different regions in the stress-strain compression curve
of elastic-brittle foams (Gibson and Ashby, 1999):
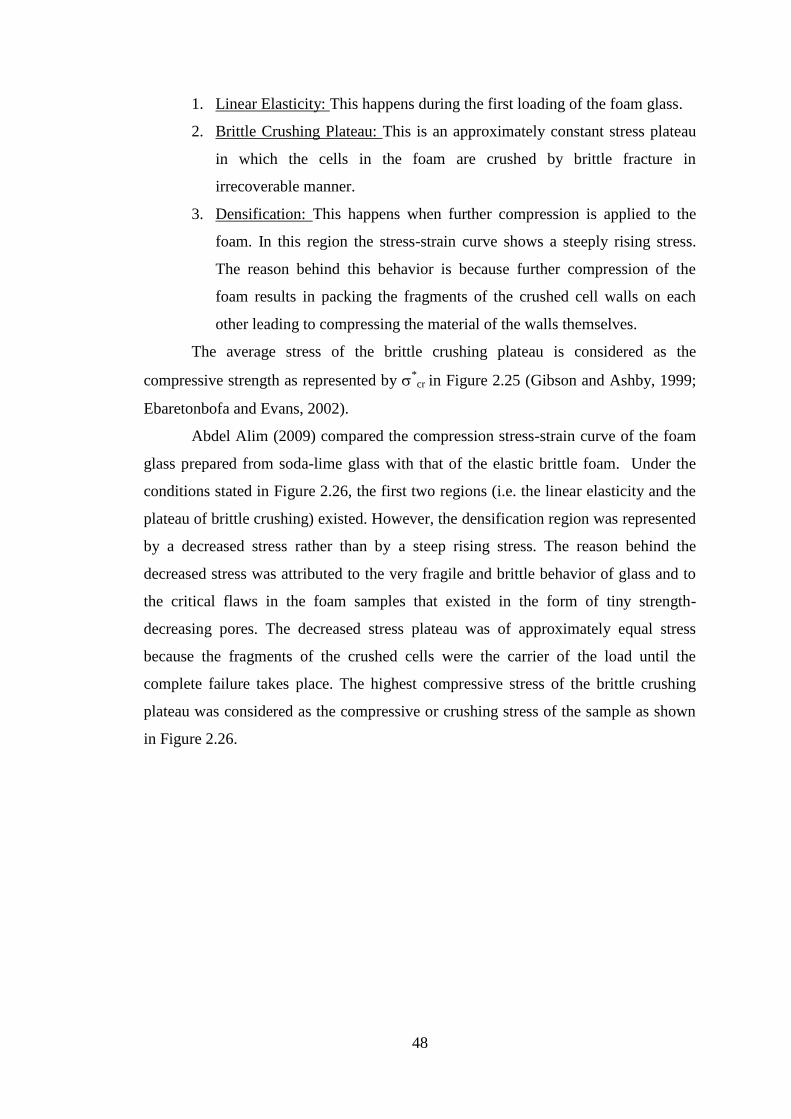
48
1. Linear Elasticity: This happens during the first loading of the foam glass.
2. Brittle Crushing Plateau: This is an approximately constant stress plateau
in which the cells in the foam are crushed by brittle fracture in
irrecoverable manner.
3. Densification: This happens when further compression is applied to the
foam. In this region the stress-strain curve shows a steeply rising stress.
The reason behind this behavior is because further compression of the
foam results in packing the fragments of the crushed cell walls on each
other leading to compressing the material of the walls themselves.
The average stress of the brittle crushing plateau is considered as the
compressive strength as represented by *cr in Figure 2.25 (Gibson and Ashby, 1999;
Ebaretonbofa and Evans, 2002).
Abdel Alim (2009) compared the compression stress-strain curve of the foam
glass prepared from soda-lime glass with that of the elastic brittle foam. Under the
conditions stated in Figure 2.26, the first two regions (i.e. the linear elasticity and the
plateau of brittle crushing) existed. However, the densification region was represented
by a decreased stress rather than by a steep rising stress. The reason behind the
decreased stress was attributed to the very fragile and brittle behavior of glass and to
the critical flaws in the foam samples that existed in the form of tiny strength-
decreasing pores. The decreased stress plateau was of approximately equal stress
because the fragments of the crushed cells were the carrier of the load until the
complete failure takes place. The highest compressive stress of the brittle crushing
plateau was considered as the compressive or crushing stress of the sample as shown
in Figure 2.26.

49
Figure 2.26: Compression stress-strain curve for foam glass
prepared from soda-lime glass (Abdel Alim, 2009)
The foam glass samples prepared by Tulyaganov et al. (2006) from soda-lime
glass and aluminosilicate glass powder with SiC as foaming agent exhibited a similar
behavior as shown in Figure 2.27. The compressive strength was also considered as
the highest stress in the brittle crushing plateau.
Figure 2.27: Compression stress-strain curve for different samples of foam glass
prepared from soda-lime glass, aluminosilicate glass powder and SiC as foaming
agent (Tulyaganov et al., 2006)
On the other hand, Abdel Alim (2009) found that increasing the particle size
and keeping all other parameters constant, not only increases the bulk density as well
Particle size 75 m
12 wt% sodium silicate
Sintering Temp. 850 oC, holding time 30 min.
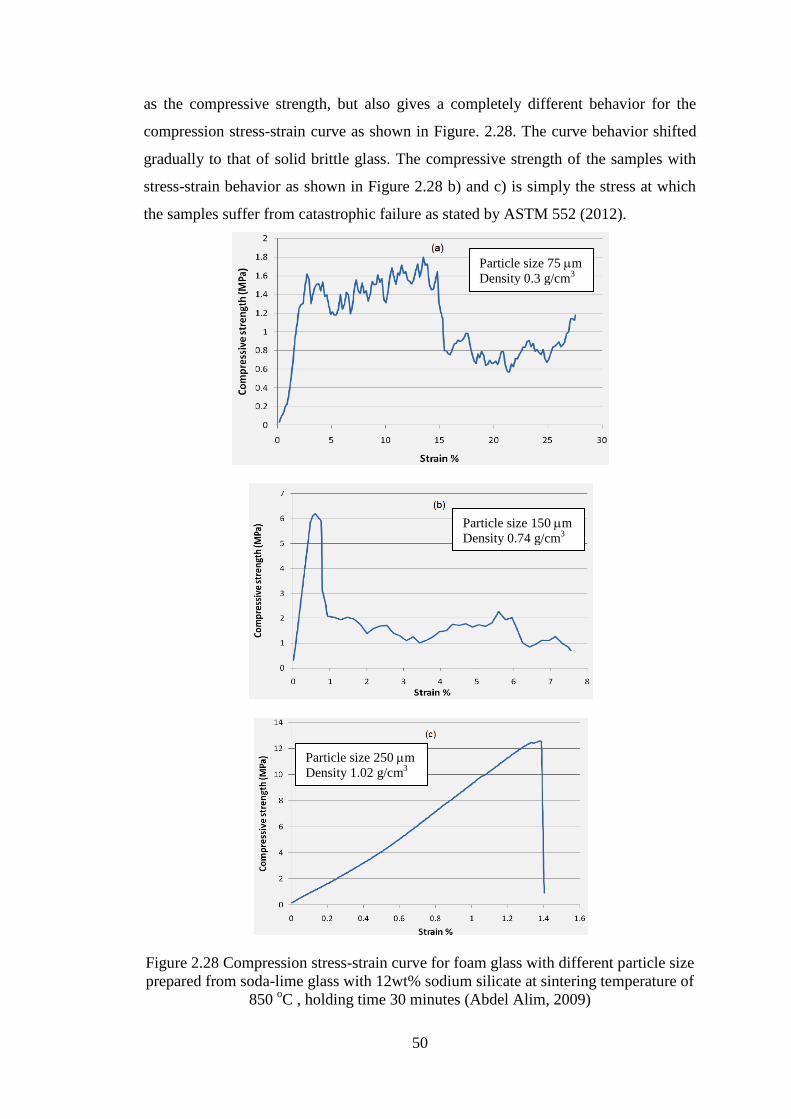
50
as the compressive strength, but also gives a completely different behavior for the
compression stress-strain curve as shown in Figure. 2.28. The curve behavior shifted
gradually to that of solid brittle glass. The compressive strength of the samples with
stress-strain behavior as shown in Figure 2.28 b) and c) is simply the stress at which
the samples suffer from catastrophic failure as stated by ASTM 552 (2012).
Figure 2.28 Compression stress-strain curve for foam glass with different particle size
prepared from soda-lime glass with 12wt% sodium silicate at sintering temperature of
850 oC , holding time 30 minutes (Abdel Alim, 2009)
Particle size 75 m
Density 0.3 g/cm3
Particle size 150 m
Density 0.74 g/cm3
Particle size 250 m
Density 1.02 g/cm3
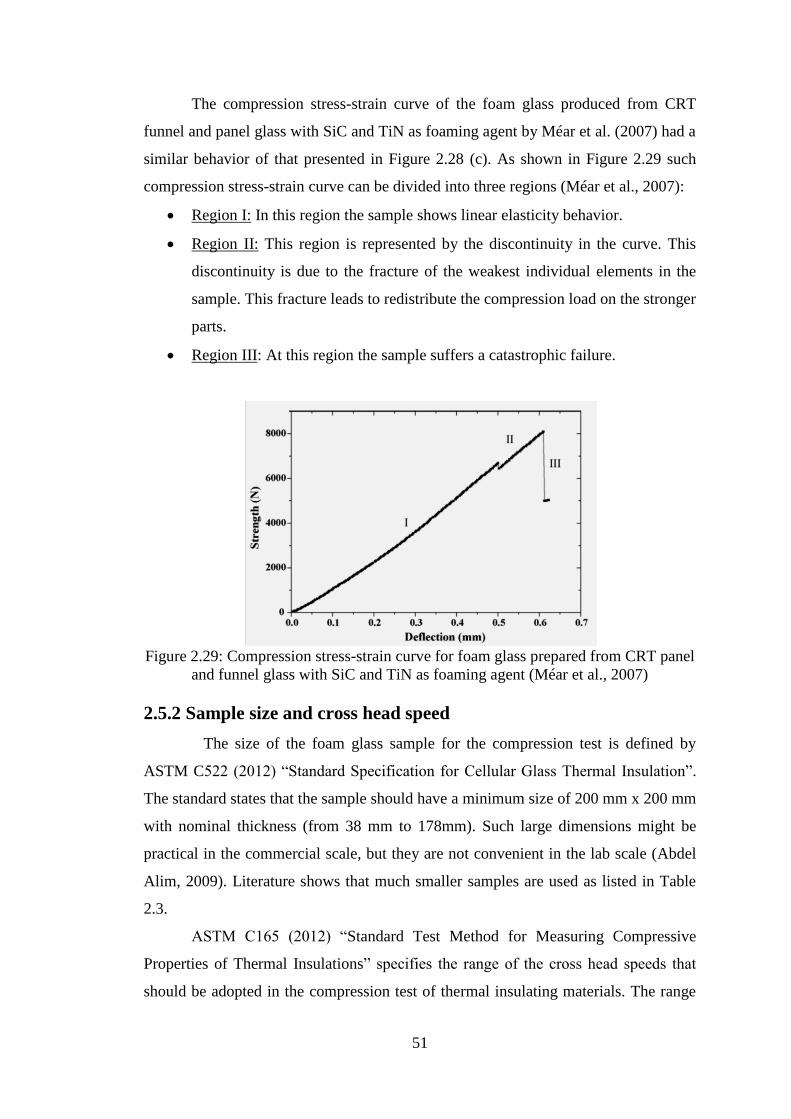
51
The compression stress-strain curve of the foam glass produced from CRT
funnel and panel glass with SiC and TiN as foaming agent by Méar et al. (2007) had a
similar behavior of that presented in Figure 2.28 (c). As shown in Figure 2.29 such
compression stress-strain curve can be divided into three regions (Méar et al., 2007):
Region I: In this region the sample shows linear elasticity behavior.
Region II: This region is represented by the discontinuity in the curve. This
discontinuity is due to the fracture of the weakest individual elements in the
sample. This fracture leads to redistribute the compression load on the stronger
parts.
Region III: At this region the sample suffers a catastrophic failure.
Figure 2.29: Compression stress-strain curve for foam glass prepared from CRT panel
and funnel glass with SiC and TiN as foaming agent (Méar et al., 2007)
2.5.2 Sample size and cross head speed
The size of the foam glass sample for the compression test is defined by
ASTM C522 (2012) “Standard Specification for Cellular Glass Thermal Insulation”.
The standard states that the sample should have a minimum size of 200 mm x 200 mm
with nominal thickness (from 38 mm to 178mm). Such large dimensions might be
practical in the commercial scale, but they are not convenient in the lab scale (Abdel
Alim, 2009). Literature shows that much smaller samples are used as listed in Table
2.3.
ASTM C165 (2012) “Standard Test Method for Measuring Compressive
Properties of Thermal Insulations” specifies the range of the cross head speeds that
should be adopted in the compression test of thermal insulating materials. The range

52
should be from 0.25 to 12.7 mm/min for each 25.4 mm of specimen thickness. Table
2.3 also lists the adopted cross head speeds in literature.
Table 2.3: Size of compression test samples and the adopted cross head speeds
Reference Glass waste Sample Size
(mm)
Cross head
speed (mm/min)
Méar et al. (2007) Funnel & Panel CRT 5x5x 12.5 2
Bernardo et al. (2006) Panel CRT 15x15x10 2
Guo et al. (2010a) CRT 5x5x12.5 2
Bernardo and Albertini
(2006)
Panel CRT 15x15x10 2
Fernandes et al. (2013) Funnel & Panel CRT 30x30x30 0.5
Bernardo et al. (2005) CRT 15x15x6 0.5
Bernardo et al. (2010) Soda-lime 8x8x3 1
Abdel Alim (2009) Soda-lime 20x20x20 2
Tulyaganov et al. (2006) Soda-lime 30x30x30 0.5
2.6 Leaching Of Lead Silicate Glass
Several testing procedures exist to test the leachability of heavy metals. These
testing procedures include the shake extraction procedure of ASTM D3987 (2012)
and the Toxicity Characteristic Leaching Procedure TCLP as well as the EP procedure
that were both developed by the US Environmental Protection Agency USEPA. It
should be noticed, however, that the landfill leachate can’t be duplicated by using any
testing procedure (Eisenberg et al., 1986). One of the main differences between EP,
TCLP and ASTM D3987 is that the leaching medium used in both EP and TCLP is
acidic while it is neutral (distilled water of pH=7) in ASTM D3987. Comparing the
leachate results for the metals including lead from fly ash by using these three tests
showed that the leaching results of EP and TCLP are significantly higher than ASTM
D3987 (Egemen and Yurteri, 1996; Baba and Türkman 2001; Baba and Kaya, 2004).
Also the research carried out by Chang et al. (2001) showed that generally the
leachable metal content resulting from different wastes obtained by using of EP and
TCLP is higher than ASTM D3987. Jang and Townsend (2003) investigated the lead
leaching from CRT glass by using TCLP (acidic leaching solution of pH 4.93). The
obtained results were compared with those obtained by using actual landfill leachate
from 11 landfills having an average pH of 7.6 as the leaching solution to simulate
actual landfill conditions. The comparison showed that the results are significantly
different. The average leaching lead content was 413 mg/l and 4.06 mg/l for TCLP
and MSW leachate medium, respectively. They contributed this significant increase in
53
the leaching lead content when using TCLP to the acidity of the leaching medium. It
should be noted however that the CRT glass samples used in this research was not
representative of an entire CRT because the aim of the research was to compare the
results of lead leaching from TCLP with that of actual landfill conditions rather than
studying the toxicity characteristics of CRT. Egemen and Yurteri (1996) investigated
the metal leaching from fly ash using the three methods and compared the results with
actual leachate collected from fly ash landfills. They concluded that although the three
tests result in higher leaching values than those under actual field conditions, the
metal leachate results for fly ash by using ASTM D3987 gives the most close results
to actual values in landfills. The variability of replicate results is another important
aspect in the leaching tests. Eisenberg et al. (1986) stated that the shake extraction
procedure of ASTM D3987 has a low variability of replicate data.
Regarding the leachate values for lead glass like the CRT glass, literature
shows that the values are usually higher than the US regulatory limit of 5 mg/l
(Townsend et al., 1999; Musson et al., 2000; Yot and Méar, 2011). Musson et al.
(2000) showed that out of 30 tested color CRTs only 9 CRTs had values lower than 5
mg/l. The 30 tested color CRTs had an average value of 22.2 mg/l. Table 2.4 shows
the lead leachate values for the 30 CRTs tested in accordance with TCLP.
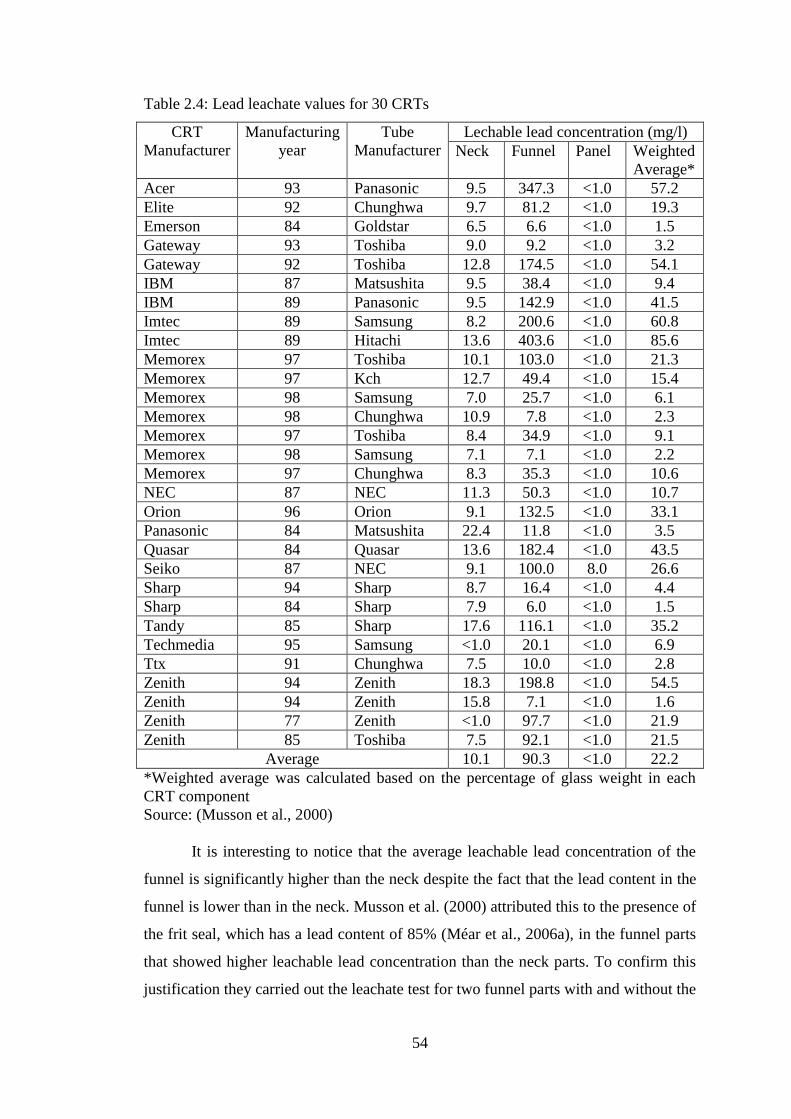
54
Table 2.4: Lead leachate values for 30 CRTs
CRT
Manufacturer
Manufacturing
year
Tube
Manufacturer
Lechable lead concentration (mg/l)
Neck Funnel Panel Weighted
Average*
Acer 93 Panasonic 9.5 347.3 <1.0 57.2
Elite 92 Chunghwa 9.7 81.2 <1.0 19.3
Emerson 84 Goldstar 6.5 6.6 <1.0 1.5
Gateway 93 Toshiba 9.0 9.2 <1.0 3.2
Gateway 92 Toshiba 12.8 174.5 <1.0 54.1
IBM 87 Matsushita 9.5 38.4 <1.0 9.4
IBM 89 Panasonic 9.5 142.9 <1.0 41.5
Imtec 89 Samsung 8.2 200.6 <1.0 60.8
Imtec 89 Hitachi 13.6 403.6 <1.0 85.6
Memorex 97 Toshiba 10.1 103.0 <1.0 21.3
Memorex 97 Kch 12.7 49.4 <1.0 15.4
Memorex 98 Samsung 7.0 25.7 <1.0 6.1
Memorex 98 Chunghwa 10.9 7.8 <1.0 2.3
Memorex 97 Toshiba 8.4 34.9 <1.0 9.1
Memorex 98 Samsung 7.1 7.1 <1.0 2.2
Memorex 97 Chunghwa 8.3 35.3 <1.0 10.6
NEC 87 NEC 11.3 50.3 <1.0 10.7
Orion 96 Orion 9.1 132.5 <1.0 33.1
Panasonic 84 Matsushita 22.4 11.8 <1.0 3.5
Quasar 84 Quasar 13.6 182.4 <1.0 43.5
Seiko 87 NEC 9.1 100.0 8.0 26.6
Sharp 94 Sharp 8.7 16.4 <1.0 4.4
Sharp 84 Sharp 7.9 6.0 <1.0 1.5
Tandy 85 Sharp 17.6 116.1 <1.0 35.2
Techmedia 95 Samsung <1.0 20.1 <1.0 6.9
Ttx 91 Chunghwa 7.5 10.0 <1.0 2.8
Zenith 94 Zenith 18.3 198.8 <1.0 54.5
Zenith 94 Zenith 15.8 7.1 <1.0 1.6
Zenith 77 Zenith <1.0 97.7 <1.0 21.9
Zenith 85 Toshiba 7.5 92.1 <1.0 21.5
Average 10.1 90.3 <1.0 22.2
*Weighted average was calculated based on the percentage of glass weight in each
CRT component
Source: (Musson et al., 2000)
It is interesting to notice that the average leachable lead concentration of the
funnel is significantly higher than the neck despite the fact that the lead content in the
funnel is lower than in the neck. Musson et al. (2000) attributed this to the presence of
the frit seal, which has a lead content of 85% (Méar et al., 2006a), in the funnel parts
that showed higher leachable lead concentration than the neck parts. To confirm this
justification they carried out the leachate test for two funnel parts with and without the
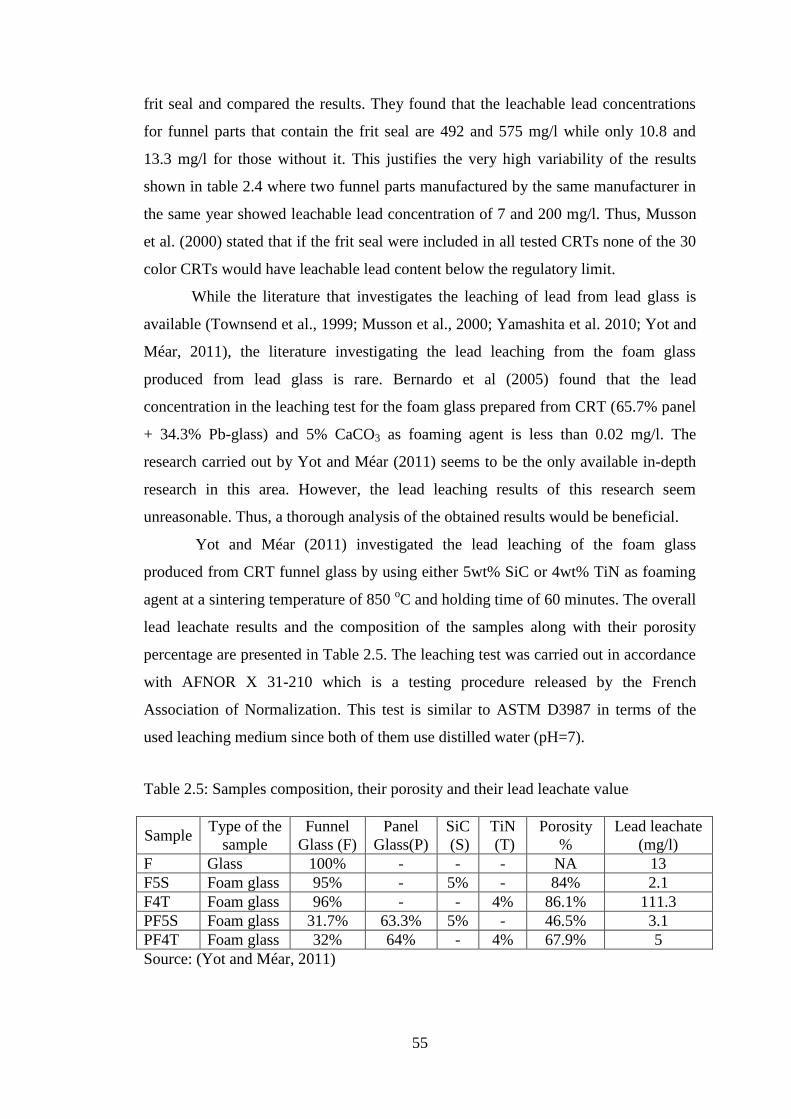
55
frit seal and compared the results. They found that the leachable lead concentrations
for funnel parts that contain the frit seal are 492 and 575 mg/l while only 10.8 and
13.3 mg/l for those without it. This justifies the very high variability of the results
shown in table 2.4 where two funnel parts manufactured by the same manufacturer in
the same year showed leachable lead concentration of 7 and 200 mg/l. Thus, Musson
et al. (2000) stated that if the frit seal were included in all tested CRTs none of the 30
color CRTs would have leachable lead content below the regulatory limit.
While the literature that investigates the leaching of lead from lead glass is
available (Townsend et al., 1999; Musson et al., 2000; Yamashita et al. 2010; Yot and
Méar, 2011), the literature investigating the lead leaching from the foam glass
produced from lead glass is rare. Bernardo et al (2005) found that the lead
concentration in the leaching test for the foam glass prepared from CRT (65.7% panel
+ 34.3% Pb-glass) and 5% CaCO3 as foaming agent is less than 0.02 mg/l. The
research carried out by Yot and Méar (2011) seems to be the only available in-depth
research in this area. However, the lead leaching results of this research seem
unreasonable. Thus, a thorough analysis of the obtained results would be beneficial.
Yot and Méar (2011) investigated the lead leaching of the foam glass
produced from CRT funnel glass by using either 5wt% SiC or 4wt% TiN as foaming
agent at a sintering temperature of 850 oC and holding time of 60 minutes. The overall
lead leachate results and the composition of the samples along with their porosity
percentage are presented in Table 2.5. The leaching test was carried out in accordance
with AFNOR X 31-210 which is a testing procedure released by the French
Association of Normalization. This test is similar to ASTM D3987 in terms of the
used leaching medium since both of them use distilled water (pH=7).
Table 2.5: Samples composition, their porosity and their lead leachate value
Sample Type of the
sample
Funnel
Glass (F)
Panel
Glass(P)
SiC
(S)
TiN
(T)
Porosity
%
Lead leachate
(mg/l)
F Glass 100% - - - NA 13
F5S Foam glass 95% - 5% - 84% 2.1
F4T Foam glass 96% - - 4% 86.1% 111.3
PF5S Foam glass 31.7% 63.3% 5% - 46.5% 3.1
PF4T Foam glass 32% 64% - 4% 67.9% 5
Source: (Yot and Méar, 2011)

56
The results show that while the leachable lead concentration in the funnel
glass (F) was found to be 13 mg/l, the value changed to 2.1 and 111.3 mg/l for the
foam glass produced by using SiC (F5S) and TiN (F4T), respectively. The higher lead
leaching values associated with using TiN rather than SiC can be attributed to two
reasons as noted by the authors. Firstly, using TiN as a foaming agent results in
increasing the porosity percentage in comparison with SiC which provides larger
surface area. Secondly, the amount of the generated metal lead when using TiN is
higher than when using SiC. The latter reason is illustrated in Figure.2.30 that shows
the generated metal lead content in the case of using 4% TiN and 5% SiC at 850 oC
and holding time of 60 minutes (i.e. the same conditions used to produce the studied
foams). The results presented in this figure are confirmed by other studies (Méar et
al., 2005a; Méar et al., 2005b). The aforementioned two reasons could result in a
slight increase of the lead leaching values, but they may not justify such significant
increase from only 2.1 mg/l (F5S) to 111.3 mg/l (F4T) especially because the increase
in the porosity percentage, 2.1%, and the metal lead content, less than 1.0%, are not
that significant as shown in Table 2.5 and Figure 2.30, respectively. Further
investigation of the results shows that using TiN rather than SiC results only in just a
slight increase in the lead leachate results (less than 2 mg/l) in the case of PF4T and
PF5S even when the porosity percentage difference is significant (more than 20%) as
shown in Table 2.5.
Figure 2.30: Metal lead content in wt% of unreduced lead initially present before
foaming vs. the foaming agent content (Yot and Méar, 2009)
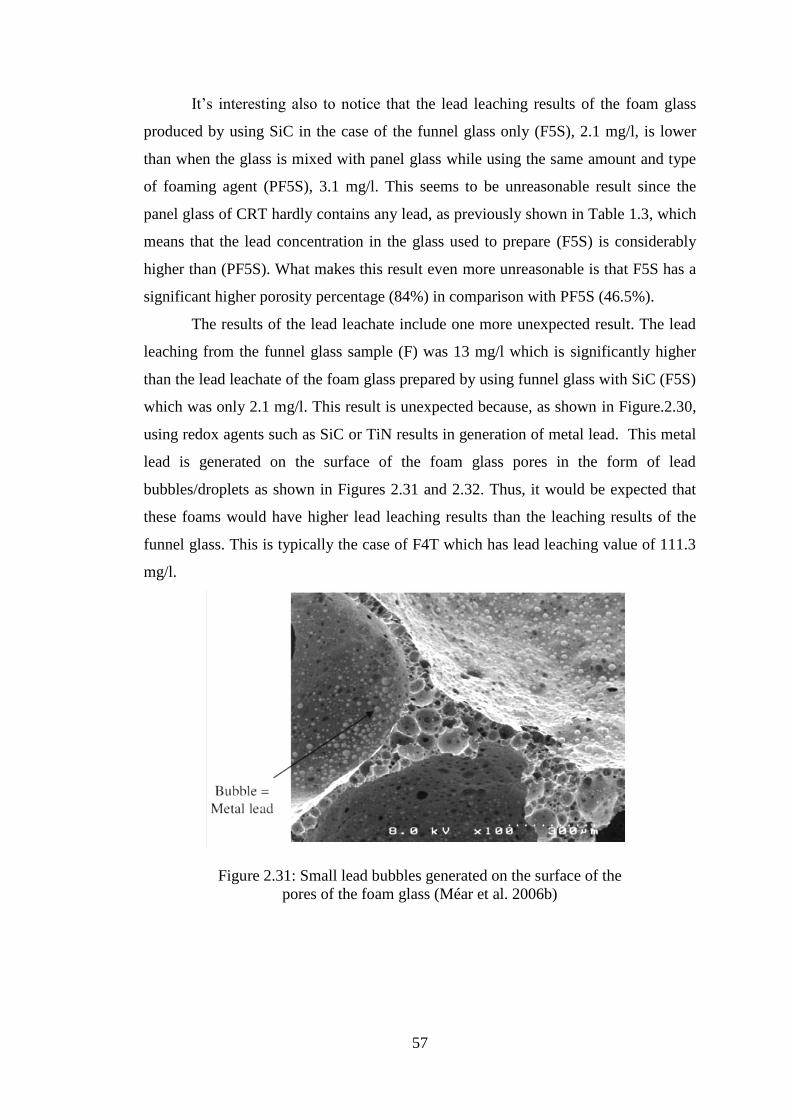
57
It’s interesting also to notice that the lead leaching results of the foam glass
produced by using SiC in the case of the funnel glass only (F5S), 2.1 mg/l, is lower
than when the glass is mixed with panel glass while using the same amount and type
of foaming agent (PF5S), 3.1 mg/l. This seems to be unreasonable result since the
panel glass of CRT hardly contains any lead, as previously shown in Table 1.3, which
means that the lead concentration in the glass used to prepare (F5S) is considerably
higher than (PF5S). What makes this result even more unreasonable is that F5S has a
significant higher porosity percentage (84%) in comparison with PF5S (46.5%).
The results of the lead leachate include one more unexpected result. The lead
leaching from the funnel glass sample (F) was 13 mg/l which is significantly higher
than the lead leachate of the foam glass prepared by using funnel glass with SiC (F5S)
which was only 2.1 mg/l. This result is unexpected because, as shown in Figure.2.30,
using redox agents such as SiC or TiN results in generation of metal lead. This metal
lead is generated on the surface of the foam glass pores in the form of lead
bubbles/droplets as shown in Figures 2.31 and 2.32. Thus, it would be expected that
these foams would have higher lead leaching results than the leaching results of the
funnel glass. This is typically the case of F4T which has lead leaching value of 111.3
mg/l.
Figure 2.31: Small lead bubbles generated on the surface of the
pores of the foam glass (Méar et al. 2006b)
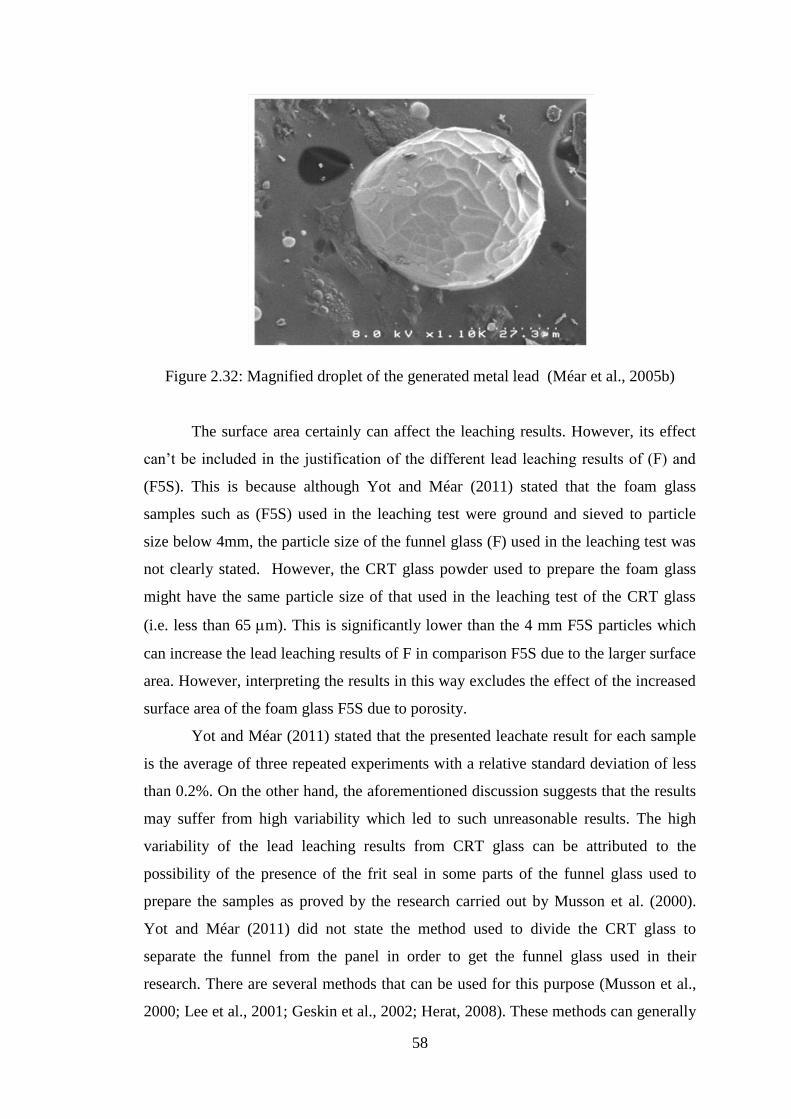
58
Figure 2.32: Magnified droplet of the generated metal lead (Méar et al., 2005b)
The surface area certainly can affect the leaching results. However, its effect
can’t be included in the justification of the different lead leaching results of (F) and
(F5S). This is because although Yot and Méar (2011) stated that the foam glass
samples such as (F5S) used in the leaching test were ground and sieved to particle
size below 4mm, the particle size of the funnel glass (F) used in the leaching test was
not clearly stated. However, the CRT glass powder used to prepare the foam glass
might have the same particle size of that used in the leaching test of the CRT glass
(i.e. less than 65 m). This is significantly lower than the 4 mm F5S particles which
can increase the lead leaching results of F in comparison F5S due to the larger surface
area. However, interpreting the results in this way excludes the effect of the increased
surface area of the foam glass F5S due to porosity.
Yot and Méar (2011) stated that the presented leachate result for each sample
is the average of three repeated experiments with a relative standard deviation of less
than 0.2%. On the other hand, the aforementioned discussion suggests that the results
may suffer from high variability which led to such unreasonable results. The high
variability of the lead leaching results from CRT glass can be attributed to the
possibility of the presence of the frit seal in some parts of the funnel glass used to
prepare the samples as proved by the research carried out by Musson et al. (2000).
Yot and Méar (2011) did not state the method used to divide the CRT glass to
separate the funnel from the panel in order to get the funnel glass used in their
research. There are several methods that can be used for this purpose (Musson et al.,
2000; Lee et al., 2001; Geskin et al., 2002; Herat, 2008). These methods can generally

59
be classified as physical and chemical methods. Using physical methods such as
diamond saw or electric wire heating can’t remove the frit seal adhered to the funnel
glass, while chemical methods can remove the entire frit seal (Lee et al., 2001). If one
of the physical methods was applied in their research, then the high variability of the
lead leachate results could be justified.
Yot and Méar (2009) found that increasing the sintering temperature, the
foaming agent content or the holding time would generally result in increase in the
metal lead content generated at the surface of the pores of the foam glass in the case
of using redox agents. This suggests that increasing any of these parameters would
result in increasing the leachable lead concentration of the produced foam glass. On
the other hand, this is not applicable to neutralization agents such as CaCO3, because
they don’t result in generation of metal lead since the foaming gas CO2 is released by
thermal decomposition as previously stated.
The present research aims at adopting an open-recycling system to produce
foam glass from the grinding and polishing sludge of lead crystal. The effect of
sintering temperature and holding time on the properties of the produced foam glass
will be studied. SiC and granite powder will be added to enhance the properties of the
produced foam glass. The effect of their amounts on the properties of the produced
foam glass will be investigated. The properties of the produced foam glass that will be
investigated in this research include; density, total porosity percentage, compressive
strength, and thermal conductivity. In addition, the lead leachate of the sludge as well
as the produced foam glass will be investigated.

60
CHAPTER 3
EXPERIMENTAL PROCEDURE
The aim of this chapter is to present the experimental procedures used in this
study. The chapter is divided into four parts. The first part presents the tests carried
out for the raw material (sludge) provided by ASFOUR Crystal. The second part
presents the experimental matrix adopted to study the effect of several parameters on
the properties of the produced foam glass. The third part describes the experimental
method used to prepare the foam glass. The fourth part presents the tests carried out
for the produced foam glass.
3.1 Characteristics of Raw Material
3.1.1 Chemical analysis
The chemical analysis of the sludge was provided by ASFOUR Crystal and
was carried out by using Wavelength Dispersive X-ray spectroscopy (WDX).
3.1.2 Particle size analysis
The particle size of the sludge was analyzed in accordance with ASTM D422
(2007) “Particle-Size Analysis of Soils”. The sludge was dried for 10 hours then 200
g was used in the sieve analysis. Table 3.1 presents the number of the used set of
sieves along with their diameter while Figure 3.1 shows the used set of sieves.
Table 3.1: Sieves used in the particle size analysis of the sludge
Sieve Number Diameter
8 2.36 mm
16 1.18 mm
30 600 m
50 300 m
100 150 m
200 75 m
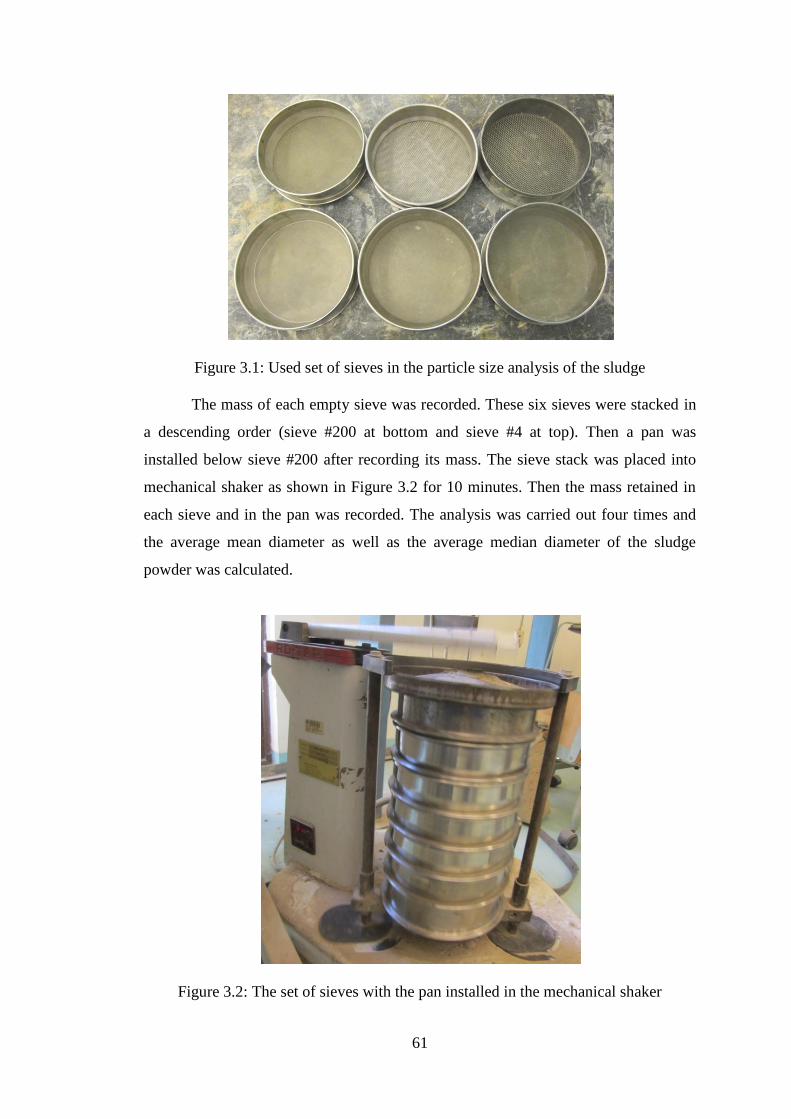
61
Figure 3.1: Used set of sieves in the particle size analysis of the sludge
The mass of each empty sieve was recorded. These six sieves were stacked in
a descending order (sieve #200 at bottom and sieve #4 at top). Then a pan was
installed below sieve #200 after recording its mass. The sieve stack was placed into
mechanical shaker as shown in Figure 3.2 for 10 minutes. Then the mass retained in
each sieve and in the pan was recorded. The analysis was carried out four times and
the average mean diameter as well as the average median diameter of the sludge
powder was calculated.
Figure 3.2: The set of sieves with the pan installed in the mechanical shaker
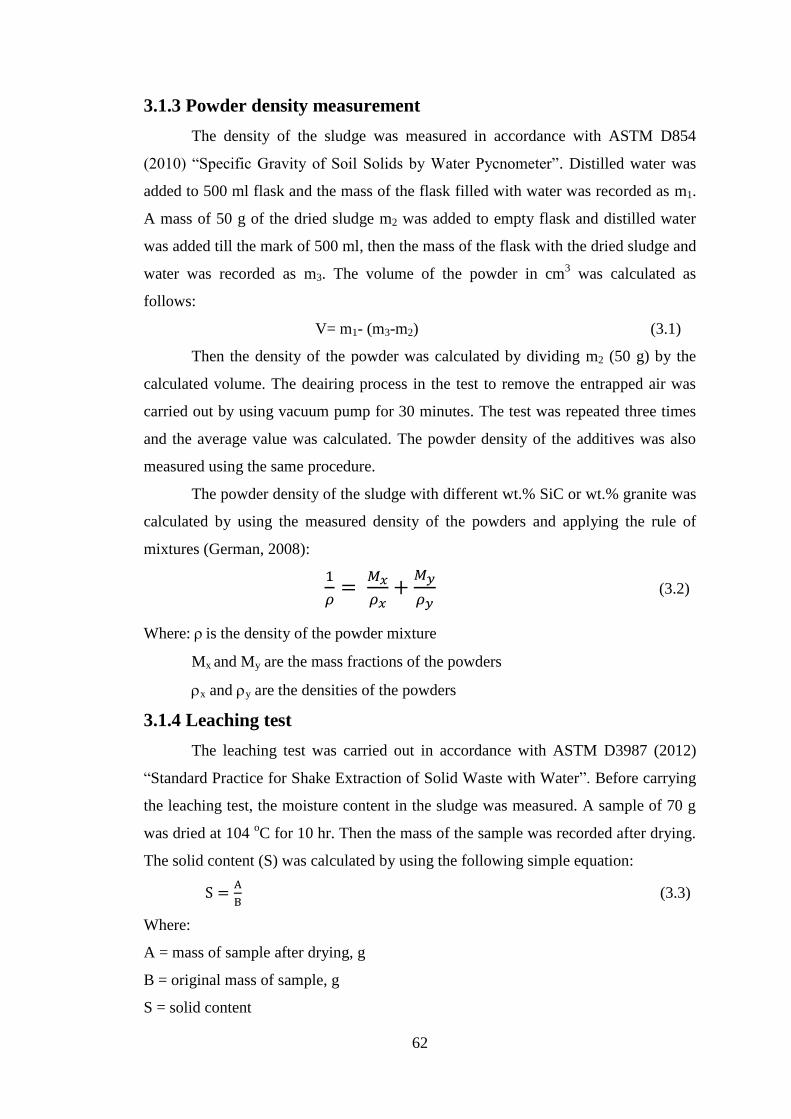
62
3.1.3 Powder density measurement
The density of the sludge was measured in accordance with ASTM D854
(2010) “Specific Gravity of Soil Solids by Water Pycnometer”. Distilled water was
added to 500 ml flask and the mass of the flask filled with water was recorded as m1.
A mass of 50 g of the dried sludge m2 was added to empty flask and distilled water
was added till the mark of 500 ml, then the mass of the flask with the dried sludge and
water was recorded as m3. The volume of the powder in cm3 was calculated as
follows:
V= m1- (m3-m2) (3.1)
Then the density of the powder was calculated by dividing m2 (50 g) by the
calculated volume. The deairing process in the test to remove the entrapped air was
carried out by using vacuum pump for 30 minutes. The test was repeated three times
and the average value was calculated. The powder density of the additives was also
measured using the same procedure.
The powder density of the sludge with different wt.% SiC or wt.% granite was
calculated by using the measured density of the powders and applying the rule of
mixtures (German, 2008):
(3.2)
Where: is the density of the powder mixture
Mx and My are the mass fractions of the powders
x and y are the densities of the powders
3.1.4 Leaching test
The leaching test was carried out in accordance with ASTM D3987 (2012)
“Standard Practice for Shake Extraction of Solid Waste with Water”. Before carrying
the leaching test, the moisture content in the sludge was measured. A sample of 70 g
was dried at 104 oC for 10 hr. Then the mass of the sample was recorded after drying.
The solid content (S) was calculated by using the following simple equation:
(3.3)
Where:
A = mass of sample after drying, g
B = original mass of sample, g
S = solid content
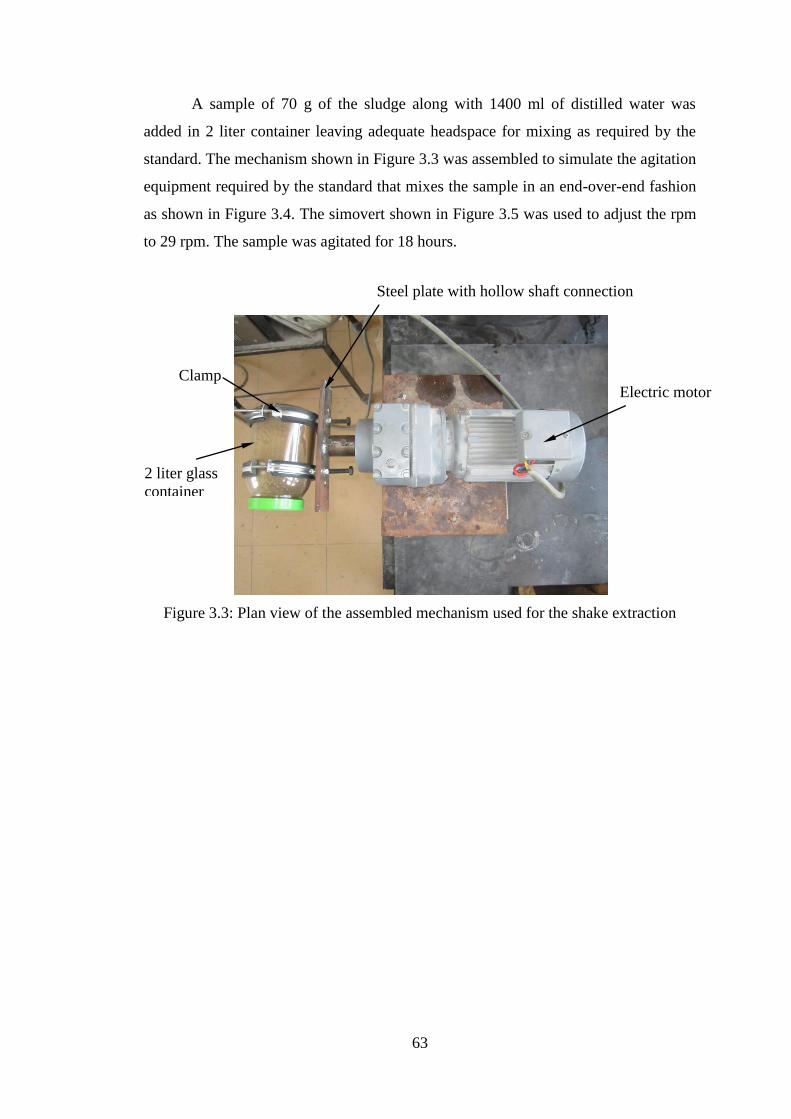
63
A sample of 70 g of the sludge along with 1400 ml of distilled water was
added in 2 liter container leaving adequate headspace for mixing as required by the
standard. The mechanism shown in Figure 3.3 was assembled to simulate the agitation
equipment required by the standard that mixes the sample in an end-over-end fashion
as shown in Figure 3.4. The simovert shown in Figure 3.5 was used to adjust the rpm
to 29 rpm. The sample was agitated for 18 hours.
Figure 3.3: Plan view of the assembled mechanism used for the shake extraction
Electric motor
Steel plate with hollow shaft connection
Clamp
2 liter glass
container
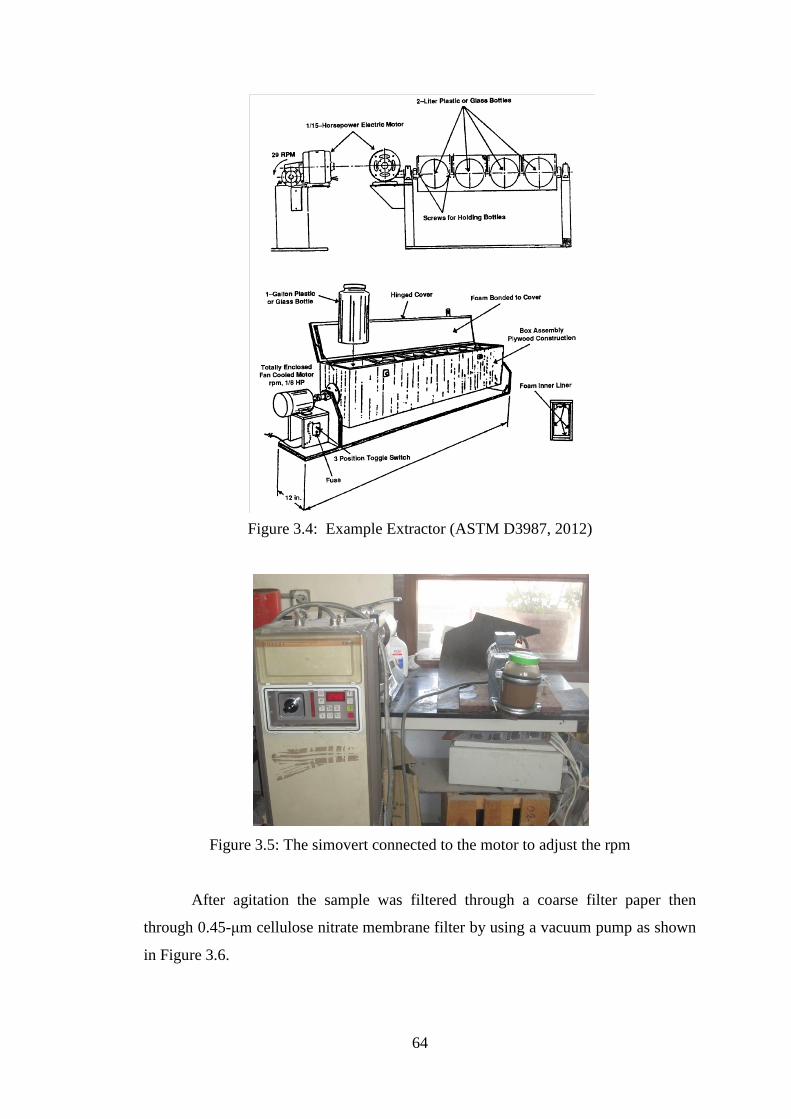
64
Figure 3.4: Example Extractor (ASTM D3987, 2012)
Figure 3.5: The simovert connected to the motor to adjust the rpm
After agitation the sample was filtered through a coarse filter paper then
through 0.45-μm cellulose nitrate membrane filter by using a vacuum pump as shown
in Figure 3.6.
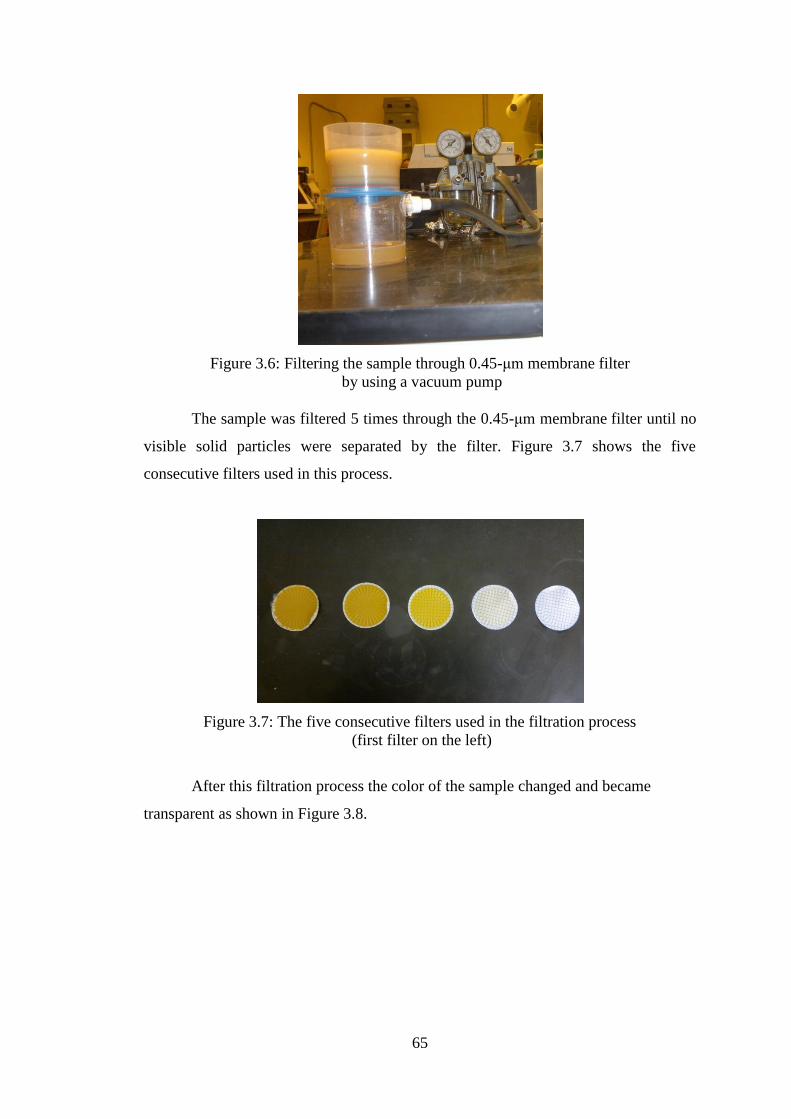
65
Figure 3.6: Filtering the sample through 0.45-μm membrane filter
by using a vacuum pump
The sample was filtered 5 times through the 0.45-μm membrane filter until no
visible solid particles were separated by the filter. Figure 3.7 shows the five
consecutive filters used in this process.
Figure 3.7: The five consecutive filters used in the filtration process
(first filter on the left)
After this filtration process the color of the sample changed and became
transparent as shown in Figure 3.8.
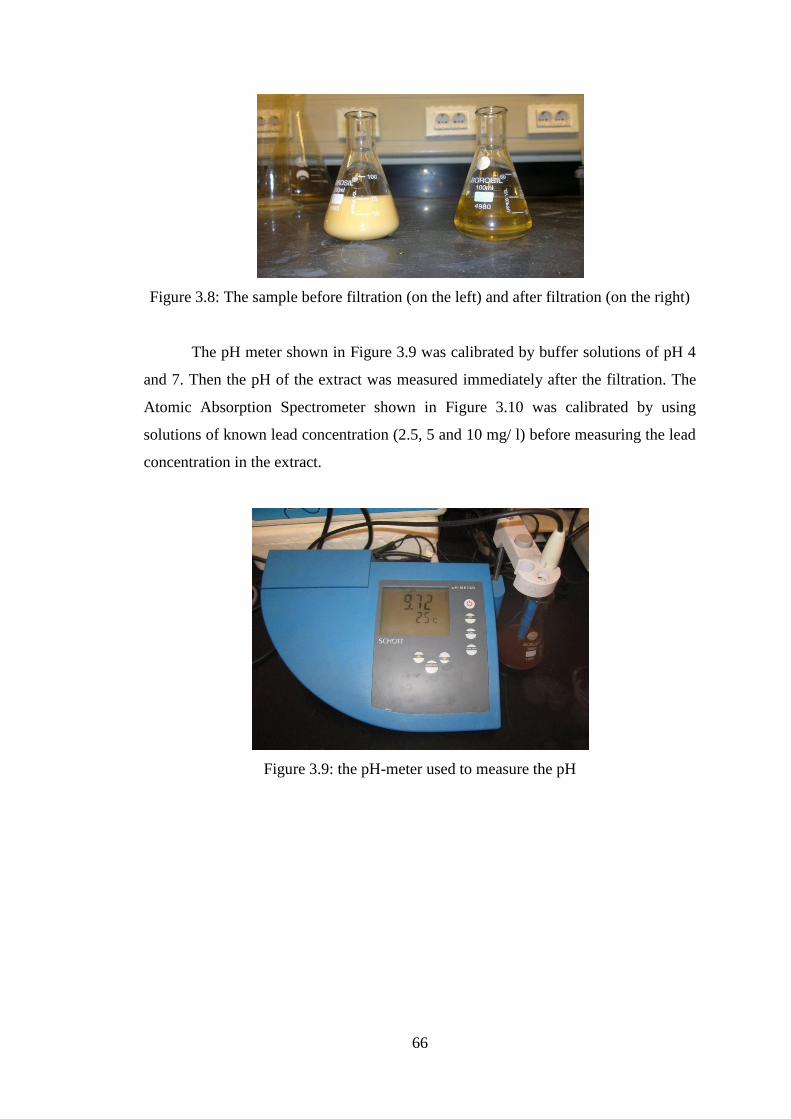
66
Figure 3.8: The sample before filtration (on the left) and after filtration (on the right)
The pH meter shown in Figure 3.9 was calibrated by buffer solutions of pH 4
and 7. Then the pH of the extract was measured immediately after the filtration. The
Atomic Absorption Spectrometer shown in Figure 3.10 was calibrated by using
solutions of known lead concentration (2.5, 5 and 10 mg/ l) before measuring the lead
concentration in the extract.
Figure 3.9: the pH-meter used to measure the pH

67
Figure 3.10: The Atomic Absorption Spectrometer used to
measure the lead concentration
The test was repeated three times and in each time the pH value and the lead
concentration were measured and the average value was calculated.
3.2 Foam Glass Preparation Procedure
The sludge coming from the plant included agglomerated parts. Thus, the
rotary mixer with metallic blades shown in Figure 3.11 was used to obtain the sludge
powder.
Figure 3.11: Rotary mixer to obtain the sludge powder
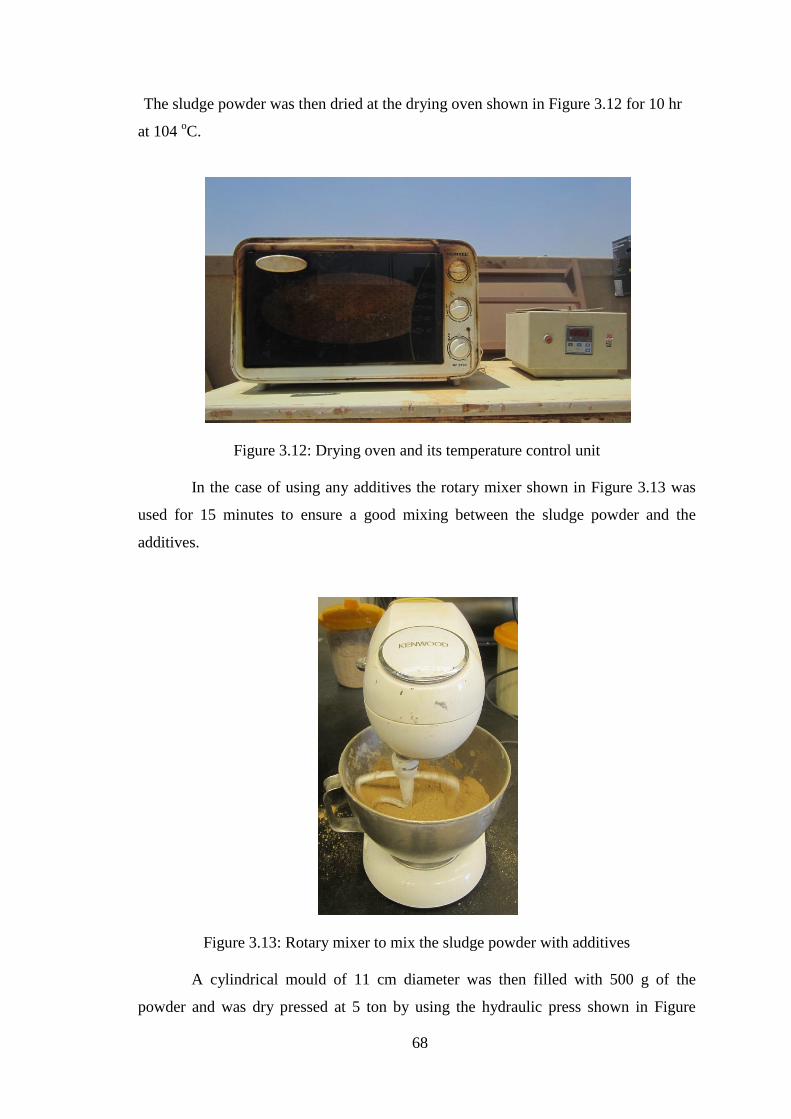
68
The sludge powder was then dried at the drying oven shown in Figure 3.12 for 10 hr
at 104 oC.
Figure 3.12: Drying oven and its temperature control unit
In the case of using any additives the rotary mixer shown in Figure 3.13 was
used for 15 minutes to ensure a good mixing between the sludge powder and the
additives.
Figure 3.13: Rotary mixer to mix the sludge powder with additives
A cylindrical mould of 11 cm diameter was then filled with 500 g of the
powder and was dry pressed at 5 ton by using the hydraulic press shown in Figure
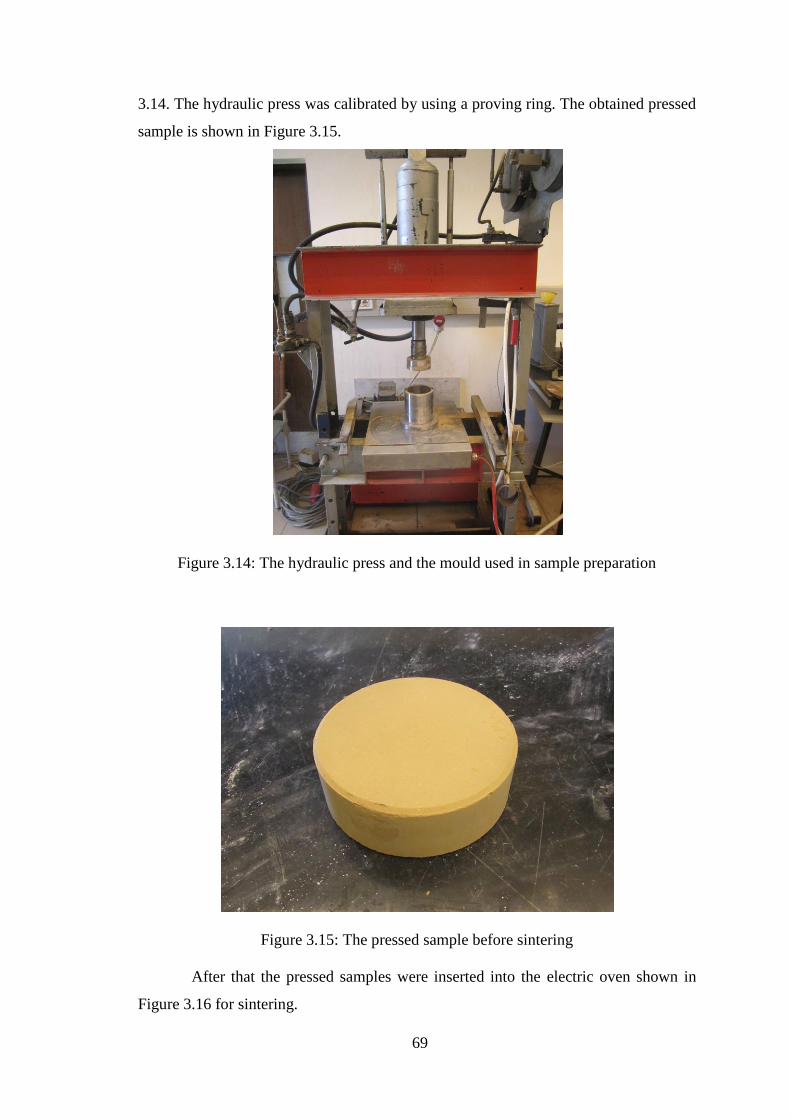
69
3.14. The hydraulic press was calibrated by using a proving ring. The obtained pressed
sample is shown in Figure 3.15.
Figure 3.14: The hydraulic press and the mould used in sample preparation
Figure 3.15: The pressed sample before sintering
After that the pressed samples were inserted into the electric oven shown in
Figure 3.16 for sintering.
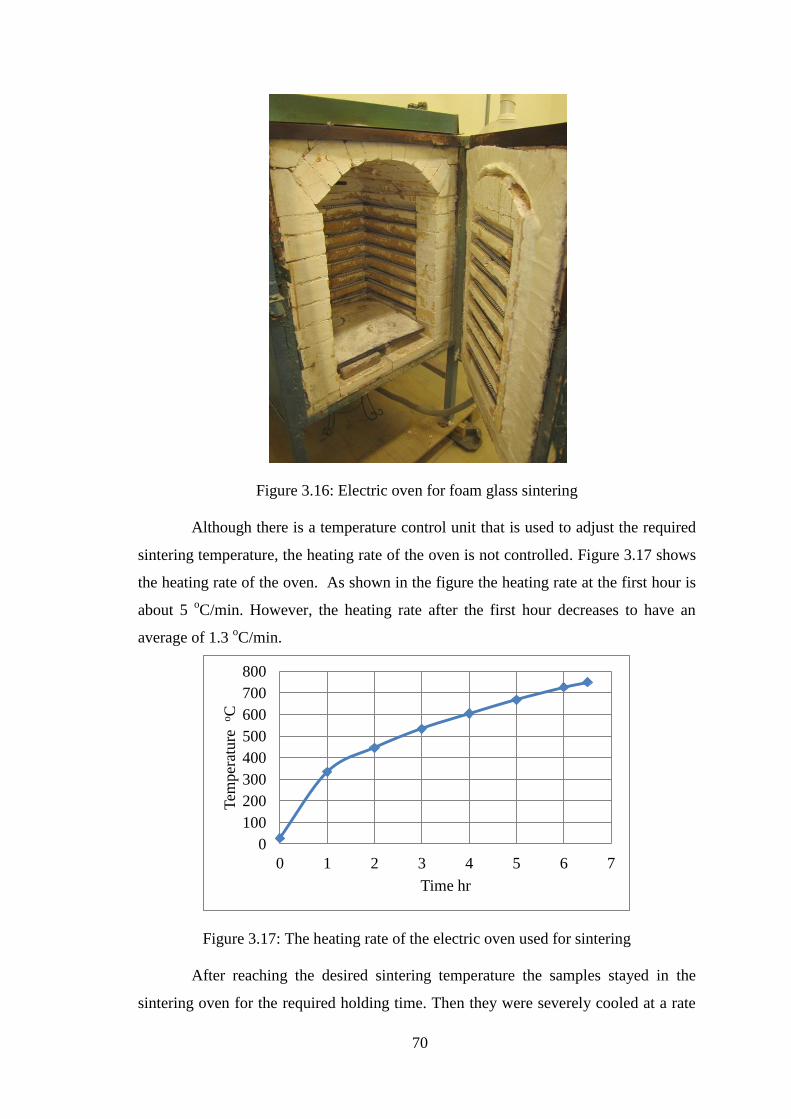
70
Figure 3.16: Electric oven for foam glass sintering
Although there is a temperature control unit that is used to adjust the required
sintering temperature, the heating rate of the oven is not controlled. Figure 3.17 shows
the heating rate of the oven. As shown in the figure the heating rate at the first hour is
about 5 oC/min. However, the heating rate after the first hour decreases to have an
average of 1.3 oC/min.
Figure 3.17: The heating rate of the electric oven used for sintering
After reaching the desired sintering temperature the samples stayed in the
sintering oven for the required holding time. Then they were severely cooled at a rate
0
100
200
300
400
500
600
700
800
0 1 2 3 4 5 6 7
Tem
per
ature
oC
Time hr

71
of approximately 20 oC/min to 600
oC. The aim of this severe cooling is to stop the
microstructure evolution. The samples were then cooled slowly with an average rate of
0.5 oC/min as shown in Figure 3.18 to provide some sort of annealing for the produced
foam glass. A sample of the produced foam glass is shown in Figure 3.19.
Figure 3.18: Slow cooling rate of foam glass
Figure 3.19: A sample of the produced foam glass
The foam glass samples were carefully cut with high precession to the desired
dimensions using the bench-type circular saw shown in Figure 3.20. Some samples
suffered from irregular large cavities. The samples selected for testing were carefully
chosen to avoid such flaws.
0
100
200
300
400
500
600
700
0 2 4 6 8 10 12 14 16
Tem
per
ature
oC
Time hr
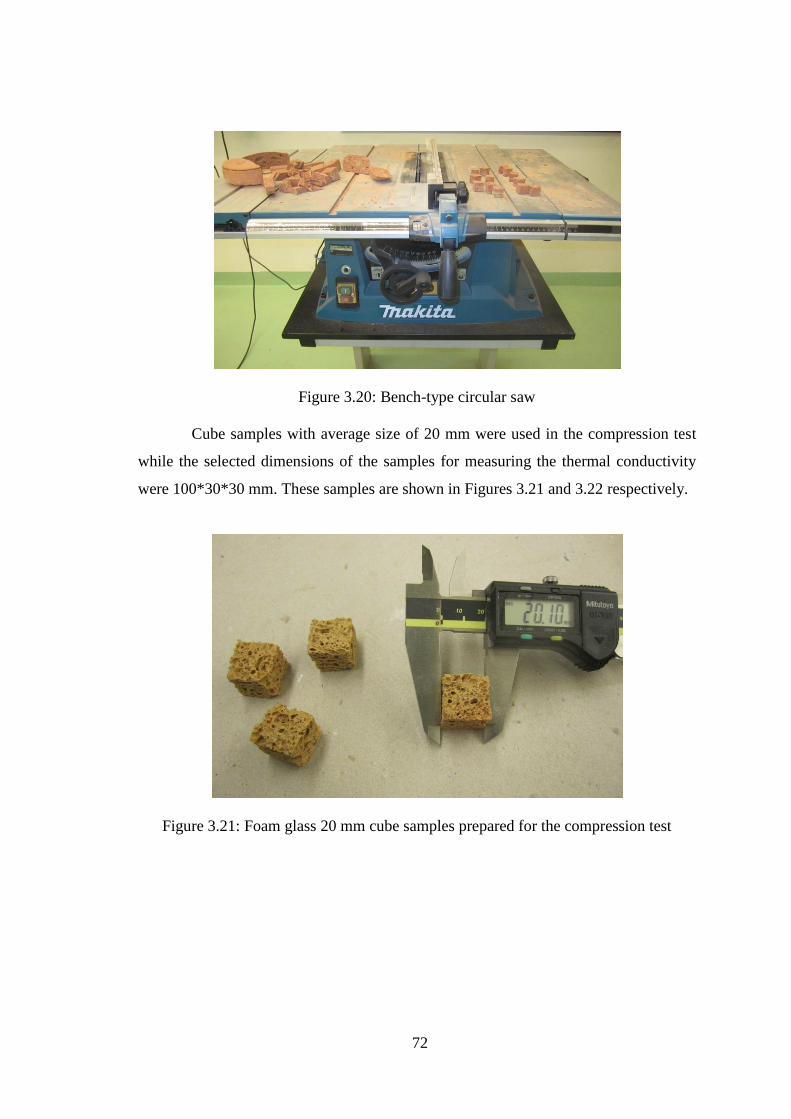
72
Figure 3.20: Bench-type circular saw
Cube samples with average size of 20 mm were used in the compression test
while the selected dimensions of the samples for measuring the thermal conductivity
were 100*30*30 mm. These samples are shown in Figures 3.21 and 3.22 respectively.
Figure 3.21: Foam glass 20 mm cube samples prepared for the compression test

73
Figure 3.22: Foam glass 100*30*30 mm samples prepared for
measuring the thermal conductivity
3.3 Experimental Matrix
The experimental matrix shown in Table 3.2 was adopted to investigate the
effect of the heating method, sintering temperature, holding time and the amount of
additives (SiC and granite powder) on the properties of the produced foam glass. All
the samples presented in the experimental matrix were prepared using the heating rate
of the available oven except for sapmple#4 that was directly inserted at 800 oC.
Table 3.2: Experimental matrix
Sample# Sintering
Temperature (oC)
Holding time
(min)
wt.% SiC
powder
wt.% granite
powder
1 700 30 - -
2 750 30 - -
3 800 30 - -
4 800 (direct insertion) 30 - -
5 850 30 - -
6 750 10 - -
7 750 20 - -
8 750 40 - -
9 750 30 2% -
10 750 30 4% -
11 750 30 6% -
12 750 30 8% -
13 750 30 - 2%
14 750 30 - 4%
15 750 30 - 6%
16 750 30 - 8%
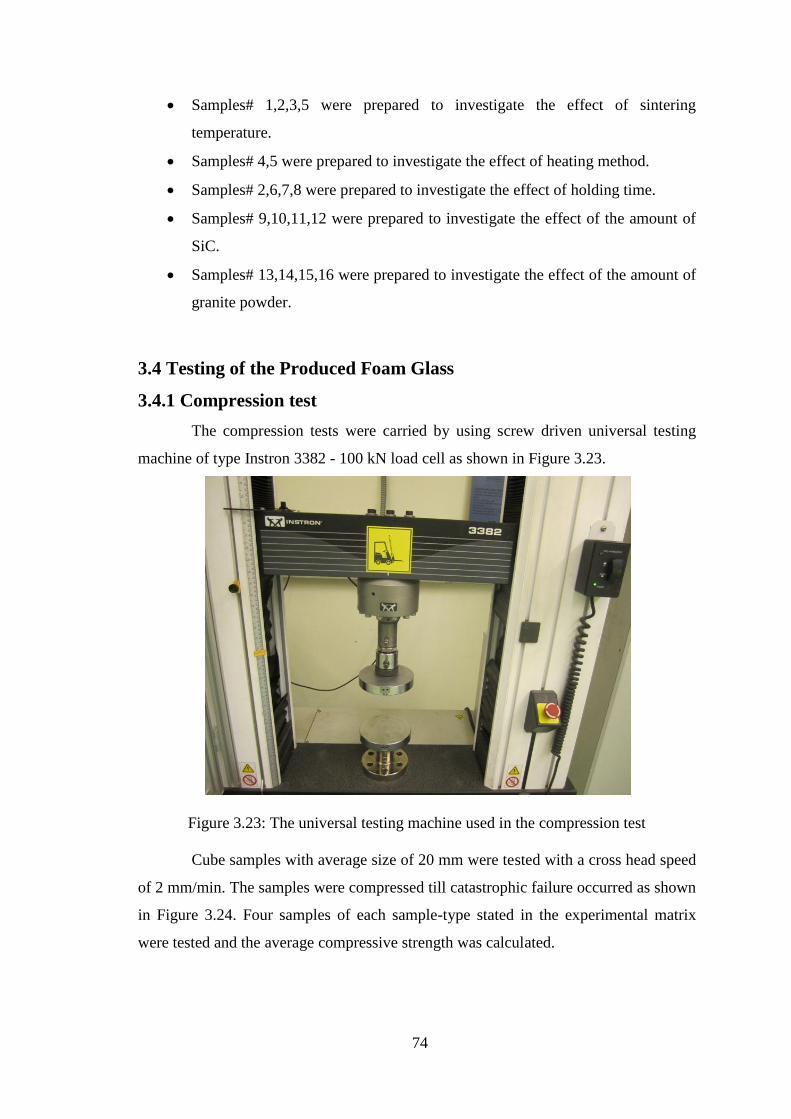
74
Samples# 1,2,3,5 were prepared to investigate the effect of sintering
temperature.
Samples# 4,5 were prepared to investigate the effect of heating method.
Samples# 2,6,7,8 were prepared to investigate the effect of holding time.
Samples# 9,10,11,12 were prepared to investigate the effect of the amount of
SiC.
Samples# 13,14,15,16 were prepared to investigate the effect of the amount of
granite powder.
3.4 Testing of the Produced Foam Glass
3.4.1 Compression test
The compression tests were carried by using screw driven universal testing
machine of type Instron 3382 - 100 kN load cell as shown in Figure 3.23.
Figure 3.23: The universal testing machine used in the compression test
Cube samples with average size of 20 mm were tested with a cross head speed
of 2 mm/min. The samples were compressed till catastrophic failure occurred as shown
in Figure 3.24. Four samples of each sample-type stated in the experimental matrix
were tested and the average compressive strength was calculated.
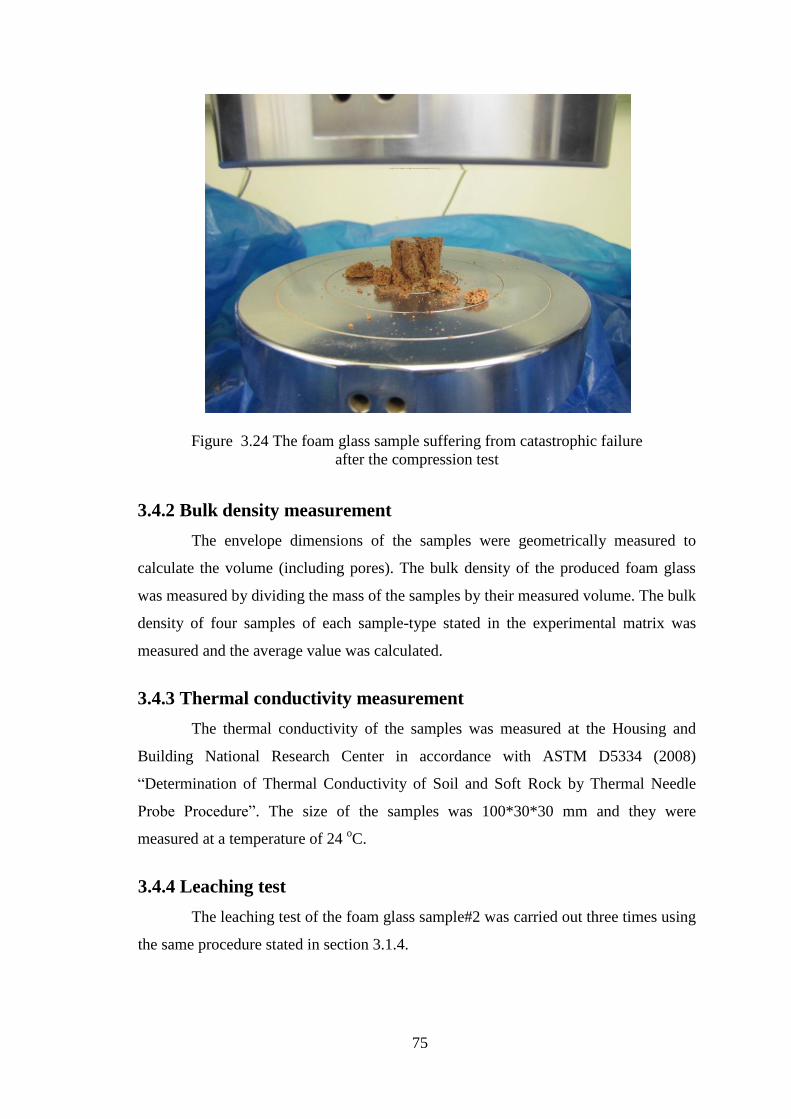
75
Figure 3.24 The foam glass sample suffering from catastrophic failure
after the compression test
3.4.2 Bulk density measurement
The envelope dimensions of the samples were geometrically measured to
calculate the volume (including pores). The bulk density of the produced foam glass
was measured by dividing the mass of the samples by their measured volume. The bulk
density of four samples of each sample-type stated in the experimental matrix was
measured and the average value was calculated.
3.4.3 Thermal conductivity measurement
The thermal conductivity of the samples was measured at the Housing and
Building National Research Center in accordance with ASTM D5334 (2008)
“Determination of Thermal Conductivity of Soil and Soft Rock by Thermal Needle
Probe Procedure”. The size of the samples was 100*30*30 mm and they were
measured at a temperature of 24 oC.
3.4.4 Leaching test
The leaching test of the foam glass sample#2 was carried out three times using
the same procedure stated in section 3.1.4.
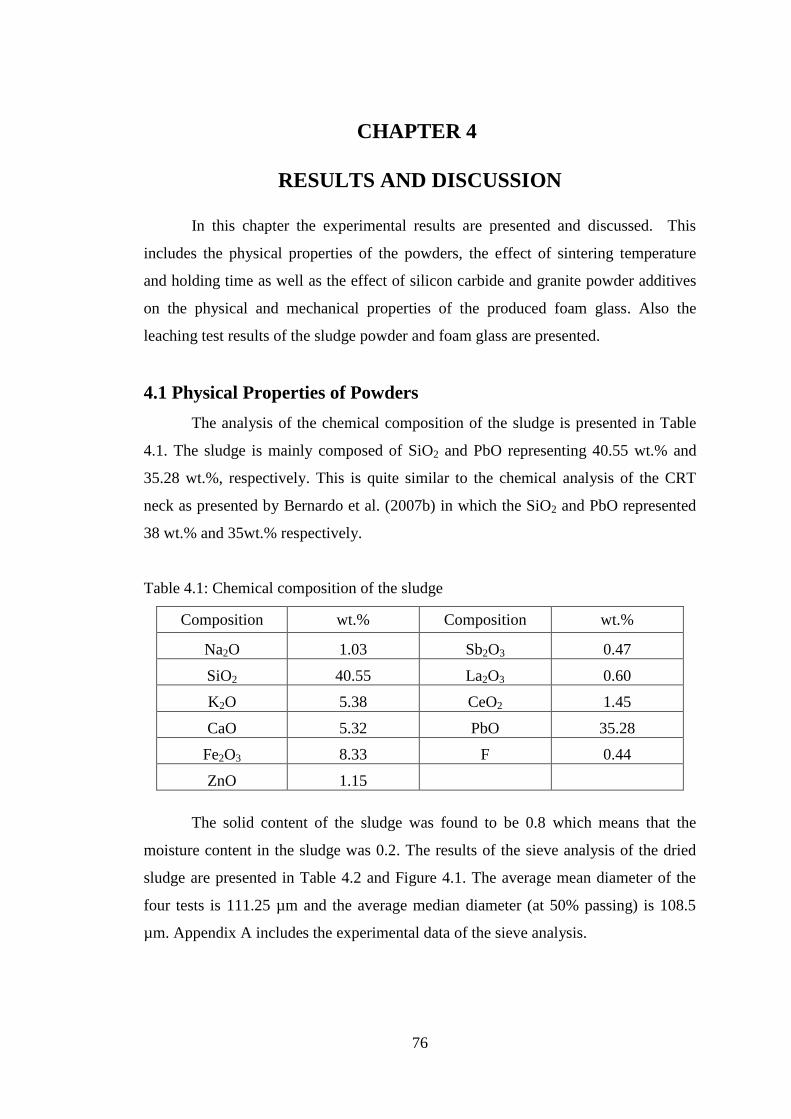
76
CHAPTER 4
RESULTS AND DISCUSSION
In this chapter the experimental results are presented and discussed. This
includes the physical properties of the powders, the effect of sintering temperature
and holding time as well as the effect of silicon carbide and granite powder additives
on the physical and mechanical properties of the produced foam glass. Also the
leaching test results of the sludge powder and foam glass are presented.
4.1 Physical Properties of Powders
The analysis of the chemical composition of the sludge is presented in Table
4.1. The sludge is mainly composed of SiO2 and PbO representing 40.55 wt.% and
35.28 wt.%, respectively. This is quite similar to the chemical analysis of the CRT
neck as presented by Bernardo et al. (2007b) in which the SiO2 and PbO represented
38 wt.% and 35wt.% respectively.
Table 4.1: Chemical composition of the sludge
Composition wt.% Composition wt.%
Na2O 1.03 Sb2O3 0.47
SiO2 40.55 La2O3 0.60
K2O 5.38 CeO2 1.45
CaO 5.32 PbO 35.28
Fe2O3 8.33 F 0.44
ZnO 1.15
The solid content of the sludge was found to be 0.8 which means that the
moisture content in the sludge was 0.2. The results of the sieve analysis of the dried
sludge are presented in Table 4.2 and Figure 4.1. The average mean diameter of the
four tests is 111.25 µm and the average median diameter (at 50% passing) is 108.5
µm. Appendix A includes the experimental data of the sieve analysis.

77
Table 4.2: Particle size of the sludge powder from sieve analysis tests
Tests Sludge powder diameters (µm)
16%
passing
50%
passing
84%
passing Mean diameter
Test I 82 110 148 113.33
Test II 80 108 145 111.00
Test III 80 108 143 110.33
Test IV 80 108 143 110.33
Average
108.5
111.25
STDEV
1.0
1.42
0
20
40
60
80
100
120
10100100010000
% P
assi
ng
Diameter (m)
Test I Test II Test III Test IV
Figure 4.1: Particle-size distribution of sludge using sieve analysis
The experimental results of the powder density of the sludge, SiC and granite
powders are shown in Table 4.3. The average values of three tests for each powder are
3.16, 3.28 and 2.79 g/cm3 respectively with maximum standard deviation of 0.062.
Table 4.3: The results of measured powder density ()
Powder Test
(g/cm3) STDEV
I II III
Sludge 3.23 3.13 3.13 3.16 0.058
SiC 3.21 3.33 3.3 3.28 0.062
Granite 2.78 2.78 2.81 2.79 0.017
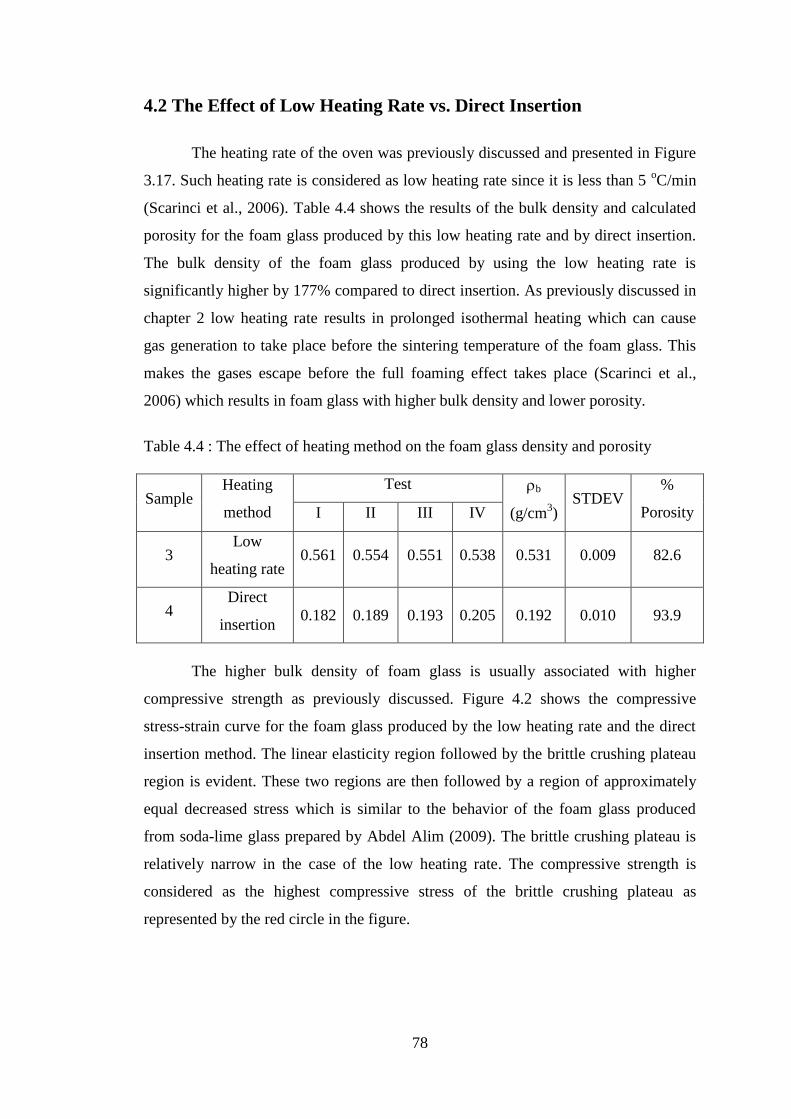
78
4.2 The Effect of Low Heating Rate vs. Direct Insertion
The heating rate of the oven was previously discussed and presented in Figure
3.17. Such heating rate is considered as low heating rate since it is less than 5 oC/min
(Scarinci et al., 2006). Table 4.4 shows the results of the bulk density and calculated
porosity for the foam glass produced by this low heating rate and by direct insertion.
The bulk density of the foam glass produced by using the low heating rate is
significantly higher by 177% compared to direct insertion. As previously discussed in
chapter 2 low heating rate results in prolonged isothermal heating which can cause
gas generation to take place before the sintering temperature of the foam glass. This
makes the gases escape before the full foaming effect takes place (Scarinci et al.,
2006) which results in foam glass with higher bulk density and lower porosity.
Table 4.4 : The effect of heating method on the foam glass density and porosity
Sample Heating
method
Test b
(g/cm3)
STDEV %
Porosity I II III IV
3 Low
heating rate 0.561 0.554 0.551 0.538 0.531 0.009 82.6
4 Direct
insertion 0.182 0.189 0.193 0.205 0.192 0.010 93.9
The higher bulk density of foam glass is usually associated with higher
compressive strength as previously discussed. Figure 4.2 shows the compressive
stress-strain curve for the foam glass produced by the low heating rate and the direct
insertion method. The linear elasticity region followed by the brittle crushing plateau
region is evident. These two regions are then followed by a region of approximately
equal decreased stress which is similar to the behavior of the foam glass produced
from soda-lime glass prepared by Abdel Alim (2009). The brittle crushing plateau is
relatively narrow in the case of the low heating rate. The compressive strength is
considered as the highest compressive stress of the brittle crushing plateau as
represented by the red circle in the figure.
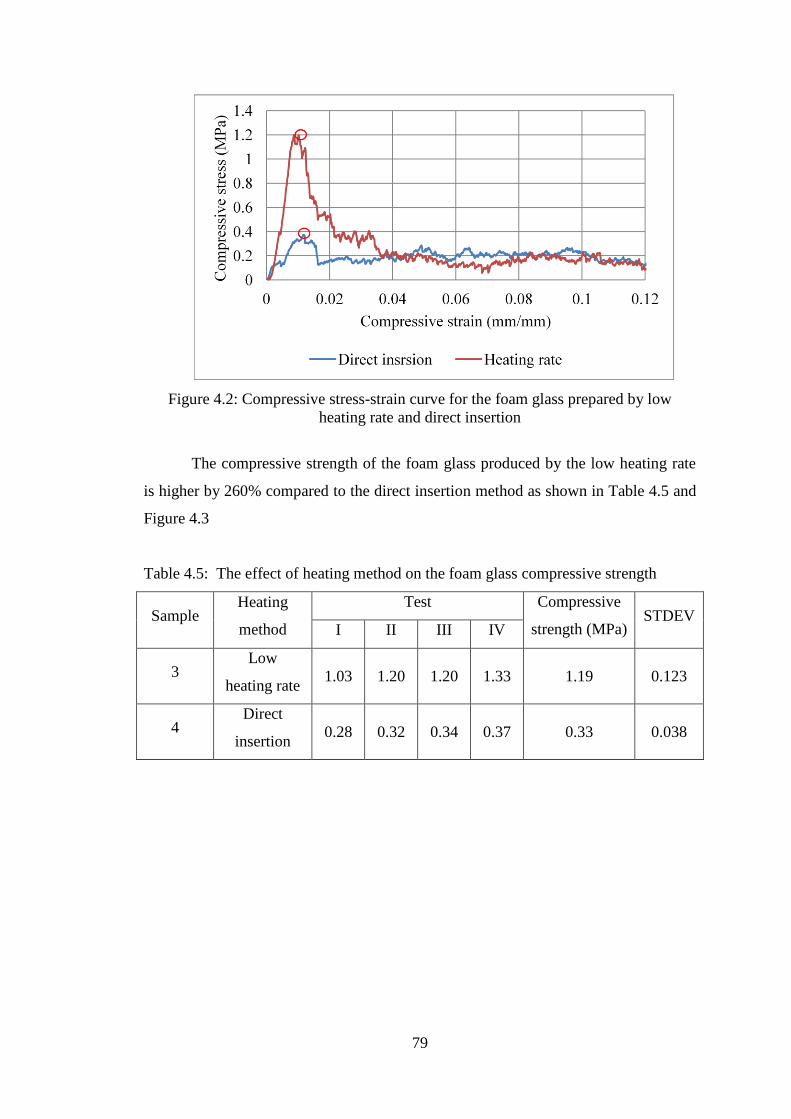
79
Figure 4.2: Compressive stress-strain curve for the foam glass prepared by low
heating rate and direct insertion
The compressive strength of the foam glass produced by the low heating rate
is higher by 260% compared to the direct insertion method as shown in Table 4.5 and
Figure 4.3
Table 4.5: The effect of heating method on the foam glass compressive strength
Sample Heating
method
Test Compressive
strength (MPa) STDEV
I II III IV
3 Low
heating rate 1.03 1.20 1.20 1.33 1.19 0.123
4 Direct
insertion 0.28 0.32 0.34 0.37 0.33 0.038

80
Figure 4.3: The effect of low heating rate and direct insertion on
the foam glass properties
The aforementioned results show that low heating rate results in higher bulk
density while direct insertion results in lower compressive strength. The low heating
rate was chosen as the heating methodology throughout this research and the effect of
the sintering temperature, holding time as well as SiC and granite powder additives on
the properties of the produced foam glass will be investigated.
4.3 The Effect of Sintering Temperature
on the Foam Glass Properties
The effect of sintering temperature on the foam glass produced from the
sludge powder without any additives at holding time of 30 min was investigated.
Foam glass was successfully produced at temperatures of 700, 750 and 800 oC while
at a higher temperature of 850 oC the foam was seriously cracked. The sludge contains
the foaming agent of calcium carbonate (CaCO3) due to the added lime stone during
the sedimentation process.
The results of bulk density and calculated porosity are shown in Table 4.6 and
Figure 4.4. As the sintering temperature increased from 700 to 750 oC, the bulk
density decreased by 44%, consequently the porosity increased by 16%. Further
increase of the sintering temperature from 750 to 800 oC leads to an increase in bulk
density by 10% and reduction in porosity by 2%. This can be attributed to the
coalescence phenomenon in which the cellular structure is coarsened due to
dissolving of smaller pores with larger ones resulting in foam glass with higher
0.531
0.826
1.19
0.192
0.939
0.33
0
0.2
0.4
0.6
0.8
1
1.2
1.4
Density (g/cm3) Porosity Comp. Strength (MPa)
Heating rate Direct insertion

81
density and lower compressive strength (Bernardo et al., 2007a; Brusatin et al., 2004).
Similar trend was observed for the foam glass prepared from panel glass by Fernandes
et al. (2013) when the sintering temperature increased beyond 725 oC.
Table 4.6: The variation of bulk density and porosity with sintering temperature
Sample Sintering
Temp. (oC)
Test b
(g/cm3)
STDEV % of
Porosity I II III IV
1 700 0.776 0.821 0.890 0.949 0.859 0.076 72.8
2 750 0.462 0.465 0.471 0.543 0.485 0.038 84.6
3 800 0.561 0.554 0.551 0.538 0.531 0.009 82.6
60
70
80
90
100
0.2
0.4
0.6
0.8
1
650 700 750 800 850
% P
oro
sity
Bulk
den
sity
(g/c
m3
)
Sintering temperature (oC)
Density Porosity
Figure 4.4: The variation of bulk density and porosity with sintering temperature
Figure 4.5 shows the compressive stress-strain curves at the studied sintering
temperatures. The curves exhibit a similar behavior to the compressive stress-strain
curves of the foam glass prepared by Tulyaganov et al. (2006) as previously presented
in Figure 2.27. It can be noticed that as the sintering temperature increases the brittle
crushing plateau becomes narrower.
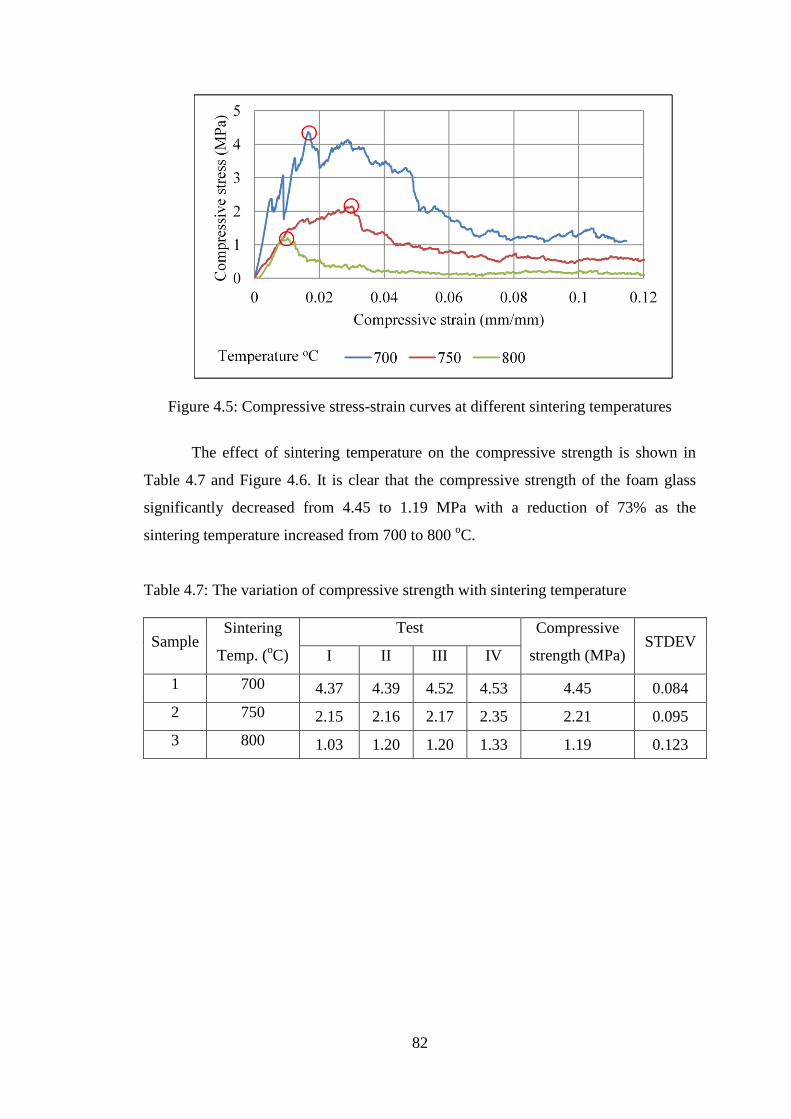
82
Figure 4.5: Compressive stress-strain curves at different sintering temperatures
The effect of sintering temperature on the compressive strength is shown in
Table 4.7 and Figure 4.6. It is clear that the compressive strength of the foam glass
significantly decreased from 4.45 to 1.19 MPa with a reduction of 73% as the
sintering temperature increased from 700 to 800 oC.
Table 4.7: The variation of compressive strength with sintering temperature
Sample Sintering
Temp. (oC)
Test Compressive
strength (MPa) STDEV
I II III IV
1 700 4.37 4.39 4.52 4.53 4.45 0.084
2 750 2.15 2.16 2.17 2.35 2.21 0.095
3 800 1.03 1.20 1.20 1.33 1.19 0.123
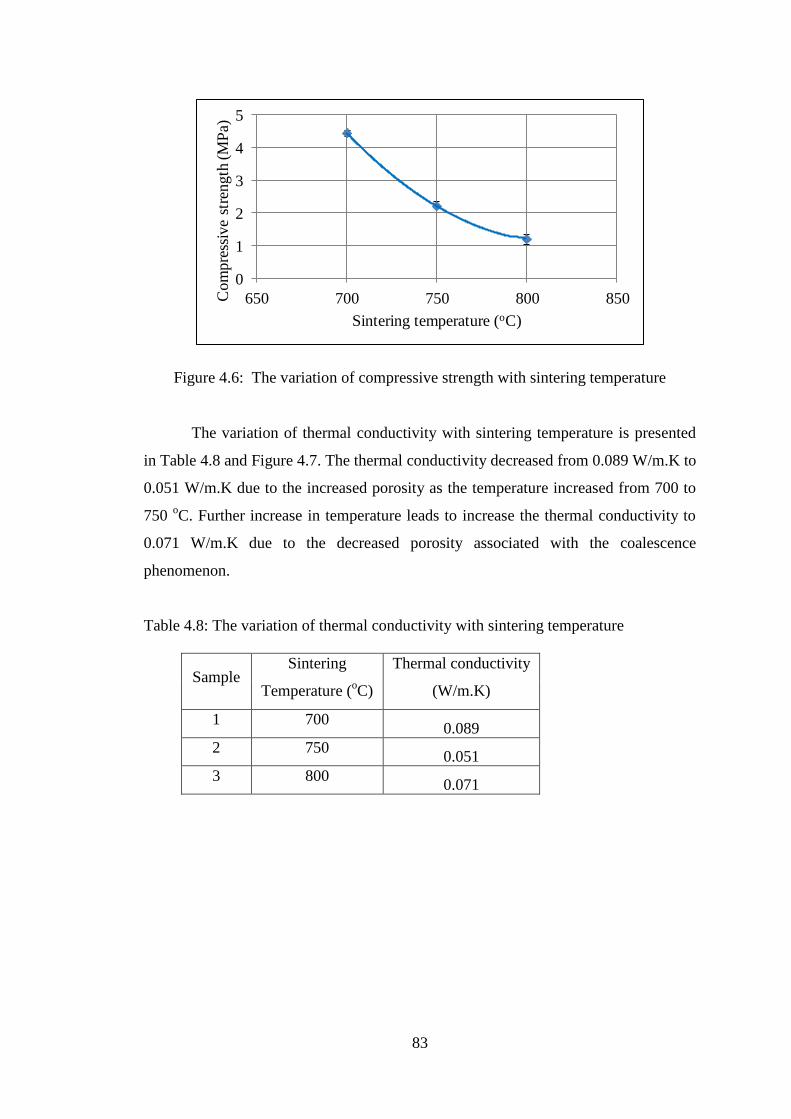
83
0
1
2
3
4
5
650 700 750 800 850Co
mp
ress
ive
stre
ng
th (
MP
a)
Sintering temperature (oC)
Figure 4.6: The variation of compressive strength with sintering temperature
The variation of thermal conductivity with sintering temperature is presented
in Table 4.8 and Figure 4.7. The thermal conductivity decreased from 0.089 W/m.K to
0.051 W/m.K due to the increased porosity as the temperature increased from 700 to
750 oC. Further increase in temperature leads to increase the thermal conductivity to
0.071 W/m.K due to the decreased porosity associated with the coalescence
phenomenon.
Table 4.8: The variation of thermal conductivity with sintering temperature
Sample Sintering
Temperature (oC)
Thermal conductivity
(W/m.K)
1 700 0.089
2 750 0.051
3 800 0.071
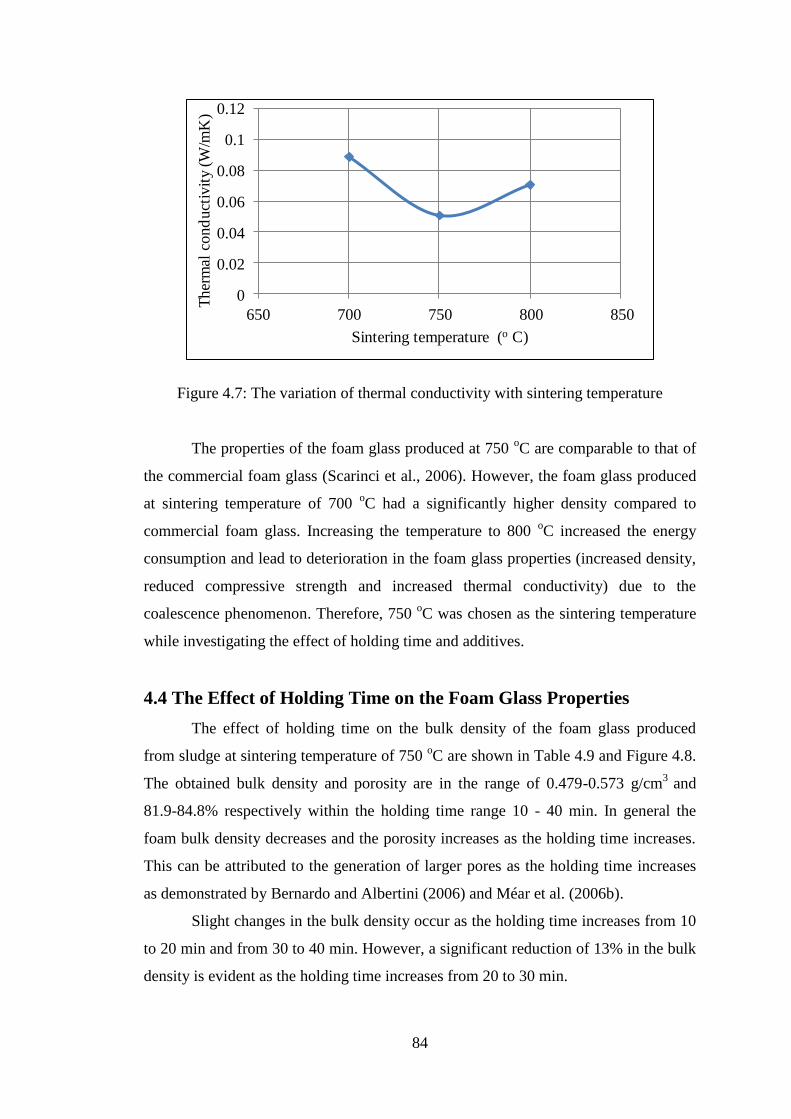
84
0
0.02
0.04
0.06
0.08
0.1
0.12
650 700 750 800 850
Ther
mal
cond
uct
ivit
y (W
/mK
)
Sintering temperature (o C)
Figure 4.7: The variation of thermal conductivity with sintering temperature
The properties of the foam glass produced at 750 oC are comparable to that of
the commercial foam glass (Scarinci et al., 2006). However, the foam glass produced
at sintering temperature of 700 oC had a significantly higher density compared to
commercial foam glass. Increasing the temperature to 800 oC increased the energy
consumption and lead to deterioration in the foam glass properties (increased density,
reduced compressive strength and increased thermal conductivity) due to the
coalescence phenomenon. Therefore, 750 oC was chosen as the sintering temperature
while investigating the effect of holding time and additives.
4.4 The Effect of Holding Time on the Foam Glass Properties
The effect of holding time on the bulk density of the foam glass produced
from sludge at sintering temperature of 750 oC are shown in Table 4.9 and Figure 4.8.
The obtained bulk density and porosity are in the range of 0.479-0.573 g/cm3
and
81.9-84.8% respectively within the holding time range 10 - 40 min. In general the
foam bulk density decreases and the porosity increases as the holding time increases.
This can be attributed to the generation of larger pores as the holding time increases
as demonstrated by Bernardo and Albertini (2006) and Méar et al. (2006b).
Slight changes in the bulk density occur as the holding time increases from 10
to 20 min and from 30 to 40 min. However, a significant reduction of 13% in the bulk
density is evident as the holding time increases from 20 to 30 min.

85
Table 4.9: The variation of bulk density and porosity with holding time
Sample Holding
time (min)
Test b
(g/cm3)
STDEV % of
Porosity I II III IV
6 10 0.546 0.573 0.586 0.586 0.573 0.019 81.9
7 20 0.542 0.549 0.567 0.573 0.558 0.015 82.4
2 30 0.462 0.465 0.471 0.543 0.485 0.038 84.6
8 40 0.453 0.473 0.490 0.499 0.479 0.017 84.8
70
75
80
85
90
0.40
0.50
0.60
0.70
0.80
0 10 20 30 40 50
% P
oro
sity
Bulk
den
sity
(g/c
m3
)
Holding time (min)
Density Prosity
Figure 4.8: The variation of bulk density and porosity with holding time
Figure 4.9 shows the compressive stress-strain curves at different holding
times. The curves have the three regions of linear elasticity, brittle crushing plateau as
well as the region of approximately equal decreased stress. At holding time of 10 min.
and 20 min. the brittle crushing plateau region is quite narrow, it starts to be wider as
the holding time increases to 30 and 40 min.
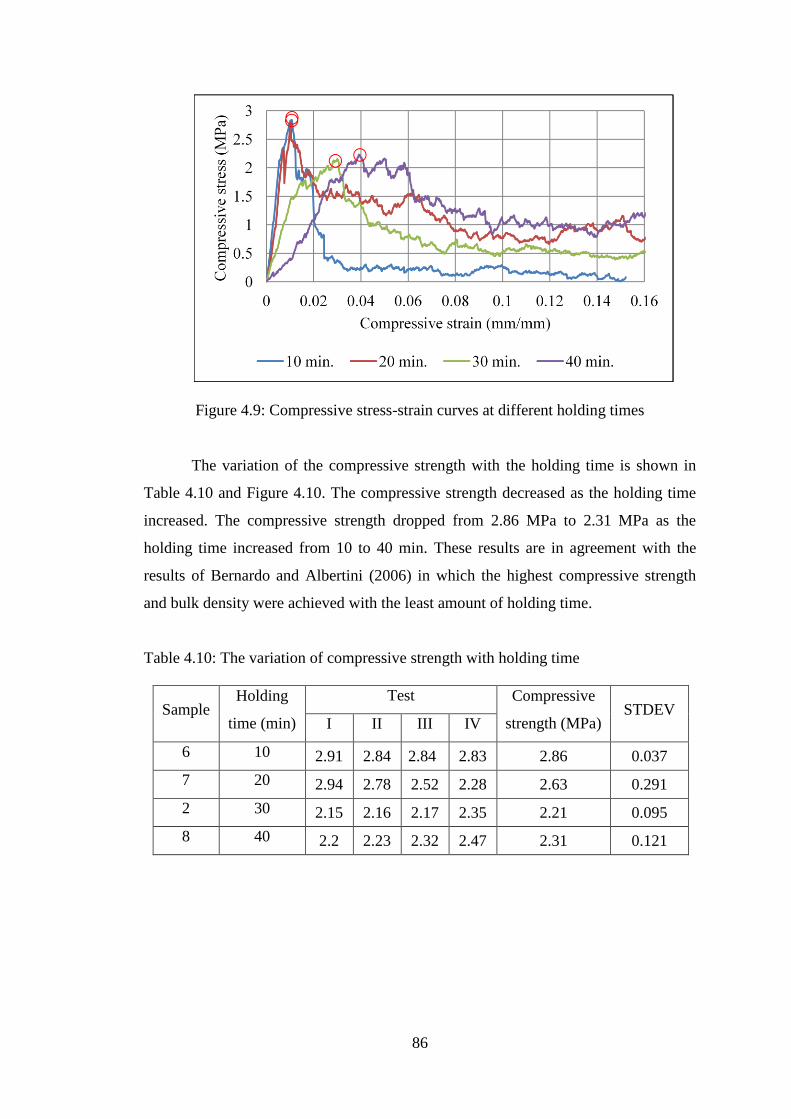
86
Figure 4.9: Compressive stress-strain curves at different holding times
The variation of the compressive strength with the holding time is shown in
Table 4.10 and Figure 4.10. The compressive strength decreased as the holding time
increased. The compressive strength dropped from 2.86 MPa to 2.31 MPa as the
holding time increased from 10 to 40 min. These results are in agreement with the
results of Bernardo and Albertini (2006) in which the highest compressive strength
and bulk density were achieved with the least amount of holding time.
Table 4.10: The variation of compressive strength with holding time
Sample Holding
time (min)
Test Compressive
strength (MPa) STDEV
I II III IV
6 10 2.91 2.84 2.84 2.83 2.86 0.037
7 20 2.94 2.78 2.52 2.28 2.63 0.291
2 30 2.15 2.16 2.17 2.35 2.21 0.095
8 40 2.2 2.23 2.32 2.47 2.31 0.121

87
0
1
2
3
4
0 10 20 30 40 50
Com
pre
ssiv
e st
reng
th (
MP
a)
Holding time (min)
Figure 4.10: The variation of compressive strength with holding time
The effect of holding time on the foam glass thermal conductivity is shown in
Table 4.11 and Figure 4.11. The thermal conductivity is in the range of 0.051-0.083
W/m.K. In general the thermal conductivity decreased with increasing the holding
time which can be attributed to the increased foam glass porosity.
Table 4.11: The variation of thermal conductivity with holding time
Sample Holding time
(min)
Thermal conductivity
(W/m.K)
6 10 0.067
7 20 0.083
2 30 0.051
8 40 0.058

88
0
0.02
0.04
0.06
0.08
0.1
0 10 20 30 40 50Ther
mal
cond
uct
ivit
y (W
/m.K
)
Holding time (min)
Figure 4.11: The variation of thermal conductivity with holding time.
Increasing the holding time to 30 minutes resulted in a lighter foam glass with
reduced thermal conductivity. On the other hand, the compressive strength was
reduced, but its value is still within the range of the commercial foam glass (Scarinci
et al., 2006). Further increase of the holding time to 40 min showed insignificant
changes in the foam glass properties while increasing the energy consumption. Thus,
the holding time of 30 min was selected for the purpose of energy saving while
investigating the effect of SiC and granite powder additives.
4.5 The Effect of Silicon Carbide Additive
on the Foam Glass Properties
The effect of wt.% silicon carbide (SiC) as foaming agent on the bulk density
and porosity of the produced foam glass at sintering temperature of 750 oC and
holding time of 30 min. is presented in Table 4.12 and Figure 4.12. Also, the
calculated powder density of the sludge with different wt.% SiC is shown in Table
4.12.
The addition of 2% of SiC to the sludge leads to produce foam glass with a
bulk density lower than that produced without any SiC by 31 % and increases the
porosity by 6%. A reduction of 9% in the bulk density is evident as the SiC content
increases from 2% to 6%. Adding 8% SiC results in a significant decrease of about
47% in the bulk density compared to the foam glass produced without any SiC. A
similar trend was observed while increasing the foaming agent content in previous
studies (Fernandes et al. ,2013 ; Bernardo and Albertini , 2006). The reduction in the

89
bulk density as shown in Figure 4.12 can be attributed to the generation of larger
pores as the amount of wt.% SiC increases as demonstrated by Bernardo et al. (2007a)
and Méar et al. (2006b).
Table 4.12: The variation of bulk density and porosity with SiC content
Sample wt.%
SiC
Test b
(g/cm3)
STDEV
(g/cm3)
% of
Porosity I II III IV
2 0 0.462 0.465 0.471 0.543 0.485 0.038 3.160 84.6
9 2 0.312 0.340 0.342 0.343 0.334 0.015 3.162 89.4
10 4 0.311 0.312 0.325 0.326 0.319 0.008 3.165 89.9
11 6 0.281 0.309 0.310 0.318 0.305 0.016 3.167 90.4
12 8 0.241 0.255 0.260 0.270 0.256 0.012 3.169 91.9
80
85
90
95
100
0.1
0.2
0.3
0.4
0.5
0.6
0 2 4 6 8 10
% P
oro
sity
Bu
lk d
ensi
ty (
g/c
m3
)
wt. % SiC
Density Porosity
Figure 4.12: The variation of bulk density and porosity with SiC content
The compressive stress-strain curves with different wt.% of SiC are shown in Figure
4.13. The figure shows the three different regions that occur during the compression of
elastic-brittle foams as previously discussed.

90
Figure 4.13: Compressive stress-strain curves at different wt.% SiC
The effect of SiC content on the compressive strength is presented in Table
4.13 and Figure 4.14. The addition of 2% of SiC reduces the compressive strength
from 2.21 to 1.44 MPa by 35%. Further increase of SiC from 2 to 4% leads to drop
the compressive strength from 1.44 to 1.07 by 26%. However, insignificant reduction
in the compressive strength is evident at SiC greater than 4%.
Table 4.13: The variation of compressive strength with SiC content
Sample wt%
SiC
Test Compressive
strength (MPa) STDEV
I II III IV
2 0 2.15 2.16 2.17 2.35 2.21 0.095
9 2 1.39 1.42 1.47 1.49 1.44 0.046
10 4 0.98 1.0 1.06 1.25 1.07 0.123
11 6 0.86 0.99 1.05 1.11 1.00 0.107
12 8 0.79 0.89 0.94 0.95 0.89 0.073
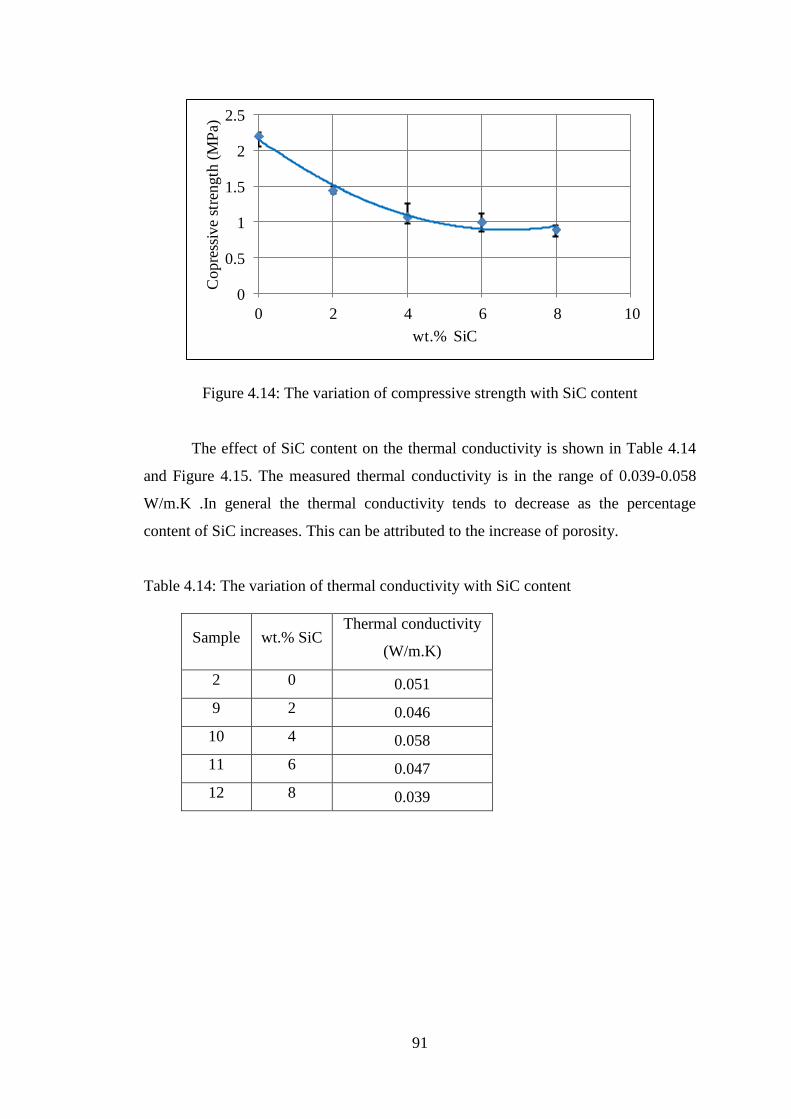
91
0
0.5
1
1.5
2
2.5
0 2 4 6 8 10
Copre
ssiv
e st
rength
(M
Pa)
wt.% SiC
Figure 4.14: The variation of compressive strength with SiC content
The effect of SiC content on the thermal conductivity is shown in Table 4.14
and Figure 4.15. The measured thermal conductivity is in the range of 0.039-0.058
W/m.K .In general the thermal conductivity tends to decrease as the percentage
content of SiC increases. This can be attributed to the increase of porosity.
Table 4.14: The variation of thermal conductivity with SiC content
Sample wt.% SiC Thermal conductivity
(W/m.K)
2 0 0.051
9 2 0.046
10 4 0.058
11 6 0.047
12 8 0.039
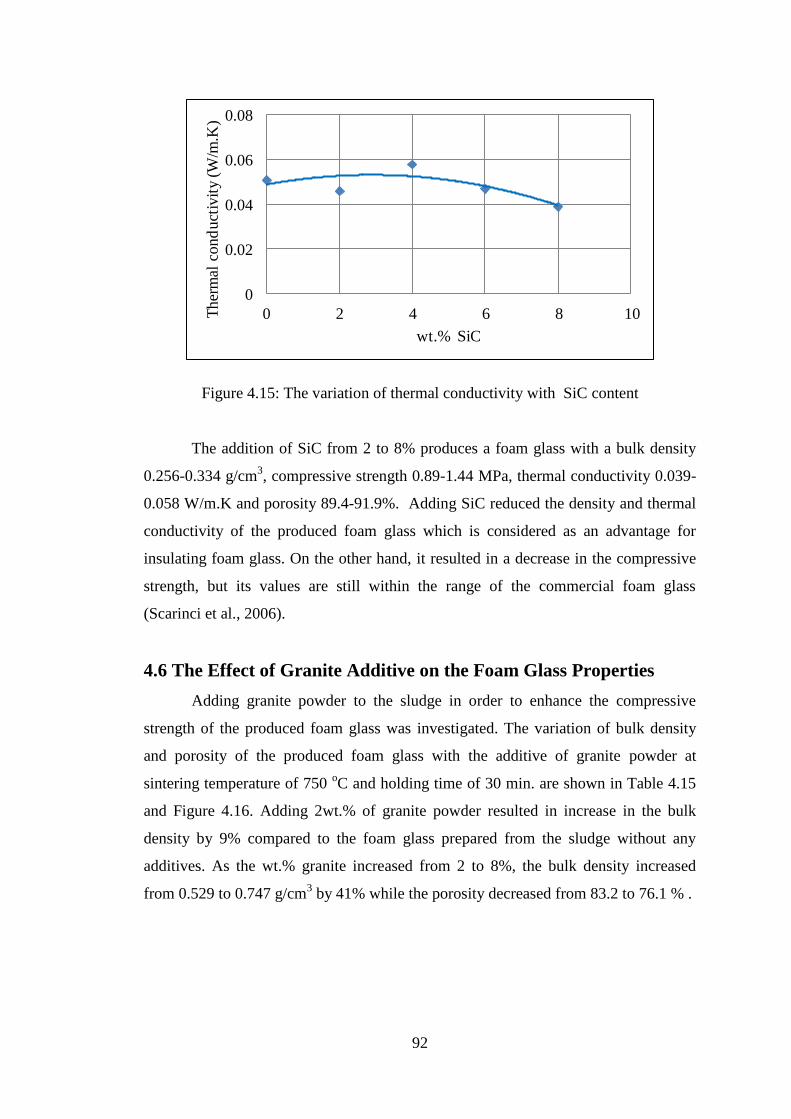
92
0
0.02
0.04
0.06
0.08
0 2 4 6 8 10Ther
mal
cond
uct
ivit
y (W
/m.K
)
wt.% SiC
Figure 4.15: The variation of thermal conductivity with SiC content
The addition of SiC from 2 to 8% produces a foam glass with a bulk density
0.256-0.334 g/cm3, compressive strength 0.89-1.44 MPa, thermal conductivity 0.039-
0.058 W/m.K and porosity 89.4-91.9%. Adding SiC reduced the density and thermal
conductivity of the produced foam glass which is considered as an advantage for
insulating foam glass. On the other hand, it resulted in a decrease in the compressive
strength, but its values are still within the range of the commercial foam glass
(Scarinci et al., 2006).
4.6 The Effect of Granite Additive on the Foam Glass Properties
Adding granite powder to the sludge in order to enhance the compressive
strength of the produced foam glass was investigated. The variation of bulk density
and porosity of the produced foam glass with the additive of granite powder at
sintering temperature of 750 oC and holding time of 30 min. are shown in Table 4.15
and Figure 4.16. Adding 2wt.% of granite powder resulted in increase in the bulk
density by 9% compared to the foam glass prepared from the sludge without any
additives. As the wt.% granite increased from 2 to 8%, the bulk density increased
from 0.529 to 0.747 g/cm3 by 41% while the porosity decreased from 83.2 to 76.1 % .
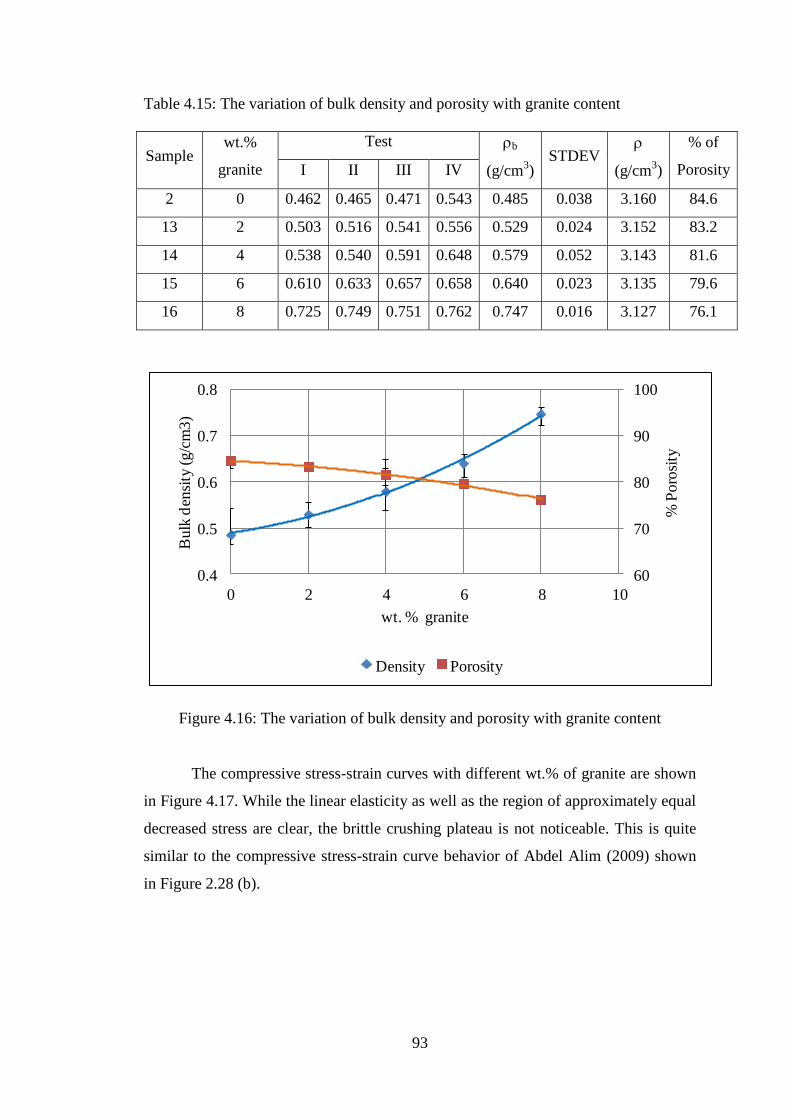
93
Table 4.15: The variation of bulk density and porosity with granite content
Sample wt.%
granite
Test b
(g/cm3)
STDEV
(g/cm3)
% of
Porosity I II III IV
2 0 0.462 0.465 0.471 0.543 0.485 0.038 3.160 84.6
13 2 0.503 0.516 0.541 0.556 0.529 0.024 3.152 83.2
14 4 0.538 0.540 0.591 0.648 0.579 0.052 3.143 81.6
15 6 0.610 0.633 0.657 0.658 0.640 0.023 3.135 79.6
16 8 0.725 0.749 0.751 0.762 0.747 0.016 3.127 76.1
60
70
80
90
100
0.4
0.5
0.6
0.7
0.8
0 2 4 6 8 10
% P
oro
sity
Bulk
den
sity
(g/c
m3
)
wt. % granite
Density Porosity
Figure 4.16: The variation of bulk density and porosity with granite content
The compressive stress-strain curves with different wt.% of granite are shown
in Figure 4.17. While the linear elasticity as well as the region of approximately equal
decreased stress are clear, the brittle crushing plateau is not noticeable. This is quite
similar to the compressive stress-strain curve behavior of Abdel Alim (2009) shown
in Figure 2.28 (b).

94
Figure 4.17: Compressive stress-strain curves at different wt.% granite
The presence of granite content increases the compressive strength of the foam
glass as shown in Table 4.16 and Figure 4.18. The compressive strength increased
from 2.43 to 5.09 MPa by 109% as the wt% granite increased from 2 to 8%.
Table 4.16: The variation of compressive strength with granite content
Sample wt.%
granite
Test Compressive
strength (MPa) STDEV
I II III IV
2 0 2.15 2.16 2.17 2.35 2.21 0.095
13 2 2.12 2.33 2.41 2.85 2.43 0.307
14 4 2.77 2.89 3.43 3.93 3.26 0.534
15 6 3.82 4.05 4.2 4.3 4.09 0.209
16 8 4.63 4.83 5.36 5.55 5.09 0.433
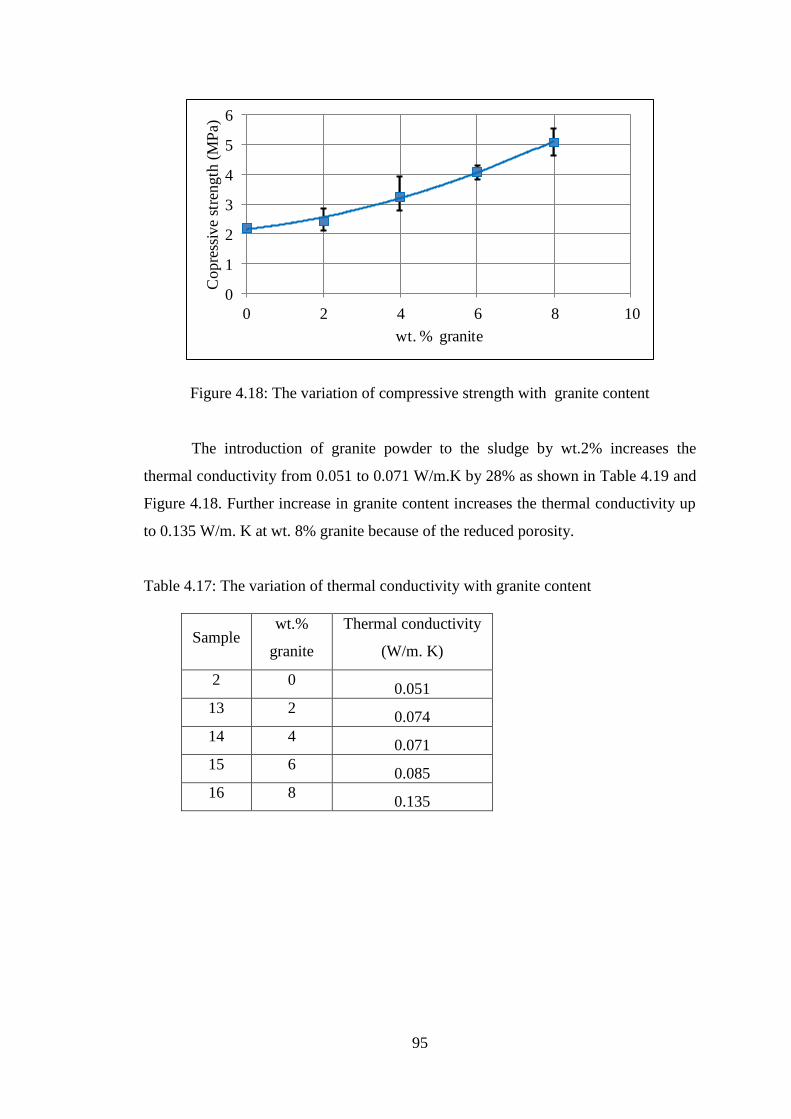
95
0
1
2
3
4
5
6
0 2 4 6 8 10
Copre
ssiv
e st
rength
(M
Pa)
wt. % granite
Figure 4.18: The variation of compressive strength with granite content
The introduction of granite powder to the sludge by wt.2% increases the
thermal conductivity from 0.051 to 0.071 W/m.K by 28% as shown in Table 4.19 and
Figure 4.18. Further increase in granite content increases the thermal conductivity up
to 0.135 W/m. K at wt. 8% granite because of the reduced porosity.
Table 4.17: The variation of thermal conductivity with granite content
Sample wt.%
granite
Thermal conductivity
(W/m. K)
2 0 0.051
13 2 0.074
14 4 0.071
15 6 0.085
16 8 0.135
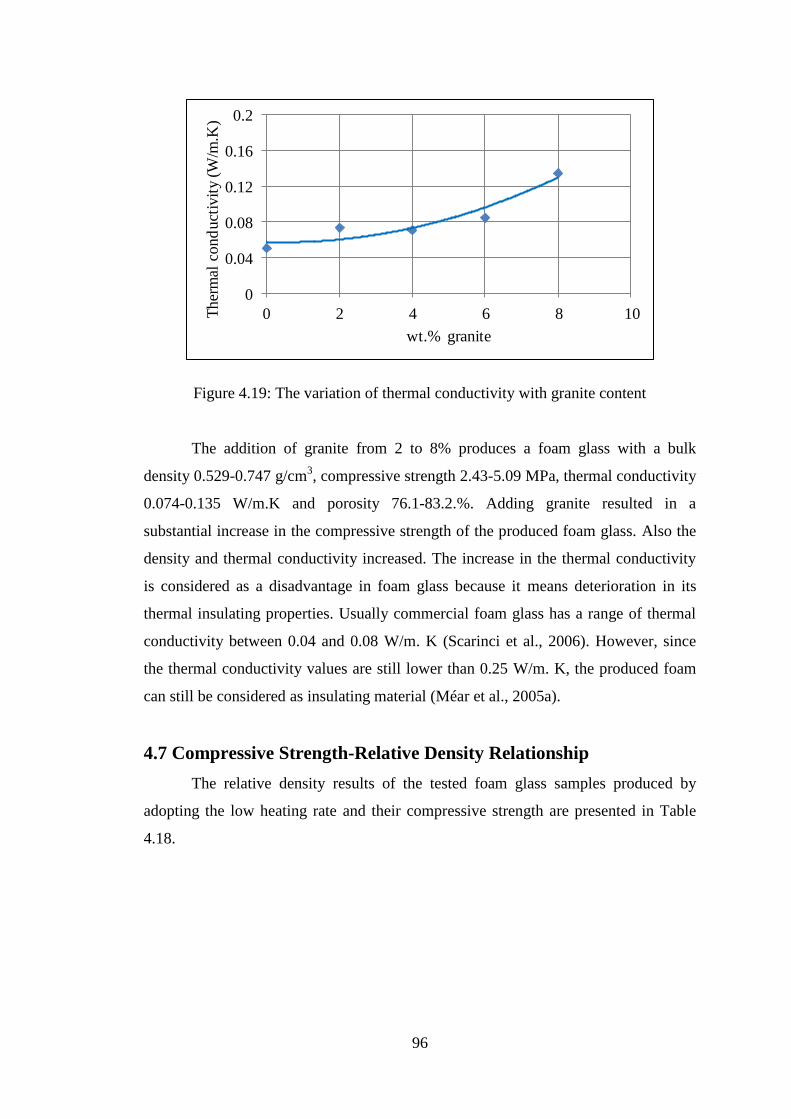
96
0
0.04
0.08
0.12
0.16
0.2
0 2 4 6 8 10Ther
mal
cond
uct
ivit
y (W
/m.K
)
wt.% granite
Figure 4.19: The variation of thermal conductivity with granite content
The addition of granite from 2 to 8% produces a foam glass with a bulk
density 0.529-0.747 g/cm3, compressive strength 2.43-5.09 MPa, thermal conductivity
0.074-0.135 W/m.K and porosity 76.1-83.2.%. Adding granite resulted in a
substantial increase in the compressive strength of the produced foam glass. Also the
density and thermal conductivity increased. The increase in the thermal conductivity
is considered as a disadvantage in foam glass because it means deterioration in its
thermal insulating properties. Usually commercial foam glass has a range of thermal
conductivity between 0.04 and 0.08 W/m. K (Scarinci et al., 2006). However, since
the thermal conductivity values are still lower than 0.25 W/m. K, the produced foam
can still be considered as insulating material (Méar et al., 2005a).
4.7 Compressive Strength-Relative Density Relationship
The relative density results of the tested foam glass samples produced by
adopting the low heating rate and their compressive strength are presented in Table
4.18.
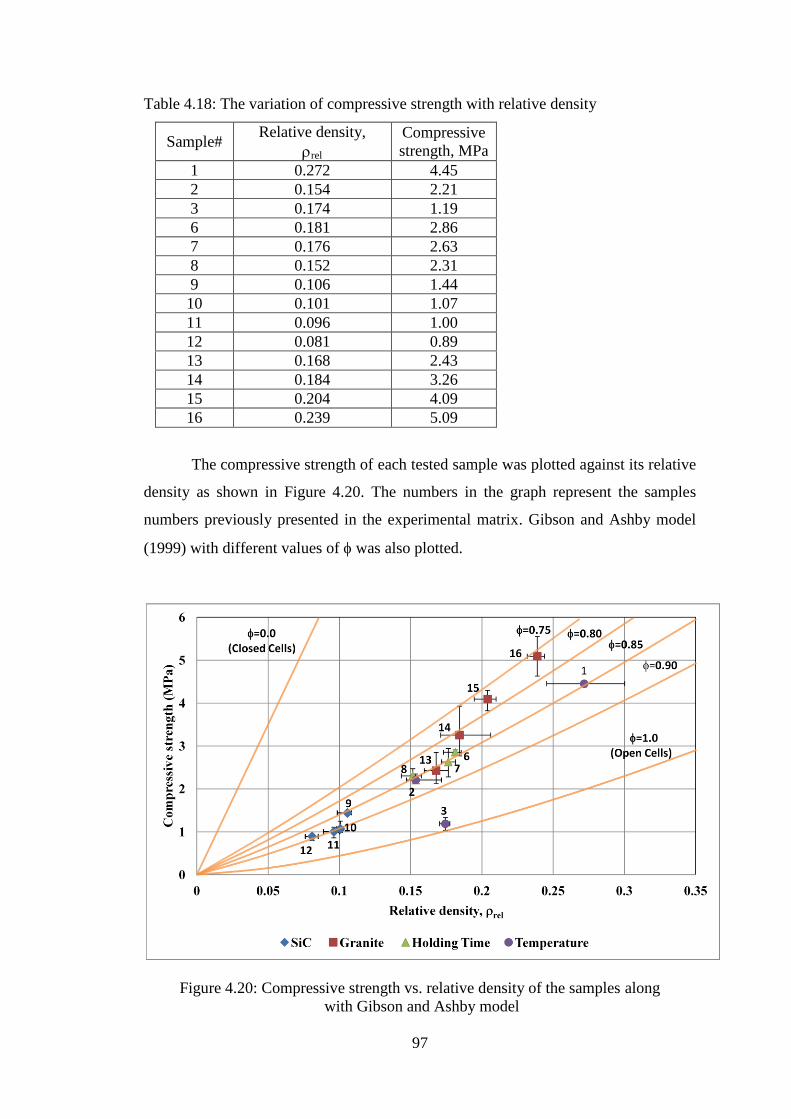
97
Table 4.18: The variation of compressive strength with relative density
Sample# Relative density,
rel
Compressive
strength, MPa
1 0.272 4.45
2 0.154 2.21
3 0.174 1.19
6 0.181 2.86
7 0.176 2.63
8 0.152 2.31
9 0.106 1.44
10 0.101 1.07
11 0.096 1.00
12 0.081 0.89
13 0.168 2.43
14 0.184 3.26
15 0.204 4.09
16 0.239 5.09
The compressive strength of each tested sample was plotted against its relative
density as shown in Figure 4.20. The numbers in the graph represent the samples
numbers previously presented in the experimental matrix. Gibson and Ashby model
(1999) with different values of was also plotted.
Figure 4.20: Compressive strength vs. relative density of the samples along
with Gibson and Ashby model
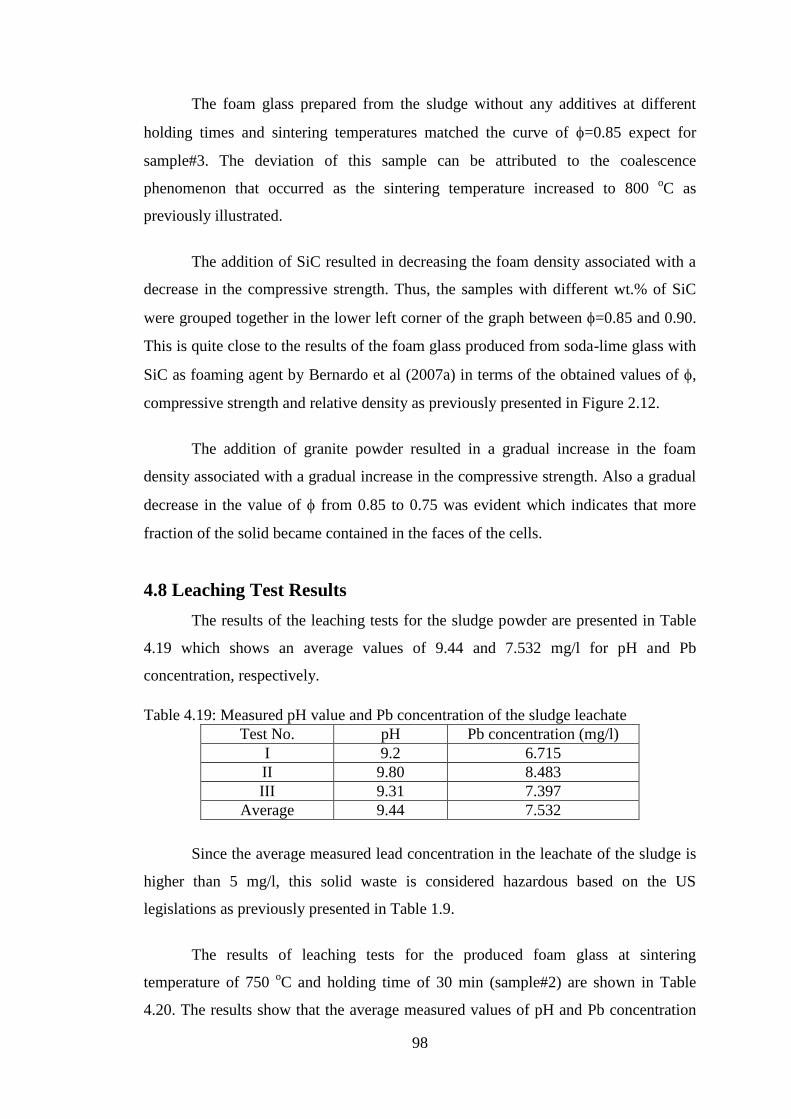
98
The foam glass prepared from the sludge without any additives at different
holding times and sintering temperatures matched the curve of =0.85 expect for
sample#3. The deviation of this sample can be attributed to the coalescence
phenomenon that occurred as the sintering temperature increased to 800 oC as
previously illustrated.
The addition of SiC resulted in decreasing the foam density associated with a
decrease in the compressive strength. Thus, the samples with different wt.% of SiC
were grouped together in the lower left corner of the graph between =0.85 and 0.90.
This is quite close to the results of the foam glass produced from soda-lime glass with
SiC as foaming agent by Bernardo et al (2007a) in terms of the obtained values of ,
compressive strength and relative density as previously presented in Figure 2.12.
The addition of granite powder resulted in a gradual increase in the foam
density associated with a gradual increase in the compressive strength. Also a gradual
decrease in the value of from 0.85 to 0.75 was evident which indicates that more
fraction of the solid became contained in the faces of the cells.
4.8 Leaching Test Results
The results of the leaching tests for the sludge powder are presented in Table
4.19 which shows an average values of 9.44 and 7.532 mg/l for pH and Pb
concentration, respectively.
Table 4.19: Measured pH value and Pb concentration of the sludge leachate
Test No. pH Pb concentration (mg/l)
I 9.2 6.715
II 9.80 8.483
III 9.31 7.397
Average 9.44 7.532
Since the average measured lead concentration in the leachate of the sludge is
higher than 5 mg/l, this solid waste is considered hazardous based on the US
legislations as previously presented in Table 1.9.
The results of leaching tests for the produced foam glass at sintering
temperature of 750 oC and holding time of 30 min (sample#2) are shown in Table
4.20. The results show that the average measured values of pH and Pb concentration

99
are 10.55 and 0.018 mg/l respectively. The results illustrate that the Pb concentration
in the leachate of the produced foam glass is very small compared with the maximum
allowable concentration of 5 mg/l.
Table 4.20: Measured pH value and Pb concentration of the leachate of foam glass
sample#2
Test No. pH Pb concentration (mg/l)
I 10.7 0.026
II 10.45 0.010
III 10.51 0.019
Average 10.55 0.018
This significant reduction in Pb concentration can be attributed to the reduced
surface area of the tested foam glass in comparison with the sludge powder that has an
average particle size of about 110 m. Moreover, the lead in the tested foam glass was
encapsulated which significantly reduced the amount of Pb released during the
leaching test. This result is in agreement with the leaching test results of the foam
glass prepared from CRT glass (65.7% panel + 34.3% Pb-glass) with 5% CaCO3 as
foaming agent by Bernardo et al (2005) in which the value of Pb concentration was
less than 0.02 mg/l.
100
CHAPTER 5
CONCLUSION AND RECOMMENDATIONS
5.1 Conclusion
The grinding and polishing sludge resulting from the lead crystal glass
industry represents an environmental challenge. The sludge used in this study has an
average mean particle size of 111.25 µm and is mainly composed of SiO2 and PbO
representing 40.55 wt.% and 35.28 wt.%, respectively. The leaching test of the sludge
showed that it is considered as hazardous waste since its leachate contains lead
concentration of more than 5 mg/l. Foam glass production from this sludge was
proved to be a promising cleaner production technique. Such innovative technique
leads to produce foam glass that is completely safe in terms of lead leaching and that
does not require special landfills at the end of its life. This was confirmed by the
leaching test of the produced foam glass which showed a negligible lead
concentration of less than 0.02 mg/l. Moreover, the open-recycling system presented
in this research is an environmental sustainable alternative to directing the sludge to
landfills in terms of resources conservation. Applying this open-recycling system on
an industrial scale will not only result in eliminating the costs associated with sludge
landfilling in hazardous landfills, but also it will provide a free raw material to a
secondary industry that depends on the sludge of the lead crystal glass plants.
The sintering temperature, holding time as well as SiC and granite powder
additives were proved to substantially affect the properties of the produced foam
glass. The heating method (i.e. direct insertion or low heating rate) was also proved to
have a significant effect. At 800 oC and holding time of 30 minutes, the low heating
rate adopted in this study was found to result in higher bulk density of 0.531 g/cm3
associated with higher compressive strength of 1.19 MPa compared to direct insertion
which was found to result in bulk density of 0.192 g/cm3 and compressive strength of
0.33 MPa.
The investigated sintering temperature range was from 700 to 800 oC with
holding time of 30 min. Increasing the sintering temperature beyond this range
101
resulted in severe cracks in the produced foam glass. The coalescence phenomenon
manifested in higher bulk density and lower compressive strength was observed at
800 oC. Thus, temperatures of 800
oC or higher should be avoided because it results in
deterioration of the foam glass properties while increasing the energy consumption.
The foam glass produced at 700 oC had a substantial high bulk density of 0.859 g/cm
3
compared to commercial foam glass. Increasing the sintering temperature to 750 oC
resulted in foam glass with comparable properties to that of the commercial foam
glass available in the market. The foam glass produced at 750 oC had bulk density of
0.485 g/cm3, porosity of 84.6%, compressive strength of 2.21 MPa and thermal
conductivity of 0.051 W/m. K. The relationship between compressive strength and
relative density for both the foam glass prepared at sintering temperature of 700 and
750 oC matched Gibson and Ashby model with =0.85 while it shifted to the open-
cell foam glass of =1.0 at 800 oC because of the coalescence phenomenon.
The effect of holding time was investigated at 10, 20, 30 and 40 min while
maintaining the sintering temperature at 750 oC. The change in the properties of the
produced foam glass from 10 to 20 min. and from 30 to 40 min was insignificant,
while significant change was evident when the holding time was increased from 20 to
30 min. Generally, increasing the holding time led to reduce the bulk density,
compressive strength and thermal conductivity. The properties of the produced foam
glass at all the holding times were comparable to commercial foam glass, however the
bulk density at 10 and 20 min had a relatively higher value of 0.586 and 0.573 g/cm3
respectively. The relationship between compressive strength and relative density for
all the investigated holding times matched Gibson and Ashby model with =0.85.
The effect of adding 2wt.%, 4wt.%, 6w.% and 8wt.% of SiC while
maintaining the sintering temperature at 750 oC and the holding time at 30 min was
investigated. As the amount of SiC increased, the bulk density, thermal conductivity
and compressive strength decreased. The foam glass prepared with 8wt.% SiC
represents the lightest foam glass produced and the one with the lowest thermal
conductivity throughout this study (while adopting the low heating rate method). It
has a bulk density of 0.256 g/cm3, porosity of 91.9% and thermal conductivity of
0.039 W/m. K. Although the compressive strength of this sample also represents the
102
lowest compressive strength, but its value of 0.95 MPa is still comparable to the
commercial foam glass available in the market. The relationship between compressive
strength and relative density of the produced foam glass with different SiC content
matched Gibson and Ashby model with in the range of 0.85-0.90.
The effect of adding 2wt.%, 4wt.%, 6w.% and 8wt.% of granite powder while
maintaining the sintering temperature at 750 oC and holding time at 30 min was
investigated. Granite powder worked as a compressive strength enhancing material.
As the content of granite powder increased, the compressive strength substantially
increased to reach to the highest value obtained throughout this study at 8wt.% with a
value of 5.09 MPa. This value is more than the double of the compressive strength of
the foam glass produced at the same sintering temperature and holding time without
any additives. On the other hand, adding granite powder led to reduce the foam
porosity to 76.1% and significantly increase its bulk density and thermal conductivity
to reach to 0.747 g/cm3 and 0.135 W/m. K, respectively. Such values are higher than
those of commercial foam glass, however the material can still be considered as
insulating material. Using Gibson and Ashby model shows that as the amount of
granite powder increased the samples shifted gradually to the closed-cell foam. At
8wt.% the foam glass had value of around 0.75.
It can be concluded that while the foam glass produced by adding SiC is
suitable to the applications that need very low thermal conductivity, the foam glass
produced by adding granite powder is suitable to the applications where compressive
strength is of more importance.
5.2 Recommendations for Future Work
Study the morphology of the produced foam glass by using Scanning Electron
Microscope SEM which can provide in-depth interpretation of the results.
Make a cost-benefit analysis for applying this innovative cleaner production
technique on industrial scale.
Study other properties of the produced foam glass such flexural strength, water
absorption and sound transmission loss.
103
Investigate the effect of adding a mixture of SiC and granite powder with
different percentages and ratios.
Study the effect of sintering temperature, holding time and SiC and granite
additives in the case of direct insertion.
Investigate the effect of adding oxidation promoter like MnO2 with SiC.
Narrow the intervals of sintering temperatures between 700 and 800 oC when
studying its effect on the produced foam glass.
Investigate the effect of sintering temperature, holding time and SiC and
granite additives on the lead leachate of the foam glass.
Study how to eliminate the large cavities appeared in some samples.
104
References
Abdel Alim, D. M. (2009). Production and characterization of foam glass from
container glass waste (MSc dissertation, The American University in Cairo AUC).
Ahmed, A. A., Youssof, I. M., Abbas, A. F., & Eleinen, O. A. (1998). Inhibition of
Pb-leaching from lead crystal glass by coating with films prepared by the sol-gel
method. Journal of sol-gel science and technology, 13(1-3), 753-756.
Andersson, L., Wingren, G., & Axelson, O. (1990). Some hygienic observations from
the glass industry. International archives of occupational and environmental
health, 62(3), 249-252.
ASTM C552 (2012). Standard Specification for Cellular Glass Thermal Insulation.
The American Society for Testing and Materials.
ASTM C165 (2012). Standard Test Method for Measuring Compressive Properties of
Thermal Insulations. The American Society for Testing and Materials.
ASTM D422 (2007). Standard Test Method for Particle-Size Analysis of Soils. The
American Society for Testing and Materials.
ASTM D5334 (2008). Standard Test Method for Determination of Thermal
Conductivity of Soil and Soft Rock by Thermal Needle Probe Procedure. American
Society for Testing and Materials. The American Society for Testing and Materials.
ASTM D854 (2010). Standard Test Methods for Specific Gravity of Soil Solids by
Water Pycnometer. The American Society for Testing and Materials.
ASTM D3987 (2012) Standard Practice for Shake Extraction of Solid Waste with
Water. The American Society for Testing and Materials.
Baba, A., & Türkman, A. (2001). Investigation of geochemical and leaching
characteristics of solid wastes from Yenikoy (Mugla-Turkey) Power Plant.Turkish
Journal of Engineering and Environmental Sciences, 25, 315-319.
Baba, A., & Kaya, A. (2004). Leaching characteristics of solid wastes from thermal
power plants of western Turkey and comparison of toxicity methodologies. Journal of
environmental management, 73(3), 199-207.
Barbee, S. J., & Constantine, L. A. (1994). Release of lead from crystal decanters
under conditions of normal use. Food and chemical toxicology, 32(3), 285-288.
Bernardo, E., Scarinci, G., & Hreglich, S. (2005). Foam glass as a way of recycling
glasses from cathode ray tubes. Glass science and technology,78(1), 7-11.
Bernardo, E., & Albertini, F. (2006). Glass foams from dismantled cathode ray
tubes. Ceramics international, 32(6), 603-608.

105
Bernardo, E., Cedro, R., Florean, M., & Hreglich, S. (2007a). Reutilization and
stabilization of wastes by the production of glass foams. Ceramics
international, 33(6), 963-968.
Bernardo, E., Scarinci, G., Hreglich, S., & Zangiacomi, G. (2007b). Effect of time and
furnace atmosphere on the sintering of glasses from dismantled cathode ray
tubes. Journal of the European Ceramic Society, 27(2), 1637-1643.
Bernardo, E., Scarinci, G., Bertuzzi, P., Ercole, P., & Ramon, L. (2010). Recycling of
waste glasses into partially crystallized glass foams. Journal of Porous
Materials, 17(3), 359-365.
Bodger, K. (2003). Fundamentals of Environmental Sampling. Rowman & Littlefield.
Brusatin, G., Bernardo, E., & Scarinci, G. (2004). Production of foam glass from glass
waste. In Sustainable Waste Management and Recycling. Proc. of the International
Conference Organized by the Concrete and Masonry Research, Kingston University,
London, London, UK, Thomas Telford Publishing (pp. 67-82).
Calera (2013), http://www.calera.com/site/beneficial-reuse-of-co2/products.html
(accessed 20 June 2013).
Callister, W. D., & Rethwisch, D. G. (2009). Materials science and engineering: an
introduction- eighth edition, John Wiley & Sons, Inc.
Chang, E. E., Chiang, P. C., Lu, P. H., & Ko, Y. W. (2001). Comparisons of metal
leachability for various wastes by extraction and leaching
methods.Chemosphere, 45(1), 91-99.
Chen, M., Zhang, F. S., & Zhu, J. (2011). A Novel Process for Foam Glass
Preparation from Waste CRT Panel Glass. In Recycling of Electronic Waste II:
Proceedings of the Second Symposium (pp. 95-102). John Wiley & Sons, Inc.
Coronado, D. (2003). Regulating Water Pollution in Ontario’s Municipalities –
Windsor’s Sewer Use By-law, available online
http://www.citizensenvironmentalliance.org/pdf/Regulating%20Water%20Pollution%
20At%20the%20Municipal%20Level.pdf (accessed 10 June 2013).
CPCB (1986) , Central Pollution Control Board, Gov. of India, The Environment
(Protection) Rules, available online
http://cpcb.nic.in/GeneralStandards.pdf (accessed 10 June 2013).
Cummings, K. (1997). Techniques of kiln-formed glass. University of Pennsylvania
Press.
Dararutana, P., & Sirikulrat, N. (2010). Lead-free high refractive index glass using
local Thai sands. Sonklanakarin Journal of Science and Technology,32(3), 315-319.
Davison, S. (2003), Conservation and Restoration of Glass-second edition, Elsevier.
106
Ebaretonbofa, E., & Evans, J. R. G. (2002). High porosity hydroxyapatite foam
scaffolds for bone substitute. Journal of Porous Materials, 9(4), 257-263.
Egemen, E., & Yurteri, C. (1996). Regulatory leaching tests for fly ash: A case
study. Waste management & research, 14(1), 43-50.
Eisenberg, S. H., Tittlebaum, M. E., Eaton, H. C., Soroczak, M. M. (1986). Chemical
characteristics of selected flyash leachates. Journal of Environmental Science &
Health Part A, 21(4), 383-402.
El-Haggar, S. (2007). Sustainable industrial design and waste management: cradle-to-
cradle for sustainable development. Elsevier.
El Kersh, H., El-Haggar, S., 2012. Towards sustainability through innovation.
Interdisciplinary Environmental Review 13 (2/3), 187–201.
El-Sayed, W. (2011), Encapsulation of lead containing industrial waste using a
chemically bonded phosphate ceramic, PhD thesis, Chemical Engineering, Cairo
University.
Energetics (2002), Glass industry of the future- Energy and Environmental Profile of
the U.S. Glass Industry, Prepared for U.S. Department of Energy Office of Industrial
Technologies, available online
http://www1.eere.energy.gov/manufacturing/resources/glass/pdfs/glass2002profile.pd
f (accessed 8 June 2013).
EU Directive 69/493/EEC (1969), Council directive of 15 December 1969 on the
approximation of the laws of the Member States relating to crystal glass, Official
Journal of the European Communities, No L 326/36, pp, 599-602, available online
http://eur-
lex.europa.eu/LexUriServ/LexUriServ.do?uri=DD:I:1969_II:31969L0493:EN:PDF
(accessed 7 June 2013).
Fernandes, H. R., Andreola, F., Barbieri, L., Lancellotti, I., Pascual, M. J., & Ferreira,
J. M. (2013). The use of egg shells to produce Cathode Ray Tube (CRT) glass
foams. Ceramics International, 39(8), 9071-9078.
Frieser, R. G. (1975). A review of solder glasses. Active and Passive Electronic
Components, 2(3), 163-199.
German, R.M. (2008).Handbook of Mathematical Relations in Particulate Materials
Processing. John Wiley & Sons, Inc. Page 228.
Geskin, E. S., Goldenberg, B., & Caudill, R. (2002). Development of advanced CRT
disassembly technology. IEEE International Symposium on Electronics and the
Environment, 249-253.
Gibson, L. J., & Ashby, M. F. (1999). Cellular solids: structure and properties.
Cambridge university press.

107
Graziano, J. H., & Blum, C. (1991). Lead exposure from lead crystal. The
Lancet, 337(8734), 141-142.
Guadagnino, E., Gambaro, M., Gramiccioni, L., Denaro, M., Feliciani, R., Baldini,
M., ... & Vinci, F. (2000). Estimation of lead intake from crystalware under
conditions of consumer use. Food Additives & Contaminants, 17(3), 205-218.
Guo, H. W., Gong, Y. X., & Gao, S. Y. (2010a). Preparation of high strength foam
glass–ceramics from waste cathode ray tube. Materials Letters, 64(8), 997-999.
Guo,H.W., Gong, Y. X.,Liu, X.N & Li Y.H., (2010b). Elaboration and mechanical
behavior of high strength foam glass. Journal of shaanxi university of science &
technology, 28 (3), 1-6.
Health Canada (2003), lead crystalware and your health, available online
http://www.porcupinehu.on.ca/Inspection/documents/leadcrystal_02_27_2007e.pdf
(accessed 15 June 2013).
Herat, S. (2008). Recycling of cathode ray tubes (CRTs) in electronic waste.CLEAN–
Soil, Air, Water, 36(1), 19-24.
Hight, S. C. (1996). Lead migration from lead crystal wine glasses. Food Additives &
Contaminants, 13(7), 747-765.
Hynes, M. J., & Jonson, B. (1997). Lead, glass and the environment. Chem. Soc.
Rev., 26(2), 133-146.
Hynes, M. J., Forde, S., & Jonson, B. (2004). Element migration from glass
compositions containing no added lead. Science of the total environment,319(1), 39-
52.
IFC (2007), Environmental, Health, and Safety Guidelines for Glass Manufacturing,
International Finance Corporation-World Bank Group report on 30 April 2007,
available online
http://www.ifc.org/wps/wcm/connect/384e20804885574ebc0cfe6a6515bb18/Final%2
B-%2BGlass%2BManufacturing.pdf?MOD=AJPERES&id=1323152002618
(accessed on 21 June 2013).
ISO 7086-1 (2000).Glass hollowware in contact with food- Release of lead and
cadmium- Part 1: Test method. International Organization for Standardization.
ISO 7086-2 (2000). Glass hollowware in contact with food- Release of lead and
cadmium-Part 2: Permissible limits. International Organization for Standardization.
ISO 7086-2 (1982). Glass hollowware in contact with food- Release of lead and
cadmium-Part 2: Permissible limits. International Organization for Standardization.
Jang, Y. C., & Townsend, T. G. (2003). Leaching of lead from computer printed wire
boards and cathode ray tubes by municipal solid waste landfill
leachates.Environmental Science & Technology, 37(20), 4778-4784.

108
Jones, S., Leighton, K., & Williams, L. (1992). Leachable lead from crystal
glassware. Food Australia, 44(8), 366-368.
Kang, S. K., & Choo, K. H. (2003). Use of MF and UF membranes for reclamation of
glass industry wastewater containing colloidal clay and glass particles. Journal of
membrane science, 223(1), 89-103.
KEMI (2007), Lead in articles– a government assignment reported by the Swedish
Chemicals Agency and the Swedish Environmental Protection Agency, Swedish
Chemicals Agency Report Nr 5/07, Available online
http://www.kemi.se/Documents/Publikationer/Trycksaker/Rapporter/Report5_07_Lea
d_in_articles.pdf (accessed 7 June 2013).
Lee, S., Park, H., Lee, C. H., Lee, M., Pak, H., & Chung, K. (1997). Clean technology
in the crystal glass industry. Journal of Cleaner Production, 5(3), 207-210.
Lee, K. W., Byun, J. Y., Kim, K. T., & Oh, J. K. (2001). A New Chemical for the
Separation of the CRT Panel Glass from its Funnel. Geosystem Engineering,4(3), 94-
99.
ME (2013), Mountain Empire community college courses, Lesson 4: Coagulation and
Flocculation, available online:
http://water.me.vccs.edu/courses/env110/lesson4_3.htm (accessed 25 December
2013).
Méar, F., Yot, P., Cambon, M., & Ribes, M. (2005a). Elaboration and characterisation
of foam glass from cathode ray tubes. Advances in applied ceramics, 104(3), 123-130.
Méar, F., Yot, P., Cambon, M., & Ribes, M. (2005b). The changes in lead silicate
glasses induced by the addition of a reducing agent (TiN or SiC).Journal of non-
crystalline solids, 351(40), 3314-3319.
Méar, F., Yot, P., Cambon, M., Ribes, M., (2006a). The characterization of waste
cathode-ray tube glass. Waste Manage. 26 (12), 1468–1476.
Méar, F., Yot, P., & Ribes, M. (2006b). Effects of temperature, reaction time and
reducing agent content on the synthesis of macroporous foam glasses from waste
funnel glasses. Materials letters, 60(7), 929-934.
Méar, F., Yot, P., Cambon, M., Caplain, R., & Ribes, M. (2006c). Characterisation of
porous glasses prepared from Cathode Ray Tube (CRT).Powder technology, 162(1),
59-63.
Méar, F., Yot, P., Viennois, R., & Ribes, M. (2007). Mechanical behaviour and
thermal and electrical properties of foam glass. Ceramics international, 33(4), 543-
550.
Morgan, J. S., Wood, J. L., & Bradt, R. C. (1981). Cell size effects on the strength of
foamed glass. Materials Science and Engineering, 47(1), 37-42.
109
Musson, S. E., Jang, Y. C., Townsend, T. G., & Chung, I. H. (2000). Characterization
of lead leachability from cathode ray tubes using the toxicity characteristic leaching
procedure. Environmental Science & Technology, 34 (20), 4376-4381.
Pechnikov, A. V., Guseva, T. V., & Kemp, R. G. (1996). Environmental protection in
the Russian Federation: A case study of lead contamination around a crystal
production facility. Process safety and environmental protection, 74(3), 189-196.
Pierre, F., Vallayer, C., Baruthio, F., Peltier, A., Pale, S., Rouyer, J. & Fabriès, J. F.
(2002). Specific relationship between blood lead and air lead in the crystal
industry. International archives of occupational and environmental health, 75(4), 217-
223.
Pokorny, A., Vicenzi, J., & Bergmann, C. P. (2011). Influence of heating rate on the
microstructure of glass foams. Waste Management & Research, 29(2), 172-179.
Porcham, W. C. (1995). Recycling lead in the crystal industry. Glass, 72(5), 193-194.
Pulselli, R. M., Ridolfi, R., Rugani, B., & Tiezzi, E. (2009). Application of life cycle
assessment to the production of man-made crystal glass. The International Journal of
Life Cycle Assessment, 14(5), 490-501.
Rada, M. (2009). Legislation governing crystal glass: Developments. Glass
international, 32(3), 29-34.
Scarinci, G., Brusatin, G., & Bernardo, E. (2006). Glass foams. Cellular Ceramics:
Structure, Manufacturing, Properties and Applications, Wiley-VCH, 158-176.
Smith, W.F. (1996), Principles of Materials Science and Engineering, third edition.
McGraw-Hill Inc.
So, T. K. (1997). Release of Lead from Ceramic Foodware and Crystal
Glassware (Doctoral dissertation, University of Hong Kong).
Spiridonov, Y. A., & Orlova, L. A. (2003). Problems of foam glass production.Glass
and ceramics, 60(9-10), 313-314.
Townsend, T.G. , Musson, S., Jang, Y.C., Chung, I.H. (1999). Characterization of
lead leachability from Cathode-Ray Tubes using the toxicity characteristic leaching
procedure, in: Report #99-5, Florida center for solid and hazardous waste
management, Gainesville, Florida, USA.
Tulyaganov, D. U., Fernandes, H. R., Agathopoulos, S., & Ferreira, J. M. F. (2006).
Preparation and characterization of high compressive strength foams from sheet
glass. Journal of Porous Materials, 13(2), 133-139.
UNEP (2002), Industry and the environment – Cleaner Production. Seventh
International High-level Seminar, Prague. Available online:
http://www.uneptie.org/media/review/vol25no3-4/i&e25_34.pdf (accessed 20 July
2013).

110
UNEP (2010), United Nations Environment Programme Chemicals Branch DTIE,
Final review of scientific information on lead- Version of December 2010 available
online
http://www.unep.org/hazardoussubstances/Portals/9/Lead_Cadmium/docs/Interim_rev
iews/UNEP_GC26_INF_11_Add_1_Final_UNEP_Lead_review_and_apppendix_Dec
_2010.pdf (accessed 7 June 2013).
UNEP (2013), Lead exposure and human health, global opportunities for reducing the
use of leaded gasoline, available online
http://www.chem.unep.ch/pops/pdf/lead/leadexp.pdf (accessed in 15 June 2013).
Vieitez, E. R., Eder, P., Villanueva, A., & Saveyn, H. (2011). End-of-Waste Criteria
for Glass Cullet: Technical Proposals, JRC Scientific and technical reports. Available
online
ftp://ftp.jrc.es/pub/EURdoc/JRC68281.pdf (accessed 9 June 2013).
WHO - IARC (1993), Exposures in the Glass Manufacturing Industry, World Health
Organization WHO-International Agency for Research on Cancer IARC, monographs
on the evaluation of carcinogenic risks to humans, volume 58 pp. 347-375 available
online
http://monographs.iarc.fr/ENG/Monographs/vol58/mono58-9.pdf (accessed 15 June
2013)
Yamashita, M., Wannagon, A., Matsumoto, S., Akai, T., Sugita, H., Imoto, Y.,
Komai, T., & Sakanakura, H. (2010). Leaching behavior of CRT funnel glass. Journal
of Hazardous Materials, 184(1), 58-64.
Yot, P. G., & Méar, F. O. (2009). Lead extraction from waste funnel cathode-ray
tubes glasses by reaction with silicon carbide and titanium nitride. Journal of
hazardous materials, 172(1), 117-123.
Yot, P. G., & Méar, F. O. (2011). Characterization of lead, barium and strontium
leachability from foam glasses elaborated using waste cathode ray-tube
glasses. Journal of hazardous materials, 185(1), 236-241.
Zhao, A. & Richardson, G. N. (2003). US regulations on solid waste contaminant
facilities. The second International Exhibition on Solid waste Treatment Technology
and Equipment, Beijing. Available online
http://www.tenax.net/geosynthetics/tech-doc/regulations-on-solid-waste-
containment.pdf (accessed 17 June 2013)
Zhernovaya, N. F., & Onishchuk, V. I. (2005). Possible directions in recycling crystal
production waste. Glass and Ceramics, 62(1-2), 13-15.

111
APPENDIX A: SIEVE ANALYSIS OF SLUDGE POWDER
Test number I
Sieve
Number
Diameter
(mm)
Mass of
empty
sieve (g)
Mass of sieve
& powder
retained (g)
Powder
retained
(g)
Percent
retained
Percent
pass
8 2.36 473 473.5 0.5 0.25 99.75
16 1.18 442 443 1 0.5 99.25
30 0.6 497.5 498 0.5 0.25 99
50 0.3 412.5 419.5 7 3.5 95.5
100 0.15 351 372.5 21.5 10.75 84.75
200 0.075 325.5 488 162.5 81.25 3.5
pan 753 760 7
Total weight (g) 200
Test number II
Sieve
Number
Diameter
(mm)
Mass of
empty
sieve (g)
Mass of sieve
& powder
retained (g)
Powder
retained
(g)
Percent
retained
Percent
pass
8 2.36 473 473.5 0.5 0.25 99.75
16 1.18 442 443 1 0.5 99.25
30 0.6 497.5 499 1.5 0.75 98.5
50 0.3 412.5 420.5 8 4 94.5
100 0.15 351 369 18 9 85.5
200 0.075 326 476.5 150.5 75.25 10.25
pan 752.5 773 20.5
Total weight (g) 200
Test number III
Sieve
Number
Diameter
(mm)
Mass of
empty
sieve (g)
Mass of sieve
& powder
retained (g)
Powder
retained
(g)
Percent
retained
Percent
pass
8 2.36 473 473.5 0.5 0.25 99.75
16 1.18 443 443.5 0.5 0.25 99.5
30 0.6 410 410.5 0.5 0.25 99.25
50 0.3 412.5 417.5 5 2.5 96.75
100 0.15 351.5 366 14.5 7.25 89.5
200 0.075 431 588 157 78.5 11
pan 753 775 22
Total weight (g) 200
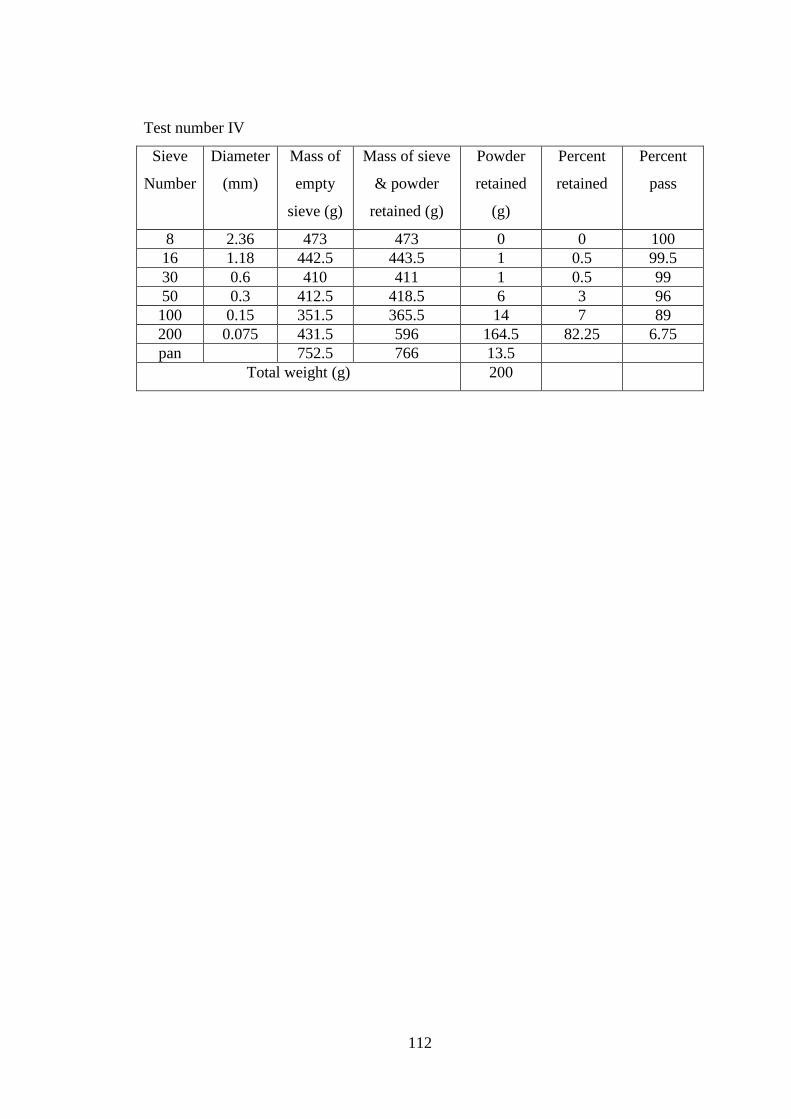
112
Test number IV
Sieve
Number
Diameter
(mm)
Mass of
empty
sieve (g)
Mass of sieve
& powder
retained (g)
Powder
retained
(g)
Percent
retained
Percent
pass
8 2.36 473 473 0 0 100
16 1.18 442.5 443.5 1 0.5 99.5
30 0.6 410 411 1 0.5 99
50 0.3 412.5 418.5 6 3 96
100 0.15 351.5 365.5 14 7 89
200 0.075 431.5 596 164.5 82.25 6.75
pan 752.5 766 13.5
Total weight (g) 200