Innovation, Obsolescence and Retirement: An Exploration ...
38
Innovation, Obsolescence and Retirement: An Exploration Based on Data for Dutch Manufacturing Firms Abdul Azeez Erumban • June, 2008 Abstract The recent theories of investment and growth have shown that when there are distinct capital vintages with embodied technologies, capital retirement decisions become endogenous. This raises important problems with existing measures of output, depreciation and productivity and requires a deeper understanding of the retirement process. However, the determinants of retirement are not well understood because of the lack of firm-level data. This paper uses a unique data base on retirements by manufacturing firms in the Netherlands, coupled with economic and innovation variables from other surveys by Statistics Netherlands, to examine the impact of innovation on capital retirement. Our results provide supporting evidence on the relationship between innovation and discard rates. We obtain significant positive effects of process-innovation in a firm on machinery discards and product innovation in a firm on computer discards. Average age of the asset is the most significant factor in driving discard decisions, which may be considered as an indicator of embodied technological change and obsolescence alongside efficiency loss. • Groningen Growth and Development Centre, Faculty of Economics, University of Groningen, Post Bus 800, 9700 AV Groningen, The Netherlands, E-mail: [email protected] The author is grateful to Marcel Timmer, Bart van Ark, Erik Dietzenbacher, Keld Laursen, Niels Bosma, and Georg Licht for comments and suggestions on earlier versions of the paper. The usual disclaimer applies.
Transcript of Innovation, Obsolescence and Retirement: An Exploration ...

Innovation, Obsolescence and Retirement: An Exploration Based on Data for Dutch Manufacturing Firms
Abdul Azeez Erumban•
June, 2008 Abstract The recent theories of investment and growth have shown that when there are distinct capital vintages with embodied technologies, capital retirement decisions become endogenous. This raises important problems with existing measures of output, depreciation and productivity and requires a deeper understanding of the retirement process. However, the determinants of retirement are not well understood because of the lack of firm-level data. This paper uses a unique data base on retirements by manufacturing firms in the Netherlands, coupled with economic and innovation variables from other surveys by Statistics Netherlands, to examine the impact of innovation on capital retirement. Our results provide supporting evidence on the relationship between innovation and discard rates. We obtain significant positive effects of process-innovation in a firm on machinery discards and product innovation in a firm on computer discards. Average age of the asset is the most significant factor in driving discard decisions, which may be considered as an indicator of embodied technological change and obsolescence alongside efficiency loss.
• Groningen Growth and Development Centre, Faculty of Economics, University of Groningen, Post Bus 800, 9700 AV Groningen, The Netherlands, E-mail: [email protected] The author is grateful to Marcel Timmer, Bart van Ark, Erik Dietzenbacher, Keld Laursen, Niels Bosma, and Georg Licht for comments and suggestions on earlier versions of the paper. The usual disclaimer applies.

2
1. Introduction
In order to understand the contribution of capital to a country’s economic growth, it is essential to know the rate at which the efficiency of capital increases and the rate at which older assets are replaced by new ones. The standard practice in the empirical literature is to assume a constant lifetime of capital across countries and over time. However, empirical evidence shows that the service lifetimes of capital assets vary across asset types, industries and countries (OECD, 2001a; Erumban, 2008). Furthermore, many previous studies have shown that when there are distinct capital vintages with embodied technologies, capital retirement decisions become endogenous, rather than a mere technical necessity (Goolsbee, 1998; Cooley et al, 1997; Caballero and Hammour, 1994, 1996; Cooper and Haltiwanger, 1993; Feldstein and Rothschild, 1974; Feldstein and Foot, 1971). This has implications for lifetime of capital assets. Those assets which are subject to high rates of discard will have low lifetimes. Firms may discard their assets due to obsolescence, physical wear-and-tear or simply decline in efficiency due to age. Physical wear-and-tear and efficiency decline lead to a situation in which the capital is no longer profitable to use in the production process (See Salter, 1960). Discard can also occur due to technological obsolescence, in which case capital assets are discarded well before the end of their physical lifetime. This has important implications for the measurement of capital, output and productivity growth rates. This point has been made most forcefully by Howitt (1998), who claims that a faster pace of technical change will tend to reduce the net rate of capital accumulation by causing both physical and human capital to become obsolete more quickly. With a given rate of investment, higher depreciation due to obsolescence will result in lower net rates of capital accumulation. Also in the context of the recent ICT revolution, many studies have argued that conventional growth accounting results might be biased if capital obsolescence is not taken into account (Gort and Wall 1998, Whelan 2002).1 Thus the discard behaviour of firms will have macro consequences and it is therefore important to examine the factors that determine this behaviour. This paper empirically explores the factors that determine the firm level decision to discard as well as the magnitude of discards with special reference to the impact of technological innovations on these decisions. Differences in discard patterns can have implications for differences in productivity growth rates between firms, industries and countries. For instance, Salter (1960) suggested that the measured UK productivity was lower than in the US due to a more intense process of capital destruction in the latter economy. Similarly, Oulton (1990) observed that capital scrapping explains the cross-industry productivity differences between 1960s and 1970s substantially, while comparing US-UK productivity differences. Despite its importance for patterns of economic growth, there is surprisingly little evidence on the empirical discard process, as stressed among others by Griliches (1994), Hulten and Wykoff (1996) and Berndt (1991). This is true of academic work as well as studies by statistical institutes. The standard practice in productivity literature is to assume a constant discard rate (e.g. Jorgenson, 1963; Jorgenson and Griliches, 1967).2 The assumption of a constant discard rate does not
1 However, we do not maintain that the prevalence of embodied technical progress and obsolescence invalidates growth accounting as a tool for understanding the growth process, as claimed by Scott (1989). Rather, it stresses the need to find good price and depreciation measures in the capital input calculations. See Oulton (1995) for a defense of growth accounting, and Hulten (1992) and Dekle (2001) for applications with vintage capital. Also see Musso (2004). 2 Also see Powers (1988) for a discussion.

3
take into account that scrapping decisions are economic choices of firms owing to a number of factors. Thereby it excludes a priori what may be an important explanatory factor for variation in productivity growth rates (Feldstein and Rothshield, 1974; Hulten, 1990). However, there have been some attempts to consider the endogeneity of discard decisions in economic modelling. In the vintage models in the tradition of Salter (1960), such as Greenwood and Jovanovich (2001), Whelan (2002), Hendricks (2000) and Musso (2004), Bourcekkine et al (1998) or in evolutionary models of growth (Silverberg 1991, Schuette 1994) discards of capital goods is modelled as an endogenous decision which determines slowdowns and accelerations in GDP and productivity growth. Nevertheless, empirical evidence is limited. At the micro level, using dynamic discrete choice models, asset case studies such as Das (1992) on cement kilns, Cockburn and Frank (1992) on oil tankers and Goolsbee (1998) on airplanes strongly support the view that capital discards is fundamentally an economic decision.3 But so far, survey-based studies which have a wider range of asset types and firms are hard to find. A main bottleneck is the limited availability of large-scale longitudinal surveys on discard behaviour of firms. Figure 1: Frequency Distribution of Firm level Discard Rates, Netherlands
05
1015
Perc
enta
ge o
f Firm
s
0 .1 .2 .3 .4Discard Rate
Note: Average discard rates across three asset types, machinery computers and transport equipments The aim of this paper is to add to the scanty evidence on patterns of obsolescence and depreciation by exploiting the unique firm-level database on discard decisions of medium and large manufacturing firms compiled by Statistics Netherlands. Nowadays, the National Statistical Offices of Canada, Japan and the Netherlands are three of the few statistical offices in the world which actually collect data on scrapping on a wide scale. We will use the data from Statistics Netherlands to study the determinants of the scrapping decision. Our analysis is different from earlier studies in this line as this is the first study that tries to model the firm level discard behaviour of a wide set of assets. In Figure 1 we depict the distribution of discard rates across manufacturing firms in the Netherlands. The picture clearly
3 Also see Cramer (1958), Walker (1968) and White (1971) for earlier studies that examined scrapping decisions.

4
shows a large cross-firm variation in discard rates, suggesting the importance of examining the determinants of these differences. The paper is organised in five sections. The second section provides an overview of the modelling and measurement of the scrapping decision and the methodology adopted in the present study. This is important, as there is hardly any theoretical model that explains the scrapping behaviour of firms. Therefore, it is essential to compile the odds and ends of the literature to form an eclectic view on the discard decisions of firms and the factors that nurture such decisions. It helps us derive a number of hypotheses regarding the potential determinants of discard decisions. The third section presents the data construction and sources. Section four provides empirical results and section five concludes the paper.
2. Modelling the scrapping decision: an overview
Measurement of capital and depreciation is fraught with difficulties and it is important to be clear about the concepts used. A machine is scrapped when it is withdrawn from the production process, or sold to another firm or dumped as waste. Depreciation is the loss in value of an asset as it ages. This will be due to both physical wear-and-tear during use and obsolescence. An asset becomes obsolete when it is no longer economical to keep it in production which will normally be long before the asset is physically worn out. Computers provide a good example of the difference between the two concepts. Whereas the older generations of computers are still capable of performing the same functions, as when they were new, newer models have made the older vintage obsolete and computers are scrapped (and replaced4) well before the end of their physical lifetime. Hence depreciation is caused both by declining physical efficiency and obsolescence (see e.g. Doms et al, 2004 for an application to personal computers). The relative importance of these two sources of depreciation will depend on the nature of the asset. Wear-and-tear will be more important for long-lasting assets, such as buildings, but obsolescence might be more important for machinery as argued by Scott (1989). Especially, for computers and software, obsolescence is argued to be the main driver of scrapping (Whelan 2002). In this paper we will focus on the determinants of scrapping of machinery and equipment, including computers, but excluding structures. In Table 1 we provide an overview of various scrapping models which have been proposed in the economic literature. Four stylized models have been selected: neoclassical models, vintage models (with perfect competition and monopolistic competition) and evolutionary models. For each model, we indicate the predictions for the relationship between a particular determinant of scrapping and the scrapping rate. A + (-) indicates a positive (negative) relation between change in the variable and the scrapping rate, while a 0 indicates no relationship. Many determinants have been suggested, but here
4 Note that the decision to discard an asset may coincide with the decision to replace it (see Parks, 1977; Salter, 1960). However, all discards need not be replaced by new. It is possible that firms discard assets without replacing them or exit from the market and consequently scrap their assets, or stop producing a particular product leading to scrapping of assets used in the production of that product. But a replacement decision is both a discard decision as well as an investment decision, and the fact that they are carried out simultaneously does not alter their individual characteristics (Salter, 1960) suggesting the importance of looking at the scrapping behaviour as different from investment. In particular, in the process of creative destruction, investment decision is simply the replacement decision (Boucekkine et al, 1998; Boucekkine et al 1997; Benhabib and Rustichini, 1993). The decision to discard and replace also carries importance, as a large portion of investment is sunk costs with limited salvage value (Asplund, 2000).

5
we focus on two groups: economic and innovation variables. This is because these determinants have been suggested to be the most important ones, and can be measured within our dataset. The first consists of output quantity and factor input prices, such as wage rates. The second set of variables includes indicators of technological change: innovation within the firm itself and exogenous technological change embodied in capital goods available to a firm. The average age of capital is included as well for reasons discussed subsequently. Table 1: Alternative scrapping models and the impact of variables on capital discard
Variables Output growth Wage rate
Own innovation
Embod. Tech. change
Average age of capital Model
Neo-classical 0 0 0 0 0
Vintage (perfect competition) 0 0 0 + +
Vintage (monop. Competition) + + -/+ + +
Evolutionary 0 + 0 + +
Note: + (-) indicates a positive (negative) relation between growth of the variable and the scrapping rate. A 0 indicates no relationship.
In contrast to investment models, scrapping models have not been studied intensively in the neo-classical literature. The mainstream neoclassical theory of investment5, proposed by Jorgenson (1967) was a putty-putty neoclassical model of investment, where firms instantaneously adjust their capital stock without any cost. Gross investment consists of net (expansion) investment and replacement investment.6 Following Jorgenson (1963), where the firm’s desired capital stock is derived from the neoclassical maximization principle, the common practice is to treat replacement investment as a fixed and constant proportion of the capital stock.7 Hence this literature concentrates on the determinants of net investment (Chirinko 1993). Thus by definition, growth of output and input prices (mainly rental prices), which feature prominently in the explanation of investment patterns, do not have any impact on the scrapping decision; it is just a physical necessity. By assuming a stationary technology, replacement investment consists of replacing old machines which have been worn out by new machines, which are identical to the old ones. Obviously, innovation does not play any role in this kind of models, either inside or outside the firm.
5 Other investment theories such as the Q theory (Brainard and Tobin, 1968; and Tobin, 1969, 1978) that addressed the issue of uncertainty within the neoclassical framework, and the real option theories (Pindyck, 1993; and Dixit and Pindyck, 1994) that considered the irreversibility and the option to delay the investment also make no explicit role for the decision to discard. Though under the real option theories the investment associated with the introduction of a new innovation may be considered as an option, there is hardly any specific role attributed to innovation in these models. 6 In order to keep the capital stock of a firm intact, it is essential to replace outmoded capital by new, which is called as replacement investment. Net investment, on the other hand, is an addition to the stock of existing capital, thereby is an expansion of the firm’s capacity. 7 The assumption of constant rate of replacement investment has been challenged by many studies (see e.g. Eisner and Nadiri, 1968; Feldstein and Foot, 1971; Feldstein and Rothschild, 1974).

6
In contrast, the macroeconomic growth literature in the vintage capital tradition has explicitly dealt with the endogeneity of the scrapping process. In the vintage capital models, new vintage capital is the prime source of productivity growth, in that the latest vintages embody the latest technology.8 In contrast to the old vintage models (Johansen, 1959; Solow, 1962; Solow et al, 1966), where the source of technical progress embodied in the newest vintage was assumed to be exogenous, the recent endogenous growth models have allowed creative destruction or obsolescence of technologies to underlie the growth process (Romer, 1990; Aghion and Howitt, 1998; Grossman and Helpman, 1991).9 One of the earliest and explicit attempts that give specific importance to scrapping behaviour and its determinants in terms of economic and innovation variables is Salter (1960). Therefore, we consider Salter as the benchmark model in our subsequent discussion on vintage models, as it allows us to model firm level scrapping behaviour with reference to firm’s innovation activities. In the seminal vintage model presented by Salter (1960), co-existence of different vintage machines is allowed10 where newer vintages embody higher level of technologies.11 Hence the newest assets have the lowest unit input costs. The range of vintages in existence is defined by the condition that machines are scrapped when they cannot earn a positive quasi-rent anymore.12 Similar scrapping rules can be found in recent vintage capital models (See e.g. Greenwood and Jovanovich, 2001; Whelan, 2002; Hendricks, 2000; Musso, 2004). The basic Salter model is based on perfect competition in output markets. Therefore, output and input prices are exogenous and equal for all firms. They cannot be a cause for differences in scrapping behaviour. Instead, the main driver of scrapping decision is technical change in capital producing industries. The appearance of superior assets has a positive effect on scrapping rates. First, industry output is expanded until price falls to equality with the total costs of the new technology, including the initial investment costs. Second, some of the older existing assets are scrapped until the operating costs of the oldest asset equal the new level of best practice total costs. So, the higher the exogenous rate of innovation the lower the service life of assets.13 Similarly, scrapping will be higher in firms with older vintage assets. This line of argument can be seen in many recent studies within the vintage capital framework that consider asset age as a determinant of productivity growth. For instance Wolff (1991) has implicitly argued that productivity growth is negatively associated with the average age, as newer vintage embody the latest technology (Also see Wolff, 1996; Boucekkine et al, 1998).
8 See Hercowitz (1998) for a review of embodiment literature, and Greenwood et al (1997) and De Long and Summers (1991) for studies that analyze the contribution of investment-specific technology to growth. 9 Also see Cooley et al (1997), Musso (2004), Hendricks (2000), Whelan (2002) and Boucekkine et al (1998). 10 Note that we abstract from the complications which arise out of semi-independent machines within a plant. We assume that machines within a firm are independent. Salter (1960, Chapter 7) provides a discussion, maintaining that the basic model is also valid in this more complex situation. 11 This is due to innovation in capital producing industries. For instance a recent study by Sakellaris and Wilson (2004) shows that each newer vintage is about 12 percent more productive than its predecessor. 12 This tradition dealing with the intertemporal problem of investment in the face of technological obsolescence from an optimization perspective harks back to Hotelling; see Silverberg (1991) for a discussion. 13 Similar arguments have been made by Oliner (1996), where the adoption of a new technology capital (such as numerically controlled machines) reduces the lifetime of older capital.

7
Salter also sketches the contours of vintage models in imperfect competition environments in which innovation at the firm-level (implicitly) also plays a role. Particularly interesting is the case of monopolistic competition with emphasis on product differentiation and quality, rather than price.14 In a monopolistic environment, Salter ventures the possibility that a firm with obsolete equipment moves away from competition of low-cost firms by producing ‘quality’ products buttressed with appeals to prestige and the age of the firm (Salter 1960, p. 93). Thus, innovation at the firm-level, in the form of new product development, might paradoxically lead to longer lifetimes of capital and to lower scrapping rates. Alternatively, when production of new products would require newer vintages of machines, scrapping might also accelerate (e.g. new software which is necessary to enable new internet services). Thus the impact of own innovation is unknown. Also under imperfect competition, output growth might be different across firms, and insofar demand is elastic, faster output growth is coupled with lower prices and hence higher scrapping according to Salter’s scrapping rule. Further the relative factor prices that may vary across firms will be crucial in deciding the degree of outmoded capital which is obsolete. As the relative wage goes up, the obsolescence standards are high and hence scrapping and replacement will also be high. Later models of the vintage tradition also came to similar views regarding wage rates (e.g. Cooley et al, 1997).15 In evolutionary models of growth (Silverberg 1991; Schuette 1994) retirement of capital goods is modelled as an endogenous decision which determines slowdowns and accelerations in GDP and productivity growth. Common to most vintage models (except, for instance, Salter’s monopolistic competition case) is the homogenous treatment of all firms in terms of their scrapping behaviour. In various evolutionary models, differences in scrapping behaviour are a central driver of industry and productivity developments such as in the arch-type models by Silverberg (1991) and Schuette (1994). Typically, production operations such as scrapping are assumed to be governed by a few simple rules of thumb such as a fixed asset life time or simple pay-back calculations. Importantly, these rules differ across firms, as in the model by Schuette (1994). As in the Salter model, firms with more recent asset vintages obtain a productivity advantage over other firms. If embodied technological change is high, these so-called aggressive firms will have a significant cost advantage and increase their market shares. But if it is low, these firms will loose demand. He shows that firm heterogeneity in replacement policies can have significant effects on both market structures and industry productivity growth. One reason for firms to hold on longer to older vintages than their competitors is in the anticipation of significant technological change in the near future. Or because the basic technologies currently in use are not compatible with the new best-practice machines. In the Schuette (1994) model, scrapping decisions are independent from economic variables. In the Silverberg (1991) model inputs costs do have an influence through the pay-back calculation. In both models, within –firm innovation processes are not taken into account so we presume that they do not have an impact on firm-level scrapping rates.
14 Bardhan and Priale (1996) provide a theoretical model that considers the endogeneity of scrapping decisions, by allowing the coexistence of different vintages along with the endogeneity of technical progress, monopolistic competition and dynamic economies of scale. But it is a very abstract model with limited empirical applicability. 15 Wage rate has been considered as determining factor in replacement decisions in the past literature also. For instance, Habakkuk (1962) has explained the differences in replacement policy in US and UK during the 1820s in terms of wage differences, which has been supported by Swan (1976). Also see Norris (1957) who shows that current or expected shortage of skilled labour (which will have an increasing effect on wages) may also favor replacement of old technology by new.

8
Determinants of Scrapping Decisions: Empirical Evidences In the preceding discussion, we have shown that the literature have identified a set of variables that can play a crucial role in the discard decisions of firms. Hence, it is interesting to have an overview of the past empirical evidence that explicitly examines the determinants of scrapping. A summary of selected macro and micro studies in this regard is provided in Table 2. At the macro level, in line with the above predictions, previous studies within the vintage capital framework have observed that discards and/or replacements are negatively related to price of new capital (Musso, 2004; Whelan, 2002).16 The observed negative impact of price of new capital goods can be viewed as supportive of the positive effect of embodied technical change, as the decline in the relative price of capital goods is often viewed as an indicator of embodied technical change (Hulten, 1992; Hornstein and Krusell, 1996; Greenwood et al., 1997; Cummins and Violante, 2002). In addition, Oliner (1996) have observed that the alight of numerically controlled machines have caused substantial decline in economic life of conventional machines, thus implicitly indicating the effect of innovation on discard decisions. Evidences from investment literature shows that innovations necessitate new investment for their implementation (Lach and Schankerman, 1989; Lach and Rob, 1992), which may also indicate that if the investment takes place in the form of replacement, innovation affects discard decisions (also see Toivanen and Stoneman 1998). Swan (1976) shows that higher wages induce rapid replacement, as increasing wage rates will cause shrinking profits from older capital assets. Other macroeconomic studies that identify the endogeneity of discard decisions have observed that retirement should be negatively related to business cycle and positively to average age of the asset (Cooper et al, 1999).17 The former is rationalized by the fact that retirements will be higher during recession, as the cost of reallocation is low during recession. It may also be noted that many previous macro studies that have examined the relationship between vintage effects on productivity implicitly came to the conclusion that older vintage capital should face faster scrapping and replacement as they embody older or outmoded technology (Wolff, 1991; Driver, 1990; Boucekkine, et al, 1998). Table 2: Determinants of scrapping decisions: A summary of selected studies
Variables Output growth Wage rate
Embod. Tech. change
Average age of capital Fuel prices
Business cycles Macro Studies
Musso (2004) + Whelan (2002) + Oliner (1996) + Cooper et al. (1999) + - Mauer and Ott (1995) + Swan (1976) +
16 Whelan (2002) allows capital retirement to be endogenous, by adding an additional support cost concept to the basic Solow type vintage model. In his formulation, retirement is endogenous in that once the marginal productivity of machine falls below the support cost, the machine will be discarded. Musso (2004) is an extension of Hendricks (2000) and Whelan (2002) in that it extends to a two sector model and provides some numerical investigation of the dynamic properties of the model, allowing retirement to vary over time. 17 Also see Caballero and Hammour (1994, 1996)

9
Variables Output growth Wage rate
Embod. Tech. change
Average age of capital
Fuel prices
Business cycles Micro studies
Goolsbee (1998 + + - Das (1992) + + Cockburn and Frank (1992) + + Parks (1977) + +
Note: *Most studies found a negative relationship between the price of new capital goods and retirement or replacement. This could be interpreted as an effect of embodied technical change (see text).
At the micro level, there have been a few asset-specific empirical case studies that tried to model the decision to discard explicitly. Das (1992)’s simulation results shows that the decision to hold, operate or retire the cement kindle is predominantly sensitive to fuel prices and the age of the asset; these are positively related to retirement. Cockburn and Frank (1992) have also identified the role of fuel price along with the age of the asset, as they approached the problem with a special interest to understand the role of oil price hike in the 1970s (an exogenous shock) on discard of oil tankers, while Goolsbee (1998) has found evidence of the strong influence of output growth, fuel price, capital cost and deregulation policies on airline retirement. While output growth and fuel prices have a positive impact, capital cost and business cycle have a negative impact on discard. Energy prices have a positive effect, as they will make the existing asset less valuable, and hence accelerate scrapping. Older planes are more fuel intensive and hence an increasing fuel price makes it relatively less productive inspiring firms to scrap and replace them.18 The cost of capital and business cycle are negatively related to retirement as the opportunity cost of reallocation delays is high in booms. Also an earlier study by Parks (1977), who has modelled the scrapping pattern of automobiles in post-war US observed that age is the main determinant of automobiles scrapping, while the price of new capital goods relative to the cost of repairs also has a negative impact. Following the endogenous vintage growth models, the observed impact of age in these micro studies, could be interpreted as an element of embodied technology. This issue will be further discussed subsequently. Repair costs have been highlighted as a factor in discard decision by Lambe (1974) and Quayle (1972) also under the assumption that increasing repair costs will make the older vintage relatively expensive, persuading the firm to replace (also see Clapham, 1957; Eilon et al, 1966). This literature considers repairs as an alternative to scrapping. Thus the limited empirical evidence seems to support some of the theoretical hypotheses listed in Table 1. What is missing in studies of scrapping to date is the explicit role of innovation in determining cross-firm discard behaviour, and the consideration of a larger set of asset types, which is the primary focus of the present study.
18 Baily (1981) has also noted that the rising fuel prices can cause massive capital obsolescence; fuel inefficient vintages will be utilized less intense and scrapped earlier at times of fuel price increase. Also see Boucekkine and Pommeret (2004).
10
3. Methodology
In the previous section we discussed some theoretical models and empirical studies of scrapping behaviour. Various models highlight alternative determinants of discard and there is no encompassing framework to study discard behaviour of firms. Therefore, deriving from the alternate viewpoints put forward in the literature (as seen in Table 1), we postulate the following eclectic relationship;
),,,( INNAGEPYfD = (1)
where D is the discard, Y is an output quantity variable, such as gross output or sales, P represents the input prices, AGE is the age of the asset and INN is the innovation variable. We estimate this model to find out the relative importance of each determinant. To estimate the parameters of relevant determining variables, we require an empirical model that specifies the functional form of the relationship between discard rates, innovation and other variables. Unfortunately there is no theoretical model that establishes a functional relationship. Previous micro studies have used a dynamic discrete-choice model (Das, 1992) or logit model (Cockburn and Frank, 1992) to specify the relationship between discard decision and selected variables. In the present study, we cannot do any kind of dynamic analysis such as time-series or panel models, for reasons of data availability. Therefore, we have opted to perform two estimation techniques. The first is a probit analysis,19 where we model the decision of the firm to discard or not. The second is to do a cross-section ordinary least squares (OLS) regression analysis across firms, where we relate the magnitude of observed discard rates to selected variables. In the first step, we estimate a probit model, where the dependent variable takes the value zero if the firm has reported no positive discards and one otherwise, irrespective of the magnitude of discard. Deriving from (1), we specify the following probit model,
inin
N
n
K
kikkiaiwiyi INDINNAGEWGYGD υρρρρρρ ++++++= ∑∑
== 110)Pr(
(2)
where Pr(Di) is defined as Pr(Di) = 1 if Di >0 and Pr(Di) = 0 if Di =0, where Di is the discard rate in firm i. YG is the output growth rate, WG is the wage rate growth rate, AGE is the average age of the assets INN are K number of innovation variables and v is the random error term with standard assumptions. In our estimation, given the data availability, we approximate the input price variable by wage rate. Ideally, we would like to have wage-rental ratios instead of wage rates, as it would measure the relative price of labour better. But, as capital user cost calculations at the firm-level are hard to make, we follow the general literature by using wage rates as a proxy. The idea is that higher wage growth may induce firms to move towards labour-saving technology, hence accelerating scrapping and replacement. Notice that we have also included an industry dummy, IND, in order to take account of industry heterogeneity. This is important as there is significant inter-industry variation in discard rates (see Appendix Table 1).20 Apart from the two digit industry dummies captured by IND, we have also estimated the model by dividing industries as high-tech and low-tech, following an
19 Both probit and logit models are extensions of generalized linear regression models, used to deal with dichotomous and categorical variables. The main difference between the two is that the linearization of dependent variable in the logit is achieved by natural log of the odds, while it is done by the inverse of the standard normal cumulative distribution in probit. In practice, this, however, provide not much difference in the final results. 20 Note that there is evidence that capital is very much sector-specific and hence it is important to account for this sectoral heterogeneity of capital (Boddy and Gort, 1971; Goolsbee and Gross, 1997).

11
OECD classification, in order to see whether the discard patterns differ between high-tech and low-tech industries. It is important to note that the coefficients of the above specified probit model hardly have any direct interpretations, as they are not necessarily the marginal effects one usually obtains in ordinary least squares regression models (see Greene, 2002 for a discussion). Therefore, in order to interpret the quantitative implication of the results, we need to compute the marginal effects of the explanatory variables, for which the estimated coefficients can be utilized. The marginal effects, that is the change in the probability for an infinitesimal change in each explanatory continuous variable and the discrete change in the probability for dummy variables, for a probit model can be estimated as,
⎩⎨⎧
⎭⎬⎫
=∂
∂ ρρρ
)'()'(
x]/[
xdxdFxyE
= ρρ )'( xf
(3)
where y is the dependent variable, x is the vector of explanatory variables and f(.) is the density function that corresponds to the cumulative distribution, F(.). Following this, in our probit
specification the marginal effect for an independent variable, say YG, can be derived as yx ρρφ )'( , where φ is the standard normal density. Note that though the derivates of this conditional mean function are useful when the variable is continuous, they are less useful when the explanatory variables are dummy variables. In such cases, it would be useful to analyze the effect of range of ρ’x (using the sample estimates) and with the two values of the binary variable (Greene, 2002, p 817). Notice that in (2) we model the decision to discard. Nevertheless, our database also provides us with the actual magnitude of discard, i.e. how much of capital is being discarded by the firm. Therefore, it would also be interesting to look at the effect of these explanatory factors on the rate at which the firms discard their assets. Therefore, we have also estimated a model where we relate the observed discard rates to the set of explanatory variables. Assuming a linear relationship, we specify (1) as:
inin
N
n
K
kikkiaiwiyi eINDINNAGEWGYGD ++++++= ∑∑
==
αααααα11
0ln
(4)
where ln D is the natural logarithm of discard rate D, e is the error term which is assumed to be independent and identically distributed and all other variables are as explained before. Equation (4) has a practical problem that it can not incorporate those cases with zero discards, as the log transformation is not possible in such cases. One option is to exclude such cases from the sample and estimate the above model. However, that may create sample-selection bias, and therefore, we have opted to transform the dependent variable to 1+D and hence the final model will be
inin
N
n
K
kikkiaiwiyi uINDINNAGEWGYGD ++++++=+ ∑∑
==
ββββββ11
0)1ln(
(5)
Note that the above models abstract from any time-series effects. It may be mentioned that earlier studies both on investment as well as discard behaviour have been based on either time-series or panel-data analysis, as these decisions are also functions of time. Due to data limitations, however, we were not able to do any dynamic modelling, and therefore, have specified the above set of models for

12
cross-section analysis.21 We do not have time series data on this issue to test any discrete time varying models. Another important feature of our model is of a more parsimonious nature in that we had to exclude some important variables that are identified in the literature. For instance maintenance costs (Quayle, 1972) and repair costs (Lambe, 1974; Parks, 1977) are often considered as major determinants of firm’s decision to discard its assets. This literature also frequently acknowledges the role of obsolescence, quality deterioration, rate of return and taxation in influencing firm’s discard decision. It is practically difficult to compile data on repair costs when dealing with a composite asset group, as is the case with our analysis. Two old studies in these lines (Clapham, 1957; Eilon et al, 1966), that tried to determine the optimal age for replacing an asset, assume that repair costs increase linearly over time. This implies that, to some extent, higher age of the asset also reflects the higher repair costs associated with the asset. Similarly, the technology changes in asset-producing industries as mentioned by Salter (e.g. computer industry), fuel price shocks (Cockburn and Frank, 1992), and industry heterogeneity in terms of technological differences can also be important. And institutional factors such as industry regulations (Goolsbee, 1998) like safety and environmental standards, tax regulation, including financial accounting rules and tax incentives such as depreciation allowances, might also be important in influencing firms’ discard decisions. Nevertheless, typically, the variables such as repair costs, regulations, and external price and technology shocks are not firm-specific, and hence may have the same effect on all firms in an industry. As such they are not expected to be important for cross-firm based estimation. However, if they are dominant, one would not expect to find a clear relationship between discard rates and economic or technology variables. The issue of industry heterogeneity has been accommodated to a large extent by including industry dummies. Since the innovation measures used in this study (to be discussed in the next section) are indictors of innovation implemented by the firm (ex post), to some extent, they may capture the changes in asset-producing sector, if the innovation is not taken place within the firm.22 For instance, the firm might have introduced a new production process, not developed by the firm, but outside. 4. Data and Variables
Our objective in this paper is to examine the relationship between a firm’s capital discard rates and decisions and their innovative behaviour. In doing this we consider three different types of assets, for which we had sufficient data on capital discards: computers, machinery and transport equipment. We exploit firm-level data on relevant variables, available through various micro-economic surveys conducted by the Statistics Netherlands (CBS). We utilize data from five surveys: production statistics (PS), capital stock surveys, capital discard surveys, investment surveys and community innovation
21 It may be noted that the variables identified by the macro economics literature such as user cost may be less relevant for cross firm variation in investment and discard, as it is rational to assume that user costs do not vary much across firms, particularly in countries with flexible capital market. See Hall et al (1998) for a review of firm level investment studies that subdue user cost term due to this reason. Also see Hubbard (1998) for a review of studies that incorporates user cost in explaining cross firm investment behavior, due the relevance of other variables in user cost such as taxes 22 Since the innovation dummies are indicators of ex post realized innovation, the only information we have is that the firm has implemented the innovation.

13
surveys (CiS). Therefore, it was essential to link these different surveys, to construct a comparable database. A short description of these surveys is provided below: Capital stock Surveys have been conducted on a rolling basis since 1993 in such a way that each 2 digit industry will be surveyed once in five years. The survey contains information on all fixed assets that are used by enterprises in their production process, whether the assets are owned, rented or obtained through a leasing contract. More importantly, it provides the vintage year of each asset.23 Because of the rolling nature of the survey, one or two benchmarks are available for each two-digit industry during the period 1993-2001. Discard Survey provides information on all fixed assets which are no longer used in the production process. That is, it comprises all capital goods removed from the production process during the course of a particular year. The information available includes the value of asset withdrawn from the production process both in historic and current prices and the destination to which the withdrawn asset goes to, i.e. whether the asset is completely scrapped, sold in the second-hand market or returned to the lease company (the last option was added only recently). Production Survey is conducted every year for all the firms in the Netherlands, basically on variables associated with profit and loss account. This survey provides data on employment (in numbers), materials, depreciation, investment, sales, export, energy, costs, output, taxes and subsidies, wages, profits and so on. The data has been classified under Dutch industry classification, for each firm/company (establishment). In the present study we utilize data on output, wages and employment during the period 1998-2000. Investment Survey is also conducted every year. The survey provides asset wise information on investment variables for each enterprise. The data is available under 6 digit industry classification, for different asset types, which are strictly comparable with the capital stock surveys (see discussion in Erumban 2008). We use the investment series during the period 1994-2001 for three asset types, machinery, computers and transport equipment. The Innovation Surveys: The Innovation Survey has been conducted under various community innovation surveys (Cis) on all firms in in the manufacturing and service sectors in the Netherlands. The survey provides a myriad of information on innovation variables such as innovation investment, innovation output and qualitative variables associated with technological environment. The surveys are conducted for an interval of three years. We use CiS3 which is conducted for the interval 1998-2000. While most qualitative information belongs to duration of this three years, the information on quantitative variables such as R&D expenditure are collected for the last year of the survey, 2000. Basically, the investment, capital stock and discard surveys were used to calculate the discard rates. PS and CIS were used for the explanatory variables. An important choice to be made is the time-period of analysis. Variables in the CIS are not available annually, but cover a period, e.g. CIS 3, which is used in this study, covers the period 1998-2000. That is, for instance, it asks the question
23 See Erumban (2008) for a detailed description of capital stock and discard surveys.

14
whether the firm has introduced a new production process during 1998-2000. Also, discards in the discard surveys are found to be missing or zero and lumpy, in many years. Therefore we decided to do a cross-section analysis for the period 1998-2001, assuming that innovation in the period 1998-2000 has an impact on discards during the period 1999-2001 allowing for a one-year lag. We have first linked the discard survey to the capital stock surveys and then to the investment survey and further to the PS and CIS at firm level.24 We obtained a final dataset of 357 firms which discarded computers, 366 firms for machinery and 226 firms for transport equipment for which all necessary variables were available.25 This constituted 30.6 per cent (computers), 31.4 per cent (machinery) and 19.4 per cent (transport equipment) of all firms responding to discard surveys during 1999-2001. Also it covers 32.2 percent (computers), 33 per cent (machinery) and 20.4 per cent (transport equipment) of total firms reported to various capital stock benchmarks. The number of firms reported to two bench-mark capital surveys (for each two digit industry) is listed in Appendix Table 2, and the number of firms reported to production, investment, discard and innovation surveys is listed in Appendix Table 3. In what follows we explain each of the variables used in the study and their construction. Discard rate (D): The dependent variable in (4) is the discard rate, which is calculated as the discard value in year t divided by capital stock in year t-1 for each firm, averaged across 1999-2001, i.e.
( )3
/2001
19991,,,,
20011999,,
∑=
−
− = ttjitji
ji
KDD
where t, i and j respectively represent year, firm and asset, D is the constant-price discard value and K is the constant-price capital stock. The series of gross capital stock in constant prices at firm-level are derived as:
tjitjitjitji IDKK ,,,,1,,,, +−= − where I is investment in asset j in firm i during the year t measured in constant prices. Then the
dependent variable in (5) is calculated as ( )20011999,,1ln −+ jiD .
Output growth (YG): The growth rate of output, measured as ( )1/ln −tt YY , where Y is the real output calculated by deflating nominal output by industry-specific output deflators, for each firm averaged for the period 1998-2000 is used. The value of output for this purpose is taken from the production survey which is conducted every year for all the firms in the Netherlands. Output growth is likely to have a positive effect under Salter’s vintage model with monopolistic competition, while all other models listed in Table 1 attribute no relationship between discard and output growth. Wage rate (WG): The growth rate of total wages divided by total persons employed, i.e.
( ) ( )[ ]11 ///ln −− tttt LwLw , where w is the total compensation and L is the number of employees, averaged for the period 1998-2000. The data is taken from production statistics. Wage growth proxies changes in the relative price of capital to labour and is expected to have a positive effect on discard both in monopolistic competition model and in evolutionary models. This is because an increase in
24 See Klomp and van Leeuwen (2001) for a study that links surveys on innovation (CiS2) and output while analyzing the impact of innovation on economic performance.
15
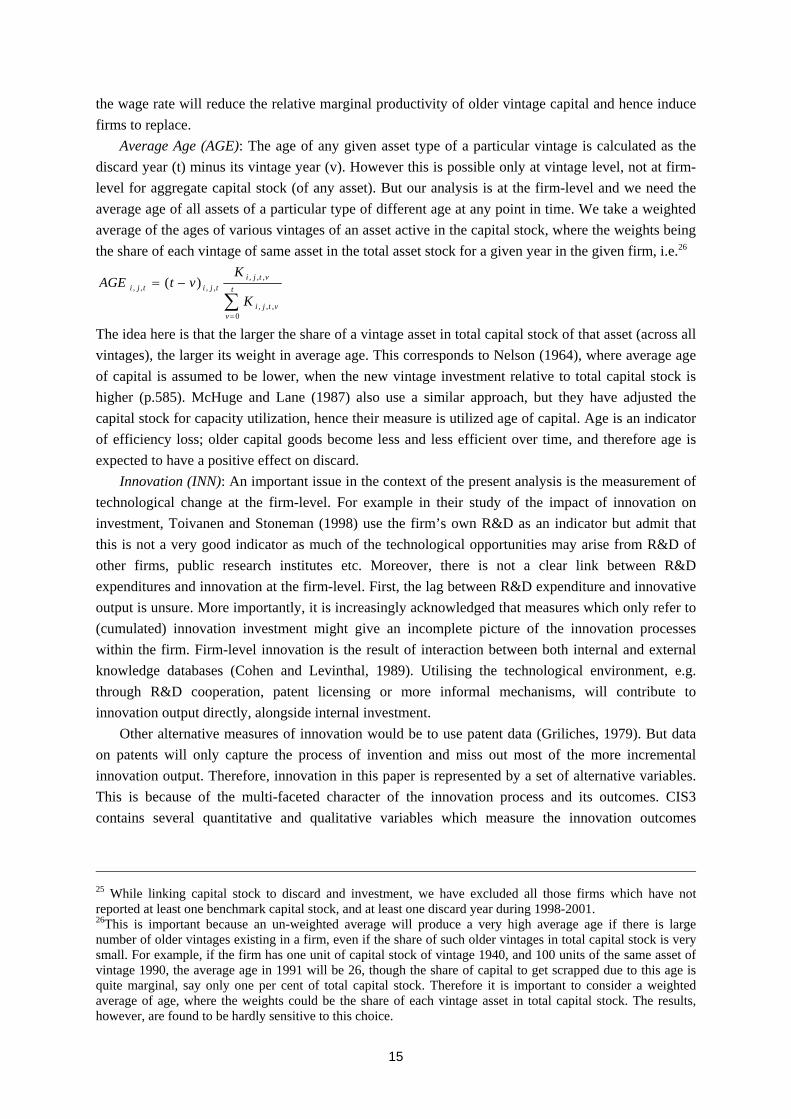
the wage rate will reduce the relative marginal productivity of older vintage capital and hence induce firms to replace. Average Age (AGE): The age of any given asset type of a particular vintage is calculated as the discard year (t) minus its vintage year (v). However this is possible only at vintage level, not at firm-level for aggregate capital stock (of any asset). But our analysis is at the firm-level and we need the average age of all assets of a particular type of different age at any point in time. We take a weighted average of the ages of various vintages of an asset active in the capital stock, where the weights being the share of each vintage of same asset in the total asset stock for a given year in the given firm, i.e.26
∑=
−= t
vvtji
vtjitjitji
K
KvtAGE
0,,,
,,,,,,, )(
The idea here is that the larger the share of a vintage asset in total capital stock of that asset (across all vintages), the larger its weight in average age. This corresponds to Nelson (1964), where average age of capital is assumed to be lower, when the new vintage investment relative to total capital stock is higher (p.585). McHuge and Lane (1987) also use a similar approach, but they have adjusted the capital stock for capacity utilization, hence their measure is utilized age of capital. Age is an indicator of efficiency loss; older capital goods become less and less efficient over time, and therefore age is expected to have a positive effect on discard. Innovation (INN): An important issue in the context of the present analysis is the measurement of technological change at the firm-level. For example in their study of the impact of innovation on investment, Toivanen and Stoneman (1998) use the firm’s own R&D as an indicator but admit that this is not a very good indicator as much of the technological opportunities may arise from R&D of other firms, public research institutes etc. Moreover, there is not a clear link between R&D expenditures and innovation at the firm-level. First, the lag between R&D expenditure and innovative output is unsure. More importantly, it is increasingly acknowledged that measures which only refer to (cumulated) innovation investment might give an incomplete picture of the innovation processes within the firm. Firm-level innovation is the result of interaction between both internal and external knowledge databases (Cohen and Levinthal, 1989). Utilising the technological environment, e.g. through R&D cooperation, patent licensing or more informal mechanisms, will contribute to innovation output directly, alongside internal investment. Other alternative measures of innovation would be to use patent data (Griliches, 1979). But data on patents will only capture the process of invention and miss out most of the more incremental innovation output. Therefore, innovation in this paper is represented by a set of alternative variables. This is because of the multi-faceted character of the innovation process and its outcomes. CIS3 contains several quantitative and qualitative variables which measure the innovation outcomes
25 While linking capital stock to discard and investment, we have excluded all those firms which have not reported at least one benchmark capital stock, and at least one discard year during 1998-2001. 26This is important because an un-weighted average will produce a very high average age if there is large number of older vintages existing in a firm, even if the share of such older vintages in total capital stock is very small. For example, if the firm has one unit of capital stock of vintage 1940, and 100 units of the same asset of vintage 1990, the average age in 1991 will be 26, though the share of capital to get scrapped due to this age is quite marginal, say only one per cent of total capital stock. Therefore it is important to consider a weighted average of age, where the weights could be the share of each vintage asset in total capital stock. The results, however, are found to be hardly sensitive to this choice.

16
directly. CiS3 is conducted for the period 1998-2000 covering all firms27 in the Netherlands. All the quantitative variables in the surveys are for the year 2000, while the qualitative information is collected for a period of three years, 1998-2000.28 We define a firm to be innovative, only if it has introduced either a new or substantially improved product or process during the survey period.29 All the variables created are based on this definition, and are listed in Table 3. Table 3: Alternative Innovation indicators used in the regression analysis
Variable Description Definition Type INNOV Total Innovation Indicates whether the firm has undertaken some
kind of innovation (either product or process-innovation) during the period 1998-2000.
Dummy (takes 1 if innovative and 0 other wise)
PDTIN Product-innovation
Indicates whether the firm has introduced any new or significantly improved products
Dummy (takes 1 if introduced a new product and 0 other wise)
PCSIN Process-innovation
Indicates whether the firm has introduced any new or significantly improved production processes
Dummy (takes 1 if introduced a new process and 0 other wise)
TURN Turnover share The share of turnover caused by new or significantly improved products (goods or services), i.e. due to product-innovation, introduced during the period 1998-2000.30
Continuous
RDN Intramural R&D spending
All creative work undertaken within the firm aiming to increase the stock of knowledge, and the use of this stock of knowledge to devise new application, such as a new and improved product or process
Continuous (intensity measured as R&D spending/ total turnover)
RDX Extramural R&D spending
The same kind of activities as in RDN, but performed by other companies, for this firm.
27 For firms with 10-50 employees a sampling procedure is adopted. However, since our capital stock and discard data are only for firms employing 100 and more employees, we consider only such firms in our analysis. 28 The survey provides a myriad of information on innovation variables such as innovation investment, innovation output and qualitative variables associated with technological environment. Innovation is defined as new or substantially improved product, service, or process for the firm, which is assumed to be ‘the result of developing and/or applying new or recent technologies’. Hence, it could either be a product-innovation or a process-innovation. While the former is defined as a good or service, which is either new or improved with respect to basic characteristics, technical specifications, intended use or user friendliness, the latter is defined as new and improved production technology, methods of supplying services and delivering products. In both cases the innovation is new to the relevant firm, not necessarily new to the market; it doesn’t matter it was developed by the firm itself or by some other firm. 29 Cefis and Marsili (2005) have also used a similar definition. 30 CiS3 asks the firm to estimate the distribution of total turnover between newly introduced (or improved) products introduced during 1998-2000 and unchanged or old products.

17
Table 4: Descriptive Statistics Computer Machinery Transport Equipment Variable Mean Std. Dev. Mean Std. Dev. Mean Std. Dev. D 0.05 0.10 0.04 0.07 0.14 0.19 Ln(1+D) 0.04 0.08 0.04 0.06 0.12 0.15 YG 0.02 0.21 0.02 0.21 0.04 0.13 WG 0.04 0.05 0.04 0.05 0.04 0.05
AGE 6.26 2.61 15.26 6.04 5.27 3.11
TURN 0.23 0.25 0.23 0.25 0.22 0.25
RDX 0.00 0.01 0.00 0.01 0.00 0.01
RDN 0.02 0.03 0.02 0.03 0.01 0.03
No. firms 357 366 226
Note: Mean and standard deviations are computed for each asset type across firms. Figure 2: Frequency distribution of Firm level Discard rates
010
2030
40Pe
rcen
tage
of F
irms
0 .2 .4 .6 .8 1Discard Rate
Transport Equipment
020
4060
Perc
enta
ge o
f Firm
s
0 .2 .4 .6 .8Discard Rate
Computer
010
2030
40Pe
rcen
tage
of F
irms
0 .2 .4 .6Discard Rate
Machinery

18
Industry dummies (IND): In order to capture industry-specific effects, we have included a set of industry dummies to control for industry heterogeneity. A set of dummies is created based on the 2 digit Dutch industry classification (SBI). The dummy takes the value 1 if the firm belongs to a particular 2 digit industry and zero otherwise. Also, we have estimated the model by replacing these two digit dummies by an OECD classification of industries as high-tech and low-tech. The classification of industries is provided in Appendix Table 4. Dummy (HTEK) takes the value of one if the firm falls in high-tech category and zero otherwise. We expect a positive coefficient for technology-intensive industries, because these industries are more prone to faster changes in technology and hence to keep their competitive positions they may need to move to the best-practice technology faster leading to accelerated replacement of older assets. A summary of the variables in our data set is provided in Table 4. It shows that on average, the discard rate (D) in computers was almost 5 per cent, in machinery 4 per cent and in transport equipment 14 per cent with a high variance across firms. This discard rate, which varied across assets, indicates the possible differences in the expected asset lifetime across different asset types. The average age of the computer capital stock for the whole sample is 6.3 years, for machinery 15.3 years and for transport equipment 5.3 years. Importantly, firms differ notably in their scrapping behaviour (see Figure 2). This large variance in discard rate testifies the importance of having a better understanding of the determinants of the discard behaviour. As shown in Figure 2, a large number of firms are found at the left tail of the distribution in all the three assets, having very low rates of discard, attaining a low average discard rate. Table 5: Number of firms with product and process-innovation (asset wise)
Number of Firms that discarded
Computer Machinery Transport Equipment
Innovative Firms* 292 299 182
Product-innovation 266 272 166
Process-innovation 232 236 148
Non-innovative firms 65 67 44
Total 357 366 226
Note:* Innovative firms are those which have introduced a new product/ process or both. It can also be seen in Table 5 that almost 80 per cent of firms in the sample are innovative in the sense that they have either introduced a new product or process during 1998-2000. Moreover, more than 70 per cent of firms have reported to have product-innovation and almost 65 per cent have reported to have process-innovation. Also almost 35 per cent of firms belong to high- or medium-tech industries. 5. Empirical Results The results of the Probit analysis and the OLS analysis are discussed respectively in sections 5.1 and 5.2. It may be noted that all the OLS estimates are adjusted for heteroscedasticity, and there is no severe serial correlation among our independent variables entered in different equations in all the three asset types (see Appendix Table 5). Total innovation (INNOV) is found to be correlated with product- and process-innovation indicators. Similarly, product-innovation indicator is correlated with

19
turnover share. This is to be expected, as these measures possess somewhat the same information. This, however, does not affect the robustness of our regression results as these variables do not enter the equations simultaneously. Determinants of Discard Decisions: The Probit Results We estimate equation (2), where the probability of an asset to be discarded is modelled as a function of innovation, economic and age variables. Note that we have used alternative innovation measures, as described in the data section. Therefore, we have estimated equation (2) under six alternative specifications ranging from M1 to M6, replacing/dropping some (innovation) variables. The first model is the basic model with only economic variables: output growth and wage rate growth. In the second model, the average age of capital in a firm and the total innovation dummy are included. Subsequently, in Model 3 we replace the total innovation dummy by product- and process-innovation dummies, in order to capture the product/process specificities of innovation. In Model 4 we have process-innovation dummy to represent the process-innovation and the share of turnover caused by product-innovation to represent the product-innovation rather than a dummy. In Model 5, innovation dummies are replaced by two measures of R&D expenditure, the internal R&D and external R&D. All the above models are estimated with industry dummies, and the final model, Model 6, is the same as Model 4 except that the 2 digit industry dummies are replaced by high-tech dummies. In what follows we list these six specifications used in the probit analysis, where the subscripts 1,…, 6 stands for six estimated probit models. M1: iiwiyi WGYGD ,1,1,10,1)Pr( υρρρ +++=
M2: iiniaiwiyi INNOVAGEWGYGD ,2,2,2,2,20,2)Pr( υρρρρρ +++++=
M3: iisidiaiwiyi PCSINPDTINAGEWGYGD ,3,3,3,3,3,30,3)Pr( υρρρρρρ ++++++=
M4: iisitriaiwiyi PCSINTURNAGEWGYGD ,4,4,4,4,4,40,4)Pr( υρρρρρρ ++++++=
M5: iirnirxiaiwiyi RDNRDXAGEWGYGD ,5,5,5,5,5,50,5)Pr( υρρρρρρ ++++++=
M6: isitriaiwiyi PCSINTURNAGEWGYGD ,6,6,6,6,60,6)Pr( ρρρρρρ +++++=
iih vHITEK ,6,6 ++ ρ
As we mentioned before, the coefficients of the probit model do not allow us to understand the marginal effects of these variables. Therefore, we have estimated the marginal effects of the estimated probit coefficients following (3), and the results along with their standard errors and model statistics are provided for each asset in Tables 6, 7 and 8. The likelihood ratio chi-square test tells us that all our models, except the basic model M1, are statistically significant for computers and transport equipment, as compared to a model with no predictors. For machinery discard those models are significant in which the process-innovation is included (M3, M4 and M6 in Table 6). The pseudo R2 improves as we introduce innovation and age variables to the basic model indicating an improvement in fit of the model that is due to the independent variables.31 The subsequent discussion of the results will be mostly based on Model 4, which is the most significant model for all asset types (with industry
31 Note that it is a pseudo R2 because there is no direct equivalent of an R2 (from OLS regression) in probit models.
20
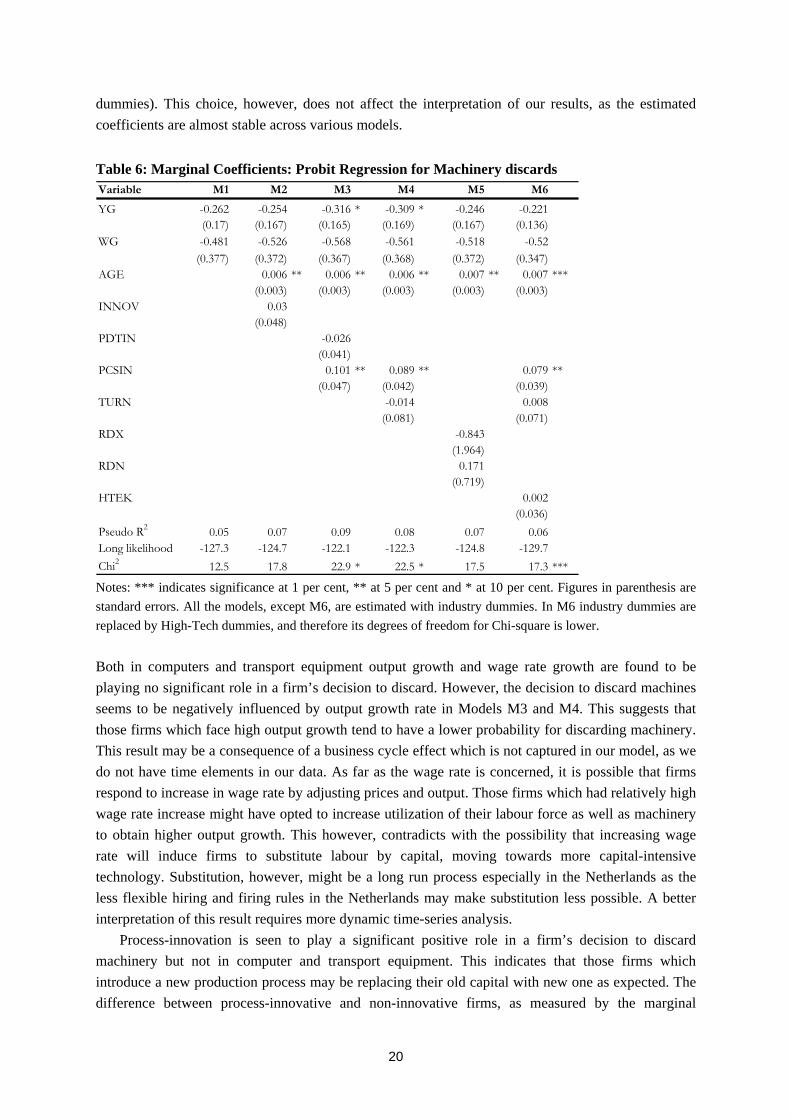
dummies). This choice, however, does not affect the interpretation of our results, as the estimated coefficients are almost stable across various models.
Table 6: Marginal Coefficients: Probit Regression for Machinery discards Variable M1 M2 M3 M4 M5 M6
YG -0.262 -0.254 -0.316 * -0.309 * -0.246 -0.221(0.17) (0.167) (0.165) (0.169) (0.167) (0.136)
WG -0.481 -0.526 -0.568 -0.561 -0.518 -0.52(0.377) (0.372) (0.367) (0.368) (0.372) (0.347)
AGE 0.006 ** 0.006 ** 0.006 ** 0.007 ** 0.007 ***(0.003) (0.003) (0.003) (0.003) (0.003)
INNOV 0.03(0.048)
PDTIN -0.026(0.041)
PCSIN 0.101 ** 0.089 ** 0.079 **(0.047) (0.042) (0.039)
TURN -0.014 0.008(0.081) (0.071)
RDX -0.843(1.964)
RDN 0.171(0.719)
HTEK 0.002(0.036)
Pseudo R2 0.05 0.07 0.09 0.08 0.07 0.06Long likelihood -127.3 -124.7 -122.1 -122.3 -124.8 -129.7Chi2 12.5 17.8 22.9 * 22.5 * 17.5 17.3 *** Notes: *** indicates significance at 1 per cent, ** at 5 per cent and * at 10 per cent. Figures in parenthesis are standard errors. All the models, except M6, are estimated with industry dummies. In M6 industry dummies are replaced by High-Tech dummies, and therefore its degrees of freedom for Chi-square is lower. Both in computers and transport equipment output growth and wage rate growth are found to be playing no significant role in a firm’s decision to discard. However, the decision to discard machines seems to be negatively influenced by output growth rate in Models M3 and M4. This suggests that those firms which face high output growth tend to have a lower probability for discarding machinery. This result may be a consequence of a business cycle effect which is not captured in our model, as we do not have time elements in our data. As far as the wage rate is concerned, it is possible that firms respond to increase in wage rate by adjusting prices and output. Those firms which had relatively high wage rate increase might have opted to increase utilization of their labour force as well as machinery to obtain higher output growth. This however, contradicts with the possibility that increasing wage rate will induce firms to substitute labour by capital, moving towards more capital-intensive technology. Substitution, however, might be a long run process especially in the Netherlands as the less flexible hiring and firing rules in the Netherlands may make substitution less possible. A better interpretation of this result requires more dynamic time-series analysis. Process-innovation is seen to play a significant positive role in a firm’s decision to discard machinery but not in computer and transport equipment. This indicates that those firms which introduce a new production process may be replacing their old capital with new one as expected. The difference between process-innovative and non-innovative firms, as measured by the marginal

21
coefficient is 0.09, indicating a 9 per cent higher discard probability in a process-innovative firm. For computers, product-innovation measured by turnover share has a positive and significant impact on discard decisions. The probability to discard is higher in those firms which enjoy a higher turnover due to the introduction of a new product, thus suggesting that it is not just the innovation introduced by the firm per se, but the realized turnover increase due to the implementation of the innovation that prompts the firm to discard and replace its computers. The magnitude of the coefficient is 0.198 indicating a 20 per cent higher discard probability in a firm that has one unit higher turnover share due to product-innovation. None of the innovation variable seems to play any role in the decision to discard by firms in transport equipment.
Table7: Marginal Coefficients: Probit Regression for Computers discards Variable M1 M2 M3 M4 M5 M6
YG -0.102 -0.096 -0.085 -0.132 -0.129 -0.024(0.209) (0.212) (0.211) (0.216) (0.217) (0.144)
WG 0.292 0.106 0.123 0.048 0.069 -0.008(0.54) (0.55) (0.555) (0.556) (0.554) (0.533)
AGE 0.045 *** 0.045 *** 0.044 *** 0.043 *** 0.049 ***(0.012) (0.012) (0.012) (0.013) (0.011)
INNOV 0.012(0.075)
PDTIN 0.059(0.075)
PCSIN -0.066 -0.067 -0.067(0.066) (0.061) (0.059)
TURN 0.198 * 0.142(0.121) (0.122)
RDX 0.298(3.604)
RDN 2.193(1.381)
HTEK 0.116 *(0.059)
Pseudo R2 0.07 0.09 0.10 0.10 0.10 0.06Long likelihood -228.9 -222.2 -221.6 -220.8 -220.1 -232.2Chi2 32.7 *** 46.2 *** 47.3 *** 49.0 *** 50.3 *** 30.0 *** Notes: As in Table 6.

22
Table 8: Marginal Coefficients: Probit Regression for Transport discards Variable M1 M2 M3 M4 M5 M6
YG -0.253 -0.136 -0.109 -0.118 -0.066 -0.094(0.266) (0.276) (0.279) (0.279) (0.28) (0.252)
WG 0.347 0.001 -0.059 -0.066 -0.016 -0.056(0.632) (0.658) (0.657) (0.661) (0.657) (0.637)
AGE 0.073 *** 0.075 *** 0.074 *** 0.074 *** 0.064 ***(0.014) (0.014) (0.014) (0.014) (0.012)
INNOV 0.014(0.089)
PDTIN 0.093(0.093)
PCSIN -0.065 -0.036 -0.043(0.077) (0.073) (0.071)
TURN 0.052 0.072(0.155) (0.144)
RDX 5.983(7.089)
RDN -1.661(1.353)
HTEK 0.056(0.069)
Pseudo R2 0.06 0.17 0.17 0.17 0.18 0.11Long likelihood -135.6 -120.2 -119.7 -120.1 -119.4 -129.1Chi2 18.8 49.5 *** 50.7 *** 49.8 *** 51.1 *** 31.8 *** Notes: As in Table 6 Average age of the asset is found to play a positive and significant role in the discard decision, for all the three asset types. The magnitude of the estimated marginal effects on computer discard is on average 0.04, implying that a firm with 1 year higher average age will have a 4 per cent higher discard probability. In the machinery the marginal effect of age is around 0.006, while in transport equipment it is 0.07, suggesting respectively an approximate effect of 0.6 per cent and 7 per cent. This positive effect confirms the findings in earlier studies. It may be noted that average age of an asset is often considered as an indicator of embodied technical change (Nelson, 1964; Bahk and Gort, 1993; Wolff, 1991), which is in accordance with the embodiment hypotheses in the vintage capital models that older capital embodies older technology (Salter, 1960; Solow, 1960 and Solow et al, 1966 among others). Kendrick (1980) has used average age as an indicator of diffusion of new technology in his growth accounting exercise and Gittleman et al (2006) have translated age of the asset into a measure of obsolescence. Also some previous studies have assumed that repair costs increase linearly over time, and hence age could also be a proxy for this (Clapham, 1957; Eilon et al, 1966). Thus, predominantly age is both a measure of efficiency decline as well as obsolescence, induced by the fact that newer vintage assets embody newer technology, particularly for machinery and computers. For the discard of transport equipment, age may also be a measure of the lease effect, as the share of leased equipment is quite large in this asset type (see Erumban 2008). If the asset discards are defined as return to the lease company, the decision to discard will have hardly any influence by any variable other than the lease contract, which is perhaps defined in terms of a fixed number of years that may be captured by the age variable. Thus the observed positive impact of average age on machinery and computer discard may reflect the impact of technology embodied in the latest vintage capital or simply the wear-and-tear caused by loss of physical efficiency. In the last model, Model 6, we have replaced the industry dummies by high-tech dummies to see the difference between technology-intensive industries and others. The high-tech dummy has obtained

23
a positive and significant coefficient for computers, suggesting that the probability that a computer will be scrapped is more if the firm belongs to a technology-intensive industry group. The fact that the firm belongs to a high-tech industry has a very large effect on computer discard, suggesting that on average the probability to discard computer is higher by 12 per cent in high-tech industries compared to low-tech industries. We found no such effect for machinery and transport equipment. In our specification we have represented the innovation variables by dummies. As we noted before, the marginal effects are less useful when the explanatory variables are dummy variables. Therefore, in order to evaluate the effect of a firm being innovative or high-tech (two dummy variables we have used), on discard decisions, we have evaluated the discard probabilities using the sample estimates at various ages (ranging from minimum to maximum age for these two groups of firms). The effect of each dummy variable is evaluated at the mean of output and wage rate growth rates, using the coefficients of the probit model. Following Greene (2002), we calculate these probabilities as a function of age as;
⎥⎦⎤
⎢⎣⎡ ++++Φ=
==
hawy
i
AGEWGYG
DINNOV
ρρρρρ________
0
)1Pr(:0
⎥⎦⎤
⎢⎣⎡ +++++Φ=
==
hnawy
i
AGEWGYG
DINNOV
ρρρρρρ________
0
)1Pr(:1
where the bar over the variables YG and WG respectively represent the average output growth and average wage rate growth. Also the coefficients ρn and ρh are respectively the estimated probit coefficients for innovation and high-tech dummies. The function Φ(.) represents the standard normal distribution. The same approach is used to differentiate between process-innovative and non-innovative firms and between high-tech and low-tech firms for all the three asset types. Figures 3a, 3b and 3c show these functions plotted over the range of age observed in each sample for the three asset types, machinery, computers and transport equipment. The marginal effects of each dummy variable, as presented in Tables 6 to 8, are the difference between the two functions at mean age. Though the estimated coefficient of innovation is not significant (See M2 in Table 6), it can be seen from the Figure 3a that, there is apparent difference between innovative and non-innovative firms in machinery discard. This difference reduces as the age of the machinery increases. In other words the probability that a machine will be discarded at a lower age is higher after the implementation of a process-innovation. This probability converges, however, as we move to firms with high asset age. From the figure and also from the estimated marginal coefficient for process-innovation, it appears that this effect observed in total innovation is driven by the process-innovation (note that the product-innovation is not significant). Those firms which introduce a process-innovation seem to have higher probability to discard their machinery.

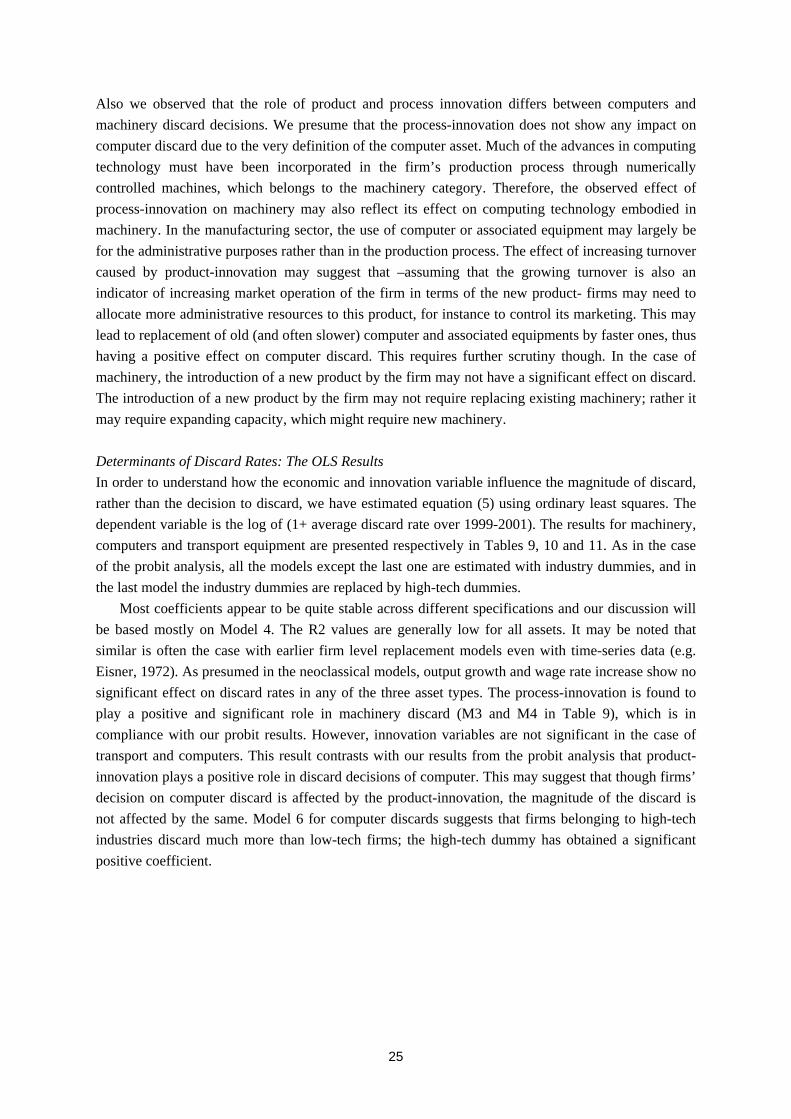
24
Figure 3: Effect of Innovation on predicted discard Probabilities Figure 3a: Machinery
0.600.650.700.750.800.850.900.951.00
3 5 7 10 12 14 17 19 21 24 26 28 31 33 35
INN No_INN
0.600.650.700.750.800.850.900.951.00
3 5 7 10 12 14 17 19 21 24 26 28 31 33 35
HiTek No-HiTek
0.600.650.700.750.800.850.900.951.00
3 5 7 10 12 14 17 19 21 24 26 28 31 33 35
ProcIN No_ProcIN Figure 3b: Computers
0.00
0.20
0.40
0.60
0.80
1.00
1 2 3 4 5 6 7 8 9 10 11 13 14 15 16
HiTek No-HiTek
0.00
0.20
0.40
0.60
0.80
1.00
1 2 3 4 5 6 7 8 9 10 11 13 14 15 16
ProcIN No_ProcIN
0.00
0.20
0.40
0.60
0.80
1.00
1 2 3 4 5 6 7 8 9 10 11 13 14 15 16
INN No_INN Figure 3c: Transport Equipments
0.300.400.500.600.700.800.901.00
1 3 5 7 9 11 13 15 17 19
HiTek No-HiTek
0.300.400.500.600.700.800.901.00
1 3 5 7 9 11 13 15 17 19
ProcIN No_ProcIN
0.300.400.500.600.700.800.901.00
1 3 5 7 9 11 13 15 17 19
INN No_INN Note: The figure represents the effect of each dummy variable on discard probabilities at various ages, evaluated at the mean of output and wage rate growth rates, using the coefficients of the probit model. The solid lines represent cases where dummy takes 1 and the dotted lines represent cases where dummy is zero. It can be seen from Figure 3b that the effect of a firm being innovative or non-innovative is not significant for computers at any point in age. Nevertheless, there exists a difference between the high-tech and low-tech firms in terms of their discard probabilities. The probability that a high-tech firm with relatively low asset age will discard is larger than the probability for a low-tech firm, and this difference, as observed from M6 in Table 7, is statistically significant at mean. Though the difference between high-tech and non high-tech firms seems to decline as the asset reaches the sample maximum age, the difference exists through out its lifespan. For transport equipment (Figure 3c), there is hardly any difference between innovative and non-innovative, or high-tech and non-high-tech firms. Thus overall from the probit results we can conclude that process-innovation is more important for machinery discards than product-innovation, along with the age of the asset. For computers, we find some evidence for a significant impact of product-innovation, along with the age of the asset. For transport equipment, however, innovation plays no role; rather it is only the age that matters. From the magnitude of the marginal effect coefficients, it is evident that the age effect is bigger in asset type computers and transport equipment, compared to that of machinery, where the effect of process-innovation dominates.
25
Also we observed that the role of product and process innovation differs between computers and machinery discard decisions. We presume that the process-innovation does not show any impact on computer discard due to the very definition of the computer asset. Much of the advances in computing technology must have been incorporated in the firm’s production process through numerically controlled machines, which belongs to the machinery category. Therefore, the observed effect of process-innovation on machinery may also reflect its effect on computing technology embodied in machinery. In the manufacturing sector, the use of computer or associated equipment may largely be for the administrative purposes rather than in the production process. The effect of increasing turnover caused by product-innovation may suggest that –assuming that the growing turnover is also an indicator of increasing market operation of the firm in terms of the new product- firms may need to allocate more administrative resources to this product, for instance to control its marketing. This may lead to replacement of old (and often slower) computer and associated equipments by faster ones, thus having a positive effect on computer discard. This requires further scrutiny though. In the case of machinery, the introduction of a new product by the firm may not have a significant effect on discard. The introduction of a new product by the firm may not require replacing existing machinery; rather it may require expanding capacity, which might require new machinery. Determinants of Discard Rates: The OLS Results In order to understand how the economic and innovation variable influence the magnitude of discard, rather than the decision to discard, we have estimated equation (5) using ordinary least squares. The dependent variable is the log of (1+ average discard rate over 1999-2001). The results for machinery, computers and transport equipment are presented respectively in Tables 9, 10 and 11. As in the case of the probit analysis, all the models except the last one are estimated with industry dummies, and in the last model the industry dummies are replaced by high-tech dummies. Most coefficients appear to be quite stable across different specifications and our discussion will be based mostly on Model 4. The R2 values are generally low for all assets. It may be noted that similar is often the case with earlier firm level replacement models even with time-series data (e.g. Eisner, 1972). As presumed in the neoclassical models, output growth and wage rate increase show no significant effect on discard rates in any of the three asset types. The process-innovation is found to play a positive and significant role in machinery discard (M3 and M4 in Table 9), which is in compliance with our probit results. However, innovation variables are not significant in the case of transport and computers. This result contrasts with our results from the probit analysis that product-innovation plays a positive role in discard decisions of computer. This may suggest that though firms’ decision on computer discard is affected by the product-innovation, the magnitude of the discard is not affected by the same. Model 6 for computer discards suggests that firms belonging to high-tech industries discard much more than low-tech firms; the high-tech dummy has obtained a significant positive coefficient.

26
Table 9: OLS estimates for Machinery discard: Dependent variable ln(1+Dr) Variable M1 M2 M3 M4 M5 M6
Intercept 0.069 * 0.08 * 0.077 * 0.075 * 0.072 * 0.043 ***(0.041) (0.045) (0.044) (0.045) (0.043) (0.01)
YG 0.009 0.009 0.01 0.008 0.007 0.005(0.03) (0.03) (0.03) (0.03) (0.031) (0.031)
WG -0.024 -0.02 -0.022 -0.022 -0.021 -0.021(0.053) (0.053) (0.053) (0.053) (0.052) (0.052)
AGE -0.001 -0.001 -0.001 -0.001 * -0.001(0.001) (0.001) (0.001) (0.0005) (0.000)
INNOV 0.001(0.009)
PDTIN -0.009(0.008)
PCSIN 0.009 * 0.006 * 0.006(0.006) (0.004) (0.006)
TURN -0.001 0.005(0.017) (0.014)
RDX 0.109(0.322)
RDN 0.09(0.129)
HTEK 0.003(0.006)
R2 0.061 0.066 0.071 0.069 0.069 0.009Adj R2 0.018 0.018 0.020 0.017 0.018 -0.008 Notes: *** indicates significance at 1 per cent, ** at 5 per cent and * at 10 per cent. Figures in parenthesis are heteroscedasticity adjusted standard errors. All the models, except M6 are estimated with industry dummies. Table 10: OLS estimates for Computer discard: Dependent variable ln(1+Dr) Variable M1 M2 M3 M4 M5 M6
Intercept 0.139 0.087 0.086 0.082 0.076 0.0002(0.106) (0.106) (0.107) (0.107) (0.109) (0.012)
YG 0.028 0.031 0.031 0.028 0.029 0.028(0.037) (0.037) (0.037) (0.038) (0.037) (0.049)
WG -0.005 -0.032 -0.032 -0.037 -0.034 -0.042(0.074) (0.074) (0.074) (0.074) (0.074) (0.069)
AGE 0.006 *** 0.006 *** 0.006 *** 0.006 *** 0.006 ***(0.002) (0.002) (0.002) (0.002) (0.001)
INNOV -0.003(0.011)
PDTIN 0.002(0.01)
PCSIN -0.004 -0.005 -0.005(0.01) (0.01) (0.009)
TURN 0.015 0.025(0.022) (0.017)
RDX -0.097(0.643)
RDN 0.103(0.177)
HTEK 0.015 *(0.009)
R2 0.090 0.116 0.116 0.117 0.069 0.009Adj R2 0.047 0.069 0.066 0.068 0.017 -0.008 Notes: As in Table 9

27
Table 11: OLS estimates for Transport Equipment discard Variable M1 M2 M3 M4 M5 M6
Intercept 0.521 *** 0.435 *** 0.434 *** 0.456 *** 0.485 *** 0.076 ***(0.009) (0.041) (0.04) (0.043) (0.042) (0.029)
YG 0.009 0.016 0.026 0.029 0.031 0.024(0.067) (0.064) (0.063) (0.064) (0.07) (0.065)
WG 0.247 0.204 0.177 0.184 0.204 0.179(0.177) (0.172) (0.174) (0.176) (0.166) (0.186)
AGE 0.009 ** 0.01 *** 0.009 ** 0.009 ** 0.008 **(0.004) (0.004) (0.004) (0.004) (0.003)
INNOV 0.008(0.024)
PDTIN 0.036(0.025)
PCSIN -0.029 -0.014 -0.018(0.026) (0.022) (0.023)
TURN 0.003 0.039(0.038) (0.038)
RDX -1.032(0.851)
RDN -0.159(0.425)
HTEK -0.007(0.02)
R2 0.130 0.159 0.169 0.161 0.166 0.037Adj R2 0.063 0.086 0.092 0.084 0.089 0.011 Notes: As in Table 9 The age variable has a significant positive effect on discard rates both for computer as well as transport equipment, which is in conformity with the probit results. While the magnitude of the coefficient is 0.006 in computers, it is 0.009 in transport equipment. This implies that a one year higher age may lead to a 0.6 and 0.9 per cent increase in (1+) discard rate. Surprisingly the age variable has obtained a negative coefficient in machinery, though it is significant only in M5. Though the magnitude of the coefficient is very small, this result is somewhat puzzling, as the probit results have shown a significant positive effect of age on discard decisions. This may be because of the distinct feature of machinery as compared to computers or transport equipment. The machinery, as defined in our data, is a composite asset, and this composition of the asset matters for discard rates. Production activity comprises an array of processes, and the machine associated with each process may have different characteristics in terms of efficiency and scrapping pattern.32 It is possible that firms keep part of their very old assets leading to a higher average age, but a lower discard rate. Therefore, though they may decide to discard, the relative magnitude of discard as a per cent of the capital stock is low. This implies that age can still be a factor in the decision to discard as seen in our probit analysis, though it tends to show an insignificant impact on discard rate. Also, one should not trivialize the possibility that there can be measurement error in the discard. Thus the overall conclusion emerging from the OLS analysis is that the differences in discard rates across firms are not primarily driven by the differences in output or wage rate growth. Rather they are predominantly driven by the age of the asset for transport equipment and computers, suggesting the importance of obsolescence and wear-and-tear. While process-innovation plays a role
32 See Chapter 2 of Pack (1987) for a detailed description of how different machinery is merged in the production process in textile industry, for example.
28
in machinery discard, innovation tends to play no role in the discard rates of transport equipments and computers.
6. Concluding Remarks
This paper has made an attempt to relate firms’ decisions to discard and the amount of discards to innovation, economic and age variables. To date there is only little empirical evidence on actual discard behaviour and its determinants, particularly in terms of the effect of innovation. As a prelude to the empirical analysis we have provided a review of the determinants of discards identified in different schools of thought. Evidently, the review suggests that modelling the discard decision is a complex task, and hence one needs to use an eclectic approach. We observe that neoclassical models assume discards as a constant proportion of capital stock, and hence assign no role for economic or innovation variables. On the other hand, vintage capital and evolutionary models stress the importance of input prices, innovation and age of the capital. Many technology studies have identified the possible importance of innovation in determining the lifetime of capital assets, as rapid change in technology will have an impact on firm’s discard decisions as capital assets may become obsolete well before the end of their physical life time. Taking this into account, we have derived ideas from various theoretical models and specified our empirical model, where discard decisions (and rates) are expressed as a function of output growth, input prices, age of capital and innovation indicators. Given our data limitations, we have followed two basic empirical approaches- a probit analysis where the decision to discard or not is related to output, price, innovation and age variables, and a cross-section ordinary least square analysis where average firm-level discard rates are related to the selected variables. Our empirical results seem to provide supporting evidence on the relationship between innovation and discard rates. We obtain significant positive effects of process-innovation in a firm on machinery discards. If we interpret a new process introduced by the firm as an indicator of external innovation, its positive effect on machinery discard may be considered as supportive evidence for Salter’s vintage capital model and evolutionary scrapping rules. If the product-innovation causes a relatively larger turnover share the firm tends to have a larger probability to discard its computer. Moreover, firms belonging to high-tech industries seem to have a higher probability to discard their computers. Discarding of transport equipment seems to have no association with innovation variables. As in the case of previous studies (Das, 1992, Cockburn and Frank, 1992, Parks, 1977), our results suggest that the average age of the asset is a major determinant of the scrapping decision. This is also in conformity with vintage capital and evolutionary models (See Table 1). Age of the asset is considered to be an indicator of physical wear-and-tear. Following the recent literature, however, we consider age as an indicator of more than the engineering considerations; it can be interpreted as an indicator of embodied technological change and obsolescence alongside efficiency loss (Bahk and Gort, 1993; Wolff, 1991; Gittleman et al, 2006). However, without additional information about the technical changes in the machinery producing sector, it is quite difficult to say whether it is obsolescence or wear-and-tear that dominates in machinery discard. In addition, machinery is a composite asset, where the wear-and-tear between different components can be quite different, which will cause to have ambiguous effect of age on discard. We could however, say that given the significant effect of age on computer discard, and given the characteristics of computer asset and the enormous technological change this asset is witnessing, it is most likely that it is the obsolescence that

29
dominates the computer discard. Also note that we have evidence that high-tech industries have a higher discard probability for computer. Here, if we assume that computers are relatively more important for high-tech industries and therefore, in these industries discards are more sensitive to technological change in computers, the discard probability will also be higher. Thus obsolescence seems to be main driver of discard decision in computers and this seems to be sensitive to the nature of the industry. For machinery it is not clear whether obsolescence or wear-and-tear that plays the main role; one needs further asset detail to make firmer conclusion on this. The output and wage rates growth rates are not significant for the decision to discard, which is in contradiction with vintage capital models. Output growth is expected to be an important determinant of discard decisions, as an intense use of an asset due to output expansion may cause it to wear out faster. Nevertheless, this is not visible in our results, probably due to the lack of a time element in our analysis. It is expected that firms facing high wage growth may consider moving towards new labour-saving technology, that will accelerate scrapping and replacement. However we did not obtain such a result; the wage rate is found to be insignificant. This may be due to the fact that hiring and firing rules in the Netherlands are quite rigid, so that the substitution is less cost-effective, at least in the short run. It is important to note that there are other relevant determinants of discard such as repair and maintenance costs, external price and technology shocks, policy regulations etc. that are omitted in our analysis. However, the omission of these variables is considered to be less problematic in so far their effect will be the same across all firms. A major limitation of this study is the lack of panel data. The main aim of the study was to look at the precise relationship between innovation and discard decision, which further restricted our analysis to a cross-section as we did not had sufficient firm-level information on innovation on a time-series basis. It should, however, be noted that most empirical studies on investment behaviour use panel data, (see Hall, Mairesse and Mulkay, 1998 for a review). Admittedly, more research is, required to quantify the effect of innovation on discard behaviour, using more dynamic time series data, as the current exercise does not account for such issues.
References
Aghion, P. and P. Howitt (1998), Endogenous Growth Theory, Cambridge, MA. MIT Press Asplund, M (2000), What fraction of a capital investment is sunk costs?, Journal of Industrial Economics, 48(3), 287-304. Bahk, B-H and M. Gort (1993), Learning by doing in new plants, Journal of Political Economy 101(4), 561-583. Baily, M (1981), Productivity and the services of capital and labor, Brookings Papers on Economic Activity, 1, 1-50. Bardhan, P and R. Priale (1996), Endogenous growth theory in a vintage capital model, Working Paper C96-069, Center for International and Development Economics Research (CIDER). Benhabib, J and A. Rustichini (1993), A vintage capital model of investment and growth: theory and evidence: in R. Becker., M. Boldrin., R. Jones and W.L. Thomson (eds.), General Equilibrium, Growth and Trade. II. The Legacy of Lionel W. McKenzie, New York, Academic Press.

30
Berndt, E.R (1991), The Practice of Econometrics: Classic and Contemporary, Reading, MA, Addison-Wesley, Boddy, M and M. Gort (1971), The substitution of capital for capital, Review of Economics and Statistics, 53(2), 179-188. Boucekkine, R and A. Pommeret (2004), Energy saving technical progress and optimal capital stock: the role of embodiment, Economic Modelling, 21, 429–444. Boucekkine, R., M. Germain and O. Licandro (1997), Replacement echoes in the vintage capital growth model, Journal of Economic Theory, 74, 333-348. Boucekkine, R., M. Germain, O. Licandro and A. Magnus (1998), Creative destruction, investment volatility, and the average age of capital, Journal of Economic Growth, 3, 361–384. Caballero, R, J and M.L. Hammour (1996), On the timing and efficiency of creative destruction, The Quarterly Journal of Economics, 111 ( 3), 805-852. Cefis, E and O. Marsili (2005), A matter of life and death: innovation and firm survival, Industrial and Corporate Change, 14(6), 1167-1192. Chirinko, R.S (1993), Business fixed investment spending: modeling strategies, empirical results and policy implications, Journal of Economic Literature, 31, 1875-1911. Clapham, J. C. R (1957), Economic life of equipment, Operations Research, 8 (4), 181-190. Cockburn, I and M. Frank (1992), Market conditions and retirement of physical capital: evidence from oil tankers, NBER Working Papers 4194. Cohen, W. M and D.A. Levinthal (1989), Innovation and learning: the two faces of R&D, The economic journal, 99(397), 569-96. Cooley, T.F., J. Greenwood and M. Yorukoglu (1997), The replacement problem, Journal of Monetary Economics, 40, 457 499. Cooper, R and J. Haltiwanger (1993), The aggregate implications of machine replacement: theory and evidence, American Economic Review, 83(3), 360-82. Cooper, R., J. Haltiwanger and L. Power (1999), Machine replacement and the business cycle: lumps and bumps, American Economic Review, 89(4), 921-946. Cramer, J. S (1958), The depreciation and mortality of motor-cars, Journal of the Royal Statistical Society, 121(1), 18-59. Cummins, J.G and G.L. Violante (2002), Investment-specific technical change in the US (1947-2000): measurement and macroeconomic consequences, Review of Economic Dynamics, 5(2), 243-284. Das, S (1992), A micro-econometric model of capital utilization and retirement: the case of the U.S. cement industry, Review of Economic Studies, 59 (199), 277-298. De Long, J. B and L.H. Summers (1991), Equipment investment and economic growth, The Quarterly Journal of Economics, 106 (2), 445-502. Dekle, R (2001), A note on growth accounting with vintage capital, Economics Letters, 72 (2), 263- 267. Dixit, A.K. & R.S. Pindyck (1994): Investment under Uncertainty Princeton University Press, Princeton, N.J., 1994 Doms M. E., W. E. Dunn., S. D. Oliner and D. E. Sichel (2004), How fast do personal computers depreciate? concepts and new estimates, NBER Working Paper 10521 Driver, C (1990), The effects of accelerated capital scrapping: one-off or ongoing?, International Review of Applied Economics, 4 (2), 199 – 208. Economics, 10(1), 92-116. Eilon, S. J. R. King and D. E. Hutchinson (1966), A Study in Equipment Replacement, Operations Research, 17 (1), 59-71

31
Eisner R; M.I Nadiri (1968), Investment behaviour and neo-classical theory, The review of Economics and Statistics, 50(3), 369-382. Erumban, A.A (2008), Lifetimes of machinery and equipment: evidence from Dutch manufacturing, Review of Income and Wealth, 54(2), 237-268. Feldstein M S and Rothschild M (1974), Towards an economic theory of replacement investment, Econometrica, 42 (3) 393-423 Feldstein, M.S and D.K. Foot (1971), The other half of gross investment: replacement and modernization expenditures, The Review of Economics and Statistics, 53(1), 49-58. Gittleman, M., T. Raa and E.N. Wolff (2006), The vintage effect in tfp-growth: an analysis of the age structure of capital, Structural Change and Economic Dynamics, 17, 306–328 Goolsbee A and D.B. Gross (1997), Estimating adjustment costs with data on heterogeneous capital goods, NBER Working Paper 6342 Goolsbee, A (1998), The business cycle, financial performance, and the retirement of capital goods, Review of Economic Dynamics, 1 (2), 474-96 Gort, M and R.A. Wall (1998), Obsolescence, input augmentation, and growth accounting, European Economic Review, 42 (9), 1653-65. Greene, W (2002), Econometric Analysis, Prentice Hall Greenwood, J and B. Jovanovic (2001), Accounting for growth: in Hulten, C.R.., E.R. Dean and M.J. Harper (eds.), New Developments in Productivity Analysis, 179-222, NBER Studies in Income and Wealth, vol. 63. Chicago and London: University of Chicago Press Greenwood, J., Z. Hercowitz and P. Krusell (1997), Long-run implications of investment-specific technological change, American Economic Review, 87 (3), 342-62. Griliches, Z (1979), Issues in assessing the contribution of R&D to productivity growth, Bell Journal of Griliches, Z (1994), Productivity, R&D, and the data constraint, American Economic Review, 84, 1- 23. Grossman, G. M and E. Helpman (1991), Quality ladders in the theory of growth, The Review of Economic Studies, 58 (1), 43-61. Habakkuk, H. J (1962), American and British Technology in the Nineteenth Century, New York: Cambridge Univ. Press. Hall, B.H., J. Mairesse and B. Mulkay (1998), Firm level investment in france and the united states: an exploration of what we have learned in twenty years, Economics Working Papers 98-261, University of California at Berkeley. Hendricks, L (2000), Equipment investment and growth in developing countries”, Journal of Development Economics, 61 (2), 335-64. Hercowitz, Z (1998), The 'embodiment' controversy: A review essay, Journal of Monetary Economics, 41 (1), 217-224. Hornstein, A and P. Krusell (1996), Can technology improvements cause productivity slowdowns?: in Bernanke, B and J. Rotemberg (eds.), NBER Macroeconomics Annual, Cambridge MA: MIT Press, 209-259 Howitt, P. (1998), Measurement, obsolescence and general purpose technologies: in Helpman (eds.), General Purpose Technology and Economic Growth, MIT Press. Hubbard, R.G (1998), Capital-market imperfections and investment, Journal of Economic Literature, 36 (1), 193-225. Hulten, C. R and F.C. Wykoff (1996), Issues in the measurement of economic depreciation: introductory remarks, Economic Inquiry, January 1996, 34 (1) 10-23.

32
Hulten, C.R (1992), Growth accounting when technical change is embodied in capital, American Economic Review, 82, 964–980. Hulten, C.R. (1990), The measurement of capital: in Berndt, E.R and J. Triplett (eds.), Fifty Years of Economic Measurement, NBER. Johansen, L (1959), Substitution versus fixed production coefficients in the theory of economic growth: a synthesis, Econometrica 27, 157-76. Jorgenson, D.W (1963), Capital theory and investment behavior, American Economic Review, 53 (2), 247-259. Jorgenson, D.W (1967), The theory of investment behavior: in Ferber, R. (eds.), Determinants of Investment Behavior, New York, Columbia University Press, 247-59. Jorgenson, D.W and Z. Griliches (1967), The explanation of productivity change, Review of Economic Studies, 34, 249-283. Kendrick, J.W (1980), Productivity trends in the United States: in Maital, S and N.M Meltz (eds.), Lagging Productivity Growth, Cambridge, Ballinger Publishing Co., 9–31. Klomp, L and G. van Leeuwen (2001), Linking innovation and firm performance: a new approach, International Journal of the Economics of Business, 8, 343�364. Lach, S and M. Schankerman (1989), Dynamics of R & D and investment in the scientific sector, Journal of Political Economy, 97 (4), 880-904. Lach, S and R. Rob (1992), R&D, investment and industry dynamics, NBER Working Paper No. W4060 Lambe, T.A (1974), The decision to repair or scrap a machine, Operational Research Quarterly, 25(1), 99-110 McHugh, R and J. Lane (1987), The age of capital, the age of utilized capital, and tests of the embodiment hypothesis, The Review of Economics and Statistics, 69(2), 362-367 Musso, P (2004), Productivity slowdown and resurgence. the role of capital obsolescence, Revue Economique, 55(6), 1215-1239. Nelson, R.R (1964), Aggregate production functions and medium-range growth projections, The American Economic Review, 54 (5), 575-606. Norris, K.P (1957), The costing of investment decisions, The journal of industrial economics, 5(2), 112-123. OECD (2001), Measuring Capital: A Manual on the Measurement of Capital Stocks, Consumption of Fixed Capital and Capital Services, Paris, OECD. Oliner, S.D (1996), New evidence on the retirement and depreciation of machine tools, Economic Inquiry, 34(1), 57-77. Oulton, N (1990), Labour productivity in UK manufacturing in the 1970s and in the 1980s, National Institute Economic Review, 132 (1), 71-91. Oulton, N (1995), Depreciation, obsolescence and the role of capital in growth accounting, Bulletin of Economic Research, 47(1), 21-33. Pack, H (1987), Productivity, Technology and Industrial Development: A Case Study in Textiles, Washington D.C, The World Bank. Parks, R.W (1977), Determinants of scrapping rates for postwar vintage automobiles, Econometrica, 45(5),1099-1115 Pindyck, R. S (1993), Irreversibility, uncertainty and investment: in Serven, L and A. Solimano (eds.), Striving for Growth after Adjustment, Washington, DC, World Bank, 31–80. Powers, S.G (1988), The role of capital discards in multifactor productivity measurement, Monthly Labor Review, 111(6)

33
Quayle, N. J. T (1972), Damaged vehicles - replace or repair? Operational Research Quarterly 23 (1), 83-87. Romer, P.M (1990),.Endogenous technological change, Journal of Political Economy, 98(5), 71-102. Sakellaris, P and D.J. Wilson (2004), Quantifying embodied technological change, Review of Economic Dynamics 7, 1–26. Salter, W.E.G (1960), Productivity and Technical Change, Cambridge University Press. Schuette, H.L (1994), Vintage capital, market structure and productivity in an evolutionary model of industry growth, Journal of Evolutionary Economics, 4(3), 173-184. Scott, M.F (1989), A New View of Economic Growth, Oxford, Clarendon Press. Silverberg, G (1991), Dynamic vintage models with neo-Keynesian features: in Nelson, R.R (eds.), Technology and Productivity: The Challenge for Economic Policy, Paris, OECD. Solow, R.M (1960), Investment and technical progress: in Arrow, K., S. Karlin and P. Suppes (eds.) Mathematical Methods in the Social Sciences, Chicago, University of Chicago Press. Solow, R.M (1962), Substitution and fixed proportions in the theory of capital, The Review of Economic Studies, 29 (3), 207-218. Solow, R.M., J. Tobin., C.C. von Weizsäcker and M. Yaari (1966), Neoclassical growth with fixed factor proportions, The Review of Economic Studies, 33 (2), 79-115. Swan, P.L (1976), Optimum replacement of capital goods with labor-saving technical progress: a comparison of the early new England and British textile firm, The Journal of Political Economy, 84 (6), 1293-1303. Tobin, J (1969), A general equilibrium approach to monetary theory, Journal of Money, Credit and Banking, 1(1), 15-29. Tobin, J (1978), Monetary policies and the economy - the transmission mechanism, Southern Economic Journal, 44 (3), 421-31. Toivanen, O and P. Stoneman (1998), Dynamics of R&D and investment: UK evidence, Economics Letters, 58 (1), 119-126. Walker, F.V (1968), Determinants of auto scrappage, Review of Economic Statistics, 50, 503-506. Whelan, K (2002), Computers, obsolescence, and productivity, Review of Economics and Statistics, 2002, 84 (3), 445-61. White, L.J (1971), The automobile industry since 1945, Cambridge, Harvard University Press Wolff, E (1996), The productivity slowdown: the culprit at last? follow-up on Hulten and Wolff, American Economic Review, 86(5), 1239-1252.
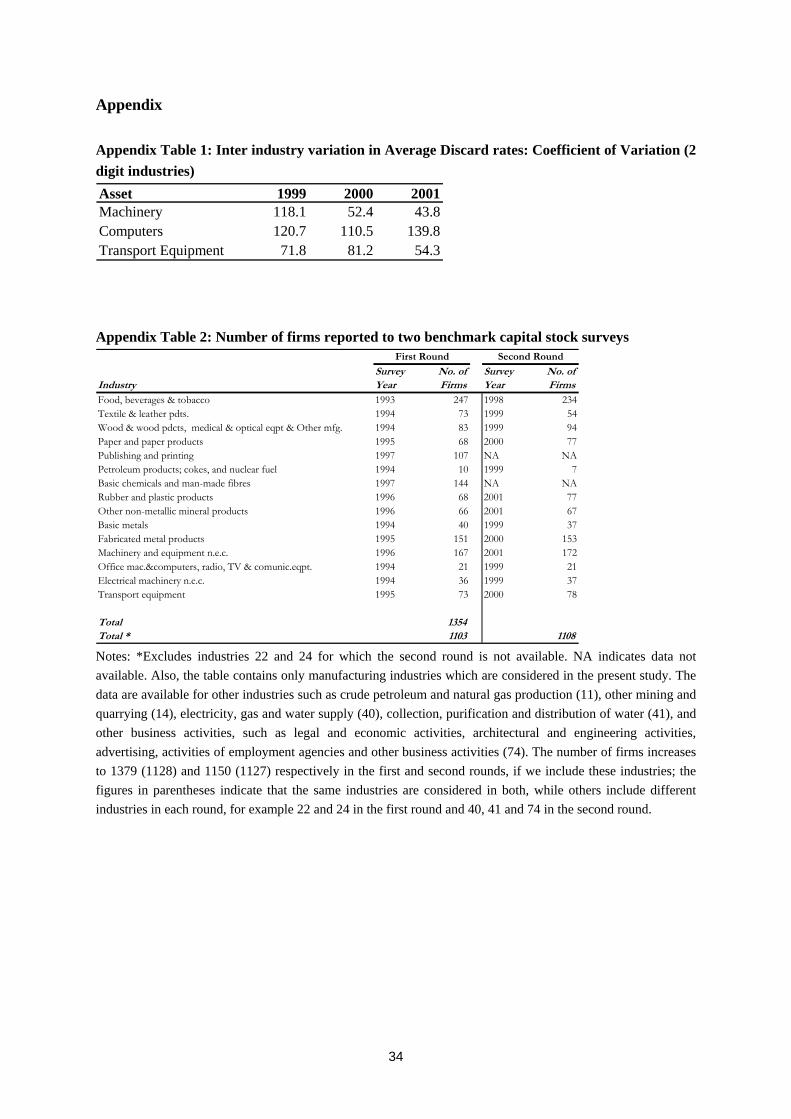
34
Appendix
Appendix Table 1: Inter industry variation in Average Discard rates: Coefficient of Variation (2 digit industries) Asset 1999 2000 2001Machinery 118.1 52.4 43.8Computers 120.7 110.5 139.8Transport Equipment 71.8 81.2 54.3 Appendix Table 2: Number of firms reported to two benchmark capital stock surveys
Survey No. of Survey No. ofIndustry Year Firms Year FirmsFood, beverages & tobacco 1993 247 1998 234Textile & leather pdts. 1994 73 1999 54Wood & wood pdcts, medical & optical eqpt & Other mfg. 1994 83 1999 94Paper and paper products 1995 68 2000 77Publishing and printing 1997 107 NA NAPetroleum products; cokes, and nuclear fuel 1994 10 1999 7Basic chemicals and man-made fibres 1997 144 NA NARubber and plastic products 1996 68 2001 77Other non-metallic mineral products 1996 66 2001 67Basic metals 1994 40 1999 37Fabricated metal products 1995 151 2000 153Machinery and equipment n.e.c. 1996 167 2001 172Office mac.&computers, radio, TV & comunic.eqpt. 1994 21 1999 21Electrical machinery n.e.c. 1994 36 1999 37Transport equipment 1995 73 2000 78
Total 1354Total * 1103 1108
First Round Second Round
Notes: *Excludes industries 22 and 24 for which the second round is not available. NA indicates data not available. Also, the table contains only manufacturing industries which are considered in the present study. The data are available for other industries such as crude petroleum and natural gas production (11), other mining and quarrying (14), electricity, gas and water supply (40), collection, purification and distribution of water (41), and other business activities, such as legal and economic activities, architectural and engineering activities, advertising, activities of employment agencies and other business activities (74). The number of firms increases to 1379 (1128) and 1150 (1127) respectively in the first and second rounds, if we include these industries; the figures in parentheses indicate that the same industries are considered in both, while others include different industries in each round, for example 22 and 24 in the first round and 40, 41 and 74 in the second round.

35
Appendix Table 3: No. of manufacturing firms reported to investment, discard, output and innovation surveys
Investment Discard Output InnovationSurvey Survey + Survey Survey (CiS3)
1997 1335 1245 11921998 1403 1244 11431999 1455 1145 10522000 1502 1204 10142001 1561 1151 10951998-00 1075Final Sample* 459 459 459 459 Note:+ In the last two years data is available on industries 11, 14 and 40 also, nevertheless, they are not included here. If they are included, the number of firms in 2000 increases to 1281 and in 2001 to 1211. Appendix Table 4: Classification of manufacturing industries based on technology
Industries ISIC Rev. 3 High-technology industries Aircraft and spacecraft 353 Pharmaceuticals 2423 Office, accounting and computing machinery 30 Radio, TV and communciations equipment 32 Medical, precision and optical instruments 33 Medium-high-technology industries Electrical machinery and apparatus, n.e.c. 31 Motor vehicles, trailers and semi-trailers 34 Chemicals excluding pharmaceuticals 24 excl. 2423Railroad equipment and transport equipment, n.e.c. 352 + 359 Machinery and equipment, n.e.c. 29
Hig
h-te
ch
.
Medium-low-technology industries Building and repairing of ships and boats 351 Rubber and plastics products 25 Coke, refined petroleum products and nuclear fuel 23 Other non-metallic mineral products 26 Basic metals and fabricated metal products 27-28 Low-technology industries Manufacturing, n.e.c.; Recycling 36-37 Wood, pulp, paper, paper products, printing and publishing 20-22 Food products, beverages and tobacco 15-16
L
ow-t
ech
.
Textiles, textile products, leather and footwear 17-19
Source: OECD: ANBERD and STAN databases, May 2003, http://www1.oecd.org/publications/e-book/92-2003-04-1-7294/annex-1.htm

36
Appendix Table 5: Correlation between explanatory variables YG WG AGE INNOV PDTIN TURN PCSIN RDX
WG 0.02 AGE 0.01 0.04 INNOV 0.01 0.03 0.05 PDTIN 0.11 0.06 0.03 0.81 TURN 0.15 0.14 -0.06 0.43 0.54 PCSIN 0.02 0.05 0.05 0.64 0.44 0.24 RDX 0.04 0.02 0.15 0.09 0.13 0.16 0.03 RDN 0.09 0.08 0.07 0.2 0.23 0.32 0.06 0.56
WG 0.02 AGE -0.07 0.06 INNOV 0.01 0.03 -0.02 PDTIN 0.11 0.06 -0.01 0.81 TURN 0.15 0.15 -0.02 0.43 0.54 PCSIN 0.02 0.05 0.06 0.64 0.45 0.24 RDX 0.04 0.02 0.08 0.09 0.13 0.16 0.02 RDN 0.09 0.08 0.06 0.2 0.24 0.32 0.06 0.56
WG 0.23 AGE -0.05 0.02 INNOV 0.13 -0.01 -0.14 PDTIN 0.16 0.07 -0.11 0.82 TURN 0.21 0.15 -0.17 0.44 0.54 PCSIN 0.16 -0.04 -0.03 0.68 0.49 0.32 RDX 0.11 0.07 0.08 0.12 0.13 0.16 0.08 RDN 0.21 0.11 0 0.2 0.22 0.26 0.12 0.63
Machinery
Computer
Transport

37
Papers issued in the series of the EU KLEMS project
All papers are available in pdf-format on the internet: http://www.euklems.net/
No.1 Mas, Matilde and Javier Quesada, ICT and Economic Growth in Spain 1985-2002 (January 2005)
No.2 Jalava, Jukka, Growth and Productivity in the Finnish Trade Industry, 1975-2003: A National Comparative Perspective (January 2005)
No. 3 Milana, Carlo, The Theory of Exact and Superlative Index Numbers Revisited (March 2005)
No. 4 Jalava, Jukka, Matti Pohjola, Antti Ripatti and Jouko Vilmunen, Biased Techonological Change and Capital-labour Substitution in Finland, 1902-2003 (March 2005)
No. 5 Oulton, Nicholas, Ex Post versus Ex Ante Measures of the User Cost of Capital (August 2005)
No. 6 Görzig, Bernd, Martin Gornig and Axel Werwatz, Firm Specific Wage Spread in Germany -Decomposition of regional differences in inter firm wage dispersion (September 2005)
No. 7 Van Ark, Bart and Robert Inklaar, Catching Up or Getting Stuck? Europe’s Problems to Exploit ICT’s Productivity Potential (September 2005)
No. 8 Aulin-Ahmavaara, Pirkko and Perttu Pakarinen, Industry Level and Aggregate Measures of Productivity Growth with Explicit Treatment of Taxes on Products (December 2005)
No. 9 Corrado, Carol, Paul Lengermann, Eric J. Bartelsman and J.Joseph Beaulieu, Modeling Aggregate Productivity at a Disaggregate Level: New Results for U.S. Sectors and Industries (July 2006)
No. 10 Ypma, Gerard and Bart van Ark, Employment and Hours Worked in National Accounts: A Producer’s View on Methods and a User’s View on Applicability (August 2006)
No. 11 Milana, Carlo, Measurement Problems with Non-Invariant Economic Index Numbers of Outputs, Inputs, and Productivity: The Case of Italy (August 2006)
No. 12 Mas, Matilde, Infrastructures and ICT: Measurement Issues and Impact on Economic Growth (December 2006)
No. 13 Biatour, Bernadette, Geert Bryon and Chantal Kegels, Capital services and total factor productivity measurements: impact of various methodologies for Belgium (March 2007)
No. 14 Avonds, Luc, Caroline Hambÿe and Bernhard Michel, Supply and Use Tables for Belgium 1995-2002: Methodology of Compilation (March 2007)
No. 15 Biatour, Bernadette, Jeroen Fiers, Chantal Kegels and Bernhard Michel, Growth and Productivity in Belgium (March 2007)
No. 16 Timmer, Marcel, Gerard Ypma and Bart van Ark, PPPs for Industry Output: A New Dataset for International Comparisons (March 2007)
No. 17 Bernd Görzig, Depreciation in EU Member States: Empirical and Methodological Differences (April 2007)

38
No. 18 Fukao, Kyoji and Tsutomu Miyagawa, Productivity in Japan, the US, and the Major EU Economies: Is Japan Falling Behind? (July 2007)
No. 19 Broersma, Lourens, Productivity-Participation Trade-Off: Europe versus Anglo-Saxon countries (January 2008)
No. 20 Broersma, Lourens, Differences in Unemployment by Educational Attainment in the US and Europe: What Role for Skill-Bias Technological Change and Institutions? (January 2008)
No. 21 Kegels, Chantal, Michael Peneder and Henry van der Wiel, Productivity performance in three small European countries: Austria, Belgium and the Netherlands (April 2008)
No. 22 Inklaar, Robert and Michael Koetter, Financial dependence and industry growth in Europe: Better banks and higher productivity (April 2008)
No. 23 Fernández Vázquez, Esteban and Bart Los, Addressing Keller’s Critique: More on The Identification of Productive Technology Spillovers (March 2008)
No. 24 Erumban, Abdul Azeez, Innovation, Obsolescence and Retirement: An Exploration Based on Data for Dutch Manufacturing Firms (June 2008)