INNOVATION MANAGEMENT ENTREPRENEURSHIP AND CORPORATE ... · PDF fileProceedings of the 4th...
18
I NNOVATION MANAGEMENT E NTREPRENEURSHIP AND CORPORATE SUSTAINABILITY 2016 Proceedings of the 4th International Conference Sborník
Transcript of INNOVATION MANAGEMENT ENTREPRENEURSHIP AND CORPORATE ... · PDF fileProceedings of the 4th...

INNOVATION MANAGEMENT ENTREPRENEURSHIP AND CORPORATE SUSTAINABILITY 2016Proceedings of the 4th International Conference
S b o r n í k

Proceedings of the 4th International Conference
Organized by: University of Economics, Prague
Innovation Management, Entrepreneurship and
Corporate Sustainability 26 – 27 May, 2016, Prague

Proceedings of the 4th International Conference
Innovation Management, Entrepreneurship and Corporate Sustainability, 2016
2
International Scientific Committee
Chairman: Doc. Ing. Mgr. Martin Lukeš, Ph.D.,
Members:
Doc. Ing. Jitka Srpová, Ph.D.
Doc. Ing. Miroslav Špaček, Ph.D., MBA
Prof. Ing. Anna Pilková, Ph.D., MBA
Doc. Ing. Galina Ostapenko, Ph.D.
International Organizational and Program Committee
Chairman: Doc. Ing. Jitka Srpová, Ph.D.
Members:
Ing. Blanka Habrmanová, Ph.D.
Doc. Ing. Galina Ostapenko, Ph.D.
Ing. Ivana Svobodová, Ph.D.
Ing. Jana Müllerová
Ing. Ladislav Hartman
Ing. Jan Mareš
Ing. Jan Mísař
Ing. Michal Ander
Ing. Ondřej Dvouletý

Proceedings of the 4th International Conference
Innovation Management, Entrepreneurship and Corporate Sustainability, 2016
3
This conference proceedings contain contributions of the conference participants presented
during both days of the conference. All these contributions have successfully passed the double-
blind peer-review process.
All rights of the authors are reserved. The copyright of materials incl. quotations used remains
with the authors. Unauthorised copying is prohibited.
No responsibility is assumed by the publisher for the linguistic and technical accuracy of their
contributions therein.
ISBN 978-80-245-2153-4
DOI 10.18267/pr.2016.svo.2153.4
Edited by: Martin Lukeš, Jan Mísař, Jan Mareš, Ondřej Dvouletý, Miroslav Špaček, Ivana
Svobodová
© Published by Vysoká škola ekonomická v Praze, Nakladatelství Oeconomica – Praha 2016
Nakladatelství Oeconomica, Náměstí W. Churchilla 4, 130 67 Praha 3, Czech Republic

Proceedings of the 4th International Conference
Innovation Management, Entrepreneurship and Corporate Sustainability, 2016
8
Marcela Příhodová – Miroslav Špaček .................................................................................. 607
IMPACT OF THE INNOVATIONS ON REGIONAL GROWTH OVER TIME: DYNAMIC ECONOMETRIC MODELING Svetlana Rastvortseva ............................................................................................................ 621
SUSTAINABLY RESPONSIBLE LEADERSHIP AND INNOVATION Mathias Schüz ........................................................................................................................ 634
CUSTOMER-ORIENTED APPROACH IN RETAIL NETWORKS MANAGEMENT Natalia Sharafutdinova – Lilia Shargu – Yulya Valeeva ....................................................... 657
THE STUDY OF INNOVATION IN TOURISM DEVELOPMENT IN A TOURIST-RECREATIONAL CLUSTER (ON THE EXAMPLE OF THE LIPETSK REGION OF THE RUSSIAN FEDERATION) Olga Skrobotova – Raisa Ivanova – Irina Polyakova ............................................................ 668
ETHICAL RESPONSIBILITY OF SOCIAL SERVICE MANAGER Peter Slovák – Angelika Dudžáková ...................................................................................... 679
INCREMENTAL INNOVATION, PERFORMANCE AND FINANCING AS KEY ELEMENTS IN LOGISTIC CONTROL OF CONSTRUCTION COMPANY Adam Sorokač – Branislav Mišota - Eduard Hyránek ........................................................... 689
CROWDFUNDING AS A CAPITAL SOURCE FOR REAL ESTATE PROJECTS Paulína Srovnalíková – Donatas Ditkus ................................................................................. 701
MOTIVATION TO START-UP A BUSINESS IN RELATIONSHIP TO INNOVATIONS: DOES “GOOD” MOTIVATION REALLY MATTER? Jarmila Šebestová – Zuzana Palová ....................................................................................... 712
DRIVERS FOR CORPORATE SUSTAINBILITY: AN EXAMINATION OF POLISH FIRMS Maria Urbaniec ....................................................................................................................... 720
SOCIO-ECONOMIC ASPECTS OF INDUSTRY 4.0 Jiří Vacek ................................................................................................................................ 731
USING NEUTRAL NETWORKS TO DETERMINE THE FINANCIAL PLAN Marek Vochozka .................................................................................................................... 742
FACTORS SUPPORTING GROWTH OF ADDED VALUE, PERFORMANCE AND COMPETITIVNESS OF SMES AND SELECTED EU COUNTRIES Marek Vochozka – Mariana Psárska ...................................................................................... 756
MIT ENTREPRENEURSHIP ECOSYSTEM WITH FOCUS ON START-UP DEVELOPMENT Marian Zajko .......................................................................................................................... 768

Proceedings of the 4th International Conference
Innovation Management, Entrepreneurship and Corporate Sustainability, 2016
621
IMPACT OF THE INNOVATIONS ON REGIONAL GROWTH
OVER TIME: DYNAMIC ECONOMETRIC MODELING
Svetlana Rastvortseva
Abstract
Technological change leads to the rapid growth of the knowledge-based economy and service
industries, allowing those regions to increase their total factor productivity and to become more
competitive in the global economy.
Innovations are key determinant of regional development but their impact becomes noticeable
often over time. For regional policy it is important to understand in what period of time the
results of innovative projects can affect on the social and economic indicators.
The role played by the innovations in economic growth was recognized and introduced into the
neo-classical approach and R&D theories. We used a pooled regression model for panel data to
look at the affects of innovations on regional growth over time. The empirical analysis based
on a large sample of Russian regions from 2002 to 2014 supports the hypothesis that innovation
can impact on economic development in just a few years.
The aim of the paper is to reflect the nature of innovation influence on economic growth in the
region taking into account time factor.
It was determined that influence of patent activity on regional economic growth is positive and
statistically significant with lagged value of two years, a share of highly educated employees
has positive influence on the rates of economic growth after three years.
The findings of the research are useful for policy applications and policy-makers by providing
them with a better understanding of the impact of innovation factors of regional growth and
length of time needed for the general development.
Key words: innovations, regional economics, economic growth over time, dynamic
econometric modeling, regions of Russia
JEL Code: O30, R11, O47

Proceedings of the 4th International Conference
Innovation Management, Entrepreneurship and Corporate Sustainability, 2016
622
Introduction
Technological change leads to the rapid growth of the knowledge-based economy and service
industries, allowing those regions to increase their total factor productivity and to become more
competitive in the global economy.
Innovations are key determinant of regional development but their impact becomes noticeable
often over time. For regional policy it is important to understand in what period of time the
results of innovative projects can affect on the social and economic indicators.
The issues on regional economic growth have agitated scientists for more than hundred years.
The scientific doctrines and theories which are considered to be classical require actualization
and revision due to the environmental changes where the corresponding provisions shall be
fulfilled. Separate factors of the economic growth, including the innovations to which
significance was not given, develop momentum and require adjustments of economic models.
The earlier original study showed that such innovative factors as internal expenditures for
research and development, expenditures for engineering innovations, personnel capacity,
involved in research and development as well as volume of innovative goods, works, services,
have positive effect on economic development of the territory (which was estimated by the
gross regional product index). The results of the empirical analysis show that the most
significant factors for development of economics are expenditures for engineering innovations
and internal expenditures for research and development. Influence of innovative activity on
GRP is not statistically significant.
The results of the research also revealed that the innovations have positive influence on
economic development of the regions since 2012 only.
The aim of the paper is to reflect the nature of innovation influence on economic growth in the
region taking into account time factor.
1 Theoretical background and bibliography
The role played by the innovations in economic growth was recognized and introduced into the
neo-classical approach and R&D theories.
Up-to-date theories of growth focus on determination of factors through aggregate modeling.
From such standpoint economic development shall be considered as growth of income per
capita in equilibrium. From these models, based on capital allocation, of the Harrod–Domar
model type to neoclassical models of growth (the Solow model, 1957), economic development
Proceedings of the 4th International Conference
Innovation Management, Entrepreneurship and Corporate Sustainability, 2016
623
was considered as a linear process. It was assumed that it was possible to influence on it by
changing existing resources and factors both in theory and in practice. Later, in 1980s the
theories of endogenous growth disputed the priority of engineering factors and underlined
importance of human capital assets (Romer 1990, Lucas 1993, Grossman and Helpman 1993).
At the same time neglect of engineering factors of economic growth does not allow to reflect
influence of non-market processes and social and institutional indices on economic efficiency.
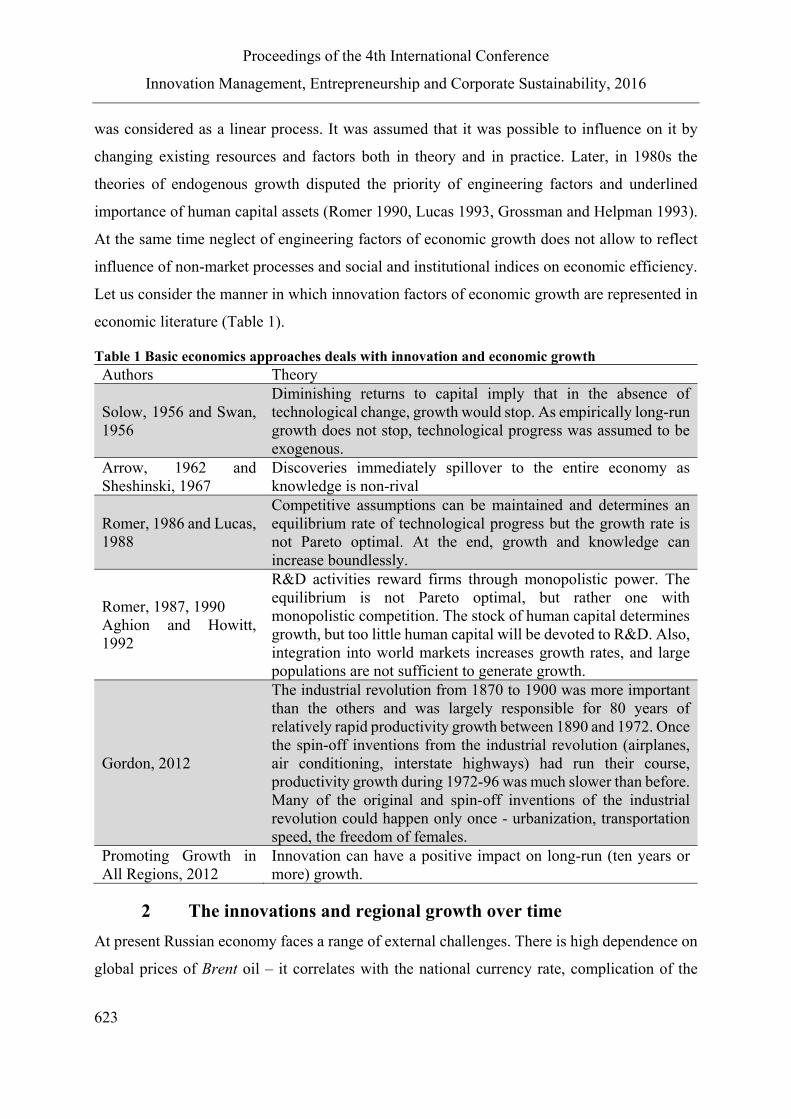
Let us consider the manner in which innovation factors of economic growth are represented in
economic literature (Table 1).
Table 1 Basic economics approaches deals with innovation and economic growth Authors Theory
Solow, 1956 and Swan, 1956
Diminishing returns to capital imply that in the absence of technological change, growth would stop. As empirically long-run growth does not stop, technological progress was assumed to be exogenous.
Arrow, 1962 and Sheshinski, 1967
Discoveries immediately spillover to the entire economy as knowledge is non-rival
Romer, 1986 and Lucas, 1988
Competitive assumptions can be maintained and determines an equilibrium rate of technological progress but the growth rate is not Pareto optimal. At the end, growth and knowledge can increase boundlessly.
Romer, 1987, 1990 Aghion and Howitt, 1992
R&D activities reward firms through monopolistic power. The equilibrium is not Pareto optimal, but rather one with monopolistic competition. The stock of human capital determines growth, but too little human capital will be devoted to R&D. Also, integration into world markets increases growth rates, and large populations are not sufficient to generate growth.
Gordon, 2012
The industrial revolution from 1870 to 1900 was more important than the others and was largely responsible for 80 years of relatively rapid productivity growth between 1890 and 1972. Once the spin-off inventions from the industrial revolution (airplanes, air conditioning, interstate highways) had run their course, productivity growth during 1972-96 was much slower than before. Many of the original and spin-off inventions of the industrial revolution could happen only once - urbanization, transportation speed, the freedom of females.
Promoting Growth in All Regions, 2012
Innovation can have a positive impact on long-run (ten years or more) growth.
2 The innovations and regional growth over time
At present Russian economy faces a range of external challenges. There is high dependence on
global prices of Brent oil – it correlates with the national currency rate, complication of the

Proceedings of the 4th International Conference
Innovation Management, Entrepreneurship and Corporate Sustainability, 2016
624
conditions of access to foreign capital markets for Russian companies − appreciation credit
resources, reduction in influx of foreign direct investment in economy and many other
phenomena. In this connection search for internal (endogenous) reserves of economic growth
assumes critical importance.
For further consideration of the indices of economic growth it is necessary to take into account
inflation factor and to put GRP into comparable prices (for example into prices of 2002). Note
that the price index varies significantly among the regions. Thus, in 2002 the highest inflation
rate was observed in the Krasnoyarsk Territory (18.4 %), and low one – in the Republic of
North Ossetia-Alania (7.8 %). In 2013 maximum price advance took place in the Kaliningrad
Region (15.6 %), minimum price advance – in the Chukotka Autonomous District (4 %). For
further work we will suggest the indices of GRP, GRP per capita, labor efficiency to comparable
prices – prices of 2002.
For period of 2002-2014 Russia's real total GRP was increased by 7.16 % per year on average.
In 2014 the highest index of real GRP was observed in Moscow (22.32 % of total GRP of the
Russian regions), the Khanty-Mansijsk Autonomous District (5.29 %), the Moscow Region
(4.54 %), Saint Petersburg (4.23 %), the Republic of Tatarstan (3.07 %), the Yamalo-Nenets
Autonomous District (3.03 %). In 2014 42.49 % of total production was accounted for six
country-subdividing regions.
Let us consider economic growth of the regions by some indices (Table 2).
Table 2 – Real GRP, GRP per capita and labour productivity in Russian regions, 2002-2014
Change in real GDP Change in real GPD per capita
Change in GRP per worker (labour productivity)
Minimal growth 2,1 % (Magadan region)
3,8 % (Magadan region)
11,7 % (The Republic of Buryatia)
Maximum growth
15,8 % (Sakhalin region)
16,9 % (Sakhalin region)
in 4 times (Sakhalin region)
Range 13,7 pp 13, pp 288,3 pp For comparison: regions of OECD countries, 1995-2005*
Minimal growth -1,7 % (Berlin, DEU) -1,8 (Adana, TUR) -3,8 % (Champagne-Ardenne, FRA)
Maximum growth
8,5 % (Southern and Eastern, IRL)
7,1 % (Southern and Eastern, IRL)
7,1 % (Podlaskie, POL)
Range 10,2 pp 8,9 pp 10,9 pp Note: pp refers to percentage points, DEU- Germany, TUR – Turkey, FRA – France, IRL –
Irland, POL – Poland.

Proceedings of the 4th International Conference
Innovation Management, Entrepreneurship and Corporate Sustainability, 2016
625
* Source: How Regions Grow: Trends and Analysis. Paris. OECD Publishing. 2009
High indices of economic growth are observed in the Sakhalin Region (on average for 2002-
2014 – 15.8 %), the Republic of Ingushetia (15.6 %), the Nenets Autonomous District (13.62
%), the Republic of Dagestan (12.76 %), the Tyumen Region (12.66 %). For the period of
analysis 38 regions of Russia had the higher rates of economic growth than average one on an
aggregate basis, 45 regions – lower that average one. Falling of the mentioned regions within
the leaders can be explained by two reasons. Firstly, in a number of the regions extractive
industry grows rapidly which provides high rates of growth. Secondly, the regions which had
poor development have a high rate of growth.
Initial level of economic development is an important factor of growth. Up to the last decade
of ХХ century the concept of convergence of economic growth trajectories was very popular.
The conclusion from this concept consists in the fact that poor regions shall grow faster than
rich ones as at a modern rate of diffusion of technologies intensification of production shall
have similar rates and therefore capital-labor ratio in the regions with a low initial level shall
grow faster. This assumption often comes into conflict with empirical research. Let us consider
relationship between the rates of economic growth of the Russian regions and initial level of
region development (let us represent if as GRP per capita) (Fig. 1).
Fig.1. Initial GDP per capita and annual average growth rates in real GDP among Russian regions, 2002-2014
Quantity of obtained patents for inventions and for useful models can be considered as
innovation factor in the region. Creation and patenting of inventions and useful models is the
most important result of research and development. A patent for invention or useful model is a

Proceedings of the 4th International Conference
Innovation Management, Entrepreneurship and Corporate Sustainability, 2016
626
protection document certifying the priority, authorship and exclusive right to utilization of
intellectual property for the patent duration. The main source of information on submission of
patent applications and issue of protection documents for inventions and useful models in
Russia is the Federal Service for Intellectual Property (Rospatent).
Note that in the Russian regions inventions much oftener than useful models are patented. A
share of inventions in 2002 is 73.54 %, and in 2014 it was reduced to 65.28 %. In 2014 we can
qualify Moscow (33.27 % of total number), Saint Petersburg (6.85 %), the Moscow Region
(6.62 %), the Republic of Tatarstan (4.57 %), the Samara Region (2.38 %) and the Sverdlovsk
Region (2.37 %) as regions with maximum number of patents. Thus they are not only leading
economic but also industrial centers of the country. In 2014 56.05 % of total number of issued
patents is accounted for six regions.
In 2002 the geographical coverage of patent activity was more diversified – 47.83% is
accounted for a share of six leading regions. As per the index the leaders were Moscow (22.9
%), Saint Petersburg (8.81 %), Moscow (6.74 %), Sverdlovsk (3.32 %), Samara (3.25 %) and
Nizhny Novgorod Region (2.81 %). At large, for the analyzed period, number of patents is
increased by 71.61 %, which indicates weakness of this trend of innovative development.
A share of higher education employees is one more index characterizing innovations and quality
of labor. In this sphere the situation is much better: if in 2002 22.7 % of employees in Russia
had higher education, then in 2014 their percent was increased up to 32.2. The most educated
human resources are in Moscow – it was 50 % (2013), as well as in the Republic of North
Ossetia-Alania (42.2 %), the Moscow Region (41.5 %), Saint Petersburg (41.1 %), the Yamalo-
Nenets Autonomous District (39.8 %). The lowest share of highly educated employees takes
place in the Jewish Autonomous Region (20.3 %) and the Chechen Republic (19.4 %).
It is worth mentioning that if across Russia a share of highly educated employees steadily
grows, then in terms of regional make-up the dynamics of this index is variable. This fact
evidences migration of educated population to more attractive regions.
3 Research methodology
We can distinguish three approaches to research of influence of innovations on economic
growth. The first approach consists in linear modeling. In case of linear modeling we proceed
from the fact that innovations and inventions stimulate increase in labor productivity and result
in economic growth. Empirically, at such approach relationship between research and

Proceedings of the 4th International Conference
Innovation Management, Entrepreneurship and Corporate Sustainability, 2016
627
development and patent activity shall be studied and then influence on economic growth shall
be evaluated. The higher volume of expenditures for research the higher innovative capacity
and rates of economic growth, by extension. Thus a linear model allows us to determine the key
innovative factor of economic growth.
The second approach consists in overall evaluation of regional innovation system. In case of
such approach innovations shall be considered as an integral part of regional development.
Here, interacting institutes created in the region can attract, or vice versa, deter, generation of
innovations. Capability of these institutes to act as catalysts depends on social and structural
conditions created in the region. In separate literary sources a combination of such conditions
is called "social filter". To the number of institutes which enable innovations in the region, we
can relate arrangement of interaction between companies and institutes, finance, engineering
subdivisions, legal services, research establishments, as well as relations with the regional
authorities. Major drawback of such approach consists in complexity of rating of institutes to
carry out empiric studies.
The third approach is also complex enough for empiric implementation. It covers diffusion and
assimilation of knowledges and assumes that we can observe such spillovers in both quality and
quantity. This approach is implemented at microlevel inside innovation establishments –
companies, universities, research centers, regional institutes, between entrepreneurs. Internal
and external interaction results in knowledge transfer and its diffusion.
We used a pooled panel data model to observe the effects of influence of the above mentioned
factors on regional growth in the course of time. A panel specification has some advantages as
compared to cross-sectional specification consisting in measurement of annual influence of
independent variables on economic growth considering interregional interrelation and time
effects.
Panel data approaches allow for lagged effects on the phenomenon to be explained, so if a
particular variable, say infrastructure, takes time to have an impact because it needs to be built
and used, these models allow us to pinpoint the time needed for that impact to emerge.
To use lagged values we applied the Tinbergen and Alt approach (distributed lag model). Such
approach allows to determine balance between accuracy of the model (value of lag variables)
and assessment quality (multicollinearity). It assumes sequential assessment of models:

Proceedings of the 4th International Conference
Innovation Management, Entrepreneurship and Corporate Sustainability, 2016
628
…..
Termination of process is recommended when any of the factors at lagged variables changes
the sign or becomes statistically insignificant, which is a consequence of multicollinearity.
Besides, such situation, when observations are not enough for further increase of number of
lagged variables, is unlikely but possible.
4 Model specifications
To assess the impact of innovation on regional economic growth over time, we will use a power-
mode regression model with constant elasticity:
ibti
m
iti xY 1,
1,
ˆ
, (1)
where tY is average growth of gross regional product (GRP), predicted in the time period t;
α is absolute term of equation;
xi is innovative and other factors, included in the regression model;
bi is equation parameters - regression coefficients, particular elasticity coefficient of
GRP growth on investigated factors;
i is serial number of the factor;
m is number of factors, included in the model.
In linear representation the model looks in the following way:
1,11,
, lnlnˆ
ln
ti
m
ii
ti
ti xbY
Y
. (2)
As a productive indicator we denote the average growth of gross regional product for 2002-
2014. Let’s define factor indicators (Table 3).
Table 3 Factors of economic growth used in analysis Factor Theory Indicators

Proceedings of the 4th International Conference
Innovation Management, Entrepreneurship and Corporate Sustainability, 2016
629
Initial level of GRP per capita
Convergence hypothesisNeo-classical
GRP per capita for the previous year
Human capital Endogenous growth High attainment rate: the share of the labour force with high education
Innovations Endogenous growth Patent intensity: the number of patents granted
Source: Own research, 2016
Basic factors which are considered to be included into the model are initial level of GRP (for
2002), number of issued patents, share of highly educated employees in aggregate number of
employees involved in economy. It is also important to note that economic growth is not
achieved only by means of the mentioned factors – their influence will be insignificant.
Including such variables as infrastructure development level, fixed investment, human
resources, etc. into the model will allow increasing determination coefficient, but at that we
cannot catch the value of innovation factors for economic growth of the territory. Thus,
following the task assigned in the study, we accept the following as independent variables:
Initial GRP – initial GRP in region i in 2002;
Patent – number of issued patents in region i for time period t;
High Edu – share of highly educated employees in aggregate number of employees involved in
economy.
Value of innovations will be reflected in the model by number of patents and level of education
of human resources. Value of labor will be reflected only by the index of share of highly
educated employees. Value of capital was purposely not included into the model due to
complexity of regional infrastructure development level assessment. Preliminary assessments
show that such indicator as road density is not statistically significant at analysis of economic
growth. This can be explained by immense territory of the country – in many regions roads are
not basic element of transport infrastructure. Railway, sea and air transport is preferred for
shipping in the regions of Siberia and Far East. Consequently, degree of the infrastructure
development shall be assessed by an integral index, development of which is not included into
the tasks of this study.
The data used in this study comes mainly from a Russian Federation Federal State Statistics
Service, Statistical Data Book Regions of Russia. Economic and Social Performance for 2002-

Proceedings of the 4th International Conference
Innovation Management, Entrepreneurship and Corporate Sustainability, 2016
630
2015. The data has been collected in 83 regions, with the exception of the Republic of Crimea
and Sevastopol.
5 Interpreting the results
The results of the conducted analysis regarding modeling pair regression are presented in Tab.4.
Table 4 The results of the empirical analysis-characteristic of pair regression models
Initial GRP per capita Patent High Education
b -0,024*** -0,0007 -0,069*** R2 0,028 0,0001 0,0198 Adj R2 0,027 -0,0009 0,0188 F 28,08 0,14 20,01
* Significant at the 5% level
The results of the empirical analysis prove that the most significant factors for the economic
growth initial GRP per capita. In order to determine the best combination of effective factors,
we carry out a distributed lag model (Tab.5).
Table 5 Results of the empirical analysis (distributed lag model) Model 1 Model 2 Model 3 Model 4
Constant 0.19 *** (0.025)
0.18 *** (0.056)
0.17 *** (0.058)
0.22 *** (0.056)
Initial GRP per capita -0.032 *** (0.006)
- - -0.028*** (0.006)
Patent – lag 1 -0.025*** (0.009)
- -0.035*** (0.009)
-0.034*** (0.009)
Patent – lag 2 0.026*** (0.009)
- 0.034*** (0.009)
0.034*** (0.009)
High Education – lag 1 - -0.102** (0.034)
-0.061* (0.035)
-0.045 (0.035)
High Education – lag 2 - -0.017 (0.035)
-0.034 (0.036)
-0.028 (0.035)
High Education - lag 3 - 0.082** (0.032)
0.060* (0.033)
0.057* (0.032)
R2 0.047 0.020 0.033 0.065 Adj R2 0.043 0.016 0.026 0.057 F 12.83 5.14 4.78 8.0 n 783 744 706 706
* Significant at the 5% level

Proceedings of the 4th International Conference
Innovation Management, Entrepreneurship and Corporate Sustainability, 2016
631
Thus, we constructed 4 models. Low determination coefficient takes place due to insignificant
influence of the factors, selected for the analysis, on economic growth. Initial level of Gross
Regional Product per capita is reflected adversely on economic growth rates. At stable statistical
significance of the factor we can conclude that richer regions have indeed lower rates of
economic growth than poor ones.
Such factor of innovative development, as issued patents, has no significant influence on
economic growth without regard to time lags (model 2), but in case of more detailed study we
can see that positive influence of the factor is significant with two-year lag. Here we shall note
that patent activity of the Russian regions is at low enough level. Patents are only becoming a
significant index of innovative development in the Russian regions, as procedure of patenting
is only starting to take roots.
The level of population education is a significant factor of economic growth. However, we see
that high share of highly educated employees positively reflects only after 3 years.
Increase of share of highly educated employees by 1 % will add 0.057-0.082 % to the rates of
economic growth after three years. Increase of patent activity of a region by 1 % will add 0.026-
0.034 % to the rates of economic growth already after 2 years.
Conclusion
This paper shows the nature of innovation influence on regional economic growth with respect
to time factor. To use lagged values we applied the Tinbergen and Alt approach (distributed lag
model). The model includes such factors as initial level of GRP (for 2002), number of issued
patents, share of highly educated employees in aggregate number of employees involved in
economy. Initial level of GRP per capita is statistically significant, but has an adverse effect on
regional economic growth. This allows us to reach the conclusion that richer regions have
indeed lower rates of economic growth than poor ones (which confirms the concept of
convergence of economic growth).
Influence of patent activity on regional economic growth is positive and statistically significant
with lagged value of two years. Therefore, the patents for inventions and useful models issued
in the region contribute in economic growth only after two years.
The level of population education is weighty factor of economic growth, and a share of highly
educated employees has positive influence on the rates of economic growth after three years.
Proceedings of the 4th International Conference
Innovation Management, Entrepreneurship and Corporate Sustainability, 2016
632
The factors considered in the paper are not exhaustive, but the carried out analysis is enough
for reflection of the fact that positive influence of innovations on economic growth of territory
is not instantaneous, but takes place after 2-3 years. This allows to pursue a regional policy
aimed to all-round innovative development
Acknowledgment
Preparation of this paper was supported by the grant of the President of Russian Federation,
project No. MD-5717.2016.6
References
Aghion, P. and P. Howitt (1992). A Model of Growth through Creative Destruction,
Econometrica. 60 (2), 323-51.
Arrow, K. (1962). The Economic Implications of Learning by Doing. A Review of Economic
Studies. 29, 155-173.
Fiľa M. – Kučera J. (2015). Innovation performance of the Slovak Republic and its regional
disparities. Innovation as a factor of regional economic growth: evidence from Russia.
Innovation management and corporate sustainability. IMACS 2015. Proceedings of the 3rd
International conference. 21-22 May, 2015. Vysoká škola ekonomická v Praze, Praha, Czech
Republic. 39-51
Gordon, R. J. (2012). Is US economic growth over? Faltering innovation confronts the six
headwinds (No. w18315). National Bureau of Economic Research.
Lucas R.E. (1988). On the Mechanics of Economic Development. Journal of Monetary
Economics. 22, 3-42.
Promoting Growth in All Regions. (2012). OECD Publications Centre.
Rastvortseva, S. N., & Chentsova, A. S. (2015). Regional Specialization And Geographical
Concentration Of Industry In Russia. Regional Science Inquiry, 7(2), 97-106.
Rastvortseva, S.N. (2015). Innovation as a factor of regional economic growth: evidence from
Russia. Innovation management and corporate sustainability. IMACS 2015. Proceedings of the
3rd International conference. 21-22 May, 2015. Vysoká škola ekonomická v Praze, Praha, Czech
Republic. 251-262
Romer, P. M. (1986). Increasing Returns and Long-run Growth. Journal of Political Economy.
94 (5), 1002-37

Proceedings of the 4th International Conference
Innovation Management, Entrepreneurship and Corporate Sustainability, 2016
633
Romer, P. M. (1987). Growth Based on Increasing Returns Due to Specialization. American
Economic Review. 77 (2), 56-62.
Romer, P. M. (1990). Endogenous Technical Change. Journal of Political Econom. 99, 72-102.
Sheshkinski, E. (1967). Tests of the Learning by Doing’ Hypothesis. Review of Economics and
Statistics. 49, 568–78.
Solow, R. (1956). A Contribution to the Theory of Economic Growth. Quarterly Journal of
Economics. 70, 65-94.
Swan, T. (1956). Economic Growth and Capital Accumulation. Economic Record. 32, 343-61.
Eberts, R.W., Fogarty M.S. (1987). Estimating the Relationship Betveen Local Public and
Private Investment. Cleveland: Federal Reserve Bank of Cleveland, Working Paper No. 8703
Contact
Svetlana Rastvortseva
Belgorod State National Research University
308015 Russia, Belgorod. ul. Pobedy, 85