Innovation main report FINAL - Legal Services Board ... · 2.4.5 Staff Training and Building...
74
Transcript of Innovation main report FINAL - Legal Services Board ... · 2.4.5 Staff Training and Building...


1
Contents Preface .................................................................................................................................... 3
Executive Summary ................................................................................................................ 4
Section 1: Introduction ........................................................................................................... 9
1.1 Background and context ................................................................................................... 9
1.2 Coverage ........................................................................................................................ 10
1.3 Previous benchmarks of innovation in legal services ..................................................... 11
1.4 Overview of the report ..................................................................................................... 14
Section 2: Defining innovation in legal services…………………………………………….……15 2.1 Introduction ..................................................................................................................... 15
2.2 Innovation in professional and business services ........................................................... 15
2.2.1 Types of innovation ............................................................................................... 15
2.2.2 The innovation value chain – an activity based view of innovation ....................... 16
2.3 Identifying innovative practices ....................................................................................... 18
2.3.1 External linkages and ideas (Practices A1, A5, C5) ............................................. 19
2.3.2 R&D and Design Investment (Practices A2, A3) .................................................. 21
2.3.3 Multifunctional Teams (Practices A4, B4, C3) ...................................................... 21
2.3.4 Embeddedness of Team-working (Practice B5) ................................................... 22
2.3.5 Reputation: Advertising and Branding (Practice C2) ............................................ 22
2.3.6 Intellectual Property Protection (Practice C5) ....................................................... 22
2.4 Overarching Practices ..................................................................................................... 23
2.4.1 Innovation Strategy ............................................................................................... 23
2.4.2 Senior Management Team (SMT) ........................................................................ 23
2.4.3 Rewards /Incentives ............................................................................................. 24
2.4.4 Space for Creativity/ Innovation Department ........................................................ 24
2.4.5 Staff Training and Building Absorptive Capacity ................................................... 24
Section 3: Measuring legal services innovation .................................................................... 26
3.1 Introduction ..................................................................................................................... 26
3.2 Overview of survey respondents ..................................................................................... 26
3.3 The drivers of innovation activity ..................................................................................... 27
3.4 Profiling innovation activity .............................................................................................. 28
3.5 Profiling service and delivery innovation ......................................................................... 30
3.5.1 Service innovation ................................................................................................ 30
3.5.2 Delivery innovation ............................................................................................... 32
2
3.6 Innovation activity by sub-sample ................................................................................... 33
3.7 Using social media .......................................................................................................... 37
3.8 The benefits of innovation ............................................................................................... 38
3.9 Summary of key findings ................................................................................................. 38
Section 4: Innovating in legal services .................................................................................. 40
4.1 Introduction ..................................................................................................................... 40
4.2 Leading and managing innovation in legal service providers ......................................... 40
4.3 Internal and external sources of new ideas .................................................................... 43
4.4 Building specific innovations ........................................................................................... 45
4.5 Commercialising innovation ............................................................................................ 46
4.6 Benchmark comparisons with 2009 ................................................................................ 49
4.7 Summary of key points ................................................................................................... 49
Section 5: Innovation barriers and enablers ......................................................................... 52
5.1 Introduction ..................................................................................................................... 52
5.2 Barriers to innovation ...................................................................................................... 52
5.3 Barriers and enablers: regulation and legislation ............................................................ 56
5.4 Key Findings ................................................................................................................... 58
Section 6: Innovation in Solicitors’ firms of different types ................................................... 61
6.1 Introduction ..................................................................................................................... 61
6.2 Innovation among Solicitors by sizeband ........................................................................ 61
6.3 Innovation among male and female Solicitors ................................................................ 63
6.4 Innovation among Black and Minority Ethnic (BAME) majority Solicitors’ firms .............. 64
6.5 Innovation among commercial and non-commercial Solicitors ....................................... 66
6.6 Key Findings ................................................................................................................... 67
Section 7: The impact of ABS – an initial assessment .......................................................... 68
7.1 Introduction ..................................................................................................................... 68
7.2 Comparative analysis ...................................................................................................... 68
7.3 Econometric assessment ................................................................................................ 70
7.4 Key findings .................................................................................................................... 71
Section 8: Final Remarks ...................................................................................................... 72
8.1 Innovation in legal services ............................................................................................. 72
8.2 Attitudes towards regulation and legislation .................................................................... 73

3
Preface The Legal Services sector plays a critical role in facilitating commercial and domestic activity and in administering justice. Innovation in this sector in the form of new services or better ways of delivering existing services has the potential to deliver significant social value. It is perhaps surprising therefore that this report represents the first major attempt to examine innovation in the legal services sector using a large-scale survey either in the UK or internationally. The focus here is on understanding the nature of innovation in Legal Services and the key barriers and enablers of change. To address these issues we drew on the existing research literature on innovation in business and professional services, conducted detailed in-depth interviews with 20 legal service providers and conducted an extensive telephone survey with 1500 respondents from across the sector. Questions of culture, leadership and technology are all addressed alongside the impact of regulation and regulatory changes. We examine too the process of innovation in legal services organisations – the ‘how’. Where do organisations get their ideas for new innovation? How are these translated into new services or ways of delivering services? And, how are these then marketed? Regulation emerges as both a limiter and an enabler of innovation with the introduction of Alternative Business Structures which relaxed the rules on the ownership and financing of legal service providers having significant positive innovation benefits. The research should inform both practice (including serving as a resource for practitioners wishing to understand how to become more innovative) and future regulation. This research has been supported by the Solicitors Regulation Authority (SRA) and the Legal Services Board (LSB). The authors would like to express their thanks to the Steering Committee for their enthusiasm and support during the course of this project. We would also like to thank the numerous individuals who so patiently answered our many questions as part of the in-depth studies and business survey. We hope you learn something new about the legal services sector as you read the report.

4
Executive Summary Key findings This report summarises the results of the largest ever survey of innovation among legal service providers covering 1500 organisations and including one of the largest ever surveys of Barristers’ chambers, of which 156 were surveyed. Twenty in-depth studies of innovation in different organisations were also undertaken. The key results are:
The introduction of Alternative Business Structures (ABS) was intended (amongst other things) to promote innovation and diversity in the provision of legal services. Our research suggests that this ambition has been realised. The adoption of ABS status has a positive effect on innovation. All else being equal, ABS Solicitors are 13-15 per cent more likely to introduce new legal services. The implication is that the wider adoption of ABS status would be likely to increase the range of legal services on offer.
Solicitors are, on average, more innovative than other regulated legal services organisations in terms of both managerial and organisational changes.
More broadly, 80 per cent of legal services organisations feel they have in
place a leadership and culture which supports the development of new ideas. Around 40 per cent have put in place the practical steps to promote the
development of new ideas.
A quarter of all legal services organisations have introduced a new or improved service in the last three years. On average, legal services organisations obtain 6.3 per cent of their revenue from these innovative services. This rises to 10.3 per cent among other legal services providers (OLSPs) in unregulated activities.
The major effect of innovation in legal services has been to extend service range, improve quality and attract new clients.
Regulatory and legislative changes emerge as both a barrier to and driver of innovation. Regulatory and legislative issues were seen as being a significant impediment to innovation by only one fifth and one quarter of respondents respectively.
Background to the report
1. In this report we investigate innovation in legal services organisations in England and Wales, a subject which has received relatively little attention to date. Changes in the legislative and regulatory framework surrounding legal services have intensified in recent years, raising questions about the extent to which initiatives such as the introduction of Alternative Business Structures (ABS) have facilitated innovation.
5
Significant questions have also arisen about whether elements of the current regulatory framework are either impeding or stimulating innovation.
2. The report has three major objectives:
To understand what ‘innovation’ means in the context of the legal services sector;
To explore what is driving innovation in the legal services sector, including the impact of competition in driving organisations to try new approaches; and
To understand the barriers and enablers of innovation (including, but not limited to, regulation).
3. Our analysis draws on the existing research literature on business and professional
services and a large-scale and representative telephone survey covering 1500 legal services providers in England and Wales. This is the largest survey of legal services innovation ever undertaken either in the UK or elsewhere. The survey was preceded by 20 in-depth studies to clarify concepts and terminology.
4. Definitions of legal services vary. Here, we focus on those organisations which
provide legal services as their primary activity. In the report we distinguish between four groups of organisations: Solicitors Firms, Barristers’ chambers, and Other Legal Service Providers (OLSPs). The OLSP group covers those providers regulated under the Legal Services Act 2007 and those providers not covered by the Act.
5. Benchmarks from a small scale study in 2009 suggested that significant gaps were
evident between innovation practice and performance in legal services and other business services sectors. We examine whether this situation has changed.
The meaning of innovation
6. The term ‘innovation’ itself can have many different meanings with different individuals either including or excluding particular activities. In our survey work on this theme we never talk about ‘innovation’ but always about other more specific and descriptive terms such as ‘process change’, ‘new services’ etc. This provides a workable methodology which involves (a) identifying a range of concrete actions which may be regarded as innovative; (b) exploring organisations’ engagement with this set of practices, the drivers of this engagement and any barriers to involvement; and, (c) exploring the consequences of engagement with innovative practices.
7. The variation in forms and types of ‘innovation’, and the use of the single term ‘innovation’ to describe both outcomes and process, can create significant communication difficulties both between business colleagues and in terms of conducting innovation research. To overcome this issue and ensure a more meaningful dialogue, instead of talking about ‘innovation’, studies often focus on more specific (and observable) activities or practices which form part of organisations’ overall pattern of innovative activity. This is the approach taken in this investigation.

6
Innovation: Drivers, performance and benefits
8. This report adopts a broad view of innovation considering as ‘innovations’ both the development of new or improved services and new or improved ways of delivering legal services.
9. Barristers’ chambers emphasise a wider range of drivers for innovation than either Solicitors or OLSPs. Key factors are changing regulation and changing demand for new services. For OLSPs in regulated activities, legislative and regulatory changes relating to legal services were the key motivating factors for innovation. Intensity of competition is a middle-ranking motivation for all types of legal service provider.
10. Just over one quarter of all respondents had introduced a new or improved service in the previous three years, with OLSPs in unregulated activities markedly more likely to do so than Solicitors or Barristers’ chambers. The introduction of a new-to-the-market innovation is much less common, indicated by less than 8 per cent of respondents. On average, respondents obtained 6.3 per cent of their revenue from innovative services. This percentage was highest (10.3 per cent) among OLSPs in unregulated activities.
11. Innovation in the delivery of services was reported by 26.1 per cent of respondents, again lower among Barristers’ chambers than other groups. Among Solicitors the predominant change was in the use of electronic communication with clients, including the use of electronic forms, and improved case management systems. OLSPs also frequently mentioned the use of on-line and electronic communication with clients. Among Barristers’ chambers innovation was focussed on direct access to clients and the need for a more client-focussed approach.
12. Service providers of all types and sizes make substantial use of social media, especially among larger firms. By far the most common use is in advertising legal services to clients and providing legal updates or free information, with over 73 per cent of social media users doing these. By contrast, the direct provision of legal services via social media was relatively uncommon, although more commonly done among Barristers’ chambers than by other types of legal service provider.
13. The major effects of innovation are in extending service range, improving quality,
attracting new clients, and improved tailoring of services. By contrast, improving speed of delivery and increasing revenue from existing clients were less important, although still mentioned by a majority of organisations. OLSPs – both regulated and unregulated – are more interested than Solicitors or Barristers’ chambers in innovating to increase revenue from existing clients.

7
Innovation: Leadership and management challenges
14. While around four-fifths of legal services organisations feel they have a leadership and culture which supports the development of new ideas only around 40 per cent have put in place the practical steps to promote the development of new ideas. This pattern differs little between Solicitors, Barristers’ chambers and OLSPs. As suggested earlier this results in new services being introduced in around a quarter of legal service providers (over a three year period).
15. Recruitment priorities differ significantly: around a third of OLSPs regard it as ‘very important’ to recruit those with a legal services background compared to around two-thirds of Solicitors and Barristers’ chambers. Only around a third of organisations regard ‘training staff to develop new ideas’ as very important.
16. In terms of how organisations undertake innovation, Solicitors engage most actively
with their customers. Levels of investment in promotional activity vary widely, however, with OLSPs in unregulated activities spending an average of 2.3 per cent of turnover on branding and promotion compared to 1.6 per cent by Solicitors and 0.6 per cent by Barristers’ chambers.
17. Comparing levels of innovation over time is difficult because of the lack of research
into innovation in the legal sector. A 2009 survey suggests a picture of stability rather than significant sector-wide change. However this is likely to reflect the different samples used in each survey rather than wider market changes, with the scope of the 2009 being significantly limited when compared to 2015 and not looking at the legal sector as a whole.
Impacts of regulation and legislation, other barriers to innovation
18. Legislation and regulation were frequently cited as a driver of innovation (paragraph 9). They were also the most commonly cited constraints on innovation, seen as being a significant impediment to innovation by between one fifth and one quarter of respondents. This implies that around 75-80% of respondents did not consider regulation or legislation to be a major constraint on innovation.
19. The next biggest constraints are lack of the necessary finance for innovation, limited market opportunities, and lack of expertise in the business, each mentioned by under 20 per cent of legal service providers. Other factors (e.g. attitudinal barriers and lack of collaborators) were generally viewed as being relatively insignificant.
20. Most organisations believe regulatory and legislative issues have a neutral effect on
innovation. Of the remainder, nearly twice as many organisations see “Changes in legislation related to legal services” as having a positive rather than a negative effect on innovation. In only three aspects of regulation (dealing with client complaints, client confidentiality and managing clients’ money) was there a perception that the general effect of legislation on innovation had been negative.

8
21. Solicitors take a more positive view on the role of regulation and legislation in
innovation than OLSPs. This is especially true for changes in legislation relating to legal services, professional indemnity insurance requirements, and the need to keep up with new regulations.
22. For Barristers’ chambers particular issues seem to exist with the requirements for
professional indemnity insurance. For OLSPs in unregulated activities the key issues relate to legislation on client confidentiality and complaints.
The innovation impact of ABS
23. The introduction of ABS was intended to promote innovation and diversity in the provision of legal services. Our survey includes data from around a third of SRA regulated firms with ABS status.
24. Our econometric analysis suggests that the adoption of ABS status has a positive
effect on innovation. All else being equal, they are 13-15 per cent more likely to introduce new legal services. They are also more likely to engage in strategic and organisational innovation. These findings allow for differences in characteristics, age, area of work, gender, and the ethnicity of ABS and non-ABS Solicitors. The implication is that the wider adoption of ABS status would be likely to increase the range of legal services on offer.
25. We also find ABS Solicitors have higher levels of innovative activity of all other types
than other Solicitors. This is consistent with ABS Solicitors’ higher level of investment, staff engagement and external involvement in innovation.
9
Section 1: Introduction
1.1 Background and context In this report we investigate innovation in legal services organisations in England and Wales, a subject which has received almost no research attention to date1. Changes in the legislative and regulatory framework surrounding legal services in England and Wales has intensified in recent years, raising questions about the extent to which initiatives such as the introduction of Alternative Business Structures (ABS) have facilitated innovation. Significant questions also remain about which elements of the current regulatory framework most significantly impede innovation. Or, indeed, whether some elements of regulation may actually be encouraging or stimulating innovation as some research on other sectors suggests2. Our starting point in the report is the existing research literature on business and professional services (Annex 1). This suggests some valuable perspectives for examining legal services innovation and a series of benchmark metrics (Annex 2). A series of 20 detailed in-depth studies were conducted to provide further insight into the drivers of innovation in legal services prior to the design of the main survey (Annex 3). Quantitative analysis was undertaken through a large-scale and representative telephone survey covering 1,500 organisations across the sector. This, we believe, is the largest survey of legal services innovation ever undertaken either in the UK or elsewhere. In what follows we adopt a broad view of innovation considering as ‘innovations’ both the development of new or improved services and new or improved ways of delivering legal services. Both can add value to businesses and potentially service users. We also examine how legal service providers actually undertake innovation, reflecting the role of internal and external influences on stimulating and delivering innovations. Here, we focus on organisations’ engagement with innovation practices and the impact of these practices on innovation and broader business outcomes3. More specifically this report has three major objectives:
To understand what ‘innovation’ means in the context of the legal services sector.
1 Indeed as far as we can ascertain the only significant consideration of innovation in the legal services sector was a study in 2009 which compared legal services innovation to that in other UK business services sectors. See: Roper, S.; J.H. Love; J. Bryson; and C. Hales. 2009. Measuring sectoral innovation capability in nine areas of the UK economy. Report for the NESTA Innovation Index project. London 2 Porter, M E and C Van de Linde. 1995. Toward a New Conception of the Environment-Competitiveness Relationship. Journal of economic perspectives, 9(4), 97-118. 3 An innovation practice might be defined as a ‘strategic, managerial or organisational actions undertaken to stimulate, initiate or implement changes in services or processes’. Spithoven, A.; W. Vanhaverbeke; and N. Roijakkers. 2013. Open innovation practices in SMEs and large enterprises. Small Business Economics 41:537-562.

10
To explore what is driving innovation in the legal services sector, including the impact of competition in driving organisations to try new approaches;
To understand the barriers and enablers of innovation (including, but not limited to, regulation).
1.2 Coverage
Different perspectives on the scope of the legal services industry exist. The Legal Services Act of 2007, for example, lists six reserved activities which can be provided by authorised persons only (the exercise of the right of audience; conduct of litigation; conveyancing; probate; notarial activities and administration of oaths). These reserved activities form only a small part of what might be thought of as the legal services sector which also includes the provision of advice, assistance or representation in connection with the application of the law and the resolution of disputes determining the nature of a person’s legal rights or liabilities. These activities might be undertaken by consumer facing organisations such as the Citizens Advice Bureau (CAB), the Community Legal Advice Centres (CLACs), charities such as Age UK, trades unions, and business facing organisations such as professional business advisers like accountants or investment banks.
For many of these consumer and business-facing organisations, however, the provision of legal services is only a small part of their activity. This means that innovation in these organisations may be driven – ether wholly or predominantly – by factors outside the legal services arena. It also means that the barriers and constraints on innovation are also likely to be outside the sector. Extending any analysis to the broad range of organisations for whom legal services is part (rather than the dominant element of their activities) therefore brings into play a much broader range of innovation drivers and barriers than those common to more ‘core’ legal service providers.
Here, therefore we adopt a more focused approach concentrating on those organisations whose primary business relates to the provision of legal services. These organisations would be included within the standard industrial classification (2007) 69.1 ‘Legal activities’. The definition of this is as follows:
‘This division includes legal representation of one party’s interest against another party, whether or not before courts or other judicial bodies by, or under supervision of, persons who are members of the bar, such as advice and representation in civil cases, advice and representation in criminal actions, advice and representation in connection with labour disputes. It also includes preparation of legal documents such as articles of incorporation, partnership agreements or similar documents in connection with company formation, patents and copyrights, preparation of deeds, wills, trusts, etc. as well as other activities of notaries public, civil law notaries, bailiffs, arbitrators, examiners and referees’.
This broad category includes four main groups of legal service providers:
Barristers: members of the legal profession who have been called to the bar.
11
Solicitors qualified to deal with, for example: conveyancing, drawing up of wills, advising clients on legal matters, instructing barristers, etc.
Other legal service providers (OLSPs) in the regulated sector, including patent and trade mark attorneys, notaries, legal executives, licensed conveyancers and cost lawyers;
OLSPs in the unregulated sector, including will writers, bailiffs, arbitrators, examiners and referees etc.
Within these groups there may be a wide range of different types of organisation, from single-person practices through to multiple-partner general and specialist providers, to nationwide and multinational partnerships. This diversity is reflected in the discussion in subsequent sections. In each case information relates to the respondents’ organisation (e.g. Solicitors’ Firm, Barrister’s Chambers etc.)
1.3 Previous benchmarks of innovation in legal services A previous study of a number of UK business service sectors conducted in 2009 included organisations in legal services4. In this section we provide a brief overview of some benchmarks derived from that study which reflect aspects of the process of innovation. In particular the 2009 study reported benchmarks for three elements of the service innovation process in legal service providers and other service sectors. Benchmarks related to organisations’ activities in terms of:
1. Accessing knowledge for innovation which includes both the scale of organisations’ financial investments and the extent of their collaborative activities with other organisations.
2. Building innovation which involves the translation of organisations’ knowledge
investments into innovation resulting in new services or ways of doing business.
3. Commercialising innovation reflects organisations’ efforts to exploit their innovations in the market place.
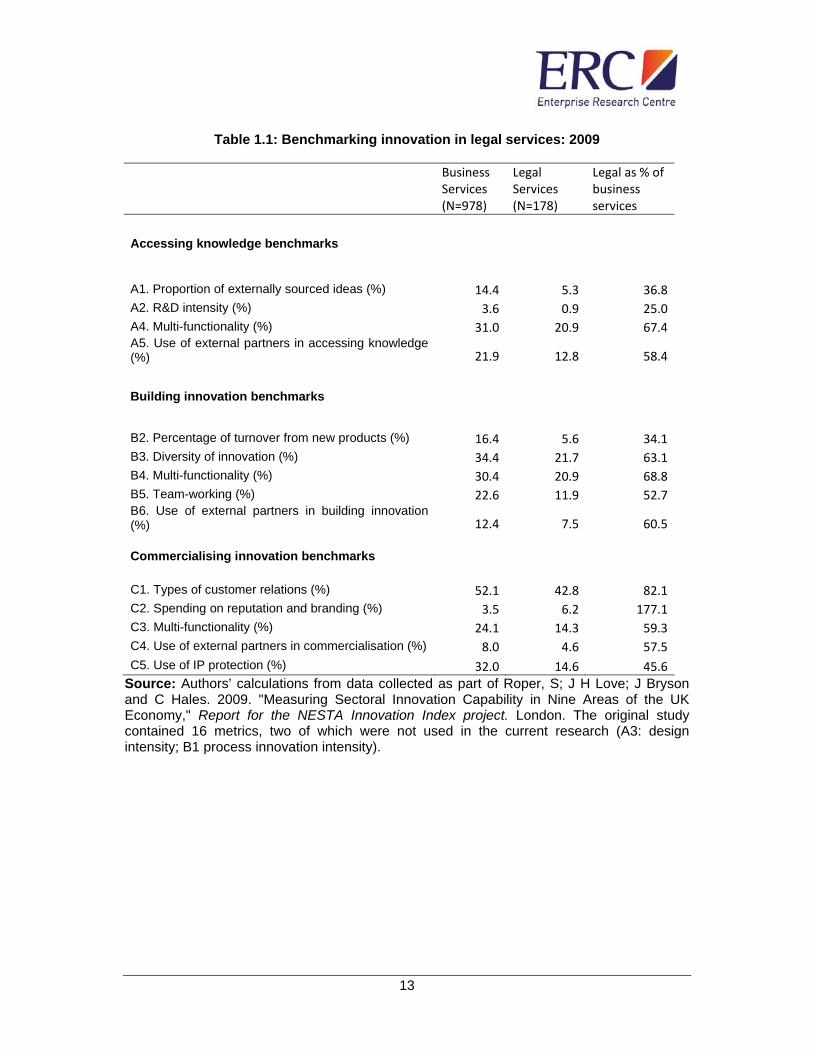
Benchmarks are reported in Table 1.1 which gives the 2009 benchmark values for fourteen metrics for the broader business services sector, for legal services, and for a comparative measure which expresses legal services as a percentage of the broader business services. (Benchmark definitions are included in Annex 2). Figures in the last column of the table that are greater than 100 per cent therefore suggest that investment or performance on that metric is higher in legal services than that in the broader business services sector. These benchmarks suggest that:
4 Roper, S; J H Love; J Bryson and C Hales. 2009. Measuring Sectoral Innovation Capability in Nine Areas of the UK Economy, Report for the NESTA Innovation Index project. London
12
In terms of the early ideation and knowledge gathering stages of the innovation process, each of the legal services benchmarks are below those in business services. Legal service providers’ openness to external ideas and investments in research are particularly limited although legal service providers were performing better in terms of their use of multi-functional teams and external partnering (Table 1.1).
The building innovation benchmarks relate to the management and development of
new services or ways of delivering services. Again, here, legal service providers were below those in business services on all six benchmark measures. Significantly, the largest gap here is for the percentage of revenue derived from new products a measure which previous research suggests is strongly linked to business growth5.
The final set of benchmarks relate to the commercialisation of innovation. Here, the
profile of activity in legal service providers was more similar to that of business services generally, with somewhat surprisingly perhaps, legal service providers reporting investing a significantly higher percentage of turnover on improving their reputation and branding than other business services organisations (Table 1.1).
These benchmarks suggest that in 2009 significant gaps were evident between innovation practice and performance in legal services and other UK business services sectors. In subsequent sections of this report we examine whether this position has changed and provide more detail on the contrasting innovation performance of different elements of the legal services sector.
5 Love, J H ; S Roper and J Bryson. 2011. Knowledge, Openness, Innovation and Growth in UK Business Services. Research Policy, 40(10), 1438-52.
13
Table 1.1: Benchmarking innovation in legal services: 2009
Business Services (N=978)
Legal Services (N=178)
Legal as % of business services
Accessing knowledge benchmarks
A1. Proportion of externally sourced ideas (%) 14.4 5.3 36.8
A2. R&D intensity (%) 3.6 0.9 25.0
A4. Multi-functionality (%) 31.0 20.9 67.4A5. Use of external partners in accessing knowledge (%) 21.9 12.8 58.4
Building innovation benchmarks
B2. Percentage of turnover from new products (%) 16.4 5.6 34.1
B3. Diversity of innovation (%) 34.4 21.7 63.1
B4. Multi-functionality (%) 30.4 20.9 68.8
B5. Team-working (%) 22.6 11.9 52.7B6. Use of external partners in building innovation (%) 12.4 7.5 60.5
Commercialising innovation benchmarks
C1. Types of customer relations (%) 52.1 42.8 82.1
C2. Spending on reputation and branding (%) 3.5 6.2 177.1
C3. Multi-functionality (%) 24.1 14.3 59.3
C4. Use of external partners in commercialisation (%) 8.0 4.6 57.5
C5. Use of IP protection (%) 32.0 14.6 45.6Source: Authors’ calculations from data collected as part of Roper, S; J H Love; J Bryson and C Hales. 2009. "Measuring Sectoral Innovation Capability in Nine Areas of the UK Economy," Report for the NESTA Innovation Index project. London. The original study contained 16 metrics, two of which were not used in the current research (A3: design intensity; B1 process innovation intensity).

14
1.4 Overview of the report The remainder of the report is organised as follows:
Section 2 discusses the notion of ‘innovation’ in the context of legal services and distils some lessons on measurement from previous studies of innovative activity in other business services sectors.
Section 3 profiles the level of innovative activity in legal services in England and Wales based on our survey data.
Section 4 then focuses on the process of innovation in legal services adopting the value chain perspective discussed earlier.
Section 5 focuses on the barriers and enablers of innovation with a particular focus on regulation and its role in either inhibiting or stimulating innovative activity.
Section 6 examines innovation among some sub-groups of Solicitors with a focus on Solicitors’ firms of different sizes, those organisations with a majority of female Solicitors, and those with a majority of Solicitors from black and ethnic minority (BAME) groups. We also consider levels of innovative activity between different areas of legal activity.
Section 7 focuses on the impact of Alternative Business Structures on innovation. Section 8 concludes with some general remarks and suggestions for future
consideration. Further material including details of survey methodology and questionnaires are included in Annexes.

15
Section 2: Defining innovation in legal services
2.1 Introduction Innovation in legal services has, to date, attracted relatively little attention from researchers. There is, however, a relatively extensive literature on innovation in other business and professional service sectors, particularly in less strongly regulated sectors such as IT services and consultancy. In this section we draw on the research literature on innovation in business and professional services to develop a framework for examining innovation in legal services, and to identify a range of individual ‘innovative practices’ in which legal services organisations might be engaged. This section summarises a considerable body of material: the underlying academic literature on which it is based is presented and discussed more fully in Annex 1.
2.2 Innovation in professional and business services
Definitions of innovation vary but generally stress the commercialisation of new knowledge or technology to generate increased sales revenue or business value. The US Advisory Committee on Measuring Innovation, for example, defines innovation as:
‘The design, invention, development and/or implementation of new or altered products, services, processes, systems, organisational structures or business models for the purpose of creating new value for customers and financial returns for the organisation’ [1, p. i].
An alternative definition, developed by the UK House of Lords Select Committee on Science and Technology in 1991, stresses the link between innovation and knowledge and the range of new innovations from the radical to the incremental. Here, innovation is seen as the:
‘… commercial application of knowledge or techniques in new ways or for new ends. It may involve radical innovation or incremental innovation. In each case the innovator achieves a competitive advantage, at least until another company catches up or goes one better’.
In this sense innovation is best seen as a business (rather than technological) process which is successful only when it delivers value either to the innovating organisation and its stakeholders and/or customers.
2.2.1TypesofinnovationResearch studies and surveys of innovative activity typically differentiate between different, albeit related, types of innovative activity. Innovative activities may, for example, focus on
16
different elements of organisations’ operations and/or marketed services with a standard distinction being made between:
• Service innovation - relating to the production and delivery of new (or improved) legal services by existing suppliers. Recent examples of this might be fixed price legal services6 or the move into ‘solutions’ provision rather than legal services provision. • Business process innovation - relates to the way in which legal services are delivered. Here, we might distinguish between four different types of business process innovation:
Strategic innovation - reflecting the impact of a change in corporate strategy: a move to fixed price services, for example.
Management innovation involving the implementation of new managerial approaches such as a structured innovation process.
Organisational innovation involving structural changes to an organisation such as the introduction of multi-functional teams or joint development teams.
Marketing innovation involving changes to marketing concepts or strategies, e.g. a move to media advertising or commercial partnerships.
2.2.2Theinnovationvaluechain–anactivitybasedviewofinnovationInnovation is a complex process involving a range of different activities from market research, information gathering and service or process development. Each activity within an innovation process has rather different characteristics and risks. One way of capturing this variation is in the notion of an ‘innovation value chain’ comprising different activities and reflecting the process through which innovations are developed. Specifically, the innovation process can be represented as an innovation value chain (IVC) comprising three stages. The first of these includes organisations’ efforts to source the bundle of different types of
knowledge necessary for innovation7. This may involve organisations undertaking in-house knowledge creation - through either design or research and development (R&D) activities - alongside, and either complementing or substituting for, external knowledge sourcing. Innovation practices in the knowledge sourcing element of the innovation value chain are
6 See, for example, http://www.fixedpricedivorceservice.co.uk. 7 Hansen, M.T. and J. Birkinshaw. 2007. The Innovation Value Chain. Harvard Business Review June 121-130.

17
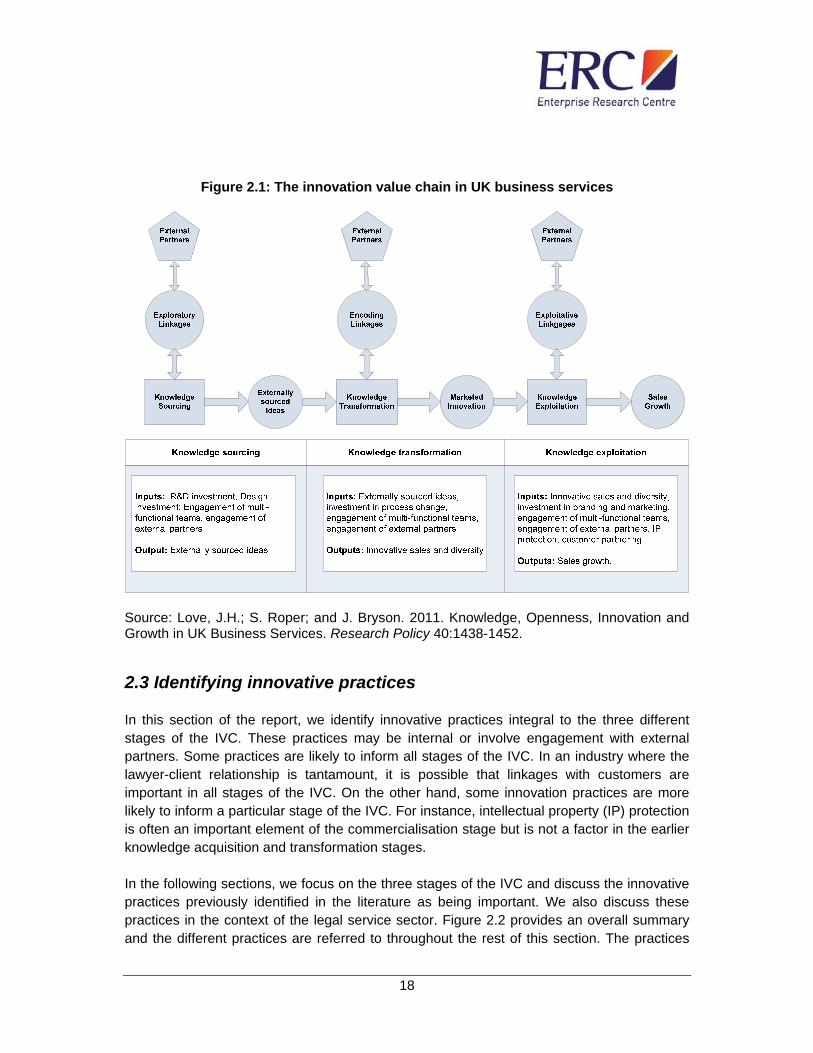
likely to focus on knowledge search and exploration or the management and organisation of these activities. The second stage in the innovation value chain is the process of transforming this knowledge and delivering new services or business processes. This ‘encoding’ activity may again involve a combination of organisations’ internal and external resources. Here practices are likely to involve the codification of knowledge into either new market offerings or the development of new business processes. The final stage in the IVC relates to the exploitation of organisations’ innovations through service creation and the generation of added value through commercialisation. This may involve an organisation’s own marketing activities but may also involve activities such as selling through agents, partners or franchising. One recent illustration of the IVC in business services is included in Figure 2.1. This highlights the three stages of the IVC, the role of partnering during each of the three activities and also suggests some illustrative metrics which may help organisations to calibrate some elements of the innovation value chain. Two considerations are worth making in relation to the IVC. First, the early two stages of the value chain are cost items only with no balancing revenues. Revenues are only generated in the final stage of the value chain which is therefore crucial. Second, the value chain is only as strong as the weakest link and for an individual enterprise the weakest link provides the focus for developmental effort. Statistical analysis of the IVC for UK services organisations - including legal services organisations - suggests strong positive links between the different elements of the value chain, and links innovation strongly to growth8.
8 Love, J.H.; S. Roper; and J. Bryson. 2011. Knowledge, Openness, Innovation and Growth in UK Business Services. Research Policy 40:1438-1452.
18
Figure 2.1: The innovation value chain in UK business services
Source: Love, J.H.; S. Roper; and J. Bryson. 2011. Knowledge, Openness, Innovation and Growth in UK Business Services. Research Policy 40:1438-1452.
2.3 Identifying innovative practices In this section of the report, we identify innovative practices integral to the three different stages of the IVC. These practices may be internal or involve engagement with external partners. Some practices are likely to inform all stages of the IVC. In an industry where the lawyer-client relationship is tantamount, it is possible that linkages with customers are important in all stages of the IVC. On the other hand, some innovation practices are more likely to inform a particular stage of the IVC. For instance, intellectual property (IP) protection is often an important element of the commercialisation stage but is not a factor in the earlier knowledge acquisition and transformation stages. In the following sections, we focus on the three stages of the IVC and discuss the innovative practices previously identified in the literature as being important. We also discuss these practices in the context of the legal service sector. Figure 2.2 provides an overall summary and the different practices are referred to throughout the rest of this section. The practices

19
represented here are consistent with the innovation benchmarks described earlier (Table 1.1), but are extended to include a number of overarching business practices which are relevant to innovation and which provide the context in which the IVC operates. The literature underlying the discussion of each innovative practice is detailed in Annex 1.
2.3.1Externallinkagesandideas(PracticesA1,A5,C5)External linkages – openness – in the innovation process can play a key role in helping to access otherwise inaccessible resources and/or risk sharing in innovation. While external links can be of any sort, and can arise at any stage of the IVC, the evidence suggests that links to customers and suppliers tend to be most prevalent, especially in the knowledge gathering stage of the IVC. Figure 2.3 is based on information for UK business services organisations, and highlights that business services organisations have more linkages to external partners of all types in the first stage of the innovation value chain. There are three exceptions which all relate to the commercialisation stage of the IVC. Figure 2.3: External connections of UK business services organisations – by stage of
the innovation value chain
Source: Love, J.H., S. Roper, and J.R. Bryson, 2011, Op. Cit. Among business services organisations it is links to customers which are most common in the knowledge transformation stage (Figure 2.3). Links to other types of organisations may also play an important role in knowledge transformation, although again the specific evidence is limited. Perhaps surprisingly, such links matter less in the process of actually translating innovations into growth and profitability. Despite this we see the highest proportion of business services organisations have external linkages to clients as part of their commercialisation activities.
37
23
29
19
12 13
25
8
51
9 9 9
5 5
20
0
10
20
30
40
50
60
Cus
tom
ers (
%)
Sup
plier
s (%
)
Com
petito
rs (%
)
Con
sulta
nts (
%)
Univ
ersit
ies (%
)
Pub
lic re
sear
ch (%
)
Tra
de A
ssoc
iation
s (%
)
Com
mer
cial L
abs (
%)
Mar
ket R
esea
rch
(%)
Adv
ertis
ing A
genc
ies (%
)
pe
rce
nta
ge
of
firm
s
Accessing Knowledge
Building Innovation
Commercialising Innovation
20
Figure 2.2: Innovation practices
Activity Specific Practices along the Innovation Value Chain Overarching Practices Knowledge Acquisition Knowledge Transformation Commercialisation
Innovation Strategy – innovation or imitation? Senior Management Team Rewards /Incentives Space for Creativity/ Innovation Department Staff training and building absorptive capacity
A1. Proportion of externally sourced ideas (%) A2. R&D intensity (%) A3. Design intensity (%) A4. Multi-functionality (%) A5. Use of external partners in accessing knowledge (%)
Customers Suppliers Competitors Others
B1. Process innovation intensity (%) B2. Percentage of turnover from new products (%) B3. Diversity of innovation (%) B4. Multi-functionality (%) B5. Team-working (%) B6. Use of external partners in building innovation (%)
C1. Types of customer relations (%) C2. Spending on reputation and branding (%) C3. Multi-functionality (%) C4. Use of external partners in commercialisation (%)
Customers Suppliers Competitors Others
C5. Use of IP protection (%)

21
Evidence from studies of business services also suggests that other types of external linkages may be important in terms of the commercialisation of innovation, including evidence that interaction with professional societies positively influences the commercialisation of innovations by UK business services organisations9. 2.3.2R&DandDesignInvestment(PracticesA2,A3)The importance of R&D to innovation is well documented, although the evidence in relation to business service organisations is less conclusive. Although R&D departments are not traditionally associated with law organisations, the International Legal Technology Association (ILTA) awarded a ‘Most Innovative Law Organisation 2014 Award’ to Seyfarth Shaw for the creation of an R&D department staffed by lawyers, project managers, technologists, and software developers. The R&D department was set up in 2012, and now comprises 35 staff. Outcomes from this department include: expert systems made directly available to clients, a legal management platform, and the capture of all client data to facilitate the movement from descriptive statistics to predictive data10. It is important to establish the role R&D and design investment may play in relation to knowledge acquisition in law organisations. It is more likely that they play a role with respect to service rather than process innovation. 2.3.3MultifunctionalTeams(PracticesA4,B4,C3)A multi-functional team or cross-functional team is a group of people with different functional expertise working towards a common goal. The important role of multi-functional teams on organisation innovation is well established. Although much of the empirical evidence relates to the manufacturing sector, it is important to note that there are usually more departments and project teams involved in the innovation process in the services sector than in the manufacturing sector. Bringing professionals – including lawyers with different skills – together to achieve a common goal should lead to communication, information exchange and mutual learning. A recent study examined the role of such teams for a range of UK business services, including legal services. In this study, teams prove of greater value for knowledge transformation where they are more multi-functional, i.e. involve more functional groups from within the organisation11. Other studies have, however, emphasised the importance of team leadership and the potential difficulties of communication raised by having teams including staff from multiple occupations12.
9 Love, J.H., S. Roper, and J.R. Bryson, 2011, Op. Cit., Table 4. 10 Hendersen, B., Ahead of the Curve: Three Big Innovators in BigLaw, in The Legal Whiteboard, W. Henderson, J. Lipshaw, M., and M. DeStefano, Editors. 2014. 11 Love, J.H., S. Roper, and J.R. Bryson, 2011. Op. cit. 12 Carbonell, P. and A.I. Rodriguez-Escudero. 2009. Relationships among team's organisational context, innovation speed, and technological uncertainty: An empirical analysis. Journal of Engineering and Technology Management 26:28-45.

22
2.3.4EmbeddednessofTeam‐working(PracticeB5)The ability of teams to contribute to successful innovation also depends significantly on the business culture and organisation within which they are operating. This is difficult to capture in empirical terms but the evidence suggests that where teams are valued, independent, embedded and include customers’ or suppliers’ knowledge, knowledge transformation is most effective. It is important to note that legal service providers tend to foster a culture of individual practices, and lawyers are not generally recognised as adopting a team-based approach to legal work13. For instance, time spent sharing knowledge and experience is time not spent billing clients14. While it is not clear that law organisations favour adopting a team approach to problem solving, within legal services in England and Wales there appears to be some interest in multi-disciplinary practices by the largest law organisations, although this is geared more towards different forms of business practice rather than methods of internal working15. We would expect that assigning a task to a team of multi-functional lawyers would stimulate creativity and generate new ideas with respect to new and/or improved legal services and new processes.
2.3.5Reputation:AdvertisingandBranding(PracticeC2)Prior to 1983, the restrictions on the freedom of Solicitors to advertise limited the information available to the public about available services. Solicitors in England began to adopt advertising when it became available: within two years of advertising being permitted, almost half of Solicitors’ organisations in England did so16, although advertising the prices of legal services remained very rare. Now, as legal service providers often specialise by type of client, they often advertise different areas of law to the relevant target customers. While this may have implications for pricing, quality and consumer welfare, there appears to be little direct evidence to date of the role of advertising in exploiting innovation. What is evident from the literature is that advertising for relatively routine legal services such as conveyancing tends to be associated with lower prices and reduced price discrimination, without necessarily impacting on the quality of service. However, there appears to be no specific evidence relating advertising activity to the commercialisation of new products and services within the legal profession.
2.3.6IntellectualPropertyProtection(PracticeC5)Intellectual Property (IP) concerns the legal rights associated with creative effort of commercial reputation. There are many types of IP (e.g. patents, copyright, trademarks, registered designs) with some being more relevant to specific industries. The most recent 13 Kabene, S.M., P. King, and N. Skaini. 2006. Knowledge Management in Law Firms. Journal of Information, Law and Technology 1. 14 Terrett, A.,1998 Knowledge Management and the Law Firm. Journal of Knowledge Management, 2(1): 67-76. 15 Baker Tilly, Legal Innovation 2013: New Developments in an Old Profession. 2013. 16 Stephen F H, Love J H, and Paterson A A. 1994. Deregulation of conveyancing markets in England and Wales. Fiscal Studies, 15(4), 102-118.
23
analysis for the UK suggests that overall very few (around 4%) of innovative organisations use the patent system, with most innovative organisations preferring to use more informal or strategic methods for protecting new products and services17. There are a number of explanations for this: most organisations are SMEs, which are often reluctant to use formal IP protection because of the perceived cost: many innovations are new to the organisation, but not to the market; and many sectors are not patent active.
2.4 Overarching Practices Organisations may engage in overarching practices which positively influence innovation performance. These are strategic, managerial or ‘cultural’ practices which are not elements of the IVC, but rather help to set the organisational context within which the IVC operates. Firstly, in terms of organisations’ innovation orientation, the significance of innovation strategy to the success of innovation is well understood. Senior management play an important role in shaping innovation strategy. Likewise, structures and practices supported by management, such as ‘space for creativity’ and rewarding and incentivising staff in their innovation efforts, are important to the success of innovation. These topics are summarised below: a detailed review of the underlying literature can be found in Annex 1.
2.4.1InnovationStrategyThe importance of an ‘innovation strategy’ to the success of innovation is well established18. An organisation’s ability to keep up with its competitors and maintain on-going innovation efforts are critical to its survival and growth. It is an organisation’s innovation orientation which guides it in adapting, integrating and reconfiguring technological capabilities, managerial capabilities and resources endowment as necessary in order to maintain and enhance continuous innovation.
2.4.2SeniorManagementTeam(SMT)Senior managers make decisions which are a function of their education, functional background, experience, and values. Therefore, SMT composition may directly affect innovation strategy and resulting innovation outcomes. A recent report highlights that 70 per cent of UK legal practices have non-lawyer management or a non-lawyer non-executive member on the management team, even when they are not formally an alternative business structure (ABS)19. While non-lawyer involvement can create tensions, diversity in an SMT can facilitate innovation. Therefore, the extent to which the SMT, lawyers and non-lawyers, are involved in and influence innovation strategy and innovation performance in law organisations is of interest. Interestingly, a Financial Times report on innovation in US law
17 Hall, BH , Helmers, C Rogers, M and Sena, V. 2013. The importance (or not) of patents to UK firms, Oxford Economic Papers, 65, 603-629. 18 Burgelman, R., M.A. Maidique, and S.C. Wheelwright, Strategic Management of Technology and Innovation. 2001, New York: McGraw-Hill. 19 Baker Tilly, Legal Innovation 2013: New Developments in an Old Profession. 2013. Note, however, that the sample size used in this survey is unclear.

24
organisations highlights innovations that have been driven by non-legal professionals working in law organisations20.
2.4.3Rewards/IncentivesSuccessful innovation requires that managers provide clear and consistent signals to employees about the goals and objectives of the organisation. Clear signals and public recognition of employees' accomplishments serve to motivate other employees to greater effort in meeting the organisations objectives. The practical consequence of rewarding desired behaviours is that other employees repeat and emulate these behaviours. A study of Australian law organisations found that acknowledging and rewarding practices (such as, adoption of new practices and processes, implementation of new services, solving problems in a novel way and bringing new practices to the organisation) positively influenced innovative behaviour and performance21.
2.4.4SpaceforCreativity/InnovationDepartmentProviding employees with the space to think, experiment, discuss ideas and be creative is an important organisational characteristic that can facilitate the innovation process. Allowing individuals a certain amount of ‘slack’ for innovation is a practice sometimes employed by organisations. For instance, in many R&D departments scientists are allowed 10-15 per cent of their time to work on the projects they choose. The type of practices, if any, law organisations adopt to provide creative space to employees is unknown; however, there are some examples, such as the Portuguese law organisation Vieira de Almeida which created a structured programme to promote innovation that includes creativity workshops and ideas campaigns. The organisation commenced such practices to institutionalise the innovation concept and to adopt innovation as one of the organisation’s core values. Introduced in 2012, outcomes include the “A Step Ahead” programme, a contract management service that helps clients control and manage their commercial obligations over the life cycle of a contract. The extent to which UK law organisations have ‘innovation departments’ or creative space practices has yet to be determined.
2.4.5StaffTrainingandBuildingAbsorptiveCapacityThe importance of developing employees to develop innovative products, services and processes is also appreciated by innovation scholars. The legal services profession is also beginning to place more importance on developing staff. Skilled staff are often said to play a dual role in innovation – assisting organisations with the development of new ideas inside the organisation but also having greater absorptive capacity – i.e. the ability to identify, assess and appropriate knowledge from outside the organisation. R&D and design staff are often said to play a similar role in their specific functions. There is significant positive evidence on the relationship between workforce quality and innovation. There is less evidence on whether or how staff training and development contributes to knowledge transformation in any sector. Given that the most dominant
20 Finanical Times, FT Innovative Lawyers 2013. 2013 21 Hogan, S.J. and L.V. Coote. 2014. Organisational culture, innovation, and performance: A test of Schein's model. Journal of Business Research, 67(8): 1609-1621.

25
resource in the provision of services to clients is human capital, however, improvements to this resource are likely to be useful in the transformation of knowledge to new services and business processes.

26
Section 3: Measuring legal services innovation
3.1 Introduction This section provides an overview of top level survey findings, including a brief description of the responding legal service providers. All tables are based on data taken from the telephone survey of 1,500 legal service providers carried out in March and April 2015, details of which are provided in Annex 2. Section 3.3 focuses on the drivers of innovation in legal services and is followed by Section 3.4 which provides a profile of innovative activity in the sector and a brief comparison of innovative practices in sub-sectors. Section 3.5 provides a more detailed description of the nature of service innovation in legal services before Section 3.6 examines the level of innovation in organisations of different sizes. Section 3.7 focuses specifically on the use of social media as part of organisations’ provision of legal services. The Section concludes with a brief summary of the benefits of innovation.
3.2 Overview of survey respondents An overview of the characteristics of survey respondents is provided in Table 3.1. The average age of legal service provider organisations varied little between Solicitors, Barristers’ chambers and Other Legal Service Providers (OLSPs): unsurprisingly, Solicitors tend to be larger on average in terms of numbers employed.
In the survey we also asked respondents about the ownership of their organisation. Overall, three quarters of all legal services providers indicated that they were fully owned by lawyers (Table 3.1). The ownership structure of Solicitors and Barristers’ chambers is unsurprisingly dominated by lawyer ownership. By contrast, 9.7 per cent of OLSPs in regulated activities and 43.5 per cent of OLSPs in unregulated activities were owned by non-lawyers22. The vast majority of respondents were part of single-site operations.
Table 3.1: Descriptive statistics of survey respondents
Solicitors
Barristers’ chambers
Others(Regulated)
Others (Unregulated) All Orgs.
(N=943) (N=156) (N=72) (N=329) (N=1500)
Organisation characteristics Average age (years) 14.3 13.3 16.0 13.2 14.1Average employment (no.) 18.2 13.1 8.9 9.2 15.1Organisations with non‐UK customers (10% plus) (%) 10.5 6.9 10.1 10.7 10.4 Ownership
22 Among the 72 OLSPs in regulated sectors responding to the survey: 23 (31.9 per cent) were regulated by the Council for Licensed Conveyancers, 12 (16.7 per cent) were regulated by the Intellectual Property Regulation Board, 10 (13.3 per cent) were regulated by the ILEX Professional Standards and 24 organisations (33.3 per cent) reported being regulated by the Cost Lawyers Standards Board.

27
Owned fully by lawyers (%) 90.8 85.7 72.5 43.9 77.2Owned fully by non‐lawyers (%) 1.3 1.1 9.7 43.5 12.9Jointly owned (lawyers and non‐lawyers) (%) 7.4 3.3 17.4 8.6 8.2 Structure Single site organisations (%) 82.7 89.9 86.9 83.4 83.4Multisite organisations (%) 17.2 10.1 13.1 16.0 16.4Networked organisations (%) 0.1 0.0 0.0 0.6 0.2
Source: SRA/LSB Survey of Innovation in Legal Services 2015. Responses are weighted. See Annex 4 for details. Ownership and structure indicators do not add to 100 due to omitted minor categories. Among Solicitors, the largest group of respondents to the survey, 22.5 per cent of organisations described their ‘main legal activity’ as residential property/conveyancing. The next largest categories were criminal (9.0 per cent) and family and matrimonial (8.5 per cent) and litigation (8.1 per cent). Personal injury, commercial property and immigration and commercial and corporate work were slightly less commonly cited as organisations’ main activity. Among Barristers’ chambers criminal (22.4 per cent), family and matrimonial (15.4 per cent) and personal injury (9.0 per cent) dominated.
3.3 The drivers of innovation activity Section 4 of this report deals in detail with how organisations in legal services undertake innovation activity. Here we provide a high level overview of the factors which respondents saw as driving or motivating the introduction of new or improved services, and the effects which the introduction has had. Only organisations developing new services and/or new ways of delivering services answered this question (i.e. 500 of the 1500 respondents). We first consider the factors driving or motivating innovation (Table 3.2). One of the more interesting facets of this question is the extent to which the proportion of Barristers’ chambers responding positively is higher than Solicitors or OLSPs to virtually all the available categories, perhaps suggesting the pace of change is seen as particularly fast among Barristers’ chambers. This is especially evident with regards to changing regulation and changing legislation which were markedly more common drivers of innovation among Barristers’ chambers (see Section 5.3 for a more detailed discussion of the impact of regulation on innovation). By contrast, for Solicitors’ and OLSPs in unregulated activities responses were much more evenly spread throughout the categories. Intensity of competition is a middle-ranking motivation for all types of organisation.

28
Table 3.2: Drivers of legal service innovation: Innovating organisations (%)
Solicitors Barristers’ chambers
Others (Regulated)
Others (Unregulated)
All Orgs.
(N=288) (N=59) (N=23) (N=130) (N=500)Changing or increasing demand for new services 31.7 32.3 20.3 22.4 27.8Changing regulation relating to legal services 32.9 49.3 56.2 35.4 35.7Legislative changes relating to legal services 35.7 43.1 70.9 40.5 39.7The intensity of competition 26.7 33.4 33.7 23.1 26.1The availability of finance for development 14.3 25.4 3.3 17.3 15.0Recruitment of new staff or talent by your organisation 28.2 16.9 11.1 15.3 22.5Changes in the strategy or leadership of the organisation 20.3 13 5.9 23.4 20.2The availability of new technology or ICT developments 28.5 34.6 13.7 34.8 29.9
Source: SRA/LSB Survey of Innovation in Legal Services 2015. Responses are weighted. See Annex 4 for details.
3.4 Profiling innovation activity In this section we provide evidence on seven standard measures of innovative activity commonly used in the innovation literature:
Service innovation - the provision of new or significantly improved services to clients Radical service innovation - services new to the market and introduced before
competitors Innovation in service delivery - significant changes in the way services are delivered to
clients Strategic innovation - implemented a new or significantly changed corporate strategy
AMT innovation - implemented any advanced management techniques (AMT) such as knowledge management systems, Investors in People, etc
Organisational innovation - implemented major changes in organisational structure such as the introduction of team-working or outsourcing of major business functions
Marketing innovation - implemented changes in marketing strategies or channels

29
Table 3.3: Proportions of innovators: by sample group
Solicitors Barristers’ chambers
Others (Regulated)
Others (Unregulated) All Orgs.
(N=943) (N=156) (N=72) (N=329) (N=1500)
Service innovation (%) 25.3 25.3 29.2 36.0 28.4Radical service innovation (%) 6.8 7.2 5.1 10.1 7.6
Delivery innovation (%) 25.6 23.3 30.8 26.5 26.1
Strategic innovation(%) 17.0 13.9 7.3 16.1 16.1
Management innov (%) 18.5 5.9 8.1 14.9 16.5
Organisational innov (%) 22.4 13.8 11.1 23.0 21.6
Marketing innov (%) 36.6 26.9 35.9 39.6 37
Average (%) 21.7 16.6 18.2 23.7 21.9Source: SRA/LSB Survey of Innovation in Legal Services 2015. Responses are weighted. See Annex 4 for details.
As indicated in Table 3.3, just over one quarter of respondents had introduced a new or improved service in the previous three years, with OLSPs in unregulated activities markedly more likely to do so than Solicitors or Barristers’ chambers. Given the potential for some definitional differences this is higher than the 18 per cent of UK organisations which reported introducing new goods or services in the UK Innovation Survey (UKIS) from 2010-201223. Solicitors, barristers and OLSP (regulated and unregulated) are all above the UKIS average. Unsurprisingly, the introduction of a ‘radical’ innovation i.e. one introduced before competitors, is much less common, indicated by less than 8 per cent of respondents. This reflects closely the 7.9 per cent of all UK organisations which reported undertaking new to market innovation during the 2010-12 period24. Innovation in the delivery of services was claimed by 26.1 per cent of respondents, a percentage which was lower among Barristers’ chambers. There is some variation in the extent of other forms of innovation (strategic, AMT, organisational and marketing), but here the pattern is of roughly comparable levels of innovation among Solicitors and OLSPs in unregulated activities, and markedly lower levels among Barristers’ chambers.
23 Department for Business Innovation and Skills (2014) ‘First findings from the UK Innovation Survey 2013’, Table 1, p, 4. 24 Department for Business Innovation and Skills (2014) ‘First findings from the UK Innovation Survey 2013’, Table 1, p, 4.
30
3.5 Profiling service and delivery innovation
3.5.1ServiceinnovationService innovation among respondents took a variety of different forms. For many Solicitors this had involved changes or extensions to the services they offered. Two larger Solicitors commented:
‘We've started doing agricultural law’. ‘We have introduced the following services: Islamic finance offering, international private wealth offering, renewable energy, social housing, international mergers and acquisitions, and private equity’.
And among smaller organisations:
‘We developed a department for residential conveyancing’.
‘Family law has been added to the organisation, We've developed a family law team from scratch, and we've enhanced our wills, probate, and powers of attorney work’.
For other Solicitors service innovation came in the way that they priced services. One smaller solicitor commented:
‘We've introduced fixed fees. We only used to work on an hourly basis but now we offer fixed fees for all types of work that we do’.
And, another smaller Solicitor commented:
‘The new service is internet-based conveyancing. We link it with www.moneysupermarket.com, so people can get quotes through our website’.
Other Solicitors’ innovation had come in the way that they enabled clients to access their services. This ranged from changing opening hours – ‘We open up office hours to accommodate people who finish work at 5 or 6 o'clock. We escalate our working hours 'til 8 to accommodate those people’ – to a range of on-line service offerings:
‘We didn't previously have a website and we do now. It has been effective in generating business and enquiries’.
‘I contribute to many legal websites. In the past few years I've noticed people who've got legal questions. People put questions on forums and now some of them are clients. I don't do any advertising but I see free advice forums tools as equivalents to advertisements and it's a way to advertise, and many organisations don't offer a depth of knowledge of conveyancing’.
‘We've basically introduced and grown a clinical negligence department and then we haven't brought any new product lines. We've improved delivery of service through it, and clients can see cases on the internet and can sign documents on the internet’.
‘Improved online services. It is better for private clients. Service and client communication online have been developed. Conveyancing service provided via the website’.

31
‘We have a new file view facility which makes it easier to look up cases. We have also recently introduced a vast amount of correspondence contacts through using email’.
‘We've improved on our case management systems. We are providing more information to clients and we now also do lasting powers of attorney’.
Together these changes were said by many organisations to improve the client experience and also enhance Solicitors’ competitive position. One larger solicitor summarised the changes by saying: ‘We now provide a higher level of access for our clients to more Solicitors and more competitive pricing. More technology has helped deliver a competitive fee without compromising quality’. Essentially similar patterns existed among OLSPs with providers stressing the development of new areas of activity and enabling easier access to services for clients. Two smaller organisations commented:
‘We are dealing more with "business to business" business. Working with businesses that employ migrate workers and providing them with a package with a membership which deals with all immigration and work queries’. ‘We have brought in ISO accreditations and we've introduced our case tracker website which allows clients to monitor the status of their report and download a copy of it’.
And, another larger organisation commented: ‘… we've made a lot of smaller changes rather than one big one. We've expanded into new areas of law - that's mental health and public law work. We're piloting private charged work. We've developed a training delivery package. We've developed a project using law students to deliver services. There are some specific projects to support refugees and asylum-seeking women. We're also leading on another project to introduce sustainability for advice services’.
On-line business and IT development was central to the development of the innovations of a number of OLSPs. One larger organisation commented:
‘We have increased our product portfolio. We have more products covering a wide range. There have been enhancements of web ordering’.
And, a smaller organisation:
‘In an effort to try and speed up the processes we have tried to implement new technology. We have begun to provide hot-docs documents online. We assemble interviews and send them directly to our clients. They click the link and they're given questions which we draft and amend as the law changes. Having these questions answered means that instead of bothering them for lots of documents we have an intelligent list that will, depending on the answers they give, lead to further questions in more detail. We can create a multitude of documents and files that we can use for courts, chaser letters, everything. It might take 10mins to fill out the questions, but it saves us 3 or 4 hours. And it's cheaper for them too’.

32
For Barristers’ chambers the most commonly mentioned area of innovation was ‘Public Access’ or ‘Direct Access’. For some this had other implications: ‘Direct access, so more marketing and advertising’. Another Barristers’ Chamber commented: ‘We're offering direct access. We also offer a paper based early evaluation report and we've extended the range of our services’.
3.5.2DeliveryinnovationFor Solicitors a key theme in delivery innovation was the increasing use of electronic communication. One larger organisation commented:
‘The main change has been the evolution from paper communication, as in letters, to electronic communication. We now mainly use emails and social media. Our payment system has also evolved from cheques to electronic bank transfers’.
‘We have introduced a client relationship management programme. Also, looking at the financial side, we have offered better billing arrangements for clients’ fees. We've moved away from early rates, fixed costs, risk sharing, and we have been involved in joint training initiatives with clients. We have also changed the role of the secretaries. They are now more engaged in the daily management of clients. We are also focusing more on knowledge management’.
On a similar theme, smaller Solicitors also commented:
‘There's a more electronic approach when dealing with client work and dealing with paperwork (paperless) and contacting clients’.
‘Changes in terms of the level of client care has been significant. Also, in terms of the technology we have adopted in order to communicate with clients. And also undertaking research into the view that the client takes with regards quality of service. The market research is essential for developing a proactive service’.
‘More work is digital. The pace of communications has speeded up. There's been significant increase in shared meetings such as teleconferences. Delivery of the service has had to be attended to and has become a lot more important’.
For other Solicitors more traditional forms of improving customer access were evident: 'We've opened a new office: ‘We've made major changes in the mediation side of the organisation and use of alternative locations around the region for clients’. On-line working was also important for OLSPs with one medium sized organisation commenting:
‘The main change has been emails. In the past we did everything by post but now we do everything by email, so it is fast, accurate and helpful. The website has also improved.'

33
Another organisation commented:
‘We've switched to electronic communication, we have better databases and internal services’.
For some providers the limits on innovation were outside rather than inside the organisation. One larger organisation commented:
‘We scan everything that comes into the office so that we create fully electronic files. By having that, we are then able to send them out to clients at other sites. We are sending everything that we do electronically unless the document is needed as a hard copy with real ink on it, which for some reason or purpose it still is needed. We don't mail anything as a hard copy so the volume has probably halved. There's still some clients who're not electronically based and you have to continue to deliver those servers in the old-fashioned way’.
Interestingly, however, a number of organisations also re-emphasised the importance of face-to-face meetings with clients and the role of electronic communication in creating time for face-to-face meetings. For example:
‘We started doing drop-in meetings. We didn't used to see clients when they came in. We're doing it for housing, welfare benefits and for debt’. ‘We're more focused upon a branched network. There's delivery of services through high street branch network. We see clients face-to-face’. ‘There's more face-to-face contact and we're undertaking more client visits’.
For Barristers’ chambers direct access had led to some changes in ways of working with a number of respondents stressing that ‘We have increased the care and attention we give the clients and we try to be more client focused’ or ‘we've completed client surveys to improve services’. For others the introduction of direct access had provided a new market opportunity: ‘We've been developing most of our practice on direct access’. As in the other groups of providers, electronic communication was increasingly important for Barristers’ chambers with ‘more use of IT’, ‘more use of electronic reporting’ and ‘more use of online marketing’. Back office activities are also becoming increasingly electronic: ‘We're moving towards more electronic document management and providing far more online services’.
3.6 Innovation activity by sub-sample This section shows various measures of innovation broken down by type of legal service provider and employment size bands (1-9 employees, 10-49 employees and 50 plus employees). Table 3.4 indicates that the proportion of service innovators rises consistently with size, a pattern also common in other sectors. The one exception is in Barristers’

34
chambers, where medium-sized chambers claimed a higher level of innovation than larger chambers. The same general pattern is also evident for radical service innovation (Table 3.5).
Table 3.4: Proportions of service innovators: by sample group and sizeband
Employment sizebands
1-9 10-49 50 plus Total
N % % % %
Solicitors 943 22.0 35.1 50.0 25.3
Barristers’ chambers 156 18.6 56.8 48.9 25.3
Others (Regulated) 72 27.7 37.5 57.1 29.2
Others (Unregulated) 329 34.3 44.3 66.7 36.0
Total 1500 25.8 37.2 53.3 28.4 Source: SRA/LSB Survey of Innovation in Legal Services 2015. Responses are weighted. See Annex 4 for details.
Table 3.5: Proportions of radical service innovators: by sample group and sizeband
Employment sizebands
1-9 10-49 50 plus Total
N % % % %
Solicitors 943 5.6 10.2 17.5 6.8
Barristers’ chambers 156 5.0 20.9 12.8 7.2
Others (Regulated) 72 4.3 6.7 25.0 5.1
Others (Unregulated) 329 9.0 13.2 36.4 10.1
Total 1500 6.4 10.8 21.0 7.6 Source: SRA/LSB Survey of Innovation in Legal Services 2015. Responses are weighted. See Annex 4 for details.
A key measure of innovation is the proportion of total revenue (i.e. turnover) accounted for by innovative services (those introduced in the last three years: this is also one of the key metrics used in the 2009 study benchmarks - Annex 2). On average, respondents obtained 6.3 per cent of turnover from innovative services, with OLSPs in unregulated activities having a higher percentage of innovative revenue than either Solicitors or Barristers’ chambers (Table 3.6). Some variation in sizeband is evident here, but there is little systematic pattern.
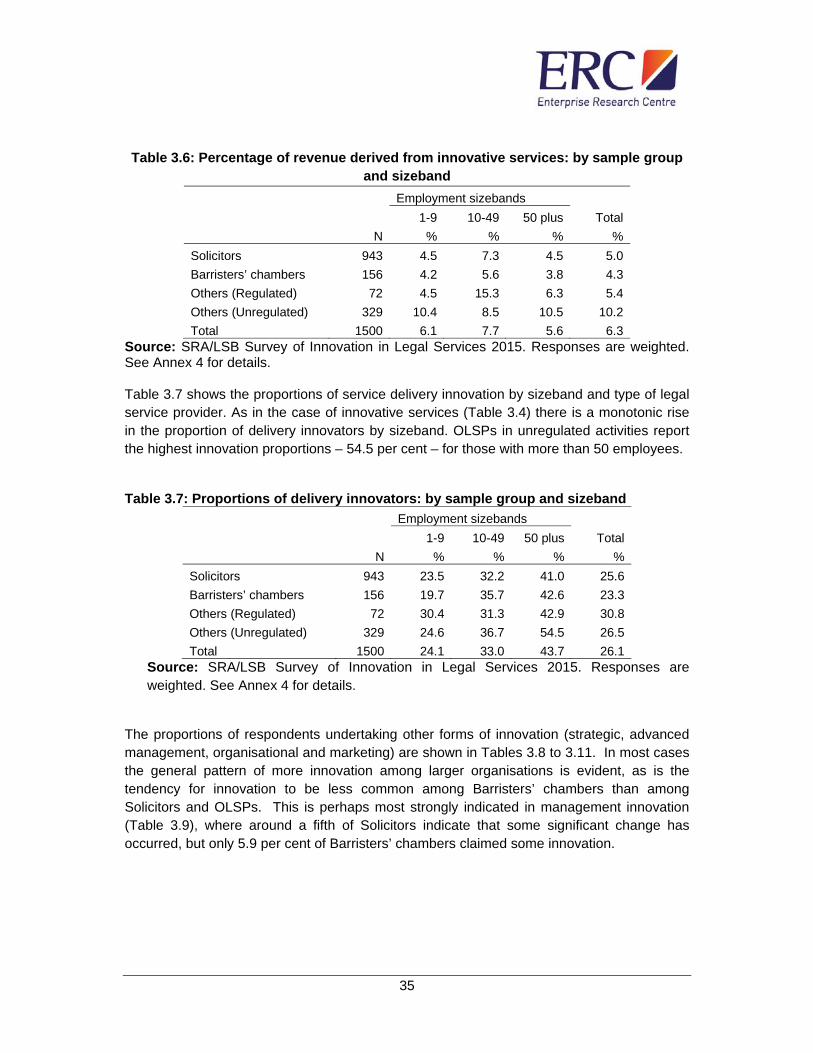
35
Table 3.6: Percentage of revenue derived from innovative services: by sample group
and sizeband
Employment sizebands
1-9 10-49 50 plus Total
N % % % %
Solicitors 943 4.5 7.3 4.5 5.0
Barristers’ chambers 156 4.2 5.6 3.8 4.3
Others (Regulated) 72 4.5 15.3 6.3 5.4
Others (Unregulated) 329 10.4 8.5 10.5 10.2
Total 1500 6.1 7.7 5.6 6.3 Source: SRA/LSB Survey of Innovation in Legal Services 2015. Responses are weighted. See Annex 4 for details. Table 3.7 shows the proportions of service delivery innovation by sizeband and type of legal service provider. As in the case of innovative services (Table 3.4) there is a monotonic rise in the proportion of delivery innovators by sizeband. OLSPs in unregulated activities report the highest innovation proportions – 54.5 per cent – for those with more than 50 employees. Table 3.7: Proportions of delivery innovators: by sample group and sizeband
Employment sizebands
1-9 10-49 50 plus Total
N % % % %
Solicitors 943 23.5 32.2 41.0 25.6
Barristers’ chambers 156 19.7 35.7 42.6 23.3
Others (Regulated) 72 30.4 31.3 42.9 30.8
Others (Unregulated) 329 24.6 36.7 54.5 26.5
Total 1500 24.1 33.0 43.7 26.1 Source: SRA/LSB Survey of Innovation in Legal Services 2015. Responses are weighted. See Annex 4 for details.
The proportions of respondents undertaking other forms of innovation (strategic, advanced management, organisational and marketing) are shown in Tables 3.8 to 3.11. In most cases the general pattern of more innovation among larger organisations is evident, as is the tendency for innovation to be less common among Barristers’ chambers than among Solicitors and OLSPs. This is perhaps most strongly indicated in management innovation (Table 3.9), where around a fifth of Solicitors indicate that some significant change has occurred, but only 5.9 per cent of Barristers’ chambers claimed some innovation.

36
Table 3.8: Proportions of strategic innovators: by sample group and sizeband
Employment sizebands
1-9 10-49 50 plus Total
N % % % %
Solicitors 943 14.2 24.6 41.1 17.0
Barristers’ chambers 156 11.5 22.7 25.0 13.9
Others (Regulated) 72 4.3 25.0 66.7 7.3
Others (Unregulated) 329 14.3 25.3 44.1 16.1
Total 1500 13.5 24.7 41.1 16.1
Table 3.9: Proportions of management innovators: by sample group and sizeband
Employment sizebands
1-9 10-49 50 plus Total
N % % % %
Solicitors 943 15.6 28.7 34.8 18.5
Barristers’ chambers 156 1.6 16.3 31.9 5.9
Others (Regulated) 72 6.5 18.8 28.6 8.1
Others (Unregulated) 329 12.9 27.3 42.4 14.9
Total 1500 13.8 27.8 35.7 16.5
Table 3.10: Proportions of organisational innovators: by sample group and
sizeband
Employment sizebands
1-9 10-49 50 plus Total
N % % % %
Solicitors 943 18.6 35.6 44.3 22.4
Barristers’ chambers 156 10.0 27.3 32.6 13.8
Others (Regulated) 72 8.5 25.0 57.1 11.1
Others (Unregulated) 329 20.3 43.0 50.0 23.0
Total 1500 18.1 36.3 44.9 21.6
Table 3.11: Proportions of marketing innovators: by sample group and sizeband
Employment sizebands
1-9 10-49 50 plus Total
N % % % %
Solicitors 943 32.3 48.7 71.6 36.6
Barristers’ chambers 156 19.4 53.5 66.0 26.9
Others (Regulated) 72 32.6 56.3 85.7 35.9
Others (Unregulated) 329 38.4 41.8 72.7 39.6
Total 1500 33.6 47.9 71.9 37.0
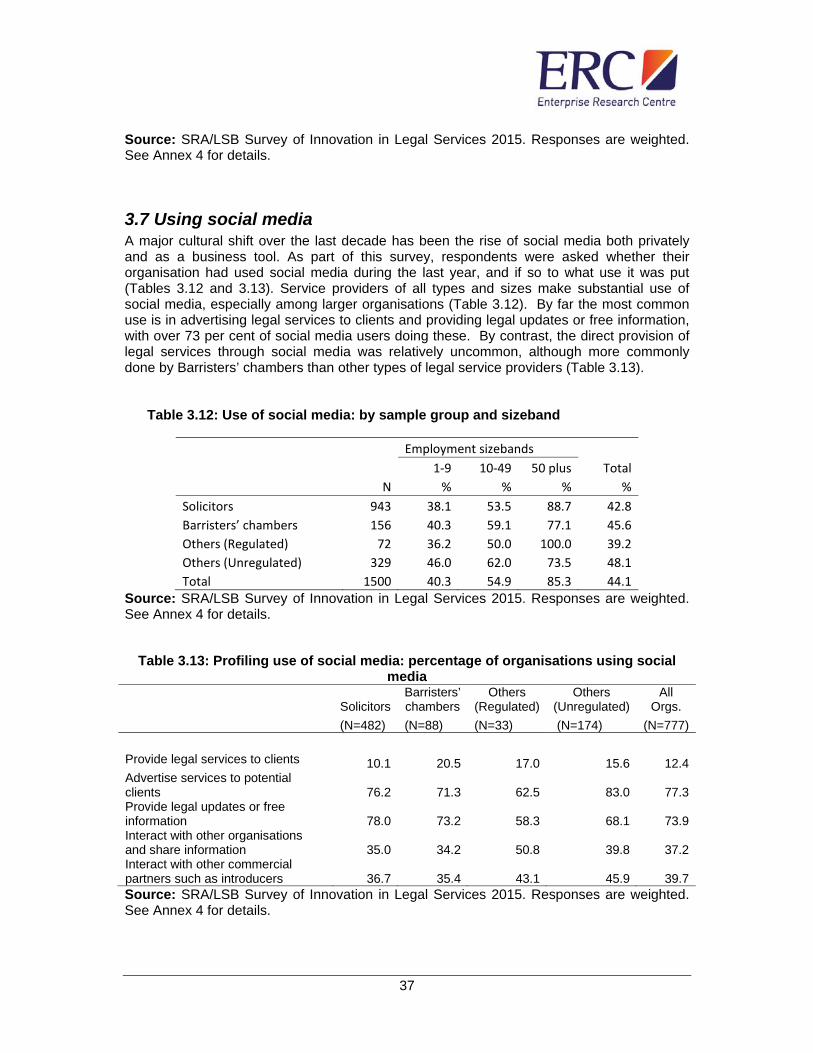
37
Source: SRA/LSB Survey of Innovation in Legal Services 2015. Responses are weighted. See Annex 4 for details.
3.7 Using social media A major cultural shift over the last decade has been the rise of social media both privately and as a business tool. As part of this survey, respondents were asked whether their organisation had used social media during the last year, and if so to what use it was put (Tables 3.12 and 3.13). Service providers of all types and sizes make substantial use of social media, especially among larger organisations (Table 3.12). By far the most common use is in advertising legal services to clients and providing legal updates or free information, with over 73 per cent of social media users doing these. By contrast, the direct provision of legal services through social media was relatively uncommon, although more commonly done by Barristers’ chambers than other types of legal service providers (Table 3.13).
Table 3.12: Use of social media: by sample group and sizeband
Employment sizebands
1‐9 10‐49 50 plus Total
N % % % %
Solicitors 943 38.1 53.5 88.7 42.8
Barristers’ chambers 156 40.3 59.1 77.1 45.6
Others (Regulated) 72 36.2 50.0 100.0 39.2
Others (Unregulated) 329 46.0 62.0 73.5 48.1
Total 1500 40.3 54.9 85.3 44.1
Source: SRA/LSB Survey of Innovation in Legal Services 2015. Responses are weighted. See Annex 4 for details.
Table 3.13: Profiling use of social media: percentage of organisations using social media
Solicitors
Barristers’ chambers
Others (Regulated)
Others (Unregulated)
All Orgs.
(N=482) (N=88) (N=33) (N=174) (N=777) Provide legal services to clients 10.1 20.5 17.0 15.6 12.4Advertise services to potential clients 76.2 71.3 62.5 83.0 77.3Provide legal updates or free information 78.0 73.2 58.3 68.1 73.9Interact with other organisations and share information 35.0 34.2 50.8 39.8 37.2Interact with other commercial partners such as introducers 36.7 35.4 43.1 45.9 39.7Source: SRA/LSB Survey of Innovation in Legal Services 2015. Responses are weighted. See Annex 4 for details.

38
3.8 The benefits of innovation Innovators are also asked what effect their new or improved service(s) has had (Table 3.14). Clearly these responses are to some extent linked to the motivational factors: if competition is a factor, then extending the range of services or reducing costs is going to be both a motivator and an effect of innovation. The major effects are in extending the range of services offered, improving quality, attracting new clients, and improved tailoring of services. By contrast, improved speed of delivery and increasing revenue from existing clients were less important, although still mentioned by a majority of organisations. The benefits anticipated were broadly similar across the different types of legal service providers (Table 3.14). Reducing costs was not an important benefit, except for Barristers’ chambers.
Table 3.14: Effects of legal service innovation: innovating organisations (%)
Solicitors Barristers’ chambers
Others(Regulated)
Others (Unregulated)
All Orgs.
(N=286) (N=59) (N=23) (N=129) (N=497)Extended the range of services you offer 78.9 92.9 57.5 77.2 77.5 Improved the speed of delivery of your services 59.5 68.6 75.9 59.9 60.8 Reduced the costs of delivery of the services you provide 37.6 67.5 31.7 49.4 42.2 Improved the quality of the services you offer 82.5 86.1 96.7 81.8 83.2 Enabled you to attract new clients 89.3 83 62.5 82.8 85.5 Increased your revenue from existing clients 66.1 63.7 68.1 74.4 68.9 Involved tailoring services to meet individual client needs 85.5 92.9 85.3 85.1 85.6
Source: SRA/LSB Survey of Innovation in Legal Services 2015. Responses are weighted. See Annex 4 for details.
3.9 Summary of key findings Barristers’ chambers appear to be facing particular challenges emphasising a wider range of drivers for innovation than either Solicitors or OLSPs. Key factors are changing regulation and changing demand for new services. For OLSPs in regulated activities, legislative and regulatory changes relating to legal services were the key motivating factors for innovation. Intensity of competition is a middle-ranking motivation for all types of legal service provider. Just over one quarter of all respondents had introduced a new or improved service in the previous three years, with OLSPs in unregulated activities markedly more likely to do so than Solicitors or Barristers’ chambers. The introduction of a ‘radical’ innovation i.e. one introduced before competitors, is much less common, indicated by less than 8% of respondents. On average, respondents obtained 6.3 per cent of turnover from innovative

39
services, with OLSPs in unregulated activities having a much higher percentage than either lawyers or Barristers’ chambers. There is some variation in the extent of other forms of innovation (strategic, managerial, organisational and marketing), but here the pattern is of roughly comparable levels of innovation among Solicitors and OLSPs, and lower levels among Barristers’ chambers. Innovation in the delivery of services was claimed by 26.1 per cent of respondents, again lower among Barristers’ chambers than other groups. Where appropriate, respondents were also asked to indicate the principal area of change in their service delivery. Although a wide range of issues was mentioned, among Solicitors the predominant change was in the use of electronic communication with clients, including the use of electronic forms, and improved case management systems. OLSPs also frequently mentioned the use of online and electronic communication with clients. Among barristers the focus tended to be more on direct access to clients and the need for a more client-focussed approach. Service providers of all types and sizes make substantial use of social media, especially among larger organisations. By far the most common use is in advertising legal services to clients and providing legal updates or free information, with over 73 per cent of social media users doing these. By contrast, the direct provision of legal services through social media was relatively uncommon, although more commonly done among Barristers’ chambers than by OLSPs.

40
Section 4: Innovating in legal services
4.1 Introduction This Section focuses on the approaches which legal service providers are adopting to developing new and improved services and delivery mechanisms. We focus initially (Section 4.2) on legal service providers’ overall approaches to managing and leading innovation, and two issues in particular:
The overall policies and management structures which organisations have in place to facilitate innovation such as written policies, supportive cultures and structured innovation processes;
The importance which legal service providers place on the recruitment and training of lawyers and those with a non-legal background.
Section 4.3 then focuses on the different elements of the innovation value chain (IVC) focusing on how legal service providers gather or create the knowledge they need for innovation, how those innovations are brought to the market and then how they are commercialised. In each section we focus on a number of the metrics defined in Section 2 (see Figure 2.2). Historical comparisons can also shed light on progress within the sector and in Section 4.4 we compare the value chain metrics for 2015 with those from 2009. As the previous (2009) study was based on a more limited survey of legal service providers with five or more employees this comparison is somewhat partial in terms of the sector as a whole, but does highlight some interesting contrasts.
4.2 Leading and managing innovation in legal service providers As part of the survey we asked legal service providers whether they had implemented a number of steps to support the development of new or improved services or delivery processes (Table 4.1). Here, a significant gap was evident between the proportion of organisations suggesting that their culture and leadership was supportive of innovation and the implementation of practical initiatives which might support innovation activity. More specifically, around four-fifths of legal service providers reported having a leadership team and culture which ‘supports new ideas’ (See also annex A3.4.2). In around half of these organisations this remains undocumented, however, with only around 36-46 per cent of legal service providers having written strategies or policies on innovation (Table 4.1).

41
Table 4.1: Policies and practices to support innovation in services and delivery (%)
Solicitors Barristers’ chambers
Others(Regulated)
Others (Unregulated) All Orgs.
(N=943) (N=156) (N=72) (N=329) (N=1500)
Written strategies or policies to support the introduction of new ideas 42.4 42.4 25.4 41.5 41.3 A culture that supports the introduction of new ideas 84.3 79.9 56.6 78.7 81.5 Structured processes to support the introduction of new ideas 49.6 48.0 28.9 50.0 48.6 Rewards or incentives for valuable new ideas 26.2 18.0 20.2 24.0 25.2 A leadership team that supports new ideas 80.1 73.1 52.5 69.9 76.2
Average percentage 56.5 52.3 36.7 52.8 54.6
Source: SRA/LSB Survey of Innovation in Legal Services 2015. Responses are weighted. See Annex 4 for details. A marginally larger proportion of legal service providers had structured processes for new ideas with rewards for valuable ideas being implemented in around a quarter of all organisations (See also annex A3.6). The general profile of policies and practices intended to support the development of new ideas and innovation was broadly similar across different types of legal service provider (Table 4.1). Focussing on Solicitors specifically, the proportion of firms with policies and practices in place to support innovation is greater in larger firms, although many smaller practices also reported having a culture and leadership team that supported the introduction of new ideas (Table 4.2).
Table 4.2: Policies and practices to support innovation: Solicitors, by size band (%) Less than 10
employees10‐49
employees50 or more employees All Solicitors
Written strategies or policies to support the introduction of new ideas 38.2 53.8 67.1 42.4A culture that supports the introduction of new ideas 82.0 90.2 97.9 84.3Structured processes to support the introduction of new ideas 46.1 58.2 73.0 49.6Rewards or incentives for valuable new ideas 22.8 35.5 45.7 26.2A leadership team that supports new ideas 77.0 88.2 97.9 80.1
Source: SRA/LSB Survey of Innovation in Legal Services 2015. Responses are weighted. See Annex 4 for details.
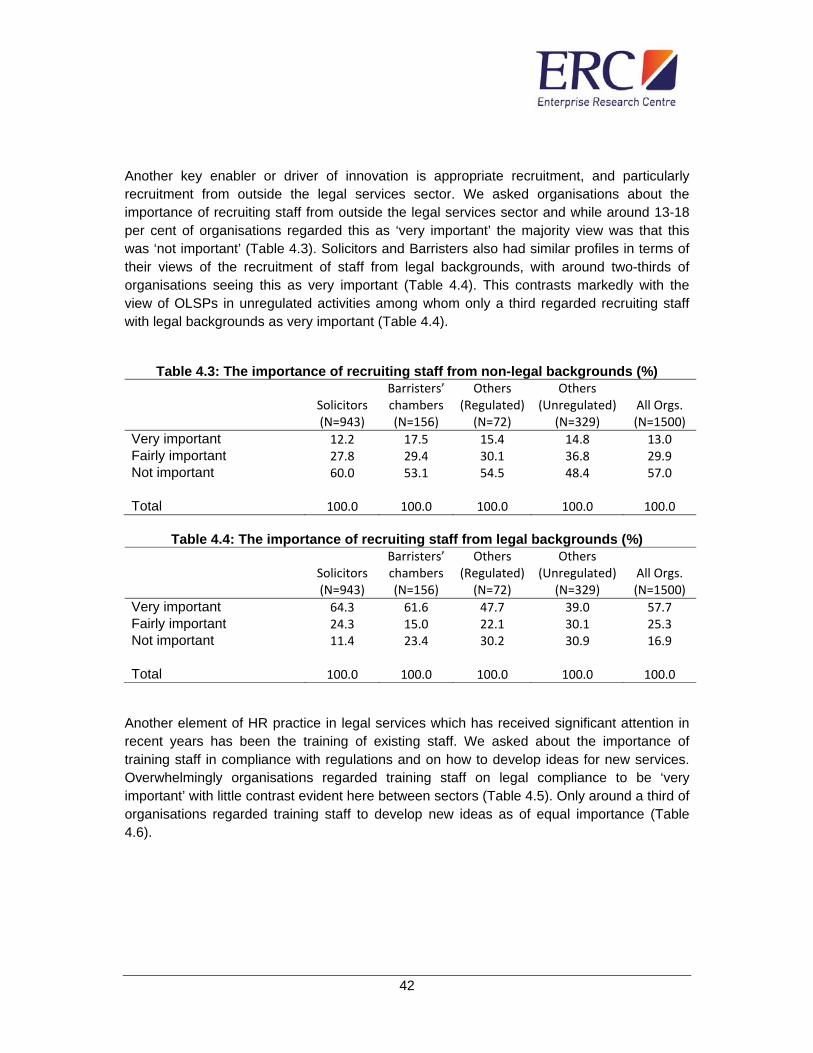
42
Another key enabler or driver of innovation is appropriate recruitment, and particularly recruitment from outside the legal services sector. We asked organisations about the importance of recruiting staff from outside the legal services sector and while around 13-18 per cent of organisations regarded this as ‘very important’ the majority view was that this was ‘not important’ (Table 4.3). Solicitors and Barristers also had similar profiles in terms of their views of the recruitment of staff from legal backgrounds, with around two-thirds of organisations seeing this as very important (Table 4.4). This contrasts markedly with the view of OLSPs in unregulated activities among whom only a third regarded recruiting staff with legal backgrounds as very important (Table 4.4).
Table 4.3: The importance of recruiting staff from non-legal backgrounds (%)
Solicitors Barristers’ chambers
Others(Regulated)
Others (Unregulated) All Orgs.
(N=943) (N=156) (N=72) (N=329) (N=1500) Very important 12.2 17.5 15.4 14.8 13.0 Fairly important 27.8 29.4 30.1 36.8 29.9 Not important 60.0 53.1 54.5 48.4 57.0 Total 100.0 100.0 100.0 100.0 100.0
Table 4.4: The importance of recruiting staff from legal backgrounds (%)
Solicitors
Barristers’ chambers
Others (Regulated)
Others (Unregulated) All Orgs.
(N=943) (N=156) (N=72) (N=329) (N=1500) Very important 64.3 61.6 47.7 39.0 57.7 Fairly important 24.3 15.0 22.1 30.1 25.3 Not important 11.4 23.4 30.2 30.9 16.9 Total 100.0 100.0 100.0 100.0 100.0
Another element of HR practice in legal services which has received significant attention in recent years has been the training of existing staff. We asked about the importance of training staff in compliance with regulations and on how to develop ideas for new services. Overwhelmingly organisations regarded training staff on legal compliance to be ‘very important’ with little contrast evident here between sectors (Table 4.5). Only around a third of organisations regarded training staff to develop new ideas as of equal importance (Table 4.6).

43
Table 4.5: The importance of training staff on legal compliance with regulations (%)
Solicitors Barristers’ chambers
Others (Regulated)
Others (Unregulated) All Orgs.
(N=943) (N=156) (N=72) (N=329) (N=1500)
Very important 90.0 73.6 84.3 78.3 86.8 Fairly important 7.8 20.7 10.5 13.4 9.4 Not important 2.2 5.6 5.2 8.3 3.7 Total 100.0 100.0 100.0 100.0 100.0
Table 4.6: The importance of training staff on how to develop ideas for new services
(%)
Solicitors Barristers’ chambers
Others(Regulated)
Others (Unregulated) All Orgs.
(N=943) (N=156) (N=72) (N=329) (N=1500) Very important 40.3 39.4 24.7 37.5 38.9 Fairly important 34.6 29.8 42.9 40.3 36.2 Not important 25.0 30.8 32.4 22.2 24.9 Total 100.0 100.0 100.0 100.0 100.0
In summary, while around four-fifths of legal service providers feel they have a leadership and culture which supports the development of new ideas only around 40 per cent have in place the practical steps to promote such adoption. This pattern differs little between Solicitors, Barristers’ chambers and OLSPs. Views on training staff are also relatively similar across groups with only around a third of organisations regarding ‘training staff to develop new ideas’ as very important. Recruitment priorities do differ between sectors, however, with only around a third of OLSPs regarding it as ‘very important’ to recruit those with a legal services background compared to around two-thirds of Solicitors and Barristers’ chambers.
4.3 Internal and external sources of new ideas Where do new service ideas come from in legal services? Do these emerge from within the organisation itself or from outside sources? Previous research suggests the importance of this question, emphasising a positive link between the proportion of external ideas which are implemented by the organisation and future growth25. In this section we focus on this initial stage in the value chain and organisations’ capabilities in terms of identifying new ideas. In particular we focus on four intermediate metrics which provide an indication of the strength of organisations’ ideation – idea generation - activities. These are:
The proportion of externally sourced ideas (%) – intended to reflect the openness of organisations’ knowledge gathering activities this metric is a commonly used ‘openness’ measure. This metric (A1) is defined as the ‘proportion of new services typically coming from ideas initially developed outside the organisation'.
25 Love, J H, S Roper and J Bryson. 2011. Knowledge, Openness, Innovation and Growth in UK Business Services. Research Policy, 40(10), 1438-52.
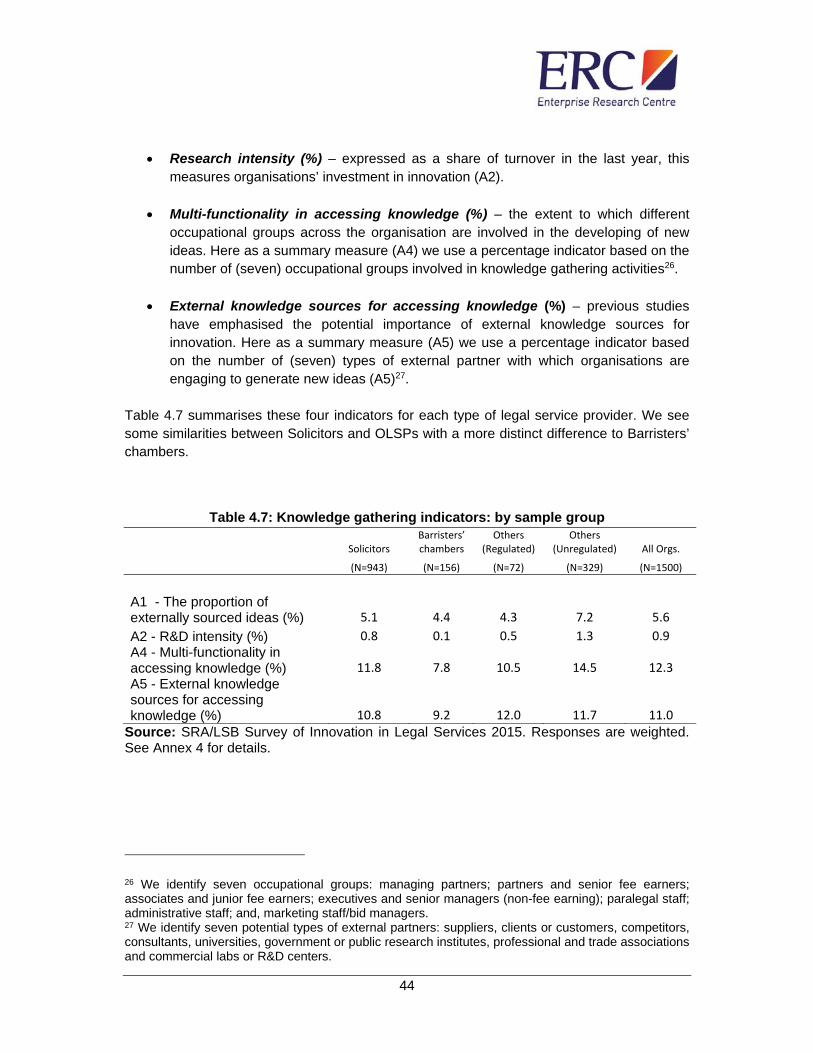
44
Research intensity (%) – expressed as a share of turnover in the last year, this
measures organisations’ investment in innovation (A2).
Multi-functionality in accessing knowledge (%) – the extent to which different occupational groups across the organisation are involved in the developing of new ideas. Here as a summary measure (A4) we use a percentage indicator based on the number of (seven) occupational groups involved in knowledge gathering activities26.
External knowledge sources for accessing knowledge (%) – previous studies
have emphasised the potential importance of external knowledge sources for innovation. Here as a summary measure (A5) we use a percentage indicator based on the number of (seven) types of external partner with which organisations are engaging to generate new ideas (A5)27.
Table 4.7 summarises these four indicators for each type of legal service provider. We see some similarities between Solicitors and OLSPs with a more distinct difference to Barristers’ chambers.
Table 4.7: Knowledge gathering indicators: by sample group
Solicitors Barristers’ chambers
Others(Regulated)
Others (Unregulated) All Orgs.
(N=943) (N=156) (N=72) (N=329) (N=1500)
A1 - The proportion of externally sourced ideas (%) 5.1 4.4 4.3 7.2 5.6
A2 - R&D intensity (%) 0.8 0.1 0.5 1.3 0.9 A4 - Multi-functionality in accessing knowledge (%) 11.8 7.8 10.5 14.5 12.3 A5 - External knowledge sources for accessing knowledge (%) 10.8 9.2 12.0 11.7 11.0
Source: SRA/LSB Survey of Innovation in Legal Services 2015. Responses are weighted. See Annex 4 for details.
26 We identify seven occupational groups: managing partners; partners and senior fee earners; associates and junior fee earners; executives and senior managers (non-fee earning); paralegal staff; administrative staff; and, marketing staff/bid managers. 27 We identify seven potential types of external partners: suppliers, clients or customers, competitors, consultants, universities, government or public research institutes, professional and trade associations and commercial labs or R&D centers.

45
4.4 Building specific innovations The intermediate stage of the innovation value chain relates to organisations’ capabilities in translating new knowledge into specific service innovations or delivery processes. Here we focus on five main indicators, two relating to the nature of organisations’ innovative output and three relating to the organisational inputs to the innovative process:
Percentage of turnover of innovative products (%) – a relatively standard measure of the percentage of turnover derived from new or improved services over the last three years (B2).
Diversity of innovation activity (%) – in the survey we identify six different types of
innovation activity relating to services, delivery, strategy, management systems, organisational change and marketing innovation. This metric (B3) is designed to reflect the diversity of innovation activity and takes value 100 if an organisation is engaged in all six types of innovation activity and 50 if an organisation undertook three different forms of innovation.
Multi-functionality in building innovation (%) – intended to reflect the engagement
of multiple occupational groups in building innovation this metric reflects the percentage of the identified occupational groups used in this element of the innovation process. Organisations using all occupational groups score 100 per cent.
Embeddedness of team-working in building innovation (%) – this metric (B5) is
intended to reflect the extent of commitment to team-working. We identify five different attributes of team working activity:
o Team-working plays a major role in the development of new products/services;
o Development teams are cross-functional and involve people from different parts of the organisation;
o Teams operate very independently and are left to get on with solving the problem;
o Our organisation invests in training in team working;
o Teams often involve customers or suppliers.
Respondents agreeing with all five statements score 100 per cent.
External knowledge sources for building innovation (%) – previous studies have emphasised the potential importance of external knowledge sources for innovation. We identify seven potential types of external partners (B6). Organisations reporting using all of these in helping them to develop new or improved services/products score 100 per cent.
Across all organisations in the legal services sector 6.3 per cent of revenues is derived from services newly introduced in the last three years. This rises to 10.2 per cent for OLSPs in un-regulated activities (Table 4.8). In terms of the diversity of innovation we again see a

46
distinction between Barristers’ chambers and the other groups with innovation more broadly based among Solicitors and OLSPs. Team-working is most prevalent among Barristers’ chambers with less marked differences evident in terms of organisations’ engagement with external knowledge sources.
Table 4.8: Building Innovation – summary measures by type of organisation
Solicitors Barristers’ chambers
Others(Regulated)
Others (Unregulated) All Orgs.
(N=943) (N=156) (N=72) (N=329) (N=1500)
B2 Percentage of turnover of innovative products (%) 5.0 4.3 5.4 10.2 6.3 B3 Diversity of innovation activity (%) 24.1 18.5 20.2 25.9 24.2 B4 Multi-functionality in building innovation (%) 11.4 8.1 11.3 13.8 11.9 B5 Embeddedness of team-working in building innovation (%) 8.4 12.2 5.8 8.8 8.5 B6 External knowledge sources for building innovation (%) 4.8 4.6 3.8 5.4 4.9
Source: SRA/LSB Survey of Innovation in Legal Services 2015. Responses are weighted. See Annex 4 for details.
4.5 Commercialising innovation Commercialising innovation is the last element of the innovation value chain linking knowledge creation and the generation of value by legal services business for their various stakeholders. In this section we focus on five main indicators relating to different aspects of organisations’ commercialisation activity. These are:
Range of customer relation modes (%) – how legal service providers interact with their clients and use these interactions to inform service development and delivery (see also section A3.2.2). We consider three aspects of customer interaction in particular: the involvement of clients in service evaluation, customer feedback and its role in shaping service development, and whether legal service providers hold regular customer review meetings. Our summary measure (C1) reflects engagement with these alternative forms of customer interaction.
Branding and marketing intensity – whether legal service providers invested in
improving their reputation and branding over the last year. Previous studies have linked this measure with the successful exploitation of innovation and feed through into enhanced business growth28. The summary measure used here (C2) expresses spending on reputation and branding over the last year as a percentage of turnover.
28 Love, J H ; S Roper and J Bryson. 2011. Knowledge, Openness, Innovation and Growth in UK Business Services. Research Policy, 40(10), 1438-52.
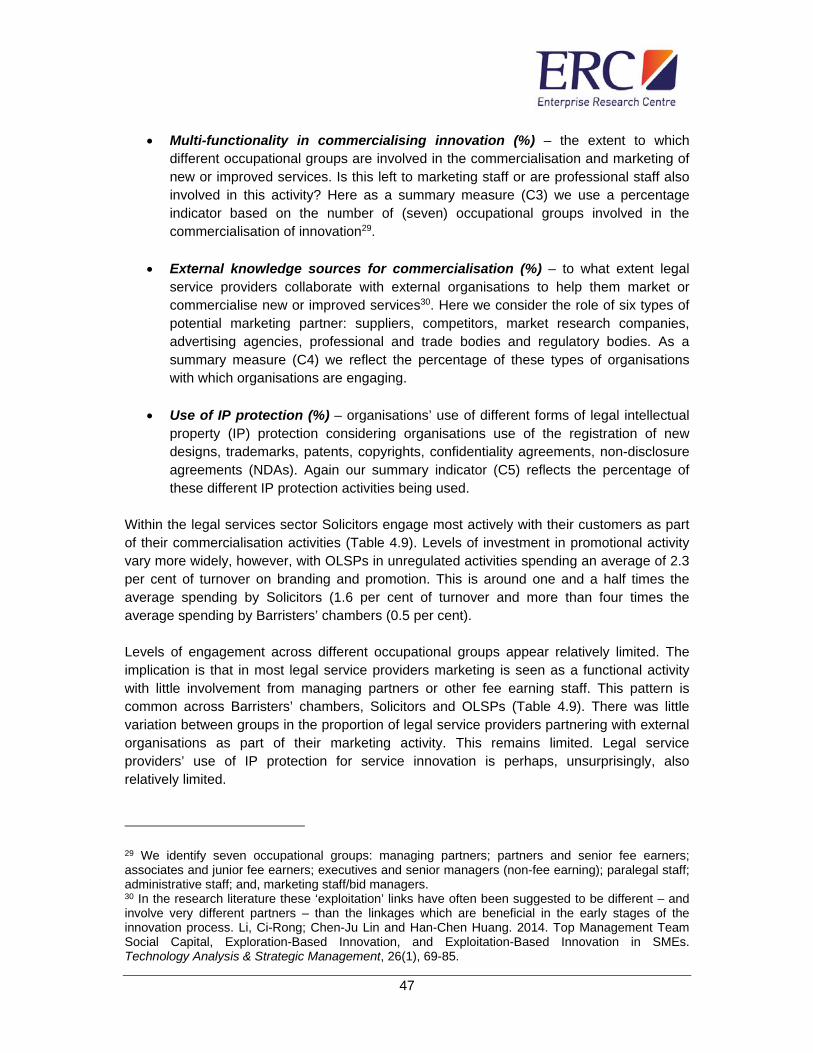
47
Multi-functionality in commercialising innovation (%) – the extent to which different occupational groups are involved in the commercialisation and marketing of new or improved services. Is this left to marketing staff or are professional staff also involved in this activity? Here as a summary measure (C3) we use a percentage indicator based on the number of (seven) occupational groups involved in the commercialisation of innovation29.
External knowledge sources for commercialisation (%) – to what extent legal
service providers collaborate with external organisations to help them market or commercialise new or improved services30. Here we consider the role of six types of potential marketing partner: suppliers, competitors, market research companies, advertising agencies, professional and trade bodies and regulatory bodies. As a summary measure (C4) we reflect the percentage of these types of organisations with which organisations are engaging.
Use of IP protection (%) – organisations’ use of different forms of legal intellectual
property (IP) protection considering organisations use of the registration of new designs, trademarks, patents, copyrights, confidentiality agreements, non-disclosure agreements (NDAs). Again our summary indicator (C5) reflects the percentage of these different IP protection activities being used.
Within the legal services sector Solicitors engage most actively with their customers as part of their commercialisation activities (Table 4.9). Levels of investment in promotional activity vary more widely, however, with OLSPs in unregulated activities spending an average of 2.3 per cent of turnover on branding and promotion. This is around one and a half times the average spending by Solicitors (1.6 per cent of turnover and more than four times the average spending by Barristers’ chambers (0.5 per cent). Levels of engagement across different occupational groups appear relatively limited. The implication is that in most legal service providers marketing is seen as a functional activity with little involvement from managing partners or other fee earning staff. This pattern is common across Barristers’ chambers, Solicitors and OLSPs (Table 4.9). There was little variation between groups in the proportion of legal service providers partnering with external organisations as part of their marketing activity. This remains limited. Legal service providers’ use of IP protection for service innovation is perhaps, unsurprisingly, also relatively limited.
29 We identify seven occupational groups: managing partners; partners and senior fee earners; associates and junior fee earners; executives and senior managers (non-fee earning); paralegal staff; administrative staff; and, marketing staff/bid managers. 30 In the research literature these ‘exploitation’ links have often been suggested to be different – and involve very different partners – than the linkages which are beneficial in the early stages of the innovation process. Li, Ci-Rong; Chen-Ju Lin and Han-Chen Huang. 2014. Top Management Team Social Capital, Exploration-Based Innovation, and Exploitation-Based Innovation in SMEs. Technology Analysis & Strategic Management, 26(1), 69-85.

48
Table 4.9: Commercialising Innovation – summary measures by type of organisation
Solicitors Barristers’ chambers
Others (Regulated)
Others (Unregulated) All Orgs.
(N=943) (N=156) (N=72) (N=329) (N=1500)
C1. Range of customer relation modes (%) 64.8 50.4 40.6 54.9 60.3 C2. Branding, marketing intensity (expenditure per turnover) 1.6 0.5 1.3 2.3 1.8 C3.Multi-functionality in commercialising innovation (%) 11.1 8.8 9.8 12.2 11.2 C4. External knowledge sources for commercialisation (%) 3.4 3.1 1.1 4.6 3.6 C5. Use of IP protection (%) 7.4 9.4 9.5 11.4 8.7
Source: SRA/LSB Survey of Innovation in Legal Services 2015. Responses are weighted. See Annex 4 for details.
Naturally we might expect larger organisations to be engaging more broadly with customers than smaller organisations and this pattern is evident for Solicitors, Barristers’ chambers and OLSPs. Less easy to anticipate is the pattern of branding and marketing spend by sizeband (Table 4.10), which varies both between groups of legal service providers and between size bands. For Solicitors smaller organisations are – on average – spending a larger proportion of their turnover on marketing than larger organisations, whereas for Barristers’ chambers while the same pattern is evident, levels of marketing spend remain significantly lower in all size groups. Among OLSPs a more complex pattern emerges with smaller and larger (50 plus) organisations having higher levels of promotional spend.
Table 4.10: Branding, marketing intensity (expenditure per turnover) by type of organisation and sizeband
Employment sizebands
1-9 10-49 50 plus Total
N % % % %
Solicitors 943 1.7 1.1 1.2 1.6
Barristers’ chambers 156 0.5 0.2 0.3 0.5
Others (Regulated) 72 1.3 0.5 1.2 1.3
Others (Unregulated) 329 2.4 0.7 3.8 2.3
Total 1500 1.9 1.0 1.6 1.8 Source: SRA/LSB Survey of Innovation in Legal Services 2015. Responses are weighted. See Annex 4 for details.
Reflecting the pattern observed for customer engagement, the engagement of multiple occupational groups from across the organisation in marketing and commercialisation
49
activities also increases with size. The level of multi-functional engagement – particularly of fee-earning staff – is greater in Solicitors and OLSPs than in Barristers’ chambers. Essentially similar profiles are evident in terms of partnering with external organisations and use of intellectual property – both increase as size increases and both are more common among Solicitors and OLSPs than among Barristers’ chambers.
4.6 Benchmark comparisons with 2009 Given the changes in the nature of regulation of the legal services sector in recent years it is interesting to compare levels of innovative activity currently with those in 2009. For 2009 the only benchmarks we have are based on a sample of 178 legal service providers with five or more employees. This might impart an upward bias to the 2009 benchmarks as smaller organisations are typically less innovation active. Before looking at the numerical comparisons it is also important to recognise the relatively small size of the 2009 sample and that at the time of that survey no specific weighting was undertaken to ensure a representative balance between Solicitors, Barristers’ chambers and OLSPs. Key points from the 2009 to 2015 comparison are as follows (Table 4.11):
In terms of accessing knowledge the benchmarks for 2015 are broadly similar to those of 2009 although the 2015 survey reports a lower average level of engagement of multiple occupational groups in knowledge sourcing (A4, multi-functionality).
In terms of building innovation the results are again very similar overall with marginal
changes in the extent of the diversity of innovation. Again the level of engagement of multi-functional groups in building innovation appears lower than previously.
Commercialising innovation benchmarks are also rather similar although average
spending on reputation and branding differs sharply between the two surveys. Overall, the picture here is one of stability rather than significant change, however, with the majority of indicators in each element of the value chain taking similar values in 2015 as to those which were observed in 2009. Where marked differences do exist these seem likely to reflect sampling issues rather than substantive changes.
4.7 Summary of key points While around four-fifths of legal service providers feel they have a leadership and culture which supports the development of new ideas only around 40 per cent have in place the practical steps to promote ideation. This pattern differs little between Solicitors, Barristers’ chambers and OLSPs. Views on training staff are also relatively similar across types of legal service provider with only around a third of organisations regarding ‘training staff to develop new ideas’ as very important.
50
Recruitment priorities do differ between sectors, however, with only around a third of OLSPs regarding it as ‘very important’ to recruit those with a legal services background compared to around two-thirds of Solicitors and Barristers’ chambers. In terms of how legal service providers innovate:
Metrics for knowledge gathering activities suggest some similarities between Solicitors and OLSPs with a more distinct difference to Barristers’ chambers. Knowledge gathering metrics also remain very similar to their 2009 values.
Across all legal service providers about 6.3 per cent of revenues is derived from
services newly introduced in the last three years. This rises to 10.2 per cent for OLSPs in unregulated activities. In terms of the diversity of innovation we again see a distinction between Barristers’ chambers and the other types of legal service provider: innovation is more broadly based among Solicitors and OLSPs.
Solicitors engage most actively with their customers as part of their commercialisation activities. Levels of investment in promotional activity vary more widely, however, with OLSPs in unregulated sectors spending an average of 2.3 per cent of turnover on branding and promotion. This is more than the average spending by Solicitors (1.6 per cent of turnover) and more than four times the average spending by barristers (0.6 per cent).
Comparing value chain metrics to those for 2009 suggests a picture of stability rather than significant change; indicators in each element of the value chain take similar values in 2015 to those observed in 2009.
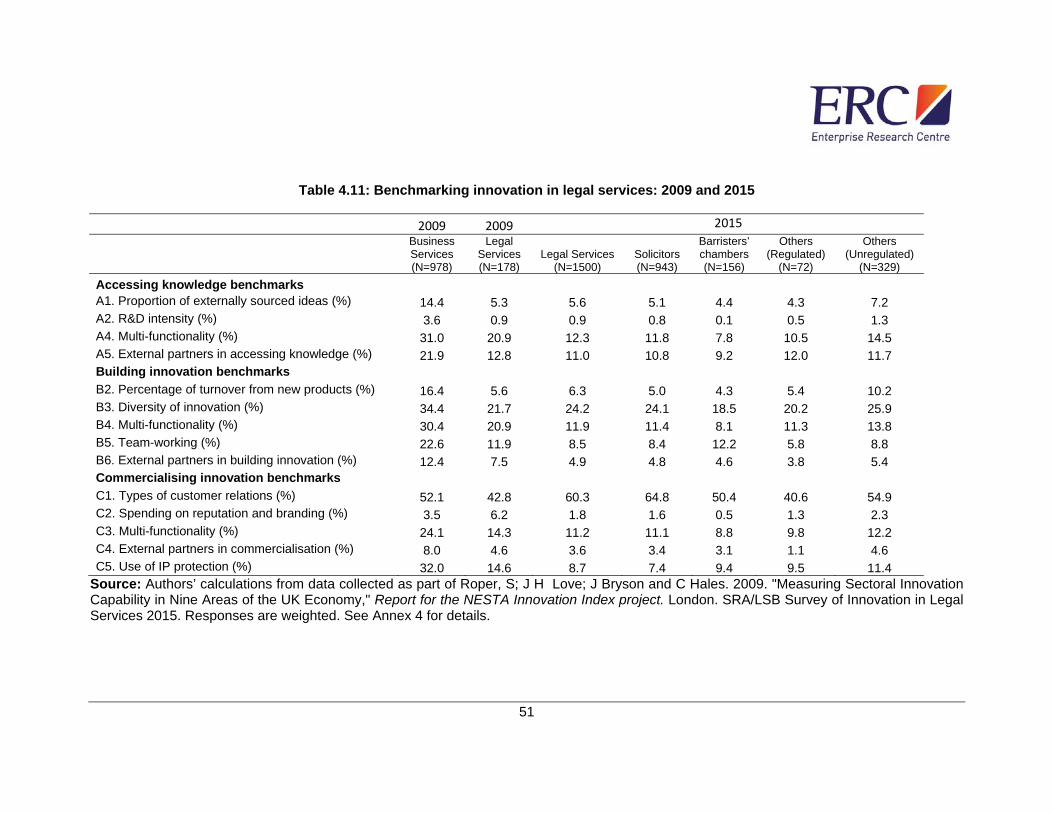
51
Table 4.11: Benchmarking innovation in legal services: 2009 and 2015
2009 2009 2015
Business Services (N=978)
Legal Services (N=178)
Legal Services (N=1500)
Solicitors (N=943)
Barristers’ chambers (N=156)
Others (Regulated)
(N=72)
Others (Unregulated)
(N=329)
Accessing knowledge benchmarks
A1. Proportion of externally sourced ideas (%) 14.4 5.3 5.6 5.1 4.4 4.3 7.2 A2. R&D intensity (%) 3.6 0.9 0.9 0.8 0.1 0.5 1.3 A4. Multi-functionality (%) 31.0 20.9 12.3 11.8 7.8 10.5 14.5 A5. External partners in accessing knowledge (%) 21.9 12.8 11.0 10.8 9.2 12.0 11.7 Building innovation benchmarks
B2. Percentage of turnover from new products (%) 16.4 5.6 6.3 5.0 4.3 5.4 10.2 B3. Diversity of innovation (%) 34.4 21.7 24.2 24.1 18.5 20.2 25.9 B4. Multi-functionality (%) 30.4 20.9 11.9 11.4 8.1 11.3 13.8 B5. Team-working (%) 22.6 11.9 8.5 8.4 12.2 5.8 8.8 B6. External partners in building innovation (%) 12.4 7.5 4.9 4.8 4.6 3.8 5.4 Commercialising innovation benchmarks
C1. Types of customer relations (%) 52.1 42.8 60.3 64.8 50.4 40.6 54.9 C2. Spending on reputation and branding (%) 3.5 6.2 1.8 1.6 0.5 1.3 2.3 C3. Multi-functionality (%) 24.1 14.3 11.2 11.1 8.8 9.8 12.2 C4. External partners in commercialisation (%) 8.0 4.6 3.6 3.4 3.1 1.1 4.6 C5. Use of IP protection (%) 32.0 14.6 8.7 7.4 9.4 9.5 11.4
Source: Authors’ calculations from data collected as part of Roper, S; J H Love; J Bryson and C Hales. 2009. "Measuring Sectoral Innovation Capability in Nine Areas of the UK Economy," Report for the NESTA Innovation Index project. London. SRA/LSB Survey of Innovation in Legal Services 2015. Responses are weighted. See Annex 4 for details.

52
Section 5: Innovation barriers and enablers
5.1 Introduction This section considers the issues which respondents considered to be constraints on their innovation activity, and the extent to which a range of factors (including regulation) had a positive or negative effect on their ability to introduce new legal services, or deliver them in innovative ways. These questions were asked of all respondents.
5.2 Barriers to innovation Perceptions of the key barriers to legal services innovation are shown in Table 5.1. Respondents were invited to indicate whether each factor was a significant constraint, a small constraint or no constraint to innovation. The percentages in Table 5.1 are those organisations responding that the relevant factor was a ‘significant’ constraint. Interestingly, the general pattern of responses was quite uniform across Solicitors, Barristers’ chambers and OLSPs. While the most commonly cited factors are regulatory and legislative issues, seen as being a significant impediment to innovation to between one fifth and one quarter of respondents of all types, this also implies that around 75-80 per cent of respondents did not consider regulation or legislation to be a major constraint on innovation. It is also of interest that OLSPs operating in activities which are unregulated under the Legal Services Act (LSA) 2007 cite regulatory barriers to innovation as often as organisations which are regulated by the LSA. One possibility is that the main regulatory barriers to innovation are not therefore specific to the LSA itself but relate to the impact of the wider business environment. The next biggest constraints are lack of the necessary finance for innovation, limited market opportunities, and lack of expertise in the business, all mentioned by under 20 per cent of organisations. The only substantial difference among respondent types here was the greater importance of lack of finance for barristers, and insignificance of a lack of internal expertise for this group. Other factors (e.g. attitudinal barriers and lack of collaborators) were generally viewed as being relatively insignificant. However, it is worth noting that regulated OLSPs perceived lack of finance and attitudinal barriers within their organisation as much less of a constraint on innovation than did other providers. In general terms the relative frequency with which the different constraints on innovation are mentioned by legal services providers reflects that in other innovation surveys. In the UK Innovation Survey for 2011, for example, the most frequently mentioned innovation barriers were cost and availability of finance, said to be ‘significant’ by 14 per cent of UK firms followed by the costs and risks of innovation. UK Government regulation was said to be
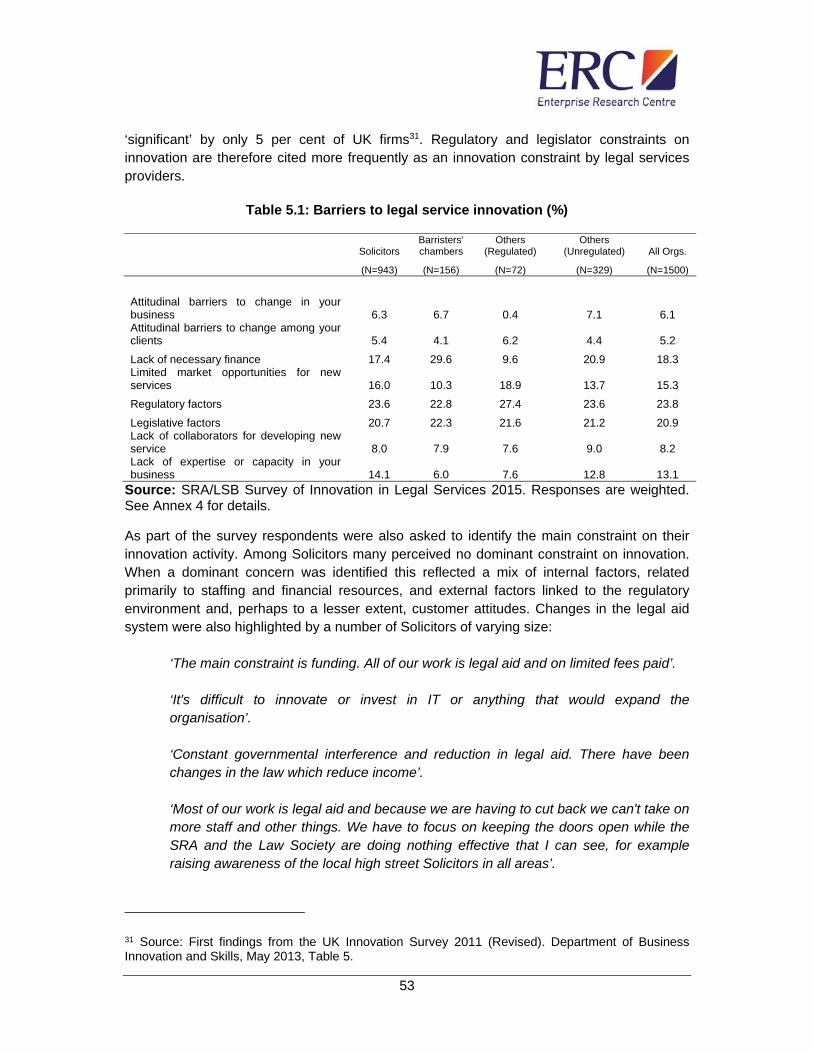
53
‘significant’ by only 5 per cent of UK firms31. Regulatory and legislator constraints on innovation are therefore cited more frequently as an innovation constraint by legal services providers.
Table 5.1: Barriers to legal service innovation (%)
Solicitors Barristers’ chambers
Others (Regulated)
Others (Unregulated) All Orgs.
(N=943) (N=156) (N=72) (N=329) (N=1500)
Attitudinal barriers to change in your business 6.3 6.7 0.4 7.1 6.1 Attitudinal barriers to change among your clients 5.4 4.1 6.2 4.4 5.2
Lack of necessary finance 17.4 29.6 9.6 20.9 18.3 Limited market opportunities for new services 16.0 10.3 18.9 13.7 15.3
Regulatory factors 23.6 22.8 27.4 23.6 23.8
Legislative factors 20.7 22.3 21.6 21.2 20.9 Lack of collaborators for developing new service 8.0 7.9 7.6 9.0 8.2 Lack of expertise or capacity in your business 14.1 6.0 7.6 12.8 13.1
Source: SRA/LSB Survey of Innovation in Legal Services 2015. Responses are weighted. See Annex 4 for details. As part of the survey respondents were also asked to identify the main constraint on their innovation activity. Among Solicitors many perceived no dominant constraint on innovation. When a dominant concern was identified this reflected a mix of internal factors, related primarily to staffing and financial resources, and external factors linked to the regulatory environment and, perhaps to a lesser extent, customer attitudes. Changes in the legal aid system were also highlighted by a number of Solicitors of varying size:
‘The main constraint is funding. All of our work is legal aid and on limited fees paid’. ‘It's difficult to innovate or invest in IT or anything that would expand the organisation’.
‘Constant governmental interference and reduction in legal aid. There have been changes in the law which reduce income’. ‘Most of our work is legal aid and because we are having to cut back we can't take on more staff and other things. We have to focus on keeping the doors open while the SRA and the Law Society are doing nothing effective that I can see, for example raising awareness of the local high street Solicitors in all areas’.
31 Source: First findings from the UK Innovation Survey 2011 (Revised). Department of Business Innovation and Skills, May 2013, Table 5.

54
The uncertainty caused by changes to legal aid as well as the direct impact of the changes also created difficulties for some organisations. One medium-sized Solicitors commented that for them the difficulty for innovation was ‘not knowing what the government will do next with regards to legal aid and the court service’. Internal barriers to innovation focussed largely around the availability of finance for investment and staffing although the ability to attract external finance for innovation may have a disproportionate effect on ABS firms. Two medium-sized Solicitors commented:
‘The main constraint is lack of finance. The banks have no appetite for lending and I think the fee owners are too busy to develop new ideas’. ‘Well it's finance and regulatory factors. It's been tough in the last five years just to survive as a small high street organisation. It's just a good thing that we haven't had to lose staff’.
Two smaller Solicitors commented on their major innovation constraint:
‘Lack of finance and cashflow, which hinders our innovation’.
‘The biggest constraint has been investing. It's been challenging and eye opening in regards to how we can actually move the business forward as it comes with own challenges’.
Staffing and recruitment issues were also highlighted by a number of Solicitors. One medium-sized Solicitor highlighted their dilemma as follows:
‘The main constraint is the volume of work and not enough staff in line with the planned and steady growth of the business. Fundamentally, it's just to make sure we're not running the place like headless monsters! It's about properly managing the growth of the business’. .
And, a smaller Solicitor commented that the main constraint on their innovation was:
‘Recruiting personnel. We have advertised and not many people applied. Without enough staff, it's hard to develop new business’.
For OLSPs both in the regulated and un-regulated sectors the primary innovation constraints were less commonly related to internal resource issues and more frequently to changes or uncertainties in the regulatory environment (Table 5.1). One small OLSP involved in will writing reflected the view of others, cited the main constraint as follows:
‘Well, to be honest it's been certainty as to whether the industry is going to be regulated or not. There was talk that the industry was going to be regulated and we started implementing systems to be ahead of the game, as it were, and then the Lord

55
Chancellor changed his mind and decided it wasn't necessary to be regulated. Not that it was a bad thing, as now we're prepared in case he ever changes his mind again’.
Another medium-sized OLSP in an unregulated activity commented:
‘Regulatory factors have been the biggest issue because we aren't regulated by the SRA so we need to be careful what we do in our practices’.
And, on a similar theme, other medium sized organisations commented that the main constraint on innovation was:
‘Changes in the legal market are the main constraint. The market we work in has changed so significantly, a lot of our changes have been forced. The goal posts keep moving, making it difficult to keep up for a small organisation. We are always retraining’. ‘Fear of knowing what you can and cannot do with the SRA. It's quite simply that. Having the time, while trying to earn money, knowing what you can and cannot do’. ‘Because of regulators. They have been deciding criteria so you have to move with the times and regulators bodies. So it has been a time factor’.
The lack of market opportunities and a satisfaction with the status quo were also more common restraints on innovation among OLSPs. For example, one small organisation commented on the major innovation constraint:
‘There isn't one. We have no desire to rule the world. I like running my own business and my own client base. And we make a good living out of it’.
As with Solicitors, many Barristers’ chambers perceived no dominant constraint on their innovation. Where individual Barristers’ chambers did highlight a main constraint these were diverse, reflecting a range of cultural, sectoral and organisation-specific issues. External factors dominated Chambers’ comments, however. In cultural terms a member of one large Barristers’ Chamber commented that the main innovation constraint was:
‘Basically anything because the legal professional is run by dinosaurs. Solicitors and barristers are still living in the dark ages and anyone who thinks beyond the 21st century is considered a radical. It's the underlying culture of the legal profession, you could say’.
Regulation – and changing regulation – was seen as important by some Barristers’ chambers of varying sizes, e.g.

56
‘Mostly regulatory. It's due to new changes which have been introduced by courts, and in particular something called 'cost budgeting', which has been difficult. It's an issue of red tape’. ‘The biggest change has been the regulator requirements, we've had to stop and think of what we need to do. The regulator doesn't understand the workings of Chambers’. ‘Regulatory requirements, and I suppose the volume of communication and interference by regulators who have never run a set of barrister chambers themselves’.
One smaller Chamber reflected their frustration with the changing budgetary environment, saying that the main innovation constraint was:
‘The Ministry of Justice. The number one constraint is the reduction of legal aid. Number two is the issue of fees to civil cases. Number three is about reducing budgets for police and for the judiciary court services’.
For some chambers these external factors were exacerbated by internal constraints on innovation with chambers emphasising, for example: ‘Finance and resource time are the main constraints’, ‘Partly finding financial resources’ and ‘the barristers themselves. It's hard work getting them to agree to anything’.
5.3 Barriers and enablers: regulation and legislation Changes in regulation can create both opportunities for innovation as well as inhibiting innovation activity. To explore the potential for these positive and negative effects respondents were asked whether a range of specific areas of regulation had had a positive, negative or neutral effect on their ability to develop services or develop new ways of delivering services. Table 5.2 summarises the results for all respondents. In each case, a majority felt that the relevant factor had a neutral effect on new services development. In most cases, respondents viewing the factor as having a positive effect outweighed those seeing it as a negative influence: for example, twice as many organisations saw “Changes in legislation related to the legal services you deliver” as having a positive as having a negative effect on innovation. In only three cases (dealing with client complaints, requirements relating to client confidentiality and data protection and managing clients’ money) were the positive views outweighed by negative views.

57
Table 5.2: Perceived regulatory and legislation effects: All orgs. (N=1500)
Positive Neutral Negative Total
Positive ‐
Negative
Requirements relating to client confidentiality and data protection 11.4 72.8 15.8 100.0 ‐4.4
Dealing with client complaints 11.2 70.4 18.5 100.0 ‐7.3Compliance with money laundering regulations 19.1 63.8 17.1 100.0 2.0Complying with information requests from a regulator 14.9 71.0 14.1 100.0 0.8
Managing client money 9.1 74.9 16.0 100.0 ‐6.9Professional indemnity insurance requirements 26.5 55.8 17.7 100.0 8.8Changes in legislation related to the legal services you deliver 30.0 53.5 16.5 100.0 13.5Changes in legislation related to new structures and/or ownership 16.2 68.1 15.7 100.0 0.6
Keeping up with new regulations 26.2 53.0 20.8 100.0 5.4Source: SRA/LSB Survey of Innovation in Legal Services 2015. Responses are weighted. See Annex 4 for details. The results are broken down by respondent type in Tables 5.3 to 5.6. Solicitors (Table 5.3) broadly follow the overall results, but tend to have somewhat more positive views on regulatory and legislative requirements. This is especially true for changes in legislation relating to legal services, professional indemnity insurance requirements, and the need to keep up with new regulations, all of which have large net positive balances. For Solicitors, taking the results of Tables 5.1 and 5.3 together implies that if they are asked whether regulation and legislation is a barrier to innovation, a minority will say it is: but if they are asked to judge whether individual aspects of regulation or legislation have a positive or negative effect, a somewhat more positive view of regulation generally emerges. This reflects some findings in the research literature which have emphasised the potential for regulation and regulatory change to stimulate rather than hinder innovation activity32.
32 Porter, M E and C Van de Linde. 1995. Toward a New Conception of the Environment-Competitiveness Relationship. Journal of Economic Perspectives, 9(4), 97-118.

58
Table 5.3: Perceived regulatory and legislation effects: Solicitors (N=943)
Positive Neutral Negative Total
Positive ‐
Negative
Requirements relating to client confidentiality and data protection 12.3 74.7 12.9 100.0 ‐0.6
Dealing with client complaints 12.2 70.2 17.6 100.0 ‐5.3Compliance with money laundering regulations 22.1 60.6 17.2 100.0 4.9Complying with information requests from a regulator 17.0 72.0 10.9 100.0 6.1
Managing client money 9.8 74.3 15.9 100.0 ‐6.1Professional indemnity insurance requirements 30.9 55.6 13.5 100.0 17.4Changes in legislation related to the legal services you deliver 32.7 53.7 13.6 100.0 19.1Changes in legislation related to new structures and/or ownership 17.6 66.3 16.1 100.0 1.5
Keeping up with new regulations 29.4 53.2 17.4 100.0 11.9
Source: SRA/LSB Survey of Innovation in Legal Services 2015. Responses are weighted. See Annex 4 for details. However, the generally positive net views on regulation and legislation among Solicitors are not evident in OLSPs and Barristers’ chambers which have only small positive balances (Tables 5.4 and 5.5). For OLSPs in regulated activities, five of the nine categories exhibit net negative scores, especially with regards to handling clients’ money (Table 5.5). For OLSPs in unregulated activities, eight of the nine categories were negative on balance with client confidentiality and client complaints the most common issues (Table 5.6). For Barristers’ chambers six of the nine categories have net negative scores, with professional indemnity insurance requirements being particularly problematic. Overall, this appears to suggest a situation in which Solicitors are markedly less troubled by regulatory and legislative requirements with regard to innovation than are barristers and OLSPs in both regulated and unregulated activities.
5.4 Key Findings The key constraints on innovation in legal services are perceived as being regulatory and legislative issues. These factors were seen as being a significant impediment to innovation to between one fifth and one quarter of respondents. Note that this also implies that around 75-80% of respondents did not consider regulation or legislation to be a major constraint on innovation. The next biggest constraints are perceived to be lack of the necessary finance for innovation, limited market opportunities, and lack of expertise in the business, both mentioned by under a fifth of organisations. Other factors (e.g. attitudinal barriers and lack of collaborators) were generally viewed as being relatively insignificant. Across the legal services sector, nearly twice as many organisations see “Changes in legislation related to the legal services you deliver” as having a positive effect as opposed to

59
a negative effect on innovation. In only three aspects of regulation (dealing with client complaints, client confidentiality and managing clients’ money) was there a perception that the general effect on innovation had been negative. Marked differences exist, however, in the perception of the impacts of regulation by Solicitors on the one hand and Barristers’ chambers and OLSPs on the other. Solicitors generally take a more positive view on the role of regulation and legislation on innovation than both other types of legal service provider. This is especially true for changes in legislation relating to legal services, professional indemnity insurance requirements, and the need to keep up with new regulations. For Barristers’ chambers particular issues seem to exist with the requirements for professional indemnity insurance. For OLSPs in unregulated activities the key issues relate to legislation on client confidentiality and complaints. Table 5.4: Perceived regulatory and legislation effects: Barristers’ chambers (N=156)
Positive Neutral Negative Total
Positive ‐
Negative
Requirements relating to client confidentiality and data protection 12.4 74.9 12.8 100 ‐0.4
Dealing with client complaints 7.8 80.5 11.7 100 ‐3.9Compliance with money laundering regulations 8.3 80.6 11.1 100 ‐2.8Complying with information requests from a regulator 10.6 74.0 15.3 100 ‐4.7
Managing client money 2.4 95.2 2.3 100 0.1Professional indemnity insurance requirements 3.9 68.7 27.4 100 ‐23.5Changes in legislation related to the legal services you deliver 20.6 60.8 18.6 100 2.0Changes in legislation related to new structures and/or ownership 14.6 67.8 17.6 100 ‐3.0
Keeping up with new regulations 21.5 59.3 19.2 100 2.3Source: SRA/LSB Survey of Innovation in Legal Services 2015. Responses are weighted. See Annex 4 for details.

60
Table 5.5: Perceived regulatory and legislation effects: OLSPs (Regulated) (N=72)
Positive Neutral Negative Total
Positive ‐
Negative
Requirements relating to client confidentiality and data protection 15.3 68.5 16.2 100 ‐0.9
Dealing with client complaints 14.5 69.2 16.3 100 ‐1.7Compliance with money laundering regulations 16.4 67.8 15.8 100 0.7Complying with information requests from a regulator 15.1 64.0 20.9 100 ‐5.8
Managing client money 10.2 71.2 18.6 100 ‐8.4Professional indemnity insurance requirements 21.3 60.6 18.2 100 3.1Changes in legislation related to the legal services you deliver 28.8 46.3 24.9 100 3.8Changes in legislation related to new structures and/or ownership 26.0 56.4 17.6 100 8.4
Keeping up with new regulations 27.3 41.8 30.9 100 ‐3.6
Source: SRA/LSB Survey of Innovation in Legal Services 2015. Responses are weighted. See Annex 4 for details. Table 5.6: Perceived regulatory and legislation effects: OLSPs (Unregulated) (N=329)
Positive Neutral Negative Total
Positive ‐
Negative
Requirements relating to client confidentiality and data protection 8.1 68.9 23.0 100 ‐15.0
Dealing with client complaints 8.3 69.6 22.0 100 ‐13.7Compliance with money laundering regulations 13.7 68.4 17.9 100 ‐4.2Complying with information requests from a regulator 10.2 69.5 20.3 100 ‐10.1
Managing client money 7.9 74.5 17.7 100 ‐9.8Professional indemnity insurance requirements 19.8 53.5 26.6 100 ‐6.8Changes in legislation related to the legal services you deliver 24.9 53.6 21.5 100 3.3Changes in legislation related to new structures and/or ownership 10.8 75.3 13.9 100 ‐3.1
Keeping up with new regulations 18.7 54.4 26.9 100 ‐8.2Source: SRA/LSB Survey of Innovation in Legal Services 2015. Responses are weighted. See Annex 4 for details.

61
Section 6: Innovation in Solicitors’ firms of different types
6.1 Introduction In this section we explore in more detail innovation among four specific sub-groups of Solicitors. First, we examine levels of innovation in different employee sizebands of Solicitors, defining the sizebands by the number of employees in each organisation. Second, we examine innovation in those Solicitors’ firms (46.7 per cent of respondent organisations) where female practising Solicitors were in the majority33. Second we examine innovation in Solicitors’ firms in which black and minority ethnic practising Solicitors were in the majority (16.8 per cent of respondent organisations). And finally, we examine levels of innovative activity among those Solicitors’ firms whose primary focus was on commercial rather than individual or domestic work. Among our respondents 13.1 per cent of respondent Solicitor reported that their firm was focussed on commercial activity34. The comparisons made in this section are simple bivariate contrasts between groups and it is important to acknowledge that these may be influenced by other related factors such as firm size.
6.2 Innovation among Solicitors by sizeband The proportion of innovating Solicitors increases sharply as the size of the organisation increases. For example, while around a fifth of Solicitors in the 1-9 employee sizeband reported undertaking service innovation in the last three years this rises to around 50 per cent in Solicitors with more than 50 employees. In terms of the innovation in the way in which services are delivered the differences between the innovating proportions of different sizebands are slightly less marked, a pattern which is also evident in managerial, organisational and marketing innovation (Table 6.1).
33 In the data supplied Solicitors were identified as either male, female or of unknown gender. In what follows Solicitors firms were classified as female majority only where the proportion of Solicitors known to be female was more than 50 per cent of the total number of solicitors in the firm. Similarly, a firm was classified as BAME only when the proportion of Solicitors known to be of BAME background was more than 50 per cent of all those in the firm. Solicitors included in the calculations included practising solicitors, Registered Foreign Lawyers, Registered European Lawyers and partners within each organisation. Around 11.7 per cent of Solicitors were of unknown ethnicity and around 3.3 per cent of unknown gender. 34 We define commercial work to include: Property/Conveyancing – commercial; Commercial/Corporate work for listed companies; Commercial/Corporate work for non-listed companies; Intellectual Property; Planning; Public administrative law; Non-Litigation; Arbitration and alternative dispute resolution; and, Bankruptcy/Insolvency. Non-commercial work includes: Landlord & Tenant; Property/Conveyancing – residential; Criminal; Wills trusts and tax planning; Probate and estate administration; Debt collection; Personal injury; Litigation – other; Discrimination/ Civil liberties/Human rights; Family and Matrimonial; Children; Immigration; Employment; Mental Health; Social Welfare; and Consumer problems.

62
Table 6.1: Proportions of innovators: by sizeband
Employment sizebands
1-9 10-49 50 plus Total
(N=453) (N=348) (N=141) (N=943)
% % % %
Service innovation (%) 22.0 35.1 50.0 25.3
Radical service innovation (%) 5.6 10.2 17.5 6.8
Delivery innovation (%) 23.5 32.2 41.0 25.6
Strategic innovation(%) 14.2 24.6 41.1 17.0
Management innov (%) 15.6 28.7 34.8 18.5
Organisational innov (%) 18.6 35.6 44.3 22.4
Marketing innov (%) 32.3 48.7 71.6 36.6 Source: SRA/LSB Survey of Innovation in Legal Services 2015. Responses are weighted. See Annex 4 for details.
Adopting a value chain perspective and using the same metrics outlined earlier (Section 5) suggests a similar pattern to that evident in Table 6.1 with higher levels of innovation activity among larger Solicitors (Table 6.2). Three interesting exceptions occur. First, we see a lower average R&D intensity among larger Solicitors’ firms than among smaller firms. Secondly, the share of revenue derived from new services is largest in Solicitors with 10-49 employees. Thirdly, spending on reputation and branding is broadly similar across Solicitors of different sizes.
Table 6.2: Benchmarking innovation by sizeband
Employment sizebands
1-9 10-49 50 plus Total
(N=453) (N=348) (N=141) (N=943)
% % % %
Accessing knowledge benchmarks A1. Proportion of externally sourced ideas (%) 4.5 6.1 12.6 5.1 A2. R&D intensity (%) 0.8 0.8 0.3 0.8 A4. Multi-functionality (%) 9.0 19.7 32.6 11.8 A5. External partners in accessing knowledge (%) 9.1 15.5 23.2 10.8 Building innovation benchmarks B2. Percentage of turnover from new products (%) 4.5 7.3 4.5 5.0 B3. Diversity of innovation (%) 20.9 34.0 47.5 24.1 B4. Multi-functionality (%) 8.7 18.8 30.6 11.4 B5. Team-working (%) 5.6 14.1 38.1 8.4 B6. External partners in building innovation (%) 3.9 6.8 13.8 4.8 Commercialising innovation benchmarks
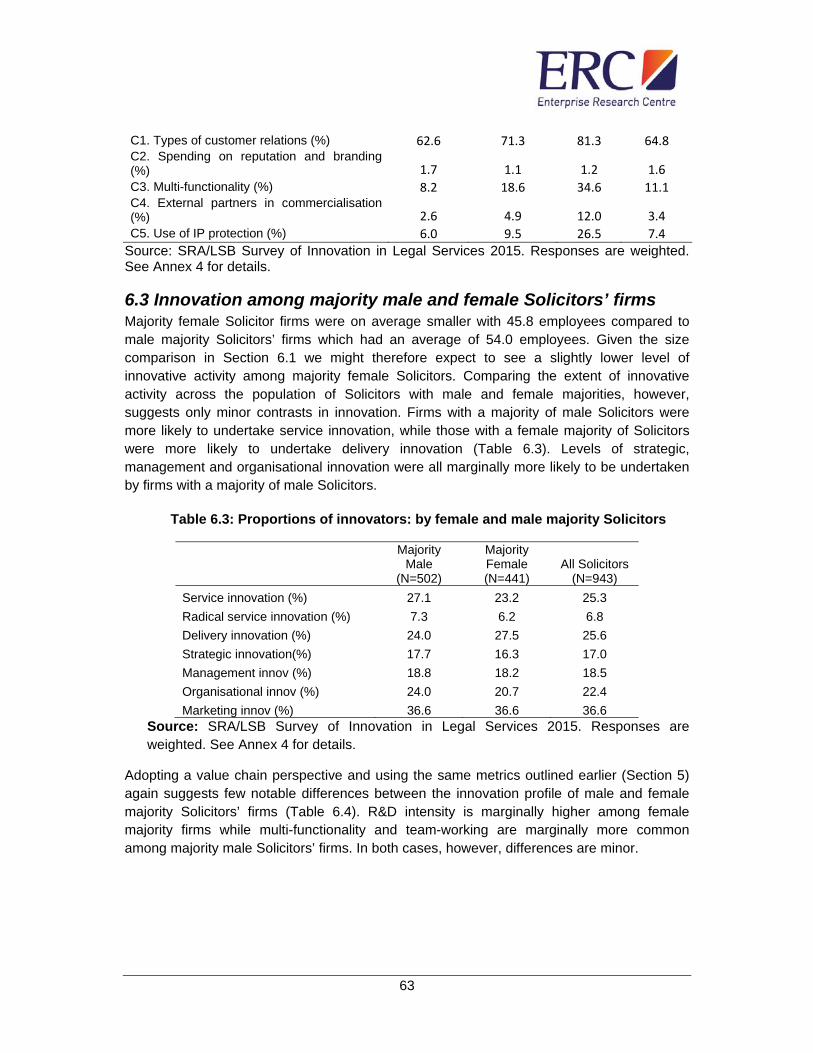
63
C1. Types of customer relations (%) 62.6 71.3 81.3 64.8 C2. Spending on reputation and branding (%) 1.7 1.1 1.2 1.6 C3. Multi-functionality (%) 8.2 18.6 34.6 11.1 C4. External partners in commercialisation (%) 2.6 4.9 12.0 3.4 C5. Use of IP protection (%) 6.0 9.5 26.5 7.4
Source: SRA/LSB Survey of Innovation in Legal Services 2015. Responses are weighted. See Annex 4 for details.
6.3 Innovation among majority male and female Solicitors’ firms Majority female Solicitor firms were on average smaller with 45.8 employees compared to male majority Solicitors’ firms which had an average of 54.0 employees. Given the size comparison in Section 6.1 we might therefore expect to see a slightly lower level of innovative activity among majority female Solicitors. Comparing the extent of innovative activity across the population of Solicitors with male and female majorities, however, suggests only minor contrasts in innovation. Firms with a majority of male Solicitors were more likely to undertake service innovation, while those with a female majority of Solicitors were more likely to undertake delivery innovation (Table 6.3). Levels of strategic, management and organisational innovation were all marginally more likely to be undertaken by firms with a majority of male Solicitors.
Table 6.3: Proportions of innovators: by female and male majority Solicitors
Majority Male
(N=502)
Majority Female (N=441)
All Solicitors (N=943)
Service innovation (%) 27.1 23.2 25.3
Radical service innovation (%) 7.3 6.2 6.8
Delivery innovation (%) 24.0 27.5 25.6
Strategic innovation(%) 17.7 16.3 17.0
Management innov (%) 18.8 18.2 18.5
Organisational innov (%) 24.0 20.7 22.4
Marketing innov (%) 36.6 36.6 36.6 Source: SRA/LSB Survey of Innovation in Legal Services 2015. Responses are weighted. See Annex 4 for details.
Adopting a value chain perspective and using the same metrics outlined earlier (Section 5) again suggests few notable differences between the innovation profile of male and female majority Solicitors’ firms (Table 6.4). R&D intensity is marginally higher among female majority firms while multi-functionality and team-working are marginally more common among majority male Solicitors’ firms. In both cases, however, differences are minor.
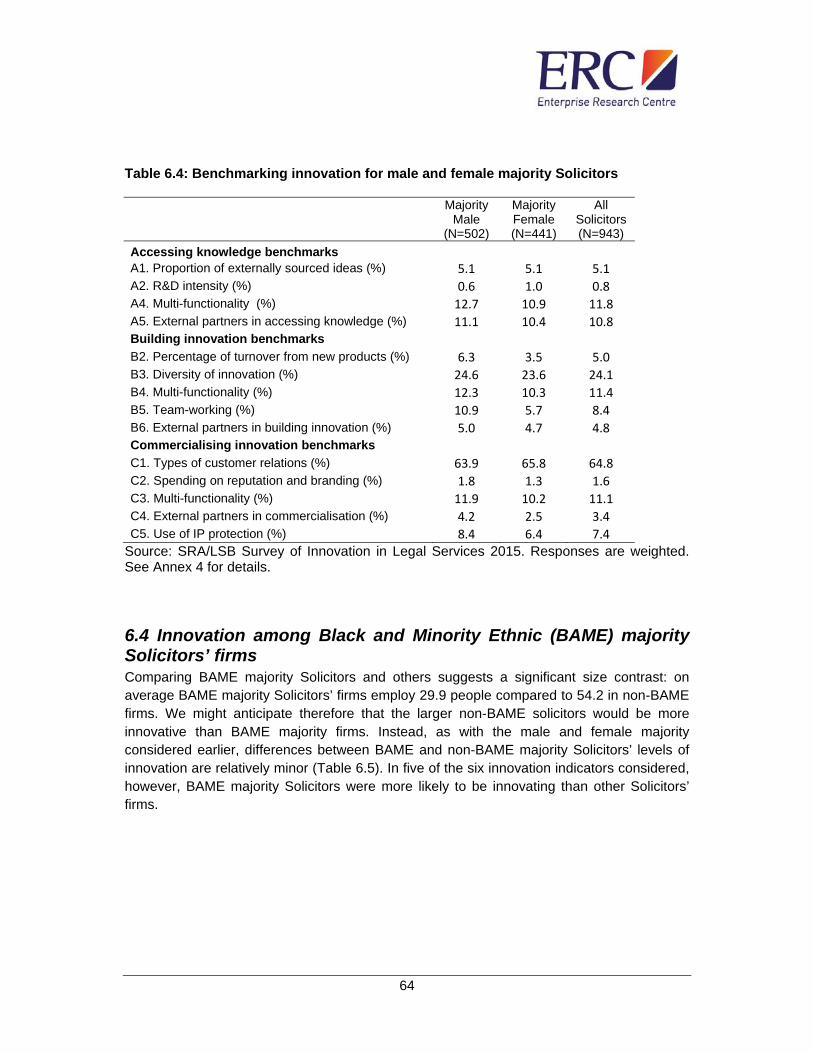
64
Table 6.4: Benchmarking innovation for male and female majority Solicitors
Majority Male
(N=502)
Majority Female (N=441)
All Solicitors (N=943)
Accessing knowledge benchmarks
A1. Proportion of externally sourced ideas (%) 5.1 5.1 5.1 A2. R&D intensity (%) 0.6 1.0 0.8 A4. Multi-functionality (%) 12.7 10.9 11.8 A5. External partners in accessing knowledge (%) 11.1 10.4 10.8 Building innovation benchmarks B2. Percentage of turnover from new products (%) 6.3 3.5 5.0 B3. Diversity of innovation (%) 24.6 23.6 24.1 B4. Multi-functionality (%) 12.3 10.3 11.4 B5. Team-working (%) 10.9 5.7 8.4 B6. External partners in building innovation (%) 5.0 4.7 4.8 Commercialising innovation benchmarks C1. Types of customer relations (%) 63.9 65.8 64.8 C2. Spending on reputation and branding (%) 1.8 1.3 1.6 C3. Multi-functionality (%) 11.9 10.2 11.1 C4. External partners in commercialisation (%) 4.2 2.5 3.4 C5. Use of IP protection (%) 8.4 6.4 7.4
Source: SRA/LSB Survey of Innovation in Legal Services 2015. Responses are weighted. See Annex 4 for details.
6.4 Innovation among Black and Minority Ethnic (BAME) majority Solicitors’ firms Comparing BAME majority Solicitors and others suggests a significant size contrast: on average BAME majority Solicitors’ firms employ 29.9 people compared to 54.2 in non-BAME firms. We might anticipate therefore that the larger non-BAME solicitors would be more innovative than BAME majority firms. Instead, as with the male and female majority considered earlier, differences between BAME and non-BAME majority Solicitors’ levels of innovation are relatively minor (Table 6.5). In five of the six innovation indicators considered, however, BAME majority Solicitors were more likely to be innovating than other Solicitors’ firms.

65
Table 6.5: Proportions of innovators: by majority BAME Solicitors
Majority
Non-BAME
(N=785)
Majority BAME
(N=158)
All Solicitors
(N=943)
Service innovation (%) 24.6 28.1 25.3
Radical service innovation (%) 6.1 9.5 6.8
Delivery innovation (%) 24.7 29.0 25.6
Strategic innovation(%) 16.3 19.8 17.0
Management innov (%) 15.9 28.5 18.5
Organisational innov (%) 23.5 18.5 22.4
Marketing innov (%) 36.3 37.9 36.6 Source: SRA/LSB Survey of Innovation in Legal Services 2015. Responses are weighted. See Annex 4 for details.
The same general pattern – marginally higher levels of innovative activity – are also evident for BAME majority firms when we consider the value chain metrics (Table 6.6). This is reflected both in investment indicators (such as R&D intensity) and in a range of the organisational metrics relating to team-working and the engagement of multiple occupational groups in innovation activity (multi-functionality).
Table 6.6: Benchmarking innovation by majority BAME Solicitors
Majority Non‐BAME (N=785)
Majority BAME (N=158)
All Solicitors
(N=943)
Accessing knowledge benchmarks
A1. Proportion of externally sourced ideas (%) 4.9 5.6 5.1 A2. R&D intensity (%) 0.7 1.3 0.8 A4. Multi-functionality (%) 11.8 12.1 11.8 A5. External partners in accessing knowledge (%) 11.2 9.1 10.8 Building innovation benchmarks B2. Percentage of turnover from new products (%) 3.9 8.7 5.0 B3. Diversity of innovation (%) 23.4 26.8 24.1 B4. Multi-functionality (%) 11.0 12.6 11.4 B5. Team-working (%) 7.9 10.7 8.4 B6. External partners in building innovation (%) 4.8 4.9 4.8 Commercialising innovation benchmarks C1. Types of customer relations (%) 64.1 67.4 64.8 C2. Spending on reputation and branding (%) 1.3 2.7 1.6 C3. Multi-functionality (%) 10.9 11.7 11.1 C4. External partners in commercialisation (%) 3.4 3.4 3.4 C5. Use of IP protection (%) 7.6 6.9 7.4

66
Source: SRA/LSB Survey of Innovation in Legal Services 2015. Responses are weighted. See Annex 4 for details.
6.5 Innovation among commercial and non-commercial Solicitors Comparing principally commercial and non-commercial Solicitors suggests that innovation in services and delivery is more common among commercial Solicitors. This is consistent with what we might expect given the relative average size of the two groups of firms – on average commercial Solicitors’ firms employ 102.3 people compared to 42.0 in non-commercial Solicitors’ firms. The higher level of innovative activity among commercial solicitors extends into most areas of managerial innovation with the exception being higher levels of organisational innovation among non-commercial Solicitors (Table 6.7). In the main, however, as with the gender and ethnicity contrasts highlighted earlier the differences between levels of innovation among commercial and non-commercial Solicitors are relatively small.
Table 6.7: Proportions of innovators: by commercial or non-commercial activity
Non‐Commercial(N=819)
Commercial (N=124)
All Solicitors
(N=943)
Service innovation (%) 24.6 28.1 25.3
Radical service innovation (%) 6.1 9.5 6.8
Delivery innovation (%) 24.7 29.0 25.6
Strategic innovation(%) 16.3 19.8 17.0
Management innov (%) 15.9 28.5 18.5
Organisational innov (%) 23.5 18.5 22.4
Marketing innov (%) 36.3 37.9 36.6 Source: SRA/LSB Survey of Innovation in Legal Services 2015. Responses are weighted. See Annex 4 for details.
Comparing the innovation value chain benchmarks for Solicitors undertaking commercial and non-commercial activity suggests rather a contrasting impression. Here, these intermediate metrics are generally higher for non-commercial Solicitors (Table 6.8). Interestingly, however, the use of IP protection (which includes non-disclosure agreements) is nearly twice as common among Solicitors undertaking commercially oriented work (Table 6.6). This perhaps reflects differences in the drivers of innovation in commercial and non-commercial Solicitors: innovation among commercial lawyers seems less strongly driven by regulatory or strategic factors than among non-commercial Solicitors but more strongly dependent on the recruitment of new staff.

67
Table 6.8: Benchmarking innovation by commercial or non-commercial activity
Non‐Commercial(N=819)
Commercial (N=124)
All Solicitors (N=943)
Accessing knowledge benchmarks
A1. Proportion of externally sourced ideas (%) 5.2 4.6 5.1 A2. R&D intensity (%) 0.8 0.6 0.8 A4. Multi-functionality (%) 12.0 10.8 11.8 A5. External partners in accessing knowledge (%) 10.7 11.3 10.8 Building innovation benchmarks B2. Percentage of turnover from new products (%) 5.1 4.0 5.0 B3. Diversity of innovation (%) 24.3 23.0 24.1 B4. Multi-functionality (%) 11.4 10.9 11.4 B5. Team-working (%) 8.2 10.4 8.4 B6. External partners in building innovation (%) 5.0 3.6 4.8 Commercialising innovation benchmarks C1. Types of customer relations (%) 64.9 64.4 64.8 C2. Spending on reputation and branding (%) 1.7 0.9 1.6 C3. Multi-functionality (%) 11.0 11.5 11.1 C4. External partners in commercialisation (%) 3.7 1.3 3.4 C5. Use of IP protection (%) 6.7 12.4 7.4
6.6 Key Findings Innovation activity varies across Solicitors’ firms of different sizes, with larger organisations more likely to undertake innovation both in services and delivery. Despite some significant size differences, contrasts in levels of innovation activity between male and female majority Solicitors, BAME majority Solicitors and those undertaking commercial activity are relatively minor. Organisations with a majority of male Solicitors were marginally more likely to undertake service innovation, while organisations with a female majority of Solicitors were more likely to undertake delivery innovation. BAME majority Solicitors’ firms were marginally more likely to undertake service, delivery and managerial innovation. Similarly, Solicitors undertaking commercial – business facing – work were also marginally more likely to be innovating.

68
Section 7: The impact of ABS – an initial assessment
7.1 Introduction In this section we provide an initial assessment of the impact on innovation of the adoption of Alternative Business Structures or ABS. ABS were introduced in the Legal Services Act 2007 and allow non-lawyers to own and invest in Solicitors’ firms. The Law Society identifies the potential benefits of the ABS structure a number of which relate to service innovation35:
Equity can be raised from a broader base of potential partners, members or directors; Non-solicitor employees may be rewarded by partner, member or director status, with
a direct stake in the organisation; The ability to diversify the range of legal services provided by the practice; Equity can be raised from outside the legal sector without the need for non-lawyer
involvement at the management level.
To date almost 400 organisations have adopted ABS status. Of the 943 Solicitors which responded to the company survey, 93 (9.8 per cent) have implemented ABS. These firms are a mix of new businesses and existing firms which have implemented ABS since the start of January 2012.
7.2 Comparative analysis Comparing the proportion of innovators among ABS and non-ABS Solicitors suggests some significant distinctions with ABS Solicitors significantly more likely to undertake each type of innovation. Notably, while 24.2 per cent of non-ABS Solicitors had introduced new legal services in the last three years this was true of 36.2 per cent of ABS organisations. A similar picture emerges across delivery and each dimension of managerial innovation (Table 7.1). Interestingly, however, while differences in the proportion of delivery innovators is only marginally higher in the ABS group, organisational innovation – perhaps reflecting the adoption of ABS itself – was nearly twice as common among ABS organisations.
35 Law Society (2013) ‘Alternative Business Structures’, Practice Note. Available at: http://www.lawsociety.org.uk/support-services/advice/practice-notes/alternative-business-structures/

69
Table 7.1: Proportions of innovators: by ABS status
Non‐ ABS (N=850) ABS (N=93)
All Solicitors (N=943)
Service innovation (%) 24.2 36.2 25.3 Radical service innovation (%) 6.2 13.0 6.8
Delivery innovation (%) 25.3 29.5 25.6
Strategic innovation(%) 15.9 28.6 17.0
Management innov (%) 18.4 20.1 18.5
Organisational innov (%) 20.6 40.6 22.4
Marketing innov (%) 34.5 57.8 36.6 Source: SRA/LSB Survey of Innovation in Legal Services 2015. Responses are weighted. See Annex 4 for details.
Turning to the innovation value chain benchmarks, we see confirmatory evidence of higher levels of investment, staff engagement and external involvement in innovation in ABS organisations. In the first stage of the value chain, for example, we find ABS organisations more open to new ideas than non-ABS organisations and having higher levels of R&D investment (Table 7.2). ABS organisations are also generating a higher proportion of turnover from new services than non-ABS organisations and are innovating across more aspects of their activities than non-ABS organisations. Finally, ABS organisations are on average spending more than twice as much of their turnover on reputation and branding (3.1 per cent) than non-ABS organisations (1.4 per cent) and are nearly three times as likely to be using some form of intellectual property protection.
Table 7.2: Benchmarking innovation by ABS status
Non‐ ABS (N=850) ABS (N=93)
All Solicitors (N=943)
Accessing knowledge benchmarks
A1. Proportion of externally sourced ideas (%) 4.7 8.9 5.1 A2. R&D intensity (%) 0.7 1.3 0.8 A4. Multi-functionality (%) 11.4 16.5 11.8 A5. External partners in accessing knowledge (%) 10.3 15.7 10.8 Building innovation benchmarks B2. Percentage of turnover from new products (%) 4.8 6.5 5.0 B3. Diversity of innovation (%) 23.0 35.0 24.1 B4. Multi-functionality (%) 11.1 14.1 11.4 B5. Team-working (%) 8.3 10.1 8.4 B6. External partners in building innovation (%) 4.6 7.4 4.8 Commercialising innovation benchmarks C1. Types of customer relations (%) 63.7 76.3 64.8 C2. Spending on reputation and branding (%) 1.4 3.1 1.6 C3. Multi-functionality (%) 10.5 17.1 11.1

70
C4. External partners in commercialisation (%) 3.1 5.9 3.4 C5. Use of IP protection (%) 6.4 18.4 7.4
These bivariate comparisons strongly suggest that ABS organisations are more innovation active than existing Solicitors and that they are more likely to be introducing new services and new delivery mechanisms. This is likely to benefit service users. The bivariate comparisons, however, may also reflect structural differences between ABS organisations and other Solicitors and so in the next section we report an initial multivariate assessment of the impact of ABS.
7.3 Econometric assessment An idealised assessment of the impact of ABS status would involve comparing the operation of similar organisations adopting and not adopting ABS status. This is not what we observe of course, with organisations self-selecting into ABS status or adopting ABS status at start-up. Those organisations selecting ABS status may have very different characteristics to the non-ABS Solicitors, and it may be these differences in characteristics rather than the ABS status of the organisations which are driving differences in innovation behaviour between the ABS and non-ABS groups. It is possible, however, to use multivariate econometric analysis to filter out or control for differences in characteristics between the ABS and non-ABS groups and so identify a purer estimate of the ABS effect. This type of approach is typically used to calibrate the impact of public policy initiatives on groups of recipient and non-recipient organisations. In technical terms we treat ABS status here as a ‘treatment’, i.e. something which is common to the ABS organisations but from which non-ABS organisations are excluded. This allows us to control both for other influences on innovation aside from ABS status and also for the potential for ABS status to be selected by specific groups of Solicitors which share certain characteristics (a ‘selection’ effect). The key here is whether having allowed for this selection effect, and the effect of other influences on innovation, ABS status still has a positive and significant innovation effect. This is reflected in the significance of a measure called the average treatment effect. We are interested here in two rather specific questions. First, has the adoption of ABS status increased the probability that Solicitors innovate in terms of delivering new services or delivery mechanisms. These measures provide an indication of the potential benefits to services users. And, secondly, we are interested in whether adopting ABS status increases Solicitors’ revenues from innovation (indicator B2 in Table 7.2). This indicator is strongly linked to turnover and profitability growth and therefore provides an indication of the value of ABS status to Solicitors themselves. Details of our analysis are included in Annex 7 and we include only a summary of the key results here. To ensure the robustness of our results we report two estimates based on different analytical approaches which do provide confirmatory results. These are summarised in Table 7.3 where positive numbers indicate that ABS status is having a

71
positive effect on innovation and one or more asterisks indicate a statistically significant relationship. More specifically, we see that ABS status raises the probability that a solicitor will undertake service innovation by 12.9-14.8 percentage points (pp), strategic innovation by 14.2-14.9 pp and organisational innovation by 24.1-24.6 pp. The implication is that the wider adoption of ABS status would be likely to increase the range of legal services on offer. We find a positive but statistically insignificant impact from ABS status on Solicitors’ revenue from innovative products.
Table 7.3: Proportions of innovators: by ABS status
Approach 1 (AIPW)
Approach 2 (IPWRA)
A. Probability of innovating
Service innovation (%) 0.148** 0.129**
Delivery innovation (%) 0.058 0.055
Strategic innovation(%) 0.142* 0.149**
Management innov (%) 0.033 0.026
Organisational innov (%) 0.241*** 0.246***
Marketing innov (%) 0.047 0.054
B. Revenue from innovative services (%) 0.105 0.107
Source: SRA/LSB Survey of Innovation in Legal Services 2015. Responses are weighted. See Annex 4 for details.
7.4 Key findings The introduction of ABS status was intended to promote innovation and diversity in the provision of legal services. While the existence of ABS is a recent phenomenon. our analysis which includes data from around a third of Solicitors with ABS status suggests this ambition has been realised36. In particular we find ABS Solicitors have higher levels of innovative activity of all types than other Solicitors. This is consistent with ABS Solicitors’ higher level of investment, staff engagement and external involvement in innovation. Our econometric analysis suggests that ABS Solicitors are 12.9-14.8 percentage points more likely to introduce new legal services, with potential benefits for service users. They are also more likely to engage in strategic and organisational innovation.
36 Innovation in the sector may be further enhanced in the longer term as ABS firms increase the level of competition in legal services.
72
Section 8: Final Remarks
8.1 Innovation in legal services Until now relatively little has been known about innovation in and across the legal services sector. Here we report evidence from the first large scale survey of legal services innovation covering 1500 organisations supported by evidence from in-depth discussions with twenty organisations. What we find is that while around 80 per cent of organisations across the sector feel that they have a culture and leadership which is open to new ideas only around 40 per cent of organisations have put in place organisational procedures to support innovation. This translates into around a quarter of organisations which have introduced new or improved services over the last three years. A quarter of legal services organisations also report having changed or significantly altered the way they deliver services over the last three years. Given these proportions it is perhaps unsurprising that for the majority of legal services organisations innovative services remain of limited importance in terms of revenue. Specifically, across the sector as a whole, new or improved services account for around 6 per cent of turnover. Innovation in legal services has a rather specific character, influenced inevitably by regulation and legislation. In particular:
Innovation is used to extend service range, improve service quality, and attract new clients: innovation is not typically used to lower costs.
Innovation in legal services is rather ‘closed’. Ideas for new innovative services
rarely come from outside the organisations concerned, and we do not see in legal services the extensive networking with external knowledge sources which characterises innovation in some other business and professional services.
Innovation is more often than not incremental in nature with very few providers
consider themselves to be radical innovators.
Social media and the development of on-line activity has been a significant driver or enabler of innovation activity in the sector and its uses for commercial purposes is now fairly widespread.
Overall, the impression is of a profession in which ideas for new services and new ways of working are internally generated and rarely radical in nature. Our evidence also suggests, perhaps surprisingly given the legislative changes that have occurred, that the profile of innovation in the sector has changed relatively little since 2009. Across 14 different indicators reflecting the way in which legal services businesses access
73
knowledge for innovation, translate that knowledge into new innovations and then commercialise that knowledge, patterns remain very similar. The approach to, and process of, innovation generally shows similarities between Solicitors and OLSPs, with Barristers’ chambers often displaying different attitudes and ways of working.
8.2 Attitudes towards regulation and legislation Previous research suggests that regulation and legislation can have either a positive or negative effect on innovation. On one hand, excessive bureaucratic regulation can stultify new ideas and prevent their commercialisation; on the other hand, organisations may develop new products or ways of working to cope with the demands of regulation (an example is in the green energy area). While regulatory and legislative issues are perceived as the most common constraints on innovation in legal services, the fact remains that that around 75-80% of respondents did not consider regulation or legislation to be a major constraint on innovation. Perhaps more interesting are differences in the perception of regulation among Solicitors and the other providers of legal services. Solicitors generally take a more positive view on the role of regulation and legislation in innovation than OLSPs. This is especially true for changes in legislation relating to legal services, professional indemnity insurance requirements, and the need to keep up with new regulations. The same is not true for Barristers and OLSPs, both of whom have a more negative view of regulation and legislation on their capacity to innovate. Our analysis of the impact of ABS also provides striking evidence of the potential for regulatory changes to impact on innovation with potential user benefits. Specifically, Solicitors with ABS status have higher levels of innovative activity of all types than other Solicitors. Our econometric analysis suggests that ABS Solicitors are 12.9-14.8 percentage points more likely to introduce new legal services. They are also more likely to engage in strategic and organisational innovation.