Innovation in Green Energy Technologies and the · PDF fileInnovation in Green Energy...
31
AUTHOR Jürgen Kruse EWI Working Paper, No 16/02 February 2016 Institute of Energy Economics at the University of Cologne (EWI) www.ewi.uni-koeln.de Innovation in Green Energy Technologies and the Economic Performance of Firms
Transcript of Innovation in Green Energy Technologies and the · PDF fileInnovation in Green Energy...

AUTHORJürgen Kruse
EWI Working Paper, No 16/02 February 2016 Institute of Energy Economics at the University of Cologne (EWI) www.ewi.uni-koeln.de
InnovationinGreenEnergyTechnologiesandtheEconomicPerformanceofFirms

CORRESPONDINGAUTHORJürgen Kruse Department of Economics, University of Cologne, and EWI Tel: +49 (0)221 277 29-323 Fax: +49 (0)221 277 29-100 [email protected]
ISSN: 1862-3808 The responsibility for working papers lies solely with the authors. Any views expressed are those of the authors and do not necessarily represent those of the EWI.
Institute of Energy Economics at the University of Cologne (EWI) Alte Wagenfabrik Vogelsanger Straße 321a 50827 Köln Germany Tel.: +49 (0)221 277 29-100 Fax: +49 (0)221 277 29-400 www.ewi.uni-koeln.de
Innovation in Green Energy Technologies and the Economic
Performance of Firms
Jurgen Kruse⇤†
February 2016
In this article, I empirically analyze and compare the impact of innovation
in green and non-green energy technologies on the economic performance of
firms. My analysis is conducted on a panel of 8,619 patenting firms includ-
ing 968 green energy patenters from 22 European countries over the period
2003 to 2010. I measure economic firm performance in terms of productivity
and use a panel data model based on an extended Cobb-Douglas production
function. My results show that green energy innovation has a statistically
significant negative impact on economic firm performance. In contrast, non-
green energy innovation is shown to have a statistically significant positive
impact on economic firm performance. These findings suggest that private
economic returns in terms of productivity are lower for green energy than for
non-green energy innovation.
Key words: green energy technologies, innovation, performance, patents,
technological change
JEL codes: C33, L25, O31, Q40, Q55
⇤ The author is grateful for helpful comments from Benjamin Tischler, Jan Tscheke, and Heike Wetzel.Anne Mensen and Leonie Hass provided excellent research assistance.
† Department of Economics, University of Cologne and Institute of Energy Economics at the Universityof Cologne, email: [email protected].
1

1 Introduction
Recent empirical economic literature has focused to a great extent on the determinants
and inducement mechanisms of innovation in green energy (GE) (or environmental,
or eco-) technologies. A large number of contributions provides a robust understand-
ing of factors determining and policies inducing GE innovation (see, for example, Ja↵e
and Palmer, 1997; Popp, 2002; Johnstone et al., 2010; Verdolini and Galeotti, 2011).
However, little attention has been devoted to the economic e↵ects of GE innovation,
especially to the relationship between innovating in GE technologies and the economic
performance of the innovating firms. Understanding this relationship helps to answer
the widely debated question whether firms gain (forgo) economic opportunities by inno-
vating (not innovating) in GE technologies.
This article empirically investigates the impact of innovation in GE technologies on the
economic performance of firms. In addition, the impact of GE innovation is compared
to the one of non-GE innovation. I analyze a panel of 8,619 patenting firms from
22 European countries over a period of 8 years from 2003 to 2010. Economic firm
performance is measured in terms of productivity. Using productivity as performance
indicator has several advantages. First, results from production function approaches are
easily interpretable and comparable to other studies (Bloom and Van Reenen, 2002).
Second, firm performance is mainly driven by productivity trends which are closely
linked to innovation dynamics (Cainelli et al., 2011). Furthermore, compared to data on
market valuation, data on productivity is available for a large number of firms including
medium- and small-sized ones. I specify a panel data model based on an extended Cobb-
Douglas production function in which productivity is a function of capital, labor, and
innovation output. Firm accounts data is taken from the AMADEUS database provided
by Bureau van Dijk (BvD). Innovation at the firm level is measured using patent data
from the Organisation for Economic Co-operation and Development (OECD) REGPAT
database.
My work is related to two strands of empirical literature on innovation and economic
firm performance. The link between innovation and economic performance at the firm
level has been analyzed in a large number of empirical economic articles (see, for example,
Scherer, 1965; Comanor and Scherer, 1969; Griliches, 1981; Griliches et al., 1991; Blundell
et al., 1999; Ernst, 2001; Bloom and Van Reenen, 2002; Lanjouw and Schankerman, 2004;
Hall et al., 2005). The majority of these investigations identifies a positive relationship
between innovative output and economic performance. However, since these studies
2

focus on general innovation, the results cannot be simply transferred to GE innovation.
There are fewer articles exploring the relationship between GE (or environmental or eco)
innovation and economic firm performance. Ayari et al. (2012) investigate the impact
of renewable energy innovation (patents) on firm performance (return on assets, stock
market return) using a panel of 154 firms from 14 European countries (1987-2007). They
find evidence that renewable energy innovation has a significant positive impact on both
measures of firm performance. Marin (2014) analyzes the e↵ect of environmental and
non-environmental innovation (patents) on firm performance (value added) for a panel
of 5,905 Italian firms (2000-2007). He shows that environmental innovation in most
cases has no significant e↵ect on firm performance, while non-environmental innovation
has a positive e↵ect. In a very similar study Marin and Lotti (2016) analyze the same
relationship using a larger and longer panel of 11,938 Italian firms (1996-2006). They
find positive impacts of both environmental and non-environmental patenting, while
observing a substantially lower return for environmental ones. Worter et al. (2015)
examine the link between environmental innovation (patents) and performance (value
added) on the industry-level. Their analysis is conducted on a panel of 22 manufacturing
industries from 12 OECD countries (1980-2009). In contrast to Ayari et al. (2012)
and Marin and Lotti (2016), they find that green innovation is negatively related to
performance for most industries. Overall, the empirical evidence concentrating on GE
innovation can thus be described as ambiguous.
This study contributes to the existing literature in three respects. First, I provide new
evidence on the unsolved question how innovation in GE technologies impacts firms’ eco-
nomic performance. Second, the impact of GE and non-GE innovation on performance
is compared. Moreover, as robustness check I distinguish two subgroups of GE technolo-
gies: (a) Renewable Energy Sources (RES) and (b) Energy E�ciency (EE) technologies.
Third, I base my analysis on a comparatively large panel of 8,619 European patenting
firms including 968 GE patenters from 22 countries over an estimation period of 8 years
(2003-2010) and a patent count period of 32 years (1977-2010).
The remainder of the article is structured as follows. Section 2 outlines the theoretical
background my analysis is based on. Section 3 presents and discusses the data. Sec-
tion 4 describes the empirical strategy employed. Section 5 discusses the results of the
econometric estimations and of the robustness tests. Finally, Section 6 summarizes the
main findings and concludes.
3
2 Theoretical Background
Innovative activity in market economies to large parts exists because private profit-
maximizing firms allocate resources to the research and development (R&D) of new
products and processes, for which they see innovation opportunities and market success
and consequently expect a positive impact on future economic performance, that is
positive private returns (Dosi, 1988). The resulting innovation output of private firms is
widely believed to be an important source of economic wealth and growth in economies
(see, for example, Romer, 1986, 1990). In addition, innovation in the subgroup of GE
technologies is acknowledged to be a crucial factor for handling climate change while
maintaining reasonable economic growth (so called green growth) (see, for example,
Ja↵e et al., 2002; Popp et al., 2010; Acemoglu et al., 2012).
Private profit-maximizing firms decide about R&D investments solely on the basis of
private returns. Therefore, a firm deciding about two R&D investment projects, one a
GE option and one a non-GE option, would always choose the option with the higher
private return, even though the GE option might have higher social returns (the sum of
both private and non-private returns). Higher social returns for a GE compared to a non-
GE option can result from higher non-private economic returns due to positive innovation
spillovers and the internalization of negative environmental externalities (Dechezlepretre
et al., 2014). As a consequence, private R&D investments in GE technologies depend
on the private return of these investments compared to the private return of non-GE
investments.
In economic theory, arguments can be found in favor and against higher private re-
turns of GE compared to non-GE innovation. Higher returns may be expected because:
(a) GE technologies are newer and less explored than other technology fields. Therefore,
research in GE technologies builds on a lower knowledge stock than research in more
mature technologies. This could imply greater development perspectives and opportu-
nities for high marginal private returns (Popp and Newell, 2012). (b) GE technologies
bear the potential of having an impact on many sectors and becoming general purpose
technologies. General purpose technologies are expected to generate large economic
gains (Helpman, 1998). (c) Markets are increasingly shaped by strict environmental
regulations. This induces a larger demand for GE technologies and hence increases the
probability of higher private returns from GE innovation (Colombelli et al., 2015).
Contrariwise, lower returns could arise because: (a) GE technologies aim at internal-
izing negative environmental externalities resulting from energy production and use. As
4
far as policies have not completely internalized these externalities, the benefits from GE
compared to non-GE innovation are public rather than private. Accordingly, the will-
ingness to pay and, in turn, the demand for GE technologies will be low. Consequently,
the demand will be highly dependent on political developments which are unstable and
can change unexpectedly. These circumstances lead to uncertain private returns from
GE innovation (Beise and Rennings, 2005). (b) GE technologies often are new to a
firm and lie outside their traditional technological scope. In addition, adjustments of
business processes, working routines, employment, and organizational structures may
be necessary. This could lead to large adjustment costs (Noci and Verganti, 1999). (c)
Financial markets are usually imperfect with regard to technological innovation. These
market imperfections are even more pronounced for GE innovation due to the higher
technical risk and uncertainty about market developments. This may imply high costs
of capital (Worter et al., 2015).
Thus, I derive two rival hypotheses: H1: Private economic returns measured in terms
of productivity are higher for GE than for non-GE innovation, and H2: Private economic
returns measured in terms of productivity are lower for GE than for non-GE innovation.
This work aims to find out which of these hypotheses is right.
3 Data
3.1 Data Sources
To analyze the impact of GE innovation on the economic performance of firms, I combine
two di↵erent databases and construct a unique firm-level data set that matches patent
applicants at the European Patent O�ce (EPO) to firm accounts.
The first performance-related database is BvD’s AMADEUS which contains annual
financial data taken from the registries of approximately 19 million firms from 44Western
and Eastern European countries (Bureau van Dijk, 2015). It covers all sectors with
exception of the financial one and contains up to ten recent years of information per
firm. The database includes firm-level financial information in a standardized format
for 26 balance sheet items, 26 profit and loss items and 26 financial ratios.1 First, I use
information on sales as a measure of economic performance respectively productivity.
Second, I collect information on the number of employees as a measure of labor input
and information on total assets as a measure of capital input. A GDP deflator from
the World Bank’s World Development Indicators (The World Bank, 2015) is used to
1 The coverage of the items varies across countries and time.
5

deflate all nominal values. To avoid double-counting firms and subsidiaries, I consider
only firms that report unconsolidated statements.
In order to measure innovation activities at the firm level, I extend the financial data
with patent data from the OECD REGPAT database (OECD, 2015).2 The REGPAT
database covers patent applications filed at the EPO from 1977 to 2011, derived from the
EPO’s Worldwide Patent Statistical Database (PATSTAT, Autumn 2014). To avoid a
truncation downward bias towards the end of the sample period, I consider only patents
filed until 2010. Using EPO patent applications ensures that applications for low-value
inventions are excluded from the analysis. Application costs for multinational EPO
patent applications are generally higher than for applications filed at national institu-
tions. Accordingly, patent applications filed at the EPO often constitute innovations of
high value that are expected to be commercially profitable and thus justify the relatively
high application fees (Johnstone et al., 2010).
The financial data is combined with the EPO patent information using the OECD
Harmonised Applicants’ Names (HAN) database (OECD, 2014). This database pro-
vides a grouping of patent applicants’ names constructed by harmonising names and
matching them against company names from business register data. The business regis-
ter data stems from the ORBIS database from BvD. Since AMADEUS is a component
of the ORBIS database, the HAN database allows me to match EPO patent informa-
tion to AMADEUS company names. The intersection of the AMADEUS and REGPAT
databases then results in a panel of 11,001 firms from 27 countries3 over a period of 34
years (1977 to 2010) who applied for at least one patent at the EPO during this period.
I count GE and non-GE (all patents except GE ones) patent applications filed by
these firms at the EPO over the period 1977 to 2010.4 I date the patents based on their
priority date which refers to the first filing date of the invention worldwide since this
date is strongly related to R&D activities and closest to the date of invention as well as
to the decision to apply for a patent (Griliches, 1990; OECD, 2009). The GE patents are
2 The advantages and disadvantages of using patents as a measure of innovation have been discussedat length in the literature. See, for example, Griliches (1990), Dernis et al. (2002), and OECD(2009).
3 The countries are (sorted by country code): Austria (AT), Belgium (BE), Switzerland (CH), CzechRepublic (CZ), Germany (DE), Denmark (DK), Estonia (EE), Spain (ES), Finland (FI), France(FR), United Kingdom (GB), Greece (GR), Hungary (HU), Ireland (IE), Iceland (IS), Italy (IT),Liechtenstein (LI), Luxembourg (LU), Latvia (LV), Netherlands (NL), Norway (NO), Poland (PL),Portugal (PT), Romania (RO), Russian Federation (RU), Sweden (SE), and Slovenia (SI).
4 If a single patent is filed by multiple firms, I count it fractionally. That is, if a patent is filed bymore than one firm, the patent count is divided by the number of firms and each firm receives equalshares of the patent. This avoids giving a higher weight to a patent filed by multiple firms comparedto one filed by just one firm.
6

identified by using International Patent Classification (IPC) codes from the “IPC Green
Inventory” (WIPO, 2015a,b). The inventory provides IPC codes for patents relating to
so-called Environmentally Sound Technologies. Combining these codes with the energy
technology structure developed at the IEA (IEA, 2011), I count GE patents from two
groups: RES and EE. The RES group contains five RES technologies: solar energy, wind
energy, geothermal energy, ocean energy, and fuel cells. The EE group contains three EE
technologies: energy e�ciency in residential and commercial buildings, appliances and
equipment, energy e�ciency in transport, and other energy e�ciency5. Table 1 provides
an overview on the considered technologies.
Table 1: Green energy technologies.
Renewable energy sources technologies
Wind energy
Solar energy
Geothermal energy
Ocean energy
Fuel cells
Energy e�ciency technologies
Energy e�ciency in residential and commercial buildings, appliances and equipment
Energy e�ciency in transport
Other energy e�ciency
To investigate the e↵ect of firms’ GE and non-GE knowledge, I construct a GE knowl-
edge stock (GKS) and a non-GE knowledge stock (NKS) for firm i at time t using the
perpetual inventory method following Cockburn and Griliches (1988) and Peri (2005):
GKSit = GPATit + (1� �)GKSit�1 and (1)
NKSit = NPATit + (1� �)NKSit�1, (2)
where GPATit (respectively NPATit) is the number of GE (respectively non-GE) patent
applications and � is a depreciation rate accounting for the fact that knowledge becomes
5 Following the IEA energy technology structure, the other energy e�ciency group includes wasteheat recovery and utilization, heat pumps, and measurement of electricity consumption.
7
obsolete as time goes by. The depreciation rate is set to 10% as is often assumed in the
literature (see, for example, Verdolini and Galeotti, 2011).6 7
The availability of the AMADEUS financial firm information is limited. The first
available year is 2003. Since I count patents filed until 2010, I use AMADEUS data
from 2003 to 2010. For approximately 22% of the matched firms I have no information
on sales, employment, and/or total assets. For the remaining firms, there are missing
values for some years. Because of these missings, the number of firms and years and,
by this, the number of observations that can be used for the econometric estimations is
lower than in the base sample with 11,002 firms and 34 years. The resulting estimation
data set is an unbalanced panel of 8,619 firms from 22 countries8 over a period of 8
years (2003 to 2010), who have filed at least one EPO patent between 1977 and 2010. In
total, these 8,619 firms filed 3,021 GE patents and 100,835 non-GE patents at the EPO
between 1977 and 2010. The GE patents were filed by a subset of 968 firms from 17
countries9 since not every firm in the full sample applied for a GE patent. The non-GE
patents were filed by a subset of 8,345 firms from 22 countries which shows that almost
every firm in the full sample filed a non-GE patent.
Table 2 reports summary statistics for the full sample of 8,619 patenting firms. The
mean values of sales and total assets suggest the presence of some major firms as the
means lie well above the threshold for the AMADEUS classification of a very large
firm. The knowledge stock values demonstrate the di↵erence in patent counts between
GE and non-GE technologies, reflecting that just about 11% of the sampled firms are
GE patenters. The standard deviations of the knowledge stock of GE and non-GE
technologies have a similar level of about 10% of the mean value. The last row shows
that I have on average almost 6 years of data for each firm.
Table 3 reports correlations between the variables sales, employees, and total assets as
well as GKS and NKS. The highest correlation persists between GKS and NKS (0.552).
This shows that the development of GKS is positively related to those of the significantly
larger group of NKS. The two knowledge stocks are all only weakly correlated to the
measure of firms’ performance, labor, and capital input. As expected, there is also a
6 The initial knowledge stock GKSit0 (respectively NKSit0) is given by GKSit0 = GKSit0/(g + �)(respectively NKSit0 = NKSit0/(g + �)) where GPATijt0 (respectively NPATijt0) is the numberof patent applications in 1977, the first year observed. The growth rate g is the pre-1977 growth inpatent stock, assumed to be 15%, and � again represents depreciation of 10%.
7 I test the robustness of the regression results against the utilization of di↵erent depreciation ratesin the calculation of the knowledge stocks in Section 5.2, Table 10.
8 The countries are AT, BE, CH, CZ, DE, DK, EE, ES, FI, FR, GB, GR, HU, IT, LI, LU, LV, NL,NO, PL, SE, and SI.
9 The countries are AT, BE, CH, CZ, DE, DK, ES, FI, FR, GB, IT, LU, LV, NL, NO, PL, and SE.
8

Table 2: Summary statistics.
Mean Std. dev. Min. Max.
Sales (million EUR) 186.83 2526.82 0.00 323387
Employees (100s) 3.56 38.85 0.01 2888
Total assets (million EUR) 335.96 4091.64 0.00 310898
GE knowledge stock 0.15 1.35 0.00 108
Non-GE knowledge stock 6.11 63.92 0.00 3627
Observations per firm 5.70 1.93 1.00 8
Note: Sales and total assets are both in 2006 million. The knowledge stock variables are calculatedusing the patent data from 1977 to 2010.Source: Authors’ calculations, based on AMADEUS and REGPAT databases.
positive correlation between the firm indicators themselves, the one between sales and
total assets (0.621) being the highest.
Table 3: Correlation matrix.
Sales Employees Total assets GKS NKS
Sales 1
Employees 0.202 1
Total assets 0.621 0.282 1
GKS 0.101 0.101 0.121 1
NKS 0.080 0.106 0.131 0.552 1
Source: Authors’ calculations, based on AMADEUS and REGPAT databases.
3.2 Descriptive Statistics
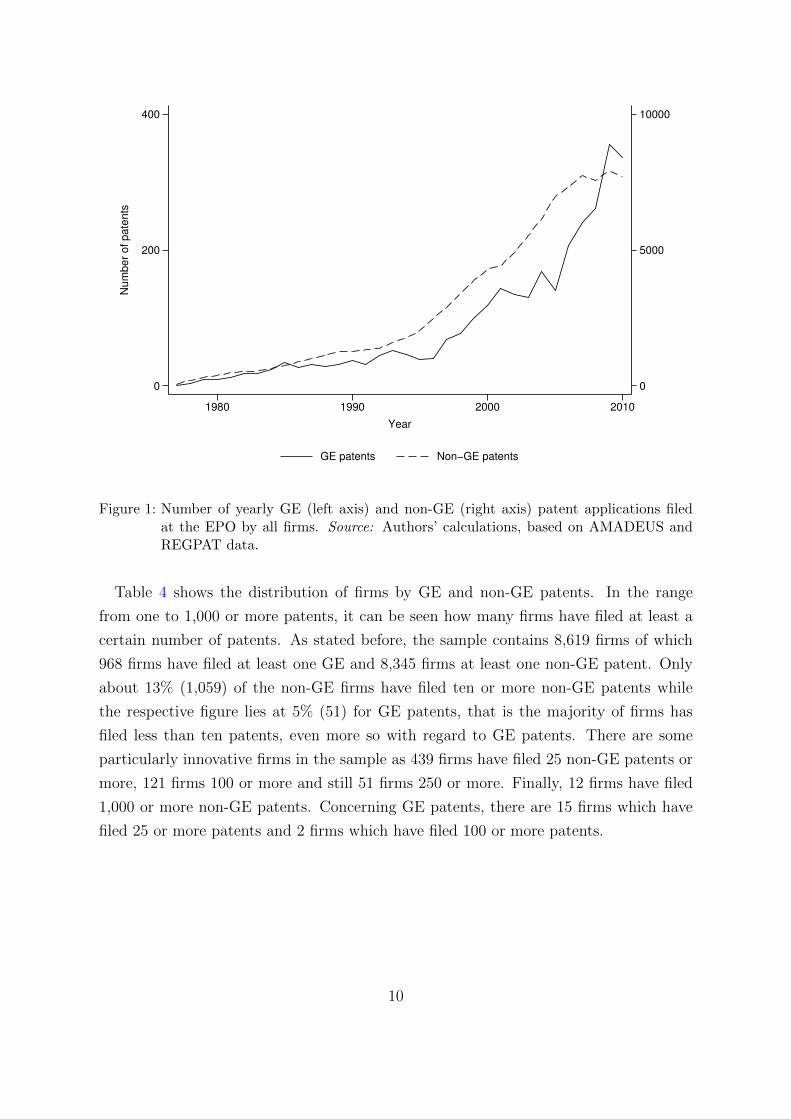
Figure 1 shows the development of yearly GE and non-GE patenting activities of all
firms during 1977 and 2010. GE patent applications are shown on the left axis and non-
GE applications on the right axis. Both variables show an increasing trend from 1977
to 2010. The number of yearly non-GE patent applications increases monotonically and
it can be seen that the yearly increases become significantly larger since the beginning
of the 1990s. Yearly non-GE patent applications peak after a small drop at about
8,000 in 2009. The development of the yearly number of GE patents in my sample is
characterized by two periods of growth. While they remain fairly stable well below 100
at the beginning, there is a steep increase to over 100 yearly GE patents at the end of the
1990s. After a phase of stagnation at the beginning of the 2000s, again an increase to
over 300 yearly GE patents from 2005 to 2008 can be observed. Overall, the development
of GE patents is less steady than the one of non-GE patents.
9
0
5000
10000
0
200
400N
um
ber
of pate
nts
1980 1990 2000 2010
Year
GE patents Non−GE patents
Figure 1: Number of yearly GE (left axis) and non-GE (right axis) patent applications filedat the EPO by all firms. Source: Authors’ calculations, based on AMADEUS andREGPAT data.
Table 4 shows the distribution of firms by GE and non-GE patents. In the range
from one to 1,000 or more patents, it can be seen how many firms have filed at least a
certain number of patents. As stated before, the sample contains 8,619 firms of which
968 firms have filed at least one GE and 8,345 firms at least one non-GE patent. Only
about 13% (1,059) of the non-GE firms have filed ten or more non-GE patents while
the respective figure lies at 5% (51) for GE patents, that is the majority of firms has
filed less than ten patents, even more so with regard to GE patents. There are some
particularly innovative firms in the sample as 439 firms have filed 25 non-GE patents or
more, 121 firms 100 or more and still 51 firms 250 or more. Finally, 12 firms have filed
1,000 or more non-GE patents. Concerning GE patents, there are 15 firms which have
filed 25 or more patents and 2 firms which have filed 100 or more patents.
10

Table 4: The distribution of firms by GE and non-GE patents.
1 or more 10 or more 25 or more 100 ormore
250 ormore
1,000 ormore
Firms (GE) 968 51 15 2 0 0
Firms (Non-GE) 8,345 1,059 439 121 51 12
Source: Authors’ calculations, based on AMADEUS and REGPAT data.
Table 5 gives complementary information on the distribution of the firms with regard
to technology, firm size10, industry11, and country. The GE patenters in the sample are
more involved in EE than RES innovation as 73% of GE firms have patented in the
field of EE technologies and only 41% in RES technologies. GE firms tend to be larger
compared to the non-GE sample. While 31% of GE firms are categorized as very large,
only 17% of the non-GE sample are. The distribution among industries and countries
is very similar between GE firms and the non-GE sample. 50% and 54% respectively
are classified as manufacturers which is thus the most prominent industry group. Other
well represented groups are professional, scientific and technical activities, wholesale and
retail trade as well as construction. Concerning the country distribution of the non-GE
firms, Germany (32%) and France (30%) dominate the sample followed by Spain (11%)
and Italy (10%). It is interesting to note that GE patenters disproportionately come
from Germany (38%).
10 AMADEUS groups firms into the three size categories very large, large, and medium. For firms to beclassified as very large, they have to satisfy at least one of the following criteria: Operating revenueof at least 100 million EUR, total assets of at least 200 million EUR, at least 1000 employees, or thefirm has to be publicly listed. The respective criteria for large companies are: at least 10 millionEUR operating revenue, at least 20 million EUR total assets, or at least 150 employees. For mediumsized firms these criteria are: at least 1 million EUR operating revenue, at least 2 million EUR totalassets, or at least 15 employees.
11 AMADEUS assigns firms to industries using NACE (for the French term ”nomenclature statistiquedes activites economiques dans la Communaute europeenne”), the standard European industryclassification system.
11

Table 5: Distribution of firms by technology, size, industry, and country.
Technology RES EE GE
No. of GE firms 399 704 968
% in GE firms 41% 73% 100%
Size Very Large Large Medium All
No. of GE firms 296 305 367 968
% in GE firms 31% 32% 38% 100%
No. of non-GE firms 1,399 2,684 4,262 8,345
% in non-GE firms 17% 32% 51% 100%
Industry Manu-facturing
Professional,scientific
andtechnicalactivities
Wholesaleand retail
trade
Construction Other All
No. of GE firms 485 159 126 70 128 968
% in GE firms 50% 16% 13% 7% 13% 100%
No. of non-GE firms 4,559 977 1,357 346 1,106 8,345
% in non-GE firms 54% 12% 16% 4% 13% 100%
Country DE FR ES IT Other All
No. of GE firms 369 290 72 65 172 968
% in GE firms 38% 30% 7% 7% 18% 100%
No. of non-GE firms 2,630 2,542 894 834 1,445 8,345
% in non-GE firms 32% 30% 11% 10% 17% 100%
Source: Authors’ calculations, based on AMADEUS and REGPAT data.
4 Empirical Strategy
To empirically evaluate the impact of GE innovation on firm performance, I follow the
approach by Bloom and Van Reenen (2002) who measure firm performance by produc-
tivity. I use a panel data model based on a standard Cobb-Douglas production function
for firm i at time t, extended by innovation respectively knowledge as an additional
input:
Qit = AL↵itK
�itI
�it, (3)
12

where Q is the output, L is the labor input, K is the capital input, I is the knowledge
stock, and A is a constant. The parameters ↵, �, and � are elasticities with respect to
labor, capital, and knowledge respectively.
The elasticity with respect to labor accounts for the e↵ect on output caused by growth
in labor input. The elasticity with respect to capital accounts for the e↵ect in output
caused by growth in capital input. These parameters measure the corresponding single
factor productivity (SFP) growth. The elasticity with respect to knowledge measures
the total factor productivity (TFP) by accounting for the e↵ect in output not caused by
the growth in labor and capital input. This is in line with the conventional view that
TFP is the measure of the rate of technical change (Krugman, 1996). Precisely, since I
will use sales as a proxy for output, I measure revenue productivity which includes both
changes in factor productivity as well as in markups as firms are able to raise prices for
new innovations (Bloom and Van Reenen, 2002).
Expressing 3 in logarithms yields:
ln (Q)it = ln (A) + ↵ln (L)it + �ln (K)it + �ln (I)it . (4)
In the empirical application, I use sales as a proxy for output Q, the number of
employees engaged as a proxy for labor L, and total assets as a proxy for capital K.
The knowledge stock I is proxied by the firm’s GE knowledge stock (GKS), capturing
GE specific knowledge, and the respective non-GE knowledge stock (NKS), capturing
non-GE knowledge. This allows a separate assessment of the productivity impact of
GE and non-GE innovation. Including the non-GE knowledge stock also controls for
di↵erences in the firms’ overall propensity to patent innovations. The knowledge stocks
are included in levels and not in logarithmic form since a substantial number of firms
have knowledge stocks of zero (Wooldridge, 2002). In the complete sample of 8,619
firms the share of zero observations is 91% for the GE and 17% for the respective non-
GE knowledge stock. Thus, this share is substantial especially with respect to the GE
knowledge stock.12 In order to mitigate any reverse causality problems and to account
for the fact, that the impact of innovation on productivity is dynamic and comes with
a certain time lag (Bloom and Van Reenen, 2002), the knowledge stock variables are
12 In a robustness test, I address this approach. I use an alternative specification that includes thelogged total knowledge stock instead of the separated GE and non-GE stocks in levels. Therefore,the problem of zero knowledge stocks is less pronounced. Using the total knowlege stock in logsdoes not change the sign and significance of the coe�cients so that I continue to use the knowledgestocks in levels in the main specification.
13

lagged by two years.13 To control for correlated unobserved heterogeneity, I include
year fixed e↵ects Tt and firm-specific fixed-e↵ects ⌘i. The baseline specification to be
estimated then is given by:
ln (Q)it = ln (A) + ↵ln (L)it + �ln (K)it + �1 (GKS)it�2 + �2 (NKS)it�2
+ Tt + ⌘i + uit,(5)
where uit is a standard varying error term (across time and firms). I estimate (5) using
OLS and fixed-e↵ects (within) regression (least-squares dummy-variable regression) with
standard errors cluster-robust to heteroscedasticity (Section 5.1). To test the robustness
of the baseline model, I use alternative specifications with modifications (Section 5.2).
5 Results
5.1 Baseline Results
The baseline results of estimating the Cobb-Douglas production function (5) are pre-
sented in Table 6. Initially, the full sample of 8,619 firms is used. Column (1) gives
the OLS estimates of the production function. As the independent variables employ-
ment and total assets enter the estimations in log form, the estimated coe�cients can
be interpreted as elasticities. The coe�cients on employment and total assets are both
positive and statistically significant at the 1% level. This result is in line with general
expectations. As one would also expect, the sum of the coe�cients is close to unity
suggesting constant returns to scale. Column (2) has the results of the fixed-e↵ects
estimator which controls for time-invariant unobserved heterogeneity between firms by
including firm-specific fixed e↵ects. Again the coe�cients on employment and total as-
sets are both positive and statistically significant while slightly smaller for employment
and slightly higher for total assets. The estimated elasticities of 0.639 and 0.469 suggest
that a 10% increase in employment or capital is associated with a 6.4 and 4.7% increase
in productivity respectively.
Column (3) reports the results from adding the firm’s GE knowledge stock and the
corresponding non-GE stock as proxies for a firm’s knowledge. As the knowledge stocks
enter the estimation in levels, the estimated coe�cients have a percentage interpretation
when they are multiplied by 100, commonly called semi-elasticity. The GE knowledge
stock is negative and significant at the 5% level. The coe�cient suggests that an increase
13 I test the robustness of my results against other lag structures in Section 5.2, Table 9.
14
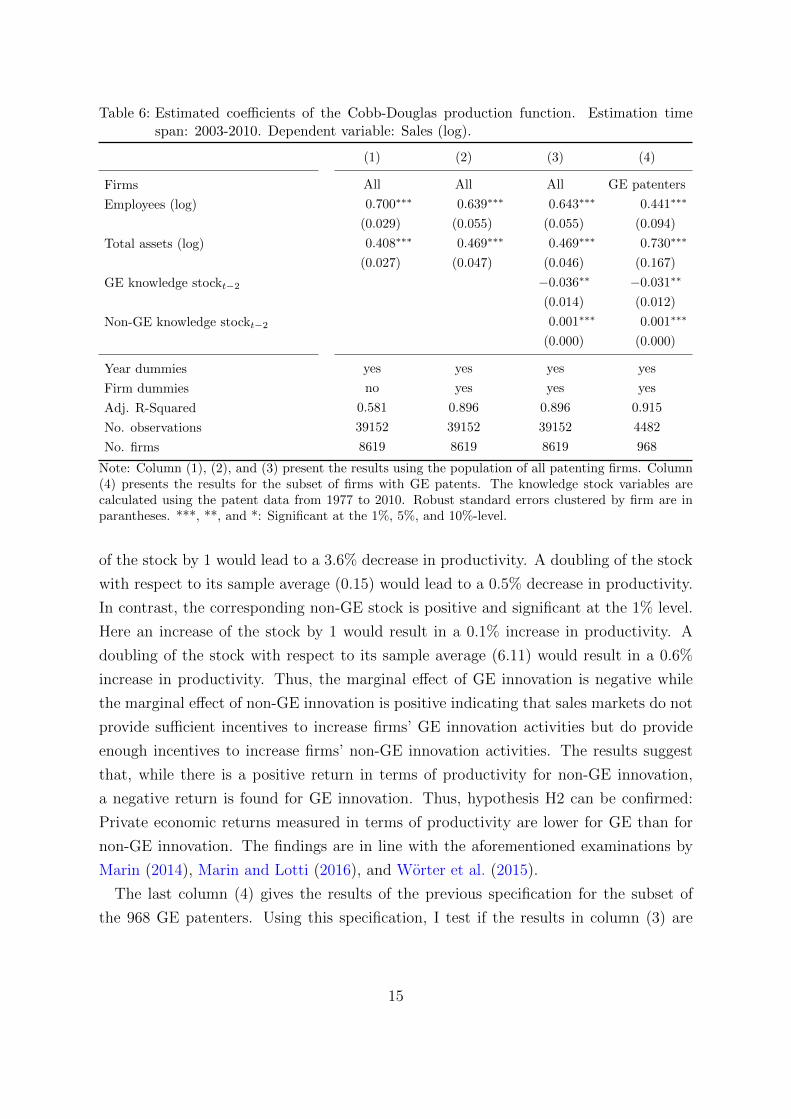
Table 6: Estimated coe�cients of the Cobb-Douglas production function. Estimation timespan: 2003-2010. Dependent variable: Sales (log).
(1) (2) (3) (4)
Firms All All All GE patenters
Employees (log) 0.700⇤⇤⇤ 0.639⇤⇤⇤ 0.643⇤⇤⇤ 0.441⇤⇤⇤
(0.029) (0.055) (0.055) (0.094)
Total assets (log) 0.408⇤⇤⇤ 0.469⇤⇤⇤ 0.469⇤⇤⇤ 0.730⇤⇤⇤
(0.027) (0.047) (0.046) (0.167)
GE knowledge stockt�2 �0.036⇤⇤ �0.031⇤⇤
(0.014) (0.012)
Non-GE knowledge stockt�2 0.001⇤⇤⇤ 0.001⇤⇤⇤
(0.000) (0.000)
Year dummies yes yes yes yes
Firm dummies no yes yes yes
Adj. R-Squared 0.581 0.896 0.896 0.915
No. observations 39152 39152 39152 4482
No. firms 8619 8619 8619 968
Note: Column (1), (2), and (3) present the results using the population of all patenting firms. Column(4) presents the results for the subset of firms with GE patents. The knowledge stock variables arecalculated using the patent data from 1977 to 2010. Robust standard errors clustered by firm are inparantheses. ***, **, and *: Significant at the 1%, 5%, and 10%-level.
of the stock by 1 would lead to a 3.6% decrease in productivity. A doubling of the stock
with respect to its sample average (0.15) would lead to a 0.5% decrease in productivity.
In contrast, the corresponding non-GE stock is positive and significant at the 1% level.
Here an increase of the stock by 1 would result in a 0.1% increase in productivity. A
doubling of the stock with respect to its sample average (6.11) would result in a 0.6%
increase in productivity. Thus, the marginal e↵ect of GE innovation is negative while
the marginal e↵ect of non-GE innovation is positive indicating that sales markets do not
provide su�cient incentives to increase firms’ GE innovation activities but do provide
enough incentives to increase firms’ non-GE innovation activities. The results suggest
that, while there is a positive return in terms of productivity for non-GE innovation,
a negative return is found for GE innovation. Thus, hypothesis H2 can be confirmed:
Private economic returns measured in terms of productivity are lower for GE than for
non-GE innovation. The findings are in line with the aforementioned examinations by
Marin (2014), Marin and Lotti (2016), and Worter et al. (2015).
The last column (4) gives the results of the previous specification for the subset of
the 968 GE patenters. Using this specification, I test if the results in column (3) are
15

robust or mainly driven by the shift from a firm without any GE patents to a firm with
GE patents. Again the estimate on the GE knowledge stock is negative and significant
although slightly smaller than in column (3). Likewise the coe�cient on the respective
stock in non-GE patents is still positive and significant but slightly lower. The lower
estimates on employment and higher estimates on total assets indicate that the GE
patenting firms are on average more capital intensive than the non-GE patenting firms.
In fact the GE patenters have on average a 37% higher capital to labor ratio compared
to the complete sample.
5.2 Robustness Tests
In order to test the sensitivity of the baseline results presented in Table 6, I conduct a
number of robustness tests based on the main model in column (3).
First, I repeat the main specification di↵erentiating between two subgroups of GE
technologies: RES and EE technologies. Column (1) and (3) in Table 7 present results
using the population of all patenting firms. Overall, the estimated coe�cients are similar
but show di↵erences between the two technology groups. The negative coe�cients of
the RES and EE knowledge stocks are higher compared to the coe�cient of the GE
knowledge stock, even more so for the RES knowledge stock. Thus, patents in the field
of RES have a more pronounced negative impact on productivity than EE patents. This
finding may be explained by di↵erent maturity levels of RES and EE markets. Again
in contrast, the corresponding coe�cient of the non-RES and non-EE knowledge stocks
are small, but positive and significant.
Column (2) and (4) give the results for the subset of firms with RES respectively
EE patents. Doing this, I test again if the results in column (1) and (3) are robust
or mainly driven by the shift from non-RES respectively non-EE patenters to RES-
respectively EE patenters. The coe�cient on the RES knowledge stock is negative and
significant and increases slightly in absolute terms compared to column (1). Contrary,
the coe�cient on the EE knowledge stock decreases slightly compared to column (3)
but still remains negative and significant. The coe�cients on the respective stocks in
non-RES and non-EE patents do not change compared to columns (1) and (3). The
estimates on employment and total assets show that both RES and EE patenters are on
average more capital intensive than non-GE firms, with EE patenters having the highest
capital-intensity. The sum of the coe�cients is 1.22 in column (2) and 1.05 in column
(2), suggesting higher returns to scale in tangible factors for RES than EE patenters.
16

Table 7: Di↵erentiating by technology group. Estimation time span: 2003-2010. Dependentvariable: Sales (log).
(1) (2) (3) (4)
Firms All RES patenters All EE patenters
Employees (log) 0.643⇤⇤⇤ 0.508⇤⇤⇤ 0.642⇤⇤⇤ 0.343⇤⇤⇤
(0.055) (0.165) (0.055) (0.100)
Total assets (log) 0.469⇤⇤⇤ 0.714⇤⇤⇤ 0.469⇤⇤⇤ 0.707⇤⇤⇤
(0.046) (0.174) (0.046) (0.238)
RES knowledge stockt�2 �0.055⇤ �0.061⇤⇤
(0.031) (0.025)
Non-RES knowledge stockt�2 0.001⇤⇤ 0.001⇤⇤⇤
(0.000) (0.000)
EE knowledge stockt�2 �0.044⇤⇤ �0.029⇤
(0.022) (0.016)
Non-EE knowledge stockt�2 0.001⇤⇤ 0.001⇤⇤
(0.001) (0.000)
Year dummies yes yes yes yes
Firm dummies yes yes yes yes
Adj. R-Squared 0.896 0.896 0.896 0.937
No. observations 39152 1816 39152 3344
No. firms 8619 399 8619 704
Note: Estimations are based on the same specification as in column (3) of Table 6. Column (1) and (3)present the results using the population of all patenting firms. Column (2) and (4) present the resultsfor the subset of firms with RES respectively EE patents. The knowledge stock variables are calculatedusing the patent data from 1977 to 2010. Robust standard errors clustered by firm are in parantheses.***, **, and *: Significant at the 1%, 5%, and 10%-level.
The relationship between innovation and productivity may be dependent on a firm’s
size. Therefore, I conduct a second robustness test di↵erentiating between the size of
the investigated firms. Table 8 reports estimated coe�cients of the main model for
very large, large, and medium sized firms. The coe�cient on the GE knowledge stock,
which has been significant in all previous specifications, is only significant for very large
firms. For very large firms it also has the same size as in the main specification. The
coe�cient on the non-GE knowledge stock, likewise always significant before, is highly
significant for medium sized firms only, significant at the 10% level for very large firms
and insignificant for large firms. Overall, the results are very similar in size but not
always statistically significant. The results suggest that the (negative) impact of GE
innovation on productivity tends to be more pronounced for larger firms whereas the
(positive) productivity e↵ect of non-GE innovation seems to be more important for
17

smaller firms. Possible reasons for the lower levels of significance are that the sample
sizes are smaller and the variation of the knowledge stocks is lower between firms of
similar size.
Table 8: Di↵erentiating by firm size. Estimation time span: 2003-2010. Dependent variable:Sales (log).
(1) (2) (3)
Firms Very large Large Medium
Employees (log) 0.686⇤⇤⇤ 0.652⇤⇤⇤ 0.606⇤⇤⇤
(0.140) (0.066) (0.063)
Total assets (log) 0.530⇤⇤⇤ 0.541⇤⇤⇤ 0.412⇤⇤⇤
(0.105) (0.063) (0.070)
GE knowledge stockt�2 �0.031⇤ �0.039 �0.056
(0.017) (0.040) (0.113)
Non-GE knowledge stockt�2 0.001⇤ 0.000 0.004⇤⇤⇤
(0.001) (0.001) (0.001)
Year dummies yes yes yes
Firm dummies yes yes yes
Adj. R-Squared 0.870 0.846 0.814
No. observations 8109 13956 17087
No. firms 1428 2775 4416
Note: Estimations are based on the same specification as in column (3) of Table 6. Column (1) presentsthe results for the subset of very large, column (2) for the subset of large, and column (3) for the subsetof medium sized firms. The knowledge stock variables are calculated using the patent data from 1977to 2010. Robust standard errors clustered by firm are in parantheses. ***, **, and *: Significant at the1%, 5%, and 10%-level.
As noted before, in the baseline specification I lag the knowledge stock variables by two
years in order to mitigate any reverse causality problems and to account for the fact that
innovative output does not immediately have an e↵ect on a firm’s productivity. In order
to test the sensitivity of the knowledge stock results to other lag structures, I conduct a
third robustness test and re-estimate the main model with the current knowledge stocks
and with knowledge stocks lagged one, two (as used in the baseline specification depicted
in Table 6), and three years. The results are given in Table 9. Overall, the results are
robust to these modifications. The impact of additional GE innovation on productivity
is still negative and the impact of additional non-GE innovation still positive. The higher
point estimates on the two- and three-year lag compared to the zero- and one-year lag
18

for both knowledge stocks14 support the hypothesis of a time lag between innovation
and its e↵ect on performance. In other words, patented innovations take some time to
enter the production function. Another explanation for the stronger negative impact of
additional GE innovation for longer lags might be that marginal costs of GE innovation
were higher and demand for GE innovation was lower in earlier periods (for a similar
result and reasoning see Worter et al., 2015).
Table 9: Di↵erent lags for the knowledge stocks. Estimation time span: 2003-2010. Dependentvariable: Sales (log).
(1) (2) (3) (4)
Firms All All All All
Employees (log) 0.643⇤⇤⇤ 0.643⇤⇤⇤ 0.643⇤⇤⇤ 0.642⇤⇤⇤
(0.055) (0.055) (0.055) (0.055)
Total assets (log) 0.469⇤⇤⇤ 0.469⇤⇤⇤ 0.469⇤⇤⇤ 0.469⇤⇤⇤
(0.046) (0.046) (0.046) (0.046)
GE knowledge stock �0.029⇤⇤ �0.028⇤ �0.036⇤⇤ �0.034⇤⇤
(0.013) (0.015) (0.014) (0.017)
Non-GE knowledge stock 0.001⇤⇤⇤ 0.001⇤⇤⇤ 0.001⇤⇤⇤ 0.001⇤⇤
(0.000) (0.000) (0.000) (0.001)
Year dummies yes yes yes yes
Firm dummies yes yes yes yes
Adj. R-Squared 0.896 0.896 0.896 0.896
No. observations 39152 39152 39152 39152
No. firms 8619 8619 8619 8619
Note: Estimations are based on the same specification as in column (3) of Table 6. Column (1), (2), (3),and (4) present the results for the current knowledge stocks and for knowledge stocks lagged one, two,and three years, respectively. The knowledge stock variables are calculated using the patent data from1977 to 2010. Robust standard errors clustered by firm are in parantheses. ***, **, and *: Significantat the 1%, 5%, and 10%-level.
The final robustness test is done by utilizing di↵erent depreciation rates in the calcula-
tion of the knowledge stocks. Table 10 reports the main model estimates for depreciation
rates of 5%, 10% (as used in the baseline estimation depicted in Table 6), 15%, and 20%.
The higher the depreciation rate, the lower the importance of past knowledge. A depre-
ciation rate of 100% would mean that the knowledge stock becomes a flow variable, that
is only the patents from the current period contribute to a firm’s productivity. For all
specifications, the coe�cients on the GE and non-GE knowledge stocks are significant at
14 For the non-GE coe�cients, the increase concerns the fourth decimal place and cannot be seen inthe presented output table.
19

least at the 5% level. While the coe�cient of the non-GE knowledge stock does not vary
in size, the coe�cient of the GE stock becomes more negative using higher depreciation
rates. Hence, the negative e↵ect of GE knowledge on productivity becomes larger when
firms can rely on less previous GE knowledge. In other words, a larger GE knowledge
stock mitigates the negative e↵ect that an increase in GE knowledge has on productivity.
An explanation might be that firms with a larger knowledge stock in GE technologies
have lower R&D costs for the same amount of inventive output than firms with a lower
knowledge stock.
Table 10: Di↵erent depreciation rates for the knowledge stocks. Estimation time span: 2003-2010. Dependent variable: Sales (log).
(1) (2) (3) (4)
Firms All All All All
Employees (log) 0.642⇤⇤⇤ 0.643⇤⇤⇤ 0.643⇤⇤⇤ 0.643⇤⇤⇤
(0.055) (0.055) (0.055) (0.055)
Total assets (log) 0.469⇤⇤⇤ 0.469⇤⇤⇤ 0.469⇤⇤⇤ 0.468⇤⇤⇤
(0.046) (0.046) (0.046) (0.047)
GE knowledge stockt�2 �0.026⇤⇤ �0.036⇤⇤ �0.042⇤⇤⇤ �0.046⇤⇤⇤
(0.012) (0.014) (0.016) (0.017)
Non-GE knowledge stockt�2 0.001⇤⇤ 0.001⇤⇤⇤ 0.001⇤⇤⇤ 0.001⇤⇤⇤
(0.000) (0.000) (0.001) (0.001)
Year dummies yes yes yes yes
Firm dummies yes yes yes yes
Adj. R-Squared 0.896 0.896 0.896 0.896
No. observations 39152 39152 39152 39152
No. firms 8619 8619 8619 8619
Note: Estimations are based on the same specification as in column (3) of Table 6. Columns (1), (2),(3), and (4) present the results for knowledge stock depreciation rates of 5%, 10%, 15%, and 20%,respectively. The knowledge stock variables are calculated using the patent data from 1977 to 2010.Robust standard errors clustered by firm are in parantheses. ***, **, and *: Significant at the 1%, 5%,and 10%-level.
6 Conclusions
In this article, I studied the e↵ect of innovation in GE technologies on the economic per-
formance of firms and compared it to the e↵ect of non-GE innovation. I based my study
on a panel of 8,619 patenting firms including 968 GE patenters from 22 European coun-
tries over the period 2003 to 2010. To construct the panel, I combined firm accounts data
20

with data on firms’ patent applications. My results show that, all else equal, innovation
in GE technologies has a negative impact on the economic performance of firms while
innovating in non-GE technologies positively a↵ects firms’ economic performance. This
confirms the hypothesis H2 that private economic returns in terms of productivity are
lower for GE than for non-GE innovation, which corresponds to previous results found
by Marin (2014), Marin and Lotti (2016), and Worter et al. (2015). I also find evidence
for di↵erent performance e↵ects across GE technologies. My results reveal that the neg-
ative e↵ect on firm performance is more pronounced for RES than for EE technologies.
Moreover, my findings suggest that the negative relationship between GE innovation
and performance is stronger for larger firms. Furthermore, the negative impact of GE
innovation on performance is found to be stronger with a larger time lag between both.
On the one hand, this supports the hypothesis of a time lag between innovation and
its impact on performance. On the other hand, it indicates that marginal costs of GE
innovation decreased and demand for GE innovation increased over time. Finally, the
use of di↵erent knowledge depreciation rates shows that the negative impact of new GE
patents on performance is less pronounced when firms can build on an existing stock of
GE knowledge.
Given these results, the initial research question can be answered: since GE inno-
vation guarantees lower private returns than non-GE innovation, firms forgo economic
opportunities by innovating in GE technologies and gain economic opportunities by con-
centrating on innovation in non-GE technologies. However, as one can observe in the
data, firms nevertheless have invested in GE technologies. Since the resources that firms
can allocate to R&D investment projects are limited and since firms always choose the
project with the highest private return, this observation evidences a potential crowding
out of GE innovation at the expense of (more rewarding) non-GE innovation. Thus it
seems that there where factors (for example political expectations, environmental reg-
ulation) that somewhat forced firms to use their scarce R&D funds for projects with
comparatively low returns (Marin, 2014). Assuming that the non-private returns for
the GE and the non-GE project are the same, this crowding out would be welfare de-
creasing. However, if the GE project has higher social returns (that is combined private
and non-private returns) compared to the non-GE project, this crowding out would be
welfare increasing. This then would be an argument for policy intervention aiming to
increase private returns of GE innovation in order to promote socially beneficial green
growth.
21
References
Acemoglu, D., Aghion, P., Bursztyn, L. and Hemous, D. (2012), ‘The Environment and
Directed Technical Change’, American Economic Review 102(1), 131–166.
Ayari, N., Blazsek, S. and Mendi, P. (2012), ‘Renewable energy innovations in Europe:
a dynamic panel data approach’, Applied Economics 44(24), 3135–3147.
Beise, M. and Rennings, K. (2005), ‘Lead markets and regulation: a framework for ana-
lyzing the international di↵usion of environmental innovations’, Ecological Economics
52, 5–17.
Bloom, N. and Van Reenen, J. (2002), ‘Patents, real options and firm performance’, The
Economic Journal 112(478), C97–C116.
Blundell, R., Gri�th, R. and Van Reenen, J. (1999), ‘Market Share, Market Value and
Innovation in a Panel of British Manufacturing Firms’, Review of Economic Studies
66(3), 529–554.
Bureau van Dijk (2015), ‘AMADEUS. A Database of Comparable Financial Information
for Public and Private Companies Across Europe’, http://www.bvdinfo.com/en-gb/
our-products/company-information/international-products/amadeus, last ac-
cessed 30 June 2015.
Cainelli, G., Mazzanti, M. and Zoboli, R. (2011), ‘Environmentally oriented innovative
strategies and firm performance in services. Micro-evidence from Italy’, International
Review of Applied Economics 25(1), 61–85.
Cockburn, I. M. and Griliches, Z. (1988), ‘Industry E↵ects and Appropriability Measures
in the Stock Market’s Valuation of R&D and Patents’, American Economic Review
78(2), 419–423.
Colombelli, A., Kra↵t, J. and Quatraro, F. (2015), ‘Eco-innovation and firm growth:
Do green gazelles run faster? Microeconometric evidence from a sample of European
firms’, WWWforEurope Working Paper Series 88.
Comanor, W. S. and Scherer, F. M. (1969), ‘Patent statistics as a measure of technical
change’, The Journal of Political Economy pp. 392–398.
Dechezlepretre, A., Martin, R. and Mohnen, M. (2014), ‘Policy brief: Clean innovation
and growth’, Imperical College London Business School Policy Brief .
22
Dernis, H., Guellec, D. and Van Pottelsberghe, B. (2002), ‘Using patent counts for
cross-country comparisons of technology output’, STI Review 27.
Dosi, G. (1988), ‘Sources, Procedures, and Microeconomic E↵ects of Innovation’, Journal
of Economic Literature 26(3), 1120–1171.
Ernst, H. (2001), ‘Patent applications and subsequent changes of performance: evidence
from time-series cross-section analyses on the firm level’, Research Policy 30(1), 143–
157.
Griliches, Z. (1981), ‘Market value, R&D, and patents’, Economics Letters 7(2), 183–187.
Griliches, Z. (1990), ‘Patent Statistics as Economic Indicators: A Survey’, Journal of
Economic Literature 28(4), 1661–1707.
Griliches, Z., Hall, B. H. and Pakes, A. (1991), ‘R&D, patents, and market value revis-
ited: Is there a second (technological opportunity) factor?’, Economics of Innovation
and New Technology 1(3), 183–201.
Hall, B. H., Ja↵e, A. and Trajtenberg, M. (2005), ‘Market Value and Patent Citations’,
The RAND Journal of Economics 36(1), 16–38.
Helpman, E. (1998), General purpose technologies and economic growth, Cambridge,
Massachusetts: The MIT Press.
IEA (2011), ‘IEA Guide to Reporting Energy RD&D Budget/Expenditure Statistics’.
Ja↵e, A. B., Newell, R. G. and Stavins, R. N. (2002), ‘Environmental Policy and Tech-
nological Change’, Environmental and Resource Economics 22(1-2), 41–69.
Ja↵e, A. B. and Palmer, K. (1997), ‘Environmental Regulation and Innovation: A Panel
Data Study’, The Review of Economics and Statistics 79(4), 610–619.
Johnstone, N., Hascic, I. and Popp, D. (2010), ‘Renewable Energy Policies and Techno-
logical Innovation: Evidence Based on Patent Counts’, Environmental and Resource
Economics 45(1), 133–155.
Krugman, P. R. (1996), Pop internationalism, Cambridge, Massachusetts: The MIT
Press.
23

Lanjouw, J. O. and Schankerman, M. (2004), ‘Patent quality and research productivity:
Measuring innovation with multiple indicators’, The Economic Journal 114(495), 441–
465.
Marin, G. (2014), ‘Do eco-innovations harm productivity growth through crowding out?
Results of an extended CDM model for Italy’, Research Policy 43(2), 301–317.
Marin, G. and Lotti, F. (2016), ‘Drivers and E↵ects of Eco-innovations Using Data on
Eco-patents’, Industrial and Corporate Change, forthcoming .
Noci, G. and Verganti, R. (1999), ‘Managing ‘green’product innovation in small firms’,
R&D Management 29(1), 3–15.
OECD (2009), ‘OECD Patent Statistics Manual’.
OECD (2014), ‘OECD HAN database, January 2014’, http://www.oecd.org/sti/
innovationinsciencetechnologyandindustry/oecdpatentdatabases.htm, last
accessed 30 June 2015.
OECD (2015), ‘OECD, REGPAT database, February 2015’, http://www.oecd.org/
sti/innovationinsciencetechnologyandindustry/oecdpatentdatabases.htm,
last accessed 30 June 2015.
Peri, G. (2005), ‘Determinants of Knowledge Flows and Their E↵ect on Innovation’, The
Review of Economics and Statistics 87(2), 308–322.
Popp, D. (2002), ‘Induced Innovation and Energy Prices’, American Economic Review
92(1), 160–180.
Popp, D. and Newell, R. (2012), ‘Where does energy R&D come from? Examining
crowding out from energy R&D’, Energy Economics 34(4), 980–991.
Popp, D., Newell, R. G. and Ja↵e, A. B. (2010), Energy, the Environment, and Techno-
logical Change, in B. H. Halland and N. Rosenberg, eds, ‘Handbook of the Economics
of Innovation’, Vol. 2, Burlington: North-Holland.
Romer, P. M. (1986), ‘Increasing returns and long-run growth’, Journal of Political
Economy 94(5), 1002–1037.
Romer, P. M. (1990), ‘Endogenous Technological Change’, Journal of Political Economy
98(5), S71–S102.
24

Scherer, F. M. (1965), ‘Corporate inventive output, profits, and growth’, The Journal of
Political Economy pp. 290–297.
The World Bank (2015), ‘World Development Indicators (WDI)’, http://databank.
worldbank.org, last accessed 30 June 2015.
Verdolini, E. and Galeotti, M. (2011), ‘At home and abroad: An empirical analysis of
innovation and di↵usion in energy technologies’, Journal of Environmental Economics
and Management 61(2), 119–134.
WIPO (2015a), ‘International Patent Classification (IPC)’, http://www.wipo.int/
classifications/ipc/en/, last accessed 30 June 2015.
WIPO (2015b), ‘IPC Green Inventory’, http://www.wipo.int/classifications/ipc/
en/est/index.html, last accessed 30 June 2015.
Wooldridge, J. M. (2002), Econometric analysis of cross section and panel data, Cam-
bridge, Massachusetts: The MIT press.
Worter, M., Stucki, T. and Soltmann, C. (2015), ‘The Impact of Environmentally
Friendly Innovations on Value Added’, Environmental and Resource Economics
62(3), 457–479.
25

Appendix
2000
4000
6000
Num
ber
of firm
s
2002 2004 2006 2008 2010
Year
Figure A1: Number of firms, 2003-2010. Source: Authors’ calculations, based on AMADEUSand REGPAT data.
26

Table A1: Number of yearly patent applications filed at the EPO by all firms by technologygroup.
Year RES EE GE Non-GE
1977 0 0 0 66
1978 0 3 3 212
1979 2 7 9 309
1980 1 9 10 390
1981 1 12 13 504
1982 4 14 18 530
1983 5 16 18 548
1984 7 20 24 647
1985 3 32 35 749
1986 7 26 27 891
1987 4 28 32 1,024
1988 3 25 28 1,140
1989 11 30 32 1,267
1990 5 33 38 1,268
1991 3 29 31 1,331
1992 5 40 45 1,390
1993 10 45 52 1,609
1994 8 42 47 1,768
1995 12 35 40 2,034
1996 11 33 40 2,487
1997 20 57 68 2,886
1998 25 62 77 3,419
1999 26 88 100 3,883
2000 41 108 119 4,278
2001 59 101 143 4,440
2002 51 94 134 4,911
2003 46 94 130 5,522
2004 63 110 168 6,142
2005 54 89 141 6,959
2006 82 142 207 7,324
2007 106 168 241 7,739
2008 132 181 261 7,558
2009 195 192 356 7,925
2010 189 207 336 7,691
Total 1,190 2,171 3,021 100,835
Source: Authors’ calculations, based on AMADEUS and REGPAT data.
27
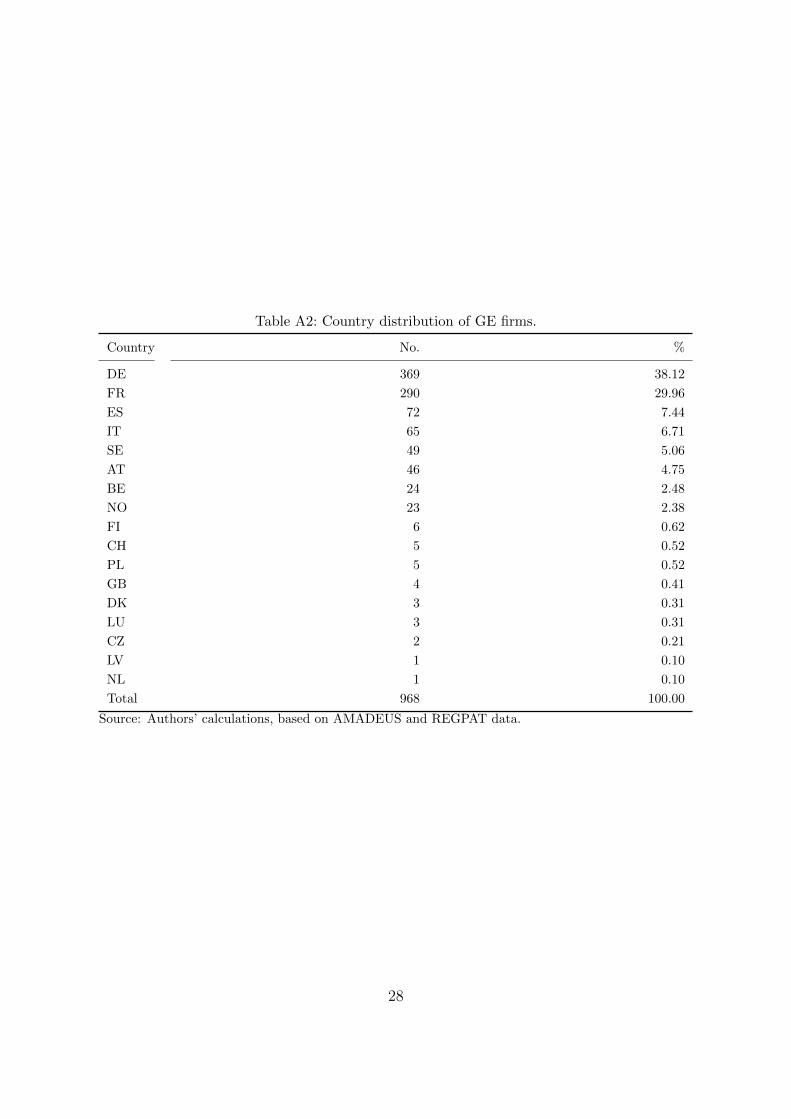
Table A2: Country distribution of GE firms.
Country No. %
DE 369 38.12
FR 290 29.96
ES 72 7.44
IT 65 6.71
SE 49 5.06
AT 46 4.75
BE 24 2.48
NO 23 2.38
FI 6 0.62
CH 5 0.52
PL 5 0.52
GB 4 0.41
DK 3 0.31
LU 3 0.31
CZ 2 0.21
LV 1 0.10
NL 1 0.10
Total 968 100.00
Source: Authors’ calculations, based on AMADEUS and REGPAT data.
28

Table A3: Country distribution of non-GE firms.
Country No. %
DE 2630 31.51
FR 2542 30.46
ES 894 10.71
IT 834 9.99
SE 502 6.02
AT 313 3.75
NO 234 2.80
BE 184 2.20
FI 45 0.54
PL 37 0.44
CH 32 0.38
DK 25 0.30
GB 22 0.26
LU 17 0.20
EE 9 0.11
NL 9 0.11
CZ 6 0.07
HU 4 0.05
LV 3 0.04
GR 1 0.01
LI 1 0.01
SI 1 0.01
Total 8345 100.00
Source: Authors’ calculations, based on AMADEUS and REGPAT data.
29