Innovation in Backhaul Antenna Technology to Deliver ...
11
White Paper Innovation in Backhaul Antenna Technology to Deliver Higher Capacity Through Spectral Efficiency Dipesh Rattan, Product Line Manager, CommScope Joe Marzin, Technical Director, Comsearch November, 2013
Transcript of Innovation in Backhaul Antenna Technology to Deliver ...
White Paper
Innovation in Backhaul Antenna Technology to Deliver Higher Capacity Through Spectral EfficiencyDipesh Rattan, Product Line Manager, CommScope
Joe Marzin, Technical Director, Comsearch
November, 2013
2
Executive summary 3
Preamble 3
Introduction—a real network case study 4
Network analysis: objective and background 4
The approach 5
Methodology 6
Threshold degradation results 6
Result—qualitative 8
Result—backhaul capacity gain 8
Result—Google Earth images 9
Annual gain in backhaul traffic with Sentinel—improvement in QoS 10
Return on investment estimates with Andrew Solutions Sentinel antennas—economies for the operator 10
Future work 11
Conclusion 11
Contents
3
Executive summaryRecent advances in microwave antenna engineering—together with enhancements in manufacturing processes—have allowed new high-performance (very low side lobe) point-to-point antennas to be offered at economic prices. The antennas reviewed in this paper are the European Telecommunications Standards Institute (ETSI) Class 4 compliant Andrew Solutions® Sentinel® antennas.
This paper describes options for network operators to achieve capacity, quality of service (QoS) and total cost of ownership (TCO) improvements. The improvements can be dramatic.
Described herein is a 1048-link (2096-antenna), 38GHz, well-designed network that can realize more than 14 percent improvement in traffic loss (outages) by simply swapping existing Class 3 antennas for Andrew Solutions Sentinel Class 4 antennas. The swap resulted in improvements in every radio link.
The financial payback described is due to availability (network outage) improvements and depends on the value of traffic, among other factors. The result, over five years, shows a potential €2,566,000 financial benefit to the operator. The incremental investment in Sentinel could be recovered in 28 weeks.
However, it is believed that if the network had been designed with Sentinel Class 4 antennas from the start, the capacity per geographic area, the backhaul pipe size, the tower lease savings and the QoS dividends would substantially eclipse the financial benefit resulting from improved network availability.
There are various ways to optimize a network to achieve payback from Sentinel antennas. This work has been done to provoke thought and discussion, encouraging network operators to realize the potential benefits available from a new breakthrough in antenna technology.
PreambleSince 2012, several networks have been deployed using CommScope’s Sentinel microwave antennas. These antennas are fully compliant with ETSI Class 4 standards—they have dramatically lower side lobes than ETSI Class 3 antennas.
The importance of antenna side lobes in a point-to-point radio link is increasing. As interference in a network grows, capacity per geographic area drops. Good antennas protect from interference because their low side lobes provide immunity to the interference. Therefore, they increase backhaul link and network design capacity.
Sentinel antennas can deliver a variety of benefits to the microwave backhaul network, as follows:
1. Sentinel antennas save backhaul spectrum, improving operator income because they:
a. Increase network availabilityb. Enhance throughput per radio linkc. Enhance design capacityd. Improve network performancee. Potentially reduce subscriber churn

4
2. Sentinel antennas offer the operator a chance to use smaller-diameter antennas, resulting in:
a. Savings on antenna spend (overall price paid)b. Savings on logisticsc. Savings on installation costd. Savings on tower lease charges
3. Sentinel antennas help future-proof spectrum. As the operator needs more microwave links, the spectrum is clean and allows for expansion.
4. In areas where interference sources are unknown or unquantified, Sentinel antennas offer a new remedy to link and/or network problems.
5. Sentinel antennas allow the operator to increase the size of backhaul pipe by improving the carrier-to-interference (C/I) ratio.
Introduction—a real network case studyTogether with Comsearch®, CommScope conducted a study comparing Sentinel ETSI Class 4 antennas with Class 3 antennas of equal size and frequency and assessed their respective impact on network throughput and backhaul design capacity.
This study looked at a portion of a well-designed mobile network in Hungary, analyzing 1,048 microwave backhaul links, the operating frequency bands, and the radio equipment deployed.
The analysis was focused on dense urban areas using the 38GHz frequency band with full IP radio equipment with adaptive coding and modulation (ACM).1
In basic terms, the network performance (throughput) was analyzed with the existing radio equipment and 38GHz Class 3 antennas. The antennas were then simply swapped for Andrew Solutions Sentinel antennas. Nothing else was changed.
Network analysis: objective and backgroundThe objective of the study was to examine whether Andrew Solutions Sentinel antennas would reduce network interference levels and, consequently, improve availability and throughput for link traffic.
Decrease in the fade margin of microwave links—caused by threshold degradation due to internal and external interference sources—leads to an increase in network unavailability and lost traffic.
This lost traffic may result in two unwanted effects for the operator:
•The direct effect, where lost traffic simply translates to a loss of possible revenue for data transmission
•The indirect effect of a negative impact on customer satisfaction that could result in subscriber churn, again impacting the revenue of the operator—in other words, low QoS
Hence, the interference (low C/I ratio) reduces capacity of the network and lowers QoS.
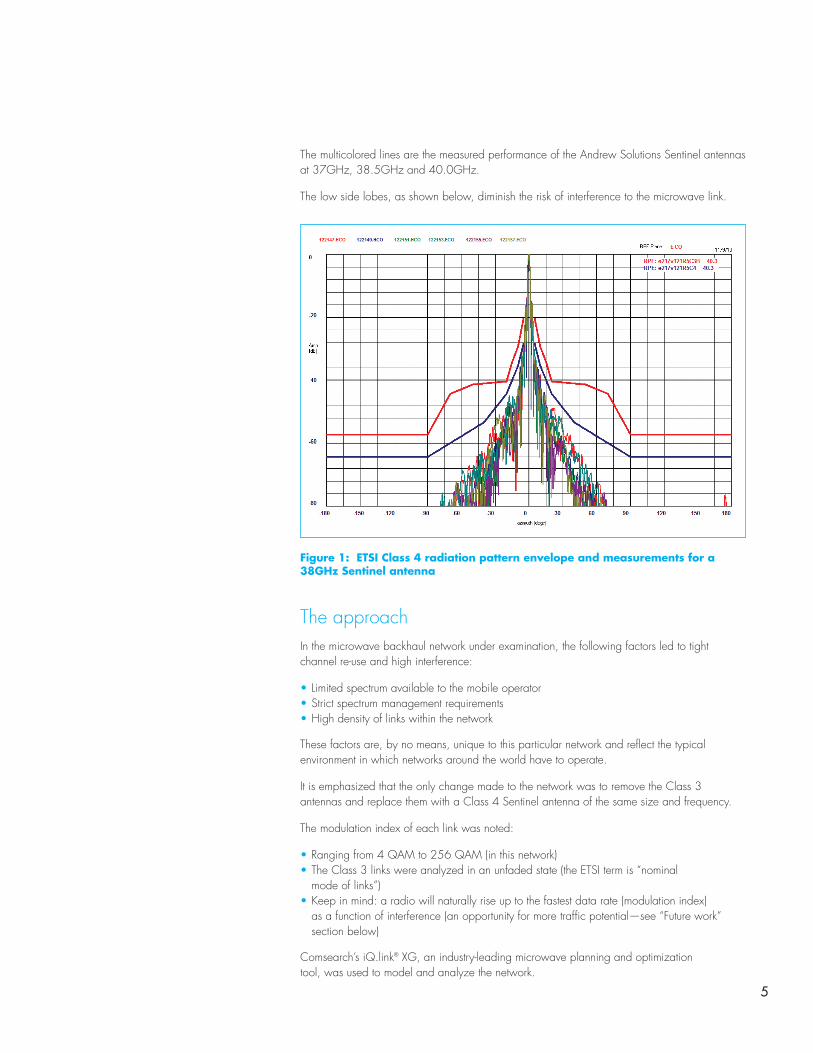
Sentinel antennas exceed the requirements of ETSI Class 4 specifications, which are denoted by the blue line in the graph below.
1 All data used in the course of the study is available upon request from the National Media and Infocommunications Authority.
5
The multicolored lines are the measured performance of the Andrew Solutions Sentinel antennas at 37GHz, 38.5GHz and 40.0GHz.
The low side lobes, as shown below, diminish the risk of interference to the microwave link.
The approachIn the microwave backhaul network under examination, the following factors led to tight channel re-use and high interference:
•Limited spectrum available to the mobile operator•Strict spectrum management requirements•High density of links within the network
These factors are, by no means, unique to this particular network and reflect the typical environment in which networks around the world have to operate.
It is emphasized that the only change made to the network was to remove the Class 3 antennas and replace them with a Class 4 Sentinel antenna of the same size and frequency.
The modulation index of each link was noted:
•Ranging from 4 QAM to 256 QAM (in this network)•The Class 3 links were analyzed in an unfaded state (the ETSI term is “nominal
mode of links”)•Keep in mind: a radio will naturally rise up to the fastest data rate (modulation index)
as a function of interference (an opportunity for more traffic potential—see “Future work” section below)
Comsearch’s iQ.link® XG, an industry-leading microwave planning and optimization tool, was used to model and analyze the network.
Figure 1: ETSI Class 4 radiation pattern envelope and measurements for a 38GHz Sentinel antenna

6
MethodologyThe below steps were carried out on iQ.link® XG for analysis of this network data:
1. The engineering reference on every microwave radio was set to the highest order modulation scheme allowed on the links.
2. An interference check was performed on the original network (using Class 3 antennas) to batch calculate the cumulative threshold degradation (TD). As stated earlier, this is caused by network interference (low C/I ratio).
3. The link unavailability/outage was then calculated, highlighting the effect of decreased fade margin on link availability.
4. The existing ETSI Class 3 antennas were then replaced with Andrew Solutions Sentinel ETSI Class 4 antennas as follows:
Original ETSI Class antennas Sentinel ETSI Class 4 antennas
Frequency band
Diameter Polarization Type Frequency band
Diameter Polarization
38 GHz 0.3 m / 1 ft. Single SHP1-38 38 GHz 0.3 m / 1 ft. Single
38 GHz 0.3 m / 1 ft. Dual SHPX1-38 38 GHz 0.3 m / 1 ft. Dual
38 GHz 0.6 m / 2 ft. Single SHP2-38 38 GHz 0.6 m / 2 ft. Single
38 GHz 0.6 m / 2 ft. Dual SHPX2-38 38 GHz 0.6 m / 2 ft. Dual
5. The interference check was then repeated on the revised network, calculating the cumulative TD due to the network interference.
6. The link unavailability/outage on the network with Sentinel antennas was then calculated, and the results were compared against those recorded with the ETSI Class 3 antennas.
Threshold degradation resultsThreshold degradation measures a reduction of fade margin on a link and, thus, corresponds to a decline in the link data rate. The threshold of the ACM shift point was used to calculate the fade margin of the highest modulation.
Table 1 shows the number of links and the distribution of TD in the receivers before and after the Sentinel antenna implementation.
Threshold degradation (TD) Before antenna swap # of radios (receivers)
After Sentinel antenna swap # of radios (receivers)
0 dB, no interference cases 1584 1776
0 < TD ≤ 0.4 dB 285 214
0.4 < TD ≤ 1 dB 105 42
1 < TD ≤ 2 dB 53 30
2 < TD ≤ 3 dB 21 10
3 < TD ≤ 5 dB 22 8
5 < TD ≤ 10 dB 20 13
TD > 10 dB 6 3
Table 1

7
•The total number of receivers with no interference increased from 1584 to 1776 when replaced by Sentinel antennas
•The number of receivers with TD between 0 dB and 0.4 dB decreased from 285 to 214•The number of receivers with TD between 0.4 dB and 1.0 dB decreased from 105 to 42•The number of receivers with TD between 1.0 dB and 2.0 dB decreased from 53 to 30
Table 2 summarizes the TD from both ends of the links and the average outage improvement per year after the Sentinel antenna implementation.
The annual outage is defined as the time that the radio operates below the design capacity level in a time period of 12 months (e.g. 99.999%).
Sum of threshold degradations (TD)
Average annual outage before swap, seconds
Average annual outage after swap, seconds
Average annual outage improvement, seconds
0 dB, no interference cases 2124.69 s 1868.99 s 255.7 s
0 < TD ≤ 0.4 dB 1458.22 s 1215.01 s 243.2 s
0.4 < TD ≤ 1 dB 1790.85 s 1461.49 s 329.4 s
1 < TD ≤ 2 dB 1507.64 s 1125.34 s 382.3 s
2 < TD ≤ 3 dB 2194.83 s 1598.78 s 596.0 s
3 < TD ≤ 5 dB 3350.50 s 2293.90 s 1056.6 s
5 < TD ≤ 10 dB 3890.36 s 1179.91 s 2710.4 s
TD > 10 dB 4562.34 s 1880.54 s 2681.8 s
Table 2
In this network, the antenna change to Sentinel led to a significant improvement in link availability. Note that the outage seconds reduced more for higher TD values (shown in Figure 2 below).
5000
4500
4000
3500
3000
2500
2000
1500
1000
500
0
0 dBno interference cases
0 < TD ≤ 0.4 dB 0.4< TD <= 1 dB 1 < TD ≤ 2 dB
Threshold Degradation
Ave
rage
Annual O
uta
ge
(sec
)
2 < TD ≤ 3 dB 3 < TD ≤ 5 dB 5 < TD ≤ 10 dBs TD > 10 dB
Average Annual Outage, before swap (sec) Average Annual Outage after swap (sec)Class 3 Class 4
Average Annual Outage Improvement
Average Annual Outage Improvement
Class 3
Class 4
Average Annual Outage Improvement (sec)
0 dB, no interference cases 0 < TD ≤ 0.4 dB 0.4< TD <= 1 dB 1 < TD ≤ 2 dB 2 < TD ≤ 3 dB 3 < TD ≤ 5 dB 5 < TD ≤ 10 dB TD > 10 dB
255.7 s 243.2 s 329.4 s 382.3 s 596.0 s 1056.6 s 2710.4 s 2681.8 s
Figure 2: average annual outage improvement with Sentinel
8
Result—qualitative1. Deploying ETSI Class 4 antennas resulted in improved TD in the links (due to significant
reduction in the interference) compared to the existing Class 3 antennas.
2. This led to increased fade margins, causing a direct improvement in the outage seconds (of a particular modulation).
3. This provides increased link availability and allows the operator to maximize the size of backhaul pipe available from the existing radios.
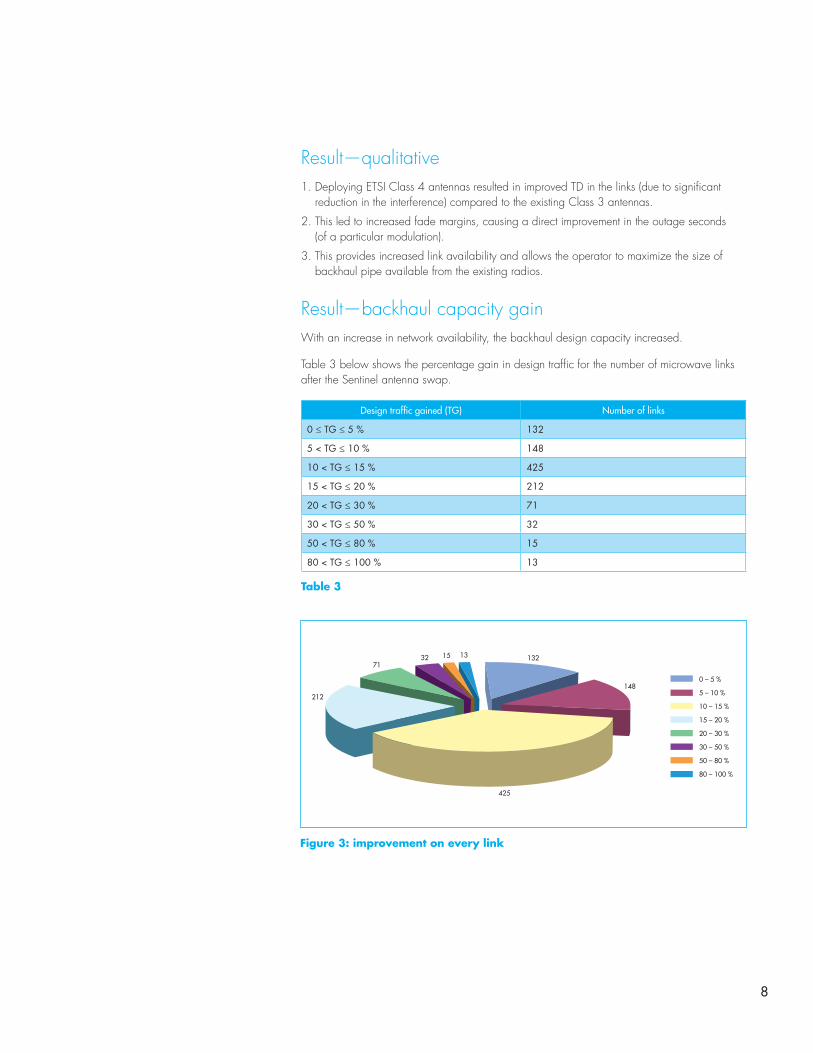
Result—backhaul capacity gainWith an increase in network availability, the backhaul design capacity increased.
Table 3 below shows the percentage gain in design traffic for the number of microwave links after the Sentinel antenna swap.
Design traffic gained (TG) Number of links
0 ≤ TG ≤ 5 % 132
5 < TG ≤ 10 % 148
10 < TG ≤ 15 % 425
15 < TG ≤ 20 % 212
20 < TG ≤ 30 % 71
30 < TG ≤ 50 % 32
50 < TG ≤ 80 % 15
80 < TG ≤ 100 % 13
Table 3
32 15 13 132
148
425
71
212
0 – 5 %
5 – 10 %
10 – 15 %
15 – 20 %
20 – 30 %
30 – 50 %
50 – 80 %
80 – 100 %
Figure 3: improvement on every link
9
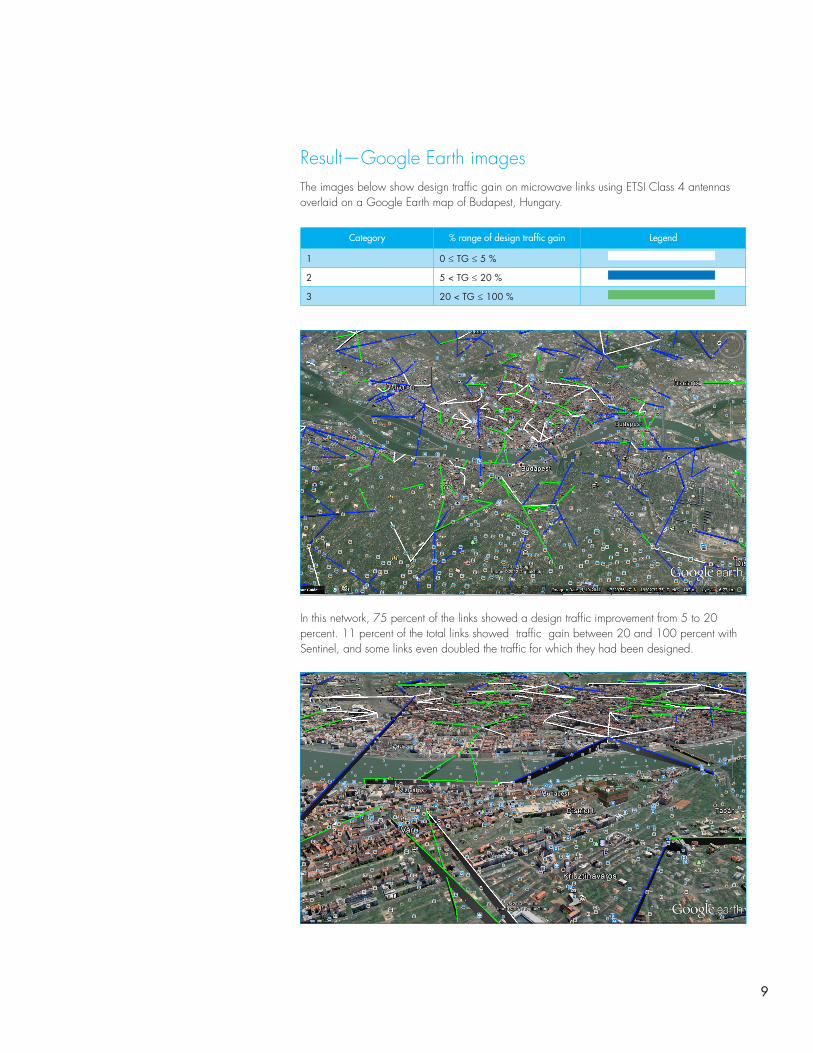
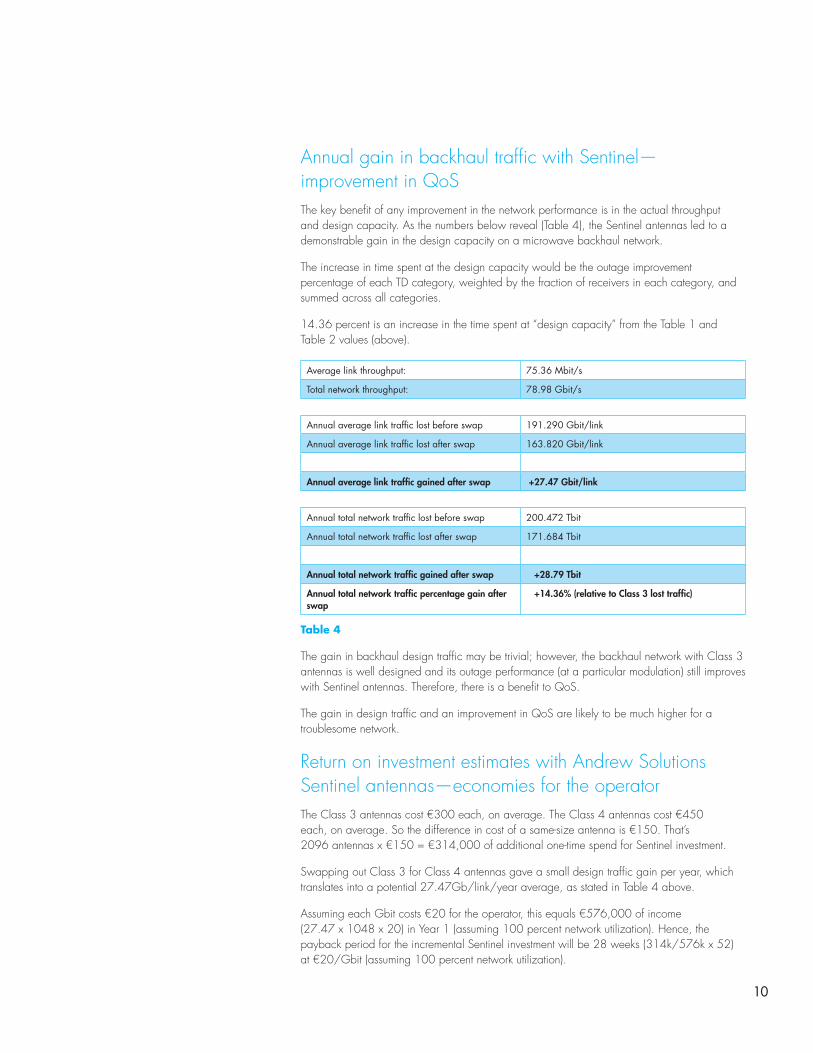
Result—Google Earth imagesThe images below show design traffic gain on microwave links using ETSI Class 4 antennas overlaid on a Google Earth map of Budapest, Hungary.
Category % range of design traffic gain Legend
1 0 ≤ TG ≤ 5 %
2 5 < TG ≤ 20 %
3 20 < TG ≤ 100 %
In this network, 75 percent of the links showed a design traffic improvement from 5 to 20 percent. 11 percent of the total links showed traffic gain between 20 and 100 percent with Sentinel, and some links even doubled the traffic for which they had been designed.
10
Annual gain in backhaul traffic with Sentinel— improvement in QoS The key benefit of any improvement in the network performance is in the actual throughput and design capacity. As the numbers below reveal (Table 4), the Sentinel antennas led to a demonstrable gain in the design capacity on a microwave backhaul network.
The increase in time spent at the design capacity would be the outage improvement percentage of each TD category, weighted by the fraction of receivers in each category, and summed across all categories.
14.36 percent is an increase in the time spent at “design capacity” from the Table 1 and Table 2 values (above).
Average link throughput: 75.36 Mbit/s
Total network throughput: 78.98 Gbit/s
Annual average link traffic lost before swap 191.290 Gbit/link
Annual average link traffic lost after swap 163.820 Gbit/link
Annual average link traffic gained after swap +27.47 Gbit/link
Annual total network traffic lost before swap 200.472 Tbit
Annual total network traffic lost after swap 171.684 Tbit
Annual total network traffic gained after swap +28.79 Tbit
Annual total network traffic percentage gain after swap
+14.36% (relative to Class 3 lost traffic)
Table 4
The gain in backhaul design traffic may be trivial; however, the backhaul network with Class 3 antennas is well designed and its outage performance (at a particular modulation) still improves with Sentinel antennas. Therefore, there is a benefit to QoS.
The gain in design traffic and an improvement in QoS are likely to be much higher for a troublesome network.
Return on investment estimates with Andrew Solutions Sentinel antennas—economies for the operatorThe Class 3 antennas cost €300 each, on average. The Class 4 antennas cost €450 each, on average. So the difference in cost of a same-size antenna is €150. That’s 2096 antennas x €150 = €314,000 of additional one-time spend for Sentinel investment.
Swapping out Class 3 for Class 4 antennas gave a small design traffic gain per year, which translates into a potential 27.47Gb/link/year average, as stated in Table 4 above.
Assuming each Gbit costs €20 for the operator, this equals €576,000 of income (27.47 x 1048 x 20) in Year 1 (assuming 100 percent network utilization). Hence, the payback period for the incremental Sentinel investment will be 28 weeks (314k/576k x 52) at €20/Gbit (assuming 100 percent network utilization).
11
The five-year return potential will be €2,566,000 ((€576,000 x 5) - €314,000) at 100 percent network utilization.
Clearly, assumptions were used in developing the financial aspects of this case study. The traffic gain is a very subjective way to justify changing a network from Class 3 to Class 4 antennas and will draw a lot of discussion. The densification of links (capacity) is a better route to illustrating Class 4 traffic advantages.
Future workThe microwave backhaul network could be designed with Sentinel Class 4 antennas from the start. This would allow the C/I benefit of Class 4 antennas to enable larger backhaul pipes, i.e. more traffic potential.
The potential traffic gain with Sentinel Class 4 antennas could be further examined by generating the entire data set of time predicted to be spent at each ACM level for each link, both for the original design and after swapping the antennas. Then, the predicted link and network traffic lost and gained could be determined explicitly from the data.
Alternatively, the microwave backhaul network could be redesigned with Sentinel, allowing the C/I benefit to enable the use of smaller antennas. To get the same or better link throughput as Class 3, the Class 4 antennas could be, on average, smaller in diameter. Therefore, installation time and cost would be less; warehousing and freight bills should decrease; and tower lease charges would drop due to smaller antennas. This would result in substantial cost savings for the operator.
For some operators, QoS improvements may be the area for focus where they could look at improving the link availability through the deployment of Sentinel antennas.
ConclusionRecent advances in microwave antenna engineering and manufacturing have allowed new high-performance (very low side lobe) point-to-point antennas to become available at price points that permit their use in the mainstream of network design rather than consigning them to their historical niche roles. The antennas evaluated in this paper are the ETSI Class 4 compliant Andrew Solutions Sentinel antennas.
This paper has shown, through the use of a case study on an existing network, that network operators can achieve substantial capacity, QoS and TCO improvements.
A potential financial return over five years of €2,566,000 based on availability improvement has been shown with a potential recovery of the initial investment in Sentinel antennas of 28 weeks. It has also been demonstrated that, if a network was designed using Sentinel Class 4 antennas from the outset, even greater benefits could be realized in terms of network density, tower lease savings and QoS.
www.commscope.comVisit our website or contact your local CommScope representative for more information.
© 2013 CommScope, Inc. All rights reserved.
All trademarks identified by ® or ™ are registered trademarks or trademarks, respectively, of CommScope, Inc. This document is for planning purposes only and is not intended to modify or supplement any specifications or warranties relating to CommScope products or services.
WP-107246-EN (11/13)