
Innovation, appropriation and new firm formation in ... · Innovation, appropriation and new firm...
17
Innovation, appropriation and new firm formation in European regions Michal Kazimierczak, EUIPO and UNU-MERIT Rene Belderbos, KU Leuven and UNU-MERIT Micheline Goedhuys, UNU-MERIT IP Statistics for Decision Makers Conference, Mexico City, 15 November 2017
Transcript of Innovation, appropriation and new firm formation in ... · Innovation, appropriation and new firm...

Innovation, appropriation and new firm formation in
European regions
Michal Kazimierczak, EUIPO and UNU-MERIT
Rene Belderbos, KU Leuven and UNU-MERIT
Micheline Goedhuys, UNU-MERIT
IP Statistics for Decision Makers Conference,
Mexico City, 15 November 2017

Research context
• Field of entrepreneurship research defined as “the scholarly examination of how, by whom, and with what effects opportunities to create future goods and services are discovered, evaluated and exploited” (Shane and Venkataraman, 2000);
• Endogenous Entrepreneurship Hypothesis- Knowledge Spillovers Theory of Entrepreneurship (Audretsch 1995).

Research context
• Knowledge spillovers:
– geographical proximity;
• tacitness of knowledge (Polanyi 1966) and crucial role of know-how (Von Hippel 1988) make geographical proximity an important factor for knowledge spillovers (Kogut and Zander 1992);
– cognitive proximity (Boschma 2005, van Ort et al. 2013).

Research context
• Innovation, market rivalry and appropriation – Incumbents aim to shield knowledge and increase appropriation
using various strategies (Belderbos and Sommers 2015);
– Branding and trademark registrations as a strategy enhancing appropriation (Bosworth and Rogers 2001, Greenhalgh and Rogers 2006, Crass 2014, OHIM 2015);
– Trademarking as a potentially effective strategy to complement patent protection (Rujas 1999, Llerena and Millot 2013, Thoma 2015)

Research questions
• What is the impact of local knowledge stocks (from related and own industries) on emergence of new firms?
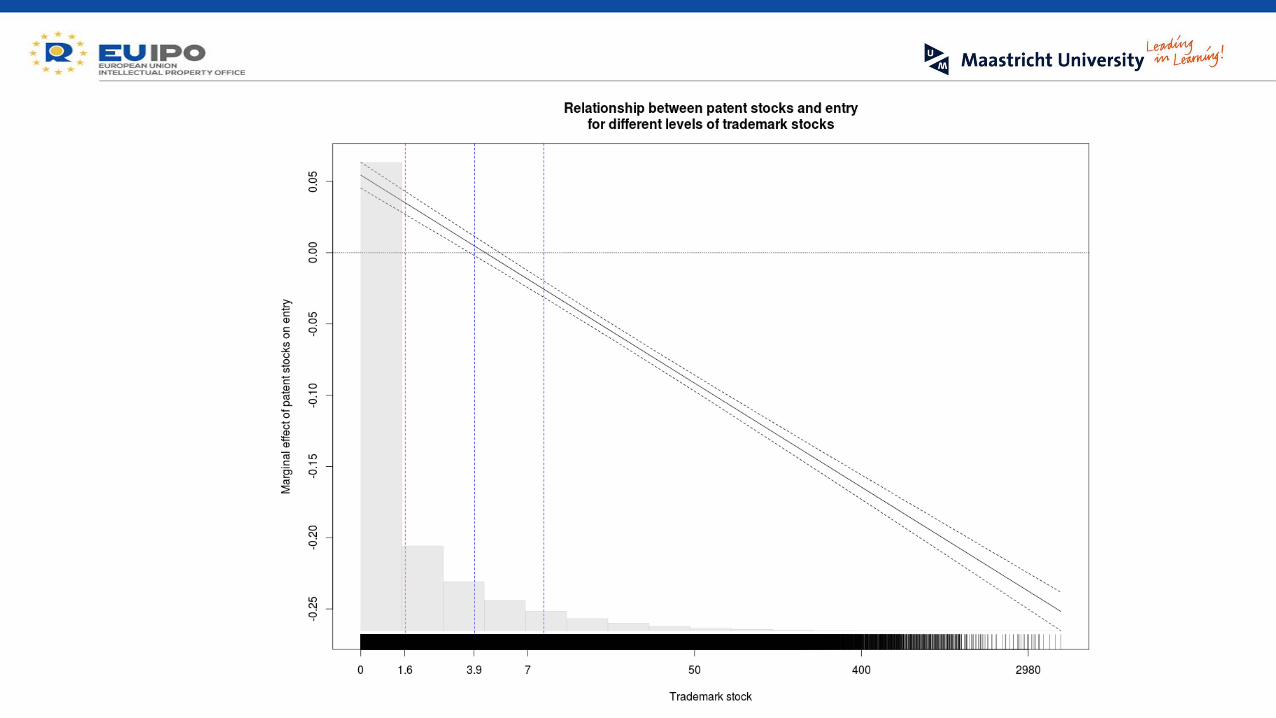
• To what extent does trademarking activity moderate the ralationship between incumbent innovation and new firm formation in the incumbents’ industries?

Data- regions and industries
• Information on number of start-ups within 292 distinct manufacturing industries (NACE 4 digit levels);
• 1025 distinct NUTS 3 regions representing 12 Member States of the European Union (AT,BE,DE,DK,ES,FR,GB,HU,IT,LT,NL,PT);
• 9 years (2001:2009);
• 2 460 976 observations.

Data- knowledge (patent applications) and trademark stocks
• Patent applications stocks;
– PS𝑡𝑟𝑗 = PStrj−1 ∗ 0.85 + P𝑡𝑟𝑗
• Trademark stocks;
– TS𝑡𝑟𝑗 = TS𝑡𝑟𝑗−1 − Te𝑡𝑟𝑗 + T𝑎𝑡𝑟𝑗
• IP stocks aggregated over focal NUTS 3 and neighbouring regions located within 200 km from the NUTS 3 centroid;
• Incumbents’ appropriation strategy measured via interaction between patent applications and trademark stocks.

Research design- relatedness measure
Sections Classes Subclasses Groups Subgroups
No of observations 8 121 630 6904 59 621
𝑇𝐸𝐶𝐻𝑖𝑗𝐽 =
𝐹𝑖𝐹𝑗′
(𝐹𝑖𝐹𝑖′)12 (𝐹𝑗𝐹𝑗
′)12

Research design- relatedness measure
𝑅𝑃𝑟𝑖𝑡 = 𝑤𝑖𝑗𝑃𝑟𝑗𝑡𝑛𝑗=1

Manufacture of power-driven hand tools (NACE 2824)
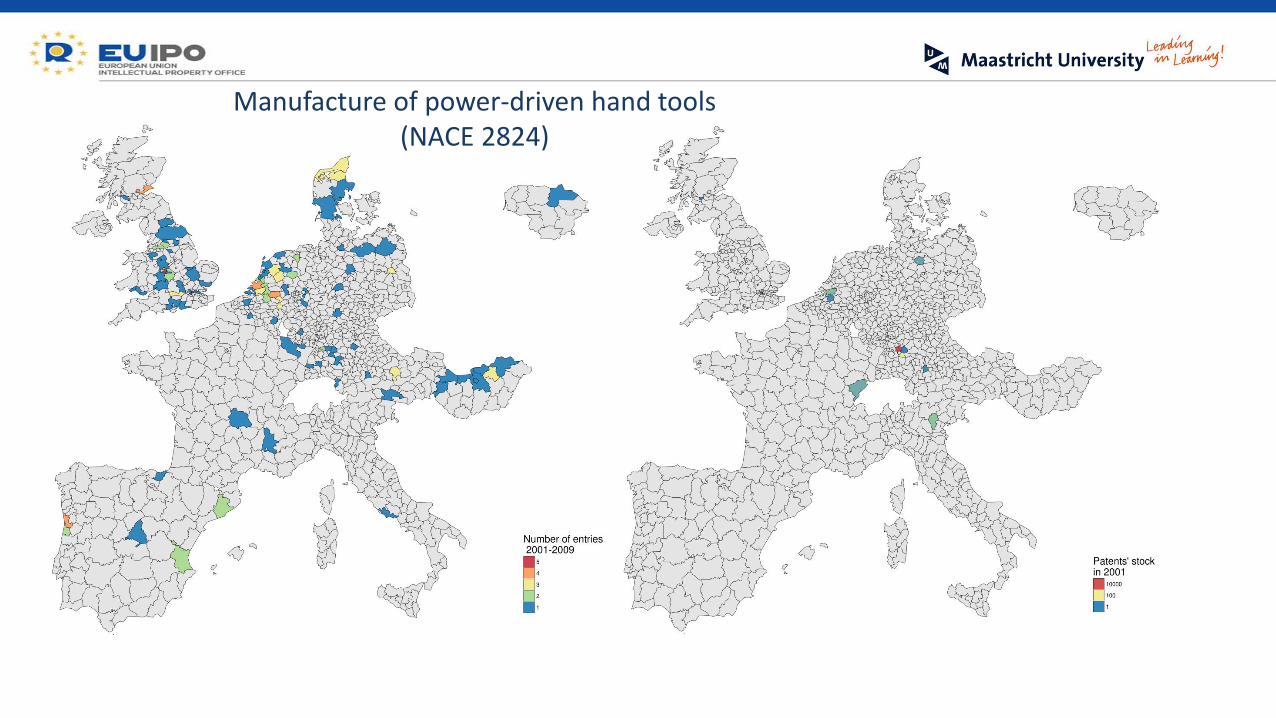
Manufacture of power-driven hand tools (NACE 2824)

Manufacture of power-driven hand tools (NACE 2824)

Manufacture of power-driven hand tools (NACE 2824)

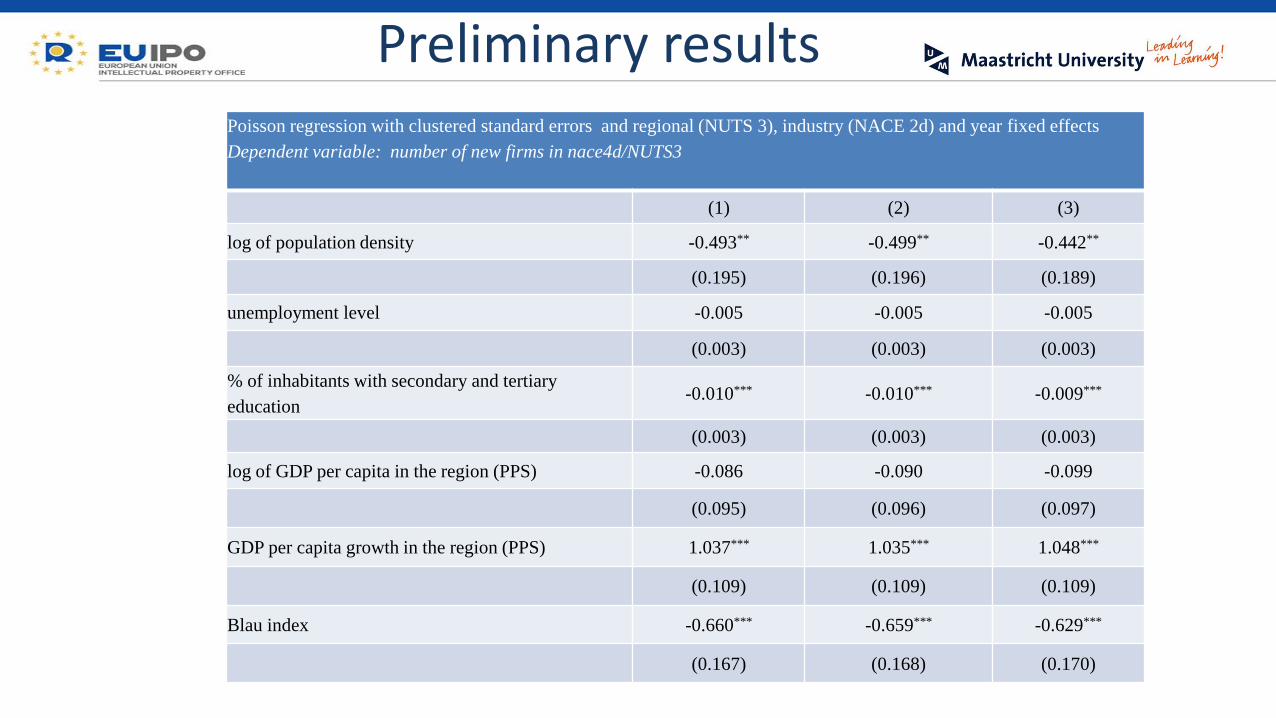
Preliminary results Poisson regression with clustered standard errors and regional (NUTS 3), industry (NACE 2d) and year fixed effects
Dependent variable: number of new firms in nace4d/NUTS3
(1) (2) (3)
log of patent stock in related industries (lag 1) 0.186*** 0.186*** 0.173***
(0.012) (0.012) (0.012)
log of patent stock in own industry (lag 1) -0.056*** -0.062*** 0.035***
(0.007) (0.008) (0.012)
log of trademark stocks in own industry (lag 1) 0.011 0.028***
(0.008) (0.009)
interaction between patent and trademarks stocks
(own industry) -0.036***
(0.005)
share of new firms in patenting activity 0.251*** 0.252*** 0.230***
(0.019) (0.020) (0.019)
log of incumbents’ number (NACE/NUTS) 1.084*** 1.080*** 1.075***
(0.006) (0.007) (0.008)
Preliminary results Poisson regression with clustered standard errors and regional (NUTS 3), industry (NACE 2d) and year fixed effects
Dependent variable: number of new firms in nace4d/NUTS3
(1) (2) (3)
log of population density -0.493** -0.499** -0.442**
(0.195) (0.196) (0.189)
unemployment level -0.005 -0.005 -0.005
(0.003) (0.003) (0.003)
% of inhabitants with secondary and tertiary
education -0.010*** -0.010*** -0.009***
(0.003) (0.003) (0.003)
log of GDP per capita in the region (PPS) -0.086 -0.090 -0.099
(0.095) (0.096) (0.097)
GDP per capita growth in the region (PPS) 1.037*** 1.035*** 1.048***
(0.109) (0.109) (0.109)
Blau index -0.660*** -0.659*** -0.629***
(0.167) (0.168) (0.170)

Discussion • Strength of knowledge spillovers from incumbents’ innovation depends
on:
– The degree of market rivalry and technological relatedness between incumbent and potential recipient;
– Appropriation strategies of incumbents.
• Therefore it is rather innovation from incumbents active on different market, but using similar technologies, that provides entrepreneurial opportunities for entrants to explore