Innovation and Diversification Driving Growth
46
www.airboss.com Investor Presentation | September 2021 Innovation and Diversification Driving Growth
Transcript of Innovation and Diversification Driving Growth

ww
w.a
irb
oss.c
om
Investor Presentation | September 2021
Innovation and Diversification
Driving Growth
Air
Bo
ss
of A
me
rica
|
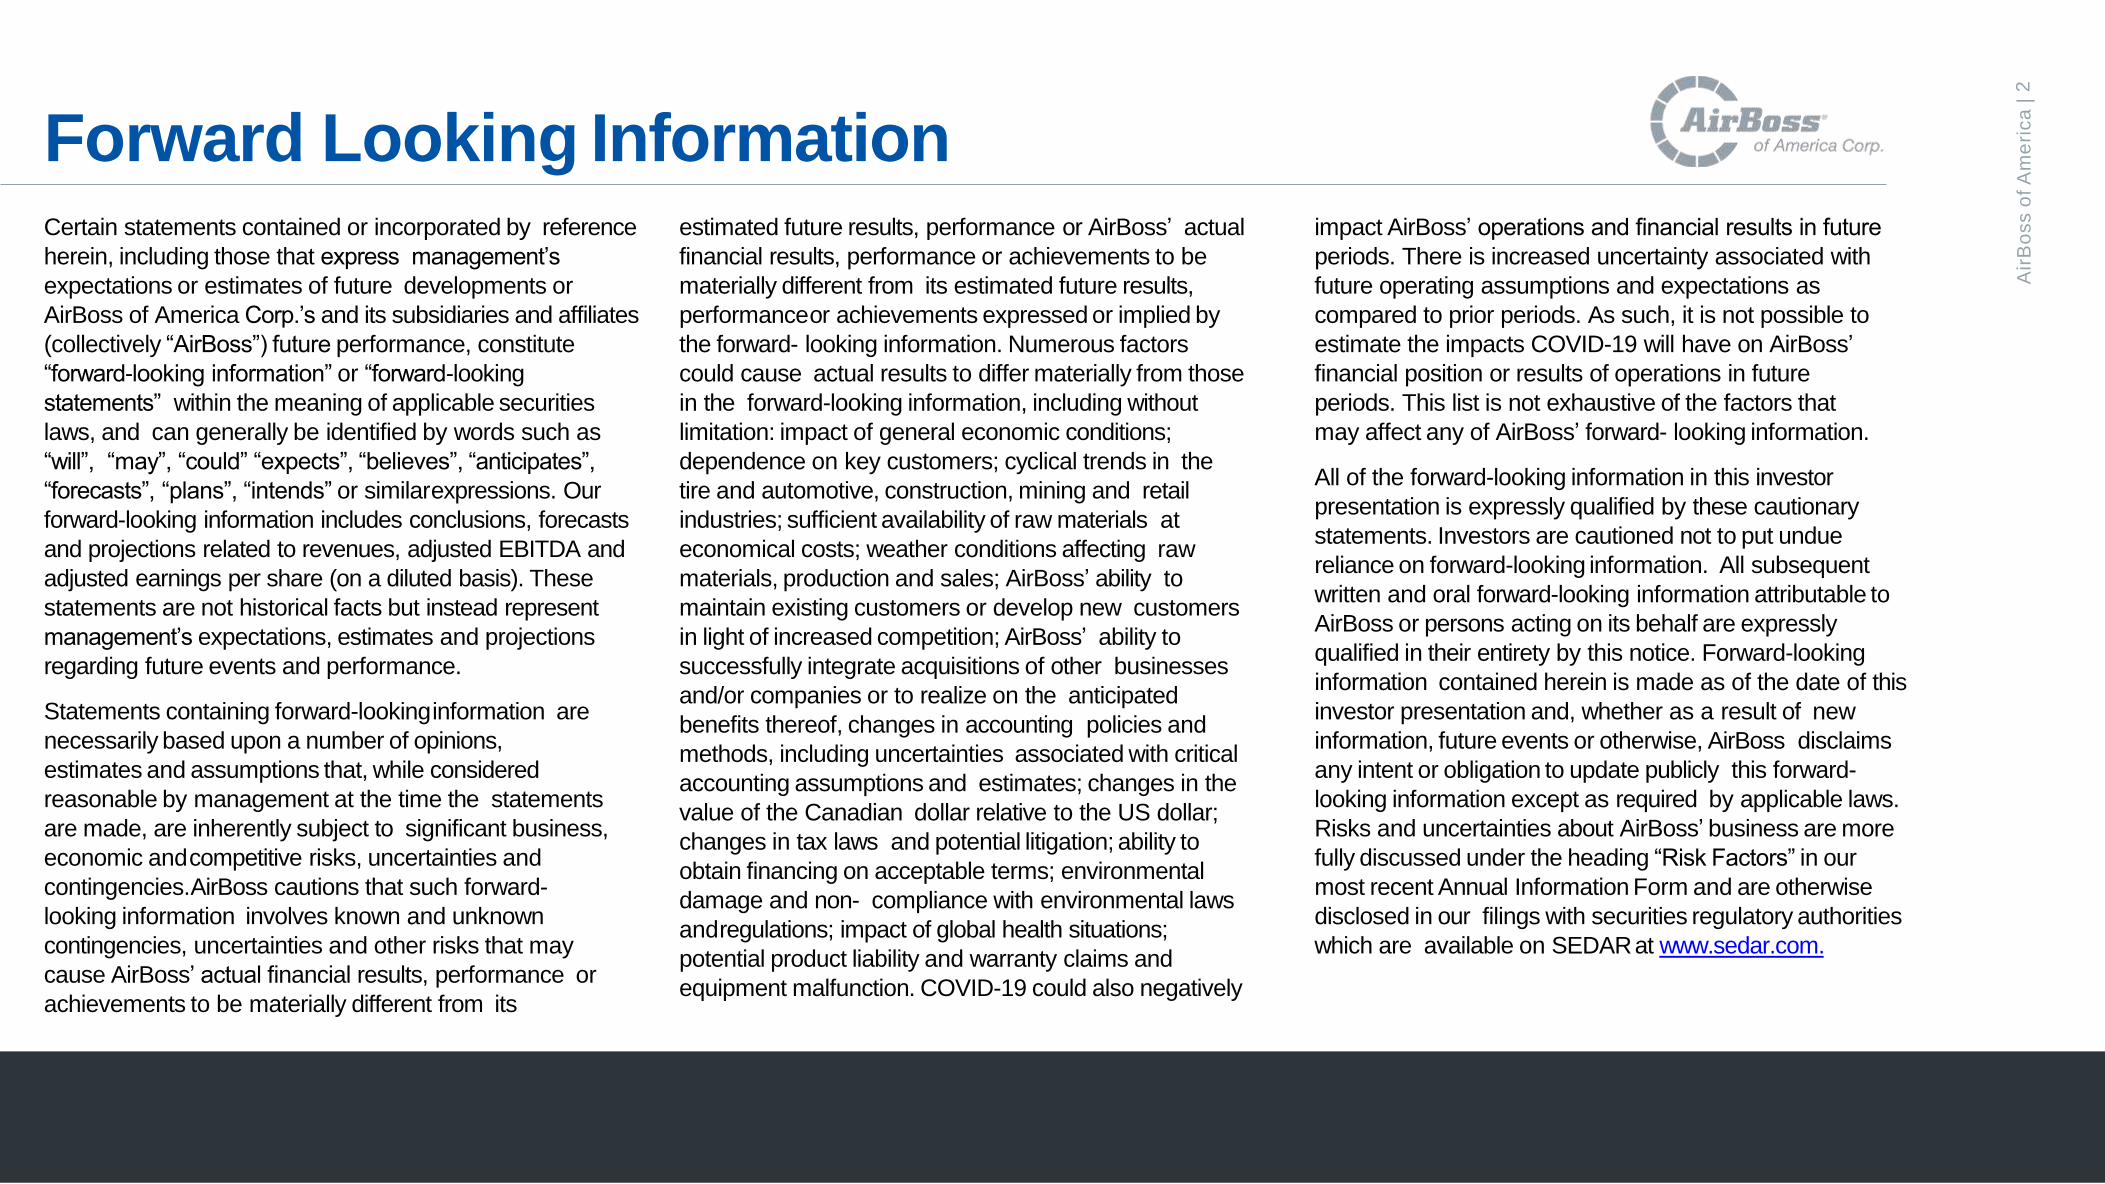
Forward Looking InformationCertain statements contained or incorporated by reference
herein, including those that express management’s
expectations or estimates of future developments or
AirBoss of America Corp.’s and its subsidiaries and affiliates
(collectively “AirBoss”) future performance, constitute
“forward-looking information” or “forward-looking
statements” within the meaning of applicable securities
laws, and can generally be identified by words such as
“will”, “may”, “could” “expects”, “believes”, “anticipates”,
“forecasts”, “plans”, “intends” or similarexpressions. Our
forward-looking information includes conclusions, forecasts
and projections related to revenues, adjusted EBITDA and
adjusted earnings per share (on a diluted basis). These
statements are not historical facts but instead represent
management’s expectations, estimates and projections
regarding future events and performance.
Statements containing forward-lookinginformation are
necessarily based upon a number of opinions,
estimates and assumptions that, while considered
reasonable by management at the time the statements
are made, are inherently subject to significant business,
economic andcompetitive risks, uncertainties and
contingencies.AirBoss cautions that such forward-
looking information involves known and unknown
contingencies, uncertainties and other risks that may
cause AirBoss’ actual financial results, performance or
achievements to be materially different from its
estimated future results, performance or AirBoss’ actual
financial results, performance or achievements to be
materially different from its estimated future results,
performanceor achievements expressed or implied by
the forward- looking information. Numerous factors
could cause actual results to differ materially from those
in the forward-looking information, including without
limitation: impact of general economic conditions;
dependence on key customers; cyclical trends in the
tire and automotive, construction, mining and retail
industries; sufficient availability of raw materials at
economical costs; weather conditions affecting raw
materials, production and sales; AirBoss’ ability to
maintain existing customers or develop new customers
in light of increased competition; AirBoss’ ability to
successfully integrate acquisitions of other businesses
and/or companies or to realize on the anticipated
benefits thereof, changes in accounting policies and
methods, including uncertainties associated with critical
accounting assumptions and estimates; changes in the
value of the Canadian dollar relative to the US dollar;
changes in tax laws and potential litigation; ability to
obtain financing on acceptable terms; environmental
damage and non- compliance with environmental laws
andregulations; impact of global health situations;
potential product liability and warranty claims and
equipment malfunction. COVID-19 could also negatively
impact AirBoss’ operations and financial results in future
periods. There is increased uncertainty associated with
future operating assumptions and expectations as
compared to prior periods. As such, it is not possible to
estimate the impacts COVID-19 will have on AirBoss’
financial position or results of operations in future
periods. This list is not exhaustive of the factors that
may affect any of AirBoss’ forward- looking information.
All of the forward-looking information in this investor
presentation is expressly qualified by these cautionary
statements. Investors are cautioned not to put undue
reliance on forward-looking information. All subsequent
written and oral forward-looking information attributable to
AirBoss or persons acting on its behalf are expressly
qualified in their entirety by this notice. Forward-looking
information contained herein is made as of the date of this
investor presentation and, whether as a result of new
information, future events or otherwise, AirBoss disclaims
any intent or obligation to update publicly this forward-
looking information except as required by applicable laws.
Risks and uncertainties about AirBoss’ business are more
fully discussed under the heading “Risk Factors” in our
most recent Annual Information Form and are otherwise
disclosed in our filings with securities regulatory authorities
which are available on SEDARat www.sedar.com.
2

Air
Bo
ss
of A
me
rica
|
Disclaimers
This presentation has been prepared by AirBoss of America Corp. (“AirBoss”) for the
sole purpose of providing preliminary information regarding AirBoss and its subsidiaries
and is not intended to provide all available information about AirBoss. The material
presented is not intended to modify, qualify, supplement or amend any information
disclosed under corporate and securities legislation of any jurisdiction and should not
be relied upon as a representation of any matter that a potential investor should
consider in evaluating AirBoss or used for the purposes of making investment
decisions concerning AirBoss Securities.
This presentation is not intended as and shall not constitute an offer, invitation,
solicitation, or recommendation with respect to the purchase or sale of any securities
of AirBoss in anyjurisdiction.
Currency
All $ figures in USD unless otherwise indicated.
Non-IFRS Financial Measures
Within this presentation, AirBoss may disclose financial measures such as EBITDA,
Adjusted EBITDA and Adjusted profit attributable to owners of the Company and
Adjusted Diluted Earnings Per Share, Free Cash Flow and Net Debt. These measures
do not have any standardized meanings prescribed by IFRS. Such measures are
neither required by, nor calculated in accordance with IFRS, and therefore are
considered Non-IFRS financial measures. AirBoss discloses these measures as
financial measurements used by interested parties and investors to monitor the ability of
an issuer to generate cash from operations for debt service, financing working capital
and capital expenditures and paying dividends. Such measures should not be
considered as an alternative to, or more meaningful than, net income (or any other
IFRS financial measure) as an indicator of the company’s performance. Reconciliations
of net income to EBITDA and Adjusted EBITDA, net income to Adjusted Profit
attributable to owners of the Company and Adjusted earnings per share, loans and
borrowings to Net Debt and net cash provided by (used in) operating activities to
Free Cash Flow are presented in this presentation.
EBITDA represents earnings before interest income, interest expense, income taxes,
depreciation, amortization, and impairment.
3

Air
Bo
ss
of A
me
rica
|
RUBBER
EVERYWHERE
ESSENTIAL
SUSTAINABLE
4

Air
Bo
ss
of A
me
rica
|
ExtrudeRubber shaped through adie
MoldRubber cast into finalshape
VulcanizeHeat and sulphur enhancestrength and flexibility offinished product
RecycleAirBoss repurposesrubber to reducescrap
Transforming Rubber
SustainablyGrowRubber trees commercially grown on a plantation
HarvestTrees tapped forsap
RefineRaw rubber consolidated for export
StrainRemoves impurities forspecialty applications
FormatRubber sized to customerspecs
CalendarCompounded rubberflattened
CompoundMixing creates friction and
heat
FormulateAdd Carbon Black,Accelerators, Chemicals, Oils
AirBoss adds significant
value to raw rubber
through compounding
Finished Products
AirBoss makes
finished survivability &
anti-vibration products
Compounded RubberRaw Rubber
AirBoss’s scale enables direct
sourcing of rubber and raw materials
through global supply chain
5

Air
Bo
ss
of A
me
rica
|
Multiple Customer Channels
Innovator in Anti-
Vibration ComponentsADG is
SurvivabilityLeader in Custom
Rubber Compounding
Sectors served:
• Defense
• Security
• Medical Personnel
• First Responders
Sectors served:
• Tire & Track
• Energy & Oil
• Building & Construction
• Aerospace & Defense
• Mining
• Automotive
• Water Treatment
Sectors served:
• Automotive
• Other Transportation
• Defense
Leveraging compoundingcapabilities and customer-base
6

Air
Bo
ss
of A
me
rica
|7
Significant savings and synergies across the organization
Three Strategically Integrated SegmentsAirBoss of America -
President
Purchasing & Supply Chain Legal Corporate Finance Human Resources IT
ADG CEO SVP & General Manager SVP & General Manager
Shared
Services Model
Coordinated
Management Team
Compounded Rubber
Material R&D
Compounded Rubber
Material R&D
Surge Manufacturing Capacity for Defense Products
Plant Management in QC
Sharing of best practices Interdivisional transfer of employees & expertise Logistics & back-office integration
Integrated
Structure Across
Groups

A consistent cycle of innovation,
improvement and efficiency Air
Bo
ss
of A
me
rica
|8
• 50 Engineers/Chemists
collaborating with
customers on new
products
• Ongoing commitment to
innovative, higher margin
products
• Aids attraction and
retention of best talent
EngineeringUnderstanding how to develop products to perform in the most challenging environments
ChemistryConstantly testing and evaluating ingredients to ensure outperformance and reduce environmental impact
CompoundingDecades of compounding expertise ensures consistency at scale
ManufacturingLatest technology and scalable infrastructure ensure efficiency and on-time delivery
Applications Thousands of products suited to a range of applications and sectors globally
Expertise, innovation and diversification is building a global leader
State-of-the-Art R&D and Manufacturing

Air
Bo
ss
of A
me
rica
|
Domestic manufacturing capacity advantage post COVID
Strong North AmericanPresence
High QualityAsset Base
Newmarket, ON
Kitchener, ON
Auburn Hills, MI
Jessup, MD
Scotland Neck, NC
Acton-Vale, PQ
Kuala Lumpur,
Malaysia
Charleston, SC
Facility Square Feet
(000’s)
Own/Lease
Newmarket, ON 6 Lease
Kitchener, ON 1,000 Own
Acton-Vale, PQ 260 Own
Auburn Hills, MI 275 Lease
Jessup, MD 105 Lease
Scotland Neck, NC 150 Own
Rock Hill, SC 40 Lease
Chicago, IL 24 Lease
Charleston, SC 14 Lease
Rochester, NY 2.5 Lease
Kuala Lumpur 300 JV
Total 2,177 -
Head Office
Research Facility
Compounding/Mixing
Engineered Products
AirBoss Defense Group
9
Rochester, NY
Rock Hill, SC
Chicago, IL
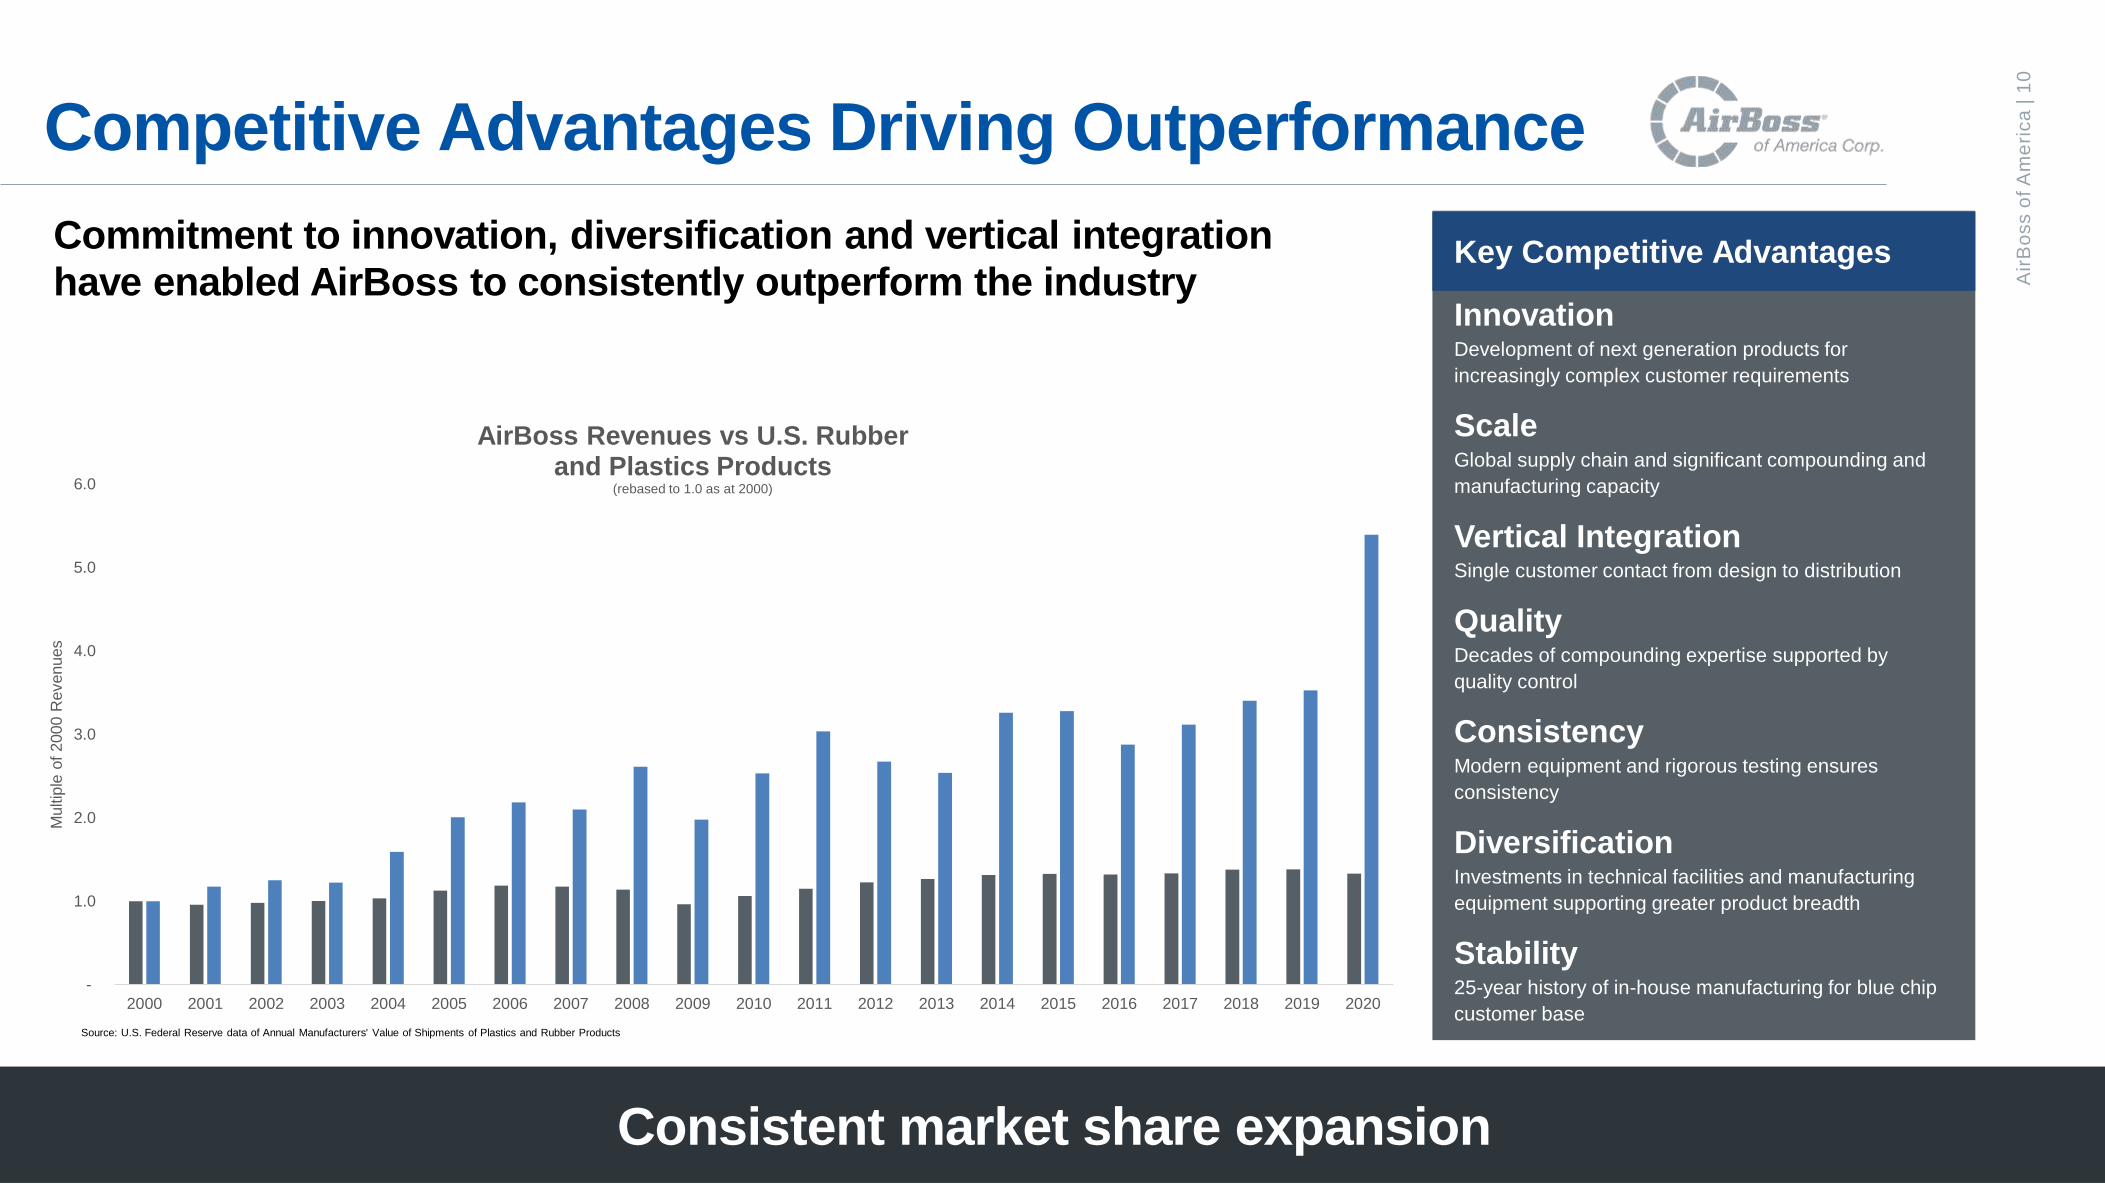
Key Competitive Advantages
InnovationDevelopment of next generation products for
increasingly complex customer requirements
ScaleGlobal supply chain and significant compounding and
manufacturing capacity
Vertical IntegrationSingle customer contact from design to distribution
QualityDecades of compounding expertise supported by
quality control
ConsistencyModern equipment and rigorous testing ensures
consistency
DiversificationInvestments in technical facilities and manufacturing
equipment supporting greater product breadth
Stability25-year history of in-house manufacturing for blue chip
customer base
Competitive Advantages Driving Outperformance
-
1.0
2.0
3.0
4.0
5.0
6.0
2000 2001 2002 2003 2004 2005 2006 2007 2008 2009 2010 2011 2012 2013 2014 2015 2016 2017 2018 2019 2020
Multip
le o
f 2000 R
evenues
AirBoss Revenues vs U.S. Rubber and Plastics Products
(rebased to 1.0 as at 2000)
Source: U.S. Federal Reserve data of Annual Manufacturers' Value of Shipments of Plastics and Rubber Products
Commitment to innovation, diversification and vertical integration
have enabled AirBoss to consistently outperform the industry
Consistent market share expansion
10
Air
Bo
ss
of A
me
rica
|

Profitable Growth through Multiple Economic Cycles
Note: 2021E represents midpoint of Company’s guidance for 2021 revenues and Adjusted earnings per diluted share; prior years are IFRS net income (loss) per diluted share
2020 was 25th consecutive
year of operating profitability
due to:
1. Consistent review of products and lines to
focus on areas where AirBoss can leverage
its innovation and competitive advantages
2. Cultivated diversification of customer sectors
to mitigate risk of economic and contractual
cycles and develop natural hedges
3. Strategic acquisitions to bolster capabilities in target sectors
Strong double-digit CAGR in top and bottom line
$(0.20)
$-
$0.20
$0.40
$0.60
$0.80
$1.00
$1.20
$1.40
$1.60
$1.80
$2.00
$2.20
-
50
100
150
200
250
300
350
400
450
500
550
600
650
700
750
$M
AirBoss' Historic Financial Performance
Revenues Diluted EPS
Dot.com Recession
Great Recession
Covid-19 Recession
11
Air
Bo
ss
of A
me
rica
|

Significant Expansion in Scale and Capabilities
Creation of a survivability platform
12
Air
Bo
ss
of A
me
rica
|
• Step change in AirBoss scale and capabilities achieved in 2020 through formation of
AirBoss Defense Group and acquisition of Critical Solutions Intl.
o Strategic rationale already borne out in multiple healthcare contracts
CSI
• Global leader in counter-explosive/ route
clearance
• Sales and marketing expertise
• Key government relationships
• Post-sales support and service
• Defense culture
AirBoss Defense
• Global leader in CBRN rubber PPE
• IP, R&D & Engineering
• Manufacturing
• Financial Strength

Air
Bo
ss
of A
me
rica
|
$0.37
$0.44
$1.35
2018 2019 2020
Diluted EPS $M
26 32 32
74
2018 2019 2020
Adjusted EBITDA $M
EBITDA - Major Healthcare Contracts
EBITDA
16 22 33
19 20
19 10 6
5
79
2018 2019 2020
Gross Profit $M
Airboss Defense Group - Major Healthcare Contracts
Engineered Products
Rubber Solutions
AirBoss Defense Group
73 83 117
114 120 101
129 125 102
181
2018 2019 2020
Revenues $M
Airboss Defense Group - Major Healthcare Contracts
Engineered Products
Rubber Solutions
AirBoss Defense Group
Diversity has ensured growth despite COVID
Diversification has Delivered Returns
Historical Financial Summary
Diversified provider of CBRN-E solutions
and rubber products• Leading provider of powered air purifying respirator systems (PAPRs) in U.S.
• Global leader in CBRN PPE and route clearance vehicles and survivability
products
• North America’s 2nd largest custom rubber compounder
• Diversification ensured continued growth despite COVID impact on rubber
production volume
+26%
CAGR2018-20
AirBoss Defense Group
Airboss Defense Group - Major Healthcare
Contracts
Rubber Solutions
Engineered Products
Gross Profit 2020
US
Canada
Other
Revenues by Geography 2020
7.9%9.5%
35.4%
7.2%8.3%
35.1%
2018 2019 2020
Returns
Return on Capital Employed
Return on Equity
13

Air
Bo
ss
of A
me
rica
|
2.4
1.3
2.2
1.5
1.91.7 1.9
-0.12013 2014 2015 2016 2017 2018 2019 2020
Net Leverage*
20 23
76
2018 2019 2020
CFO $M(before changes in working capital)
Growing dividend and improved financial position
Consistent Generator of Cash
Historical Uses of Cash
Strongest financial position in history• Exited 2020 in net cash position enabling potential M&A to increase
growth and sustainability of EBITDA
• Diversified operations have generated consistent cash supporting:
1. Consistent and growing dividends
2. Multiple acquisitions
3. Significant growth capital investments
• On May 12, 2021, Board approved quarterly dividend increase of 43%
to C$0.10 from C$0.07
1 Net debt less lease liabilities as at Dec. 31 / LTM EBITDA
(0.1)x
M&A
CSI in 2020Global supplier of route
clearance vehicles, countermine
capability and survivability
products to U.S. and foreign
military forces
C$0.28 per
share
C$0.28 per
share
C$0.28 per
share
14
3 7 8 1
2
4
3
9 2
1
2
1
2018 2019 2020
Capital Expenditures $M1
Intangibles
Replacement/Upgrade PP&E
Cost Saving/Operational Efficiences
Growth
1 2019 figures don’t add to actual $19.5M due to rounding
$0.00
$0.01
$0.02
$0.03
$0.04
$0.05
$0.06
$0.07
$0.08
$0.09
$0.10
2021-0
9-3
0
2020-1
2-3
1
2020-0
3-3
1
2019-0
6-2
8
2018-0
9-2
8
2017-1
2-2
9
2017-0
3-3
1
2016-0
6-3
0
2015-0
9-3
0
2014-1
2-3
1
2014-0
4-0
3
2013-0
6-2
8
2012-0
9-2
8
2011-1
2-3
1
2011-0
3-3
1
2010-0
6-3
0Quarterly Dividends C$
B3 in 2021Developer of the
revolutionary Blast
Gauge® System of
lightweight wearable blast
overpressure sensors
Ace in 2021Leading custom rubber
compounder specializing
in color compounds with
facilities in Rock Hill, SC
and Chicago, IL

15
Air
Bo
ss
of A
me
rica
|
Multiple ways to drive value
Compounding Value
Increase cash flow to fund expanded
capital allocation
Drive revenue growth
Deliver on contracts won
Cross-market existing
product lines to expanded
customer base
Leverage growing
install base to capture
recurring revenue on
consumables
Prepare for already
tendered defense
contracts
Source / develop / acquire
new defense and first
responder products
Identify and tender
new defense
contracts
Leverage investment in
automation / advanced
manufacturing
Develop and launch
new non-automotive
products
Move products up the
technical curve to solve more
complex customer challenges
Fill new capacity
in Kitchener &
Scotland Neck
Develop new specialty
compounds
Expand operations in
selected high-growth
markets
Leverage enhanced
scale to improve raw
material buying power
Near-Term Value Drivers Longer-Term Value Drivers
Identify acquisitions –
traditional and specialty
compounders
Improve
margins
Driving continuous
improvement initiatives

16
Air
Bo
ss
of A
me
rica
|
M&A Strategy
SUPPLY CHAIN
• Componentry
• Tooling & Capabilities
• Domestic production
• Value add chemical
distribution
• Component
manufacturing
• Tooling capabilities
PRODUCTS &
TECHNOLOGY
• Medical/healthcare:
Complementary
respiratory products
• CBRN: Adjacent products
• Defense Systems:
Integrated survivability
solutions
• Specialty compounding
• Alternative rubber
compounding
• Recycling or
devulcanization
technologies
• Non-automotive anti-
NVH, rubber to metal
bonding, rubber molded
products
• Hydraulic or fluid filled
NVH technologies
CUSTOMER/
SECTOR ACCESS
(incl. Sales &
Distribution)
• Healthcare distribution
• First responder
• Athletic protection
• Regional expansion (e.g.
Mid-West, Western U.S.)
• Colored and specialty
rubber compound market
access
• Defense
• Construction
• Infrastructure
Aims:
• Margin expansion
• Larger customer-base
• Improved competitive positioning
Valuation:
• ROIC/IRR Hurdle Rates
• Cost synergies across enterprise (not
necessarily at acquired entity)
Terms:
• Preference to own, or exclusive
partnerships moving to JV or M&A
(i.e. not simple minority investments)
Financing:
• Historically, M&A undertaken through
cash and/or debt, though ADG
included equity issuance component
to seller
• Debt financing to max net leverage of
4x with clear path to <2x within a few
years
Complement to organic growth

Air
Bo
ss
of A
me
rica
|
AirBoss Defense Group
ADG is Survivability
17

Air
Bo
ss
of A
me
rica
|
Threat prevention, protection, mitigation, response
Respiratory
Protection
AirBoss Defense Group
Survivability Solutions Platform
Wearable
Products
Collective
Protection &
Patient Isolation
Emerging
ProductsRoute
Clearance
Emerging
Products
Leading U.S. provider
of PAPRs
Global Leader in
Route Clearance
Global Leader in
Wearables for CBRN
18
Best Technical
Gas Mask Pioneer in Blast
Measurement
Air
Bo
ss
of A
me
rica
|
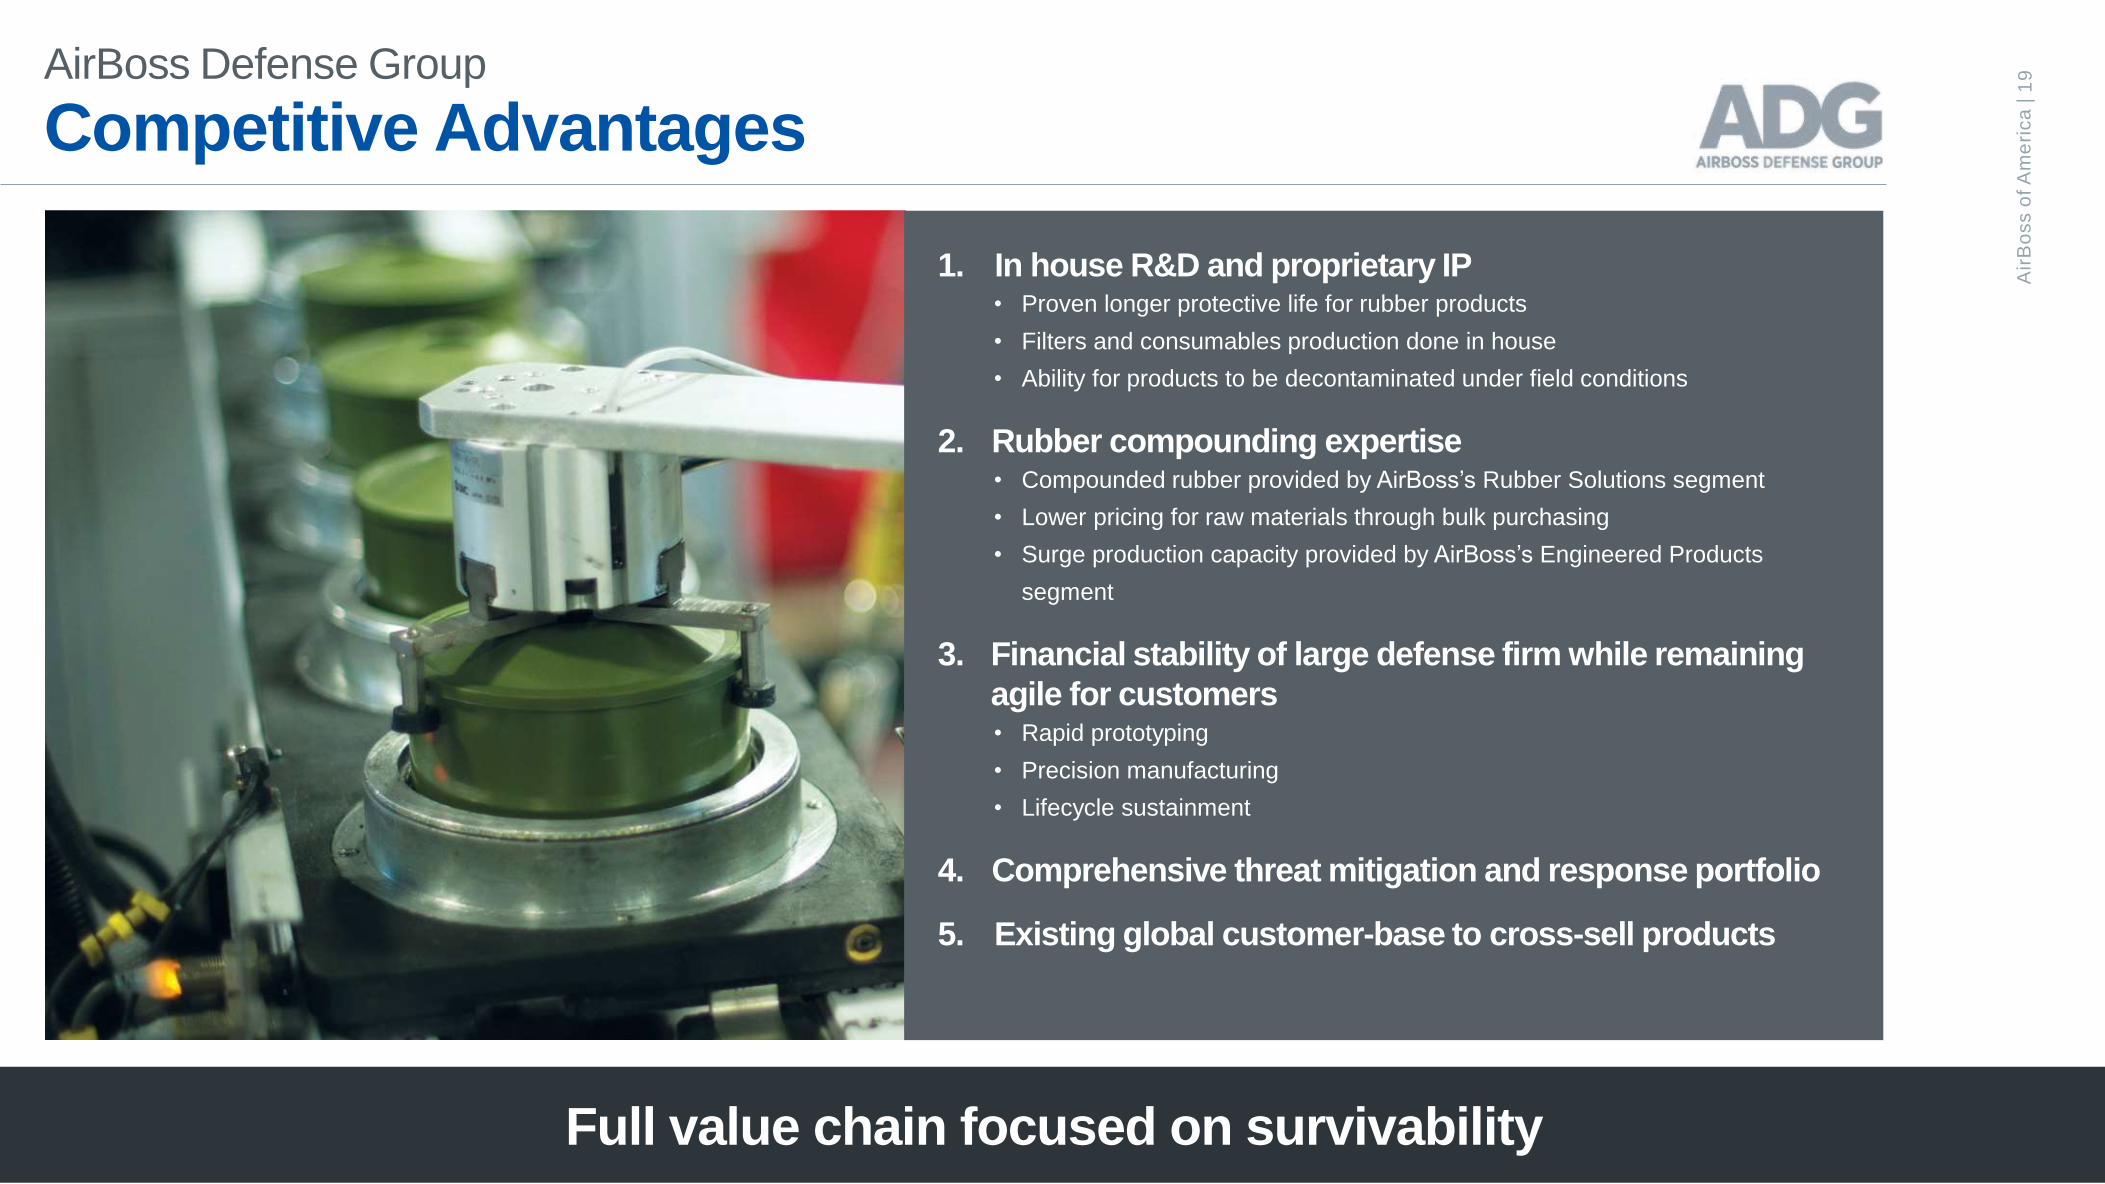
Full value chain focused on survivability
AirBoss Defense Group
Competitive Advantages
1. In house R&D and proprietary IP• Proven longer protective life for rubber products
• Filters and consumables production done in house
• Ability for products to be decontaminated under field conditions
2. Rubber compounding expertise• Compounded rubber provided by AirBoss’s Rubber Solutions segment
• Lower pricing for raw materials through bulk purchasing
• Surge production capacity provided by AirBoss’s Engineered Products
segment
3. Financial stability of large defense firm while remaining
agile for customers• Rapid prototyping
• Precision manufacturing
• Lifecycle sustainment
4. Comprehensive threat mitigation and response portfolio
5. Existing global customer-base to cross-sell products
19

Growing demand for protection of medical personnel and first responders
AirBoss Defense Group
Healthcare Solutions
Personal
Protective
Equipment
Powered
Air Purifying
Respirator
ISO-POD™ Shelters
Air
Bo
ss
of A
me
rica
|2
0

AirBoss Defense Group
Powered Air Purifying Respirator
Multiple Major Awards
FEMA
$96million
Completed Q3 2020
HHS
$121million
Completed Q2 2021
• More effective than N95 masks at filtering airborne particles
• Filters and hoods present ongoing recurring revenue
potential following supply of initial systems
• Online portal launched to deliver direct to healthcare,
manufacturing, personal care, and waste cleanup fields
150k PAPR
Systems
Delivered in past year
on time and on budget
3.6M Filters &
Accessories
Air
Bo
ss
of A
me
rica
|2
1
$220M awards in 2020

AirBoss Defense Group
Nitrile Rubber Gloves
• Purchase order valued at up to $288M received
from HHS in Q1 2021 for delivery of nitrile rubber
gloves for use in hospitals and other health care
settings
• Deliveries commenced in Q2 2021 and
anticipated to continue through 2021
• Contract directly stemming from successful
execution on PAPRs contracts and history of
providing protective and survivability solutions to
the U.S. government
• Estimated global shortage of 215 billion nitrile
gloves1 and forecast tripling of healthcare spend
on PPE by 20272
1 Health Industry Distributors Association, per https://getusppe.org/nitrile-glove-shortage/
2 Health Industry Distributors Association https://www.hida.org/distribution/research/market-reports/PPE-Market-Report.aspx
Air
Bo
ss
of A
me
rica
|2
2
Up to $288M awarded in 2021

AirBoss Defense Group
BlackBox Biometrics
• In Q2 2021, acquired BlackBox Biometrics, Inc.,
developer of revolutionary Blast Gauge® System
of lightweight wearable blast overpressure
sensors and athlete-focused Linx IAS® product,
providing real-time feedback on potential
concussion-causing impacts
• Blast Gauge currently in full field testing with U.S.
Army and in competition for SOCOM
• Bi-partisan support of U.S. Congress for military to
monitor overpressure, which is proven to
contribute to PTSD, hearing loss, sight loss, brain
damage, suicide
• Recurring revenue potential as systems are to be
replaced annually
Air
Bo
ss
of A
me
rica
|2
3
Acquisition completed Q2 2021

AirBoss Defense Group
Traditional Defense Contracts
$35.6M*Execution on contract extension with foreign military sales
customers from base contract awarded in 2017 was
valued at $132 million, 41 Husky 2G vehicle systems
were delivered with associated protected payloads
*Pseudo-Foreign Military Sales funds obligated at the time of the award, accounting for anticipated volumes of Husky 2G support
equipment to be procured over the extended period of performance, two years ending September 2022. Base contract was awarded in
2017 and valued at $132 million.
Husky 2G
vehicle system
$36.5M*
$26.7M*
*Contract maximum value if all units delivered
U.S. DoD Contracts for PPE Wearables
$15.1M*
AirBoss Molded Glove
Molded AirBossLightweight Overboot(MALO)
Extreme Cold Vapor Barrier (“Bunny”) Boot
Air
Bo
ss
of A
me
rica
|2
4
Trusted supplier to US DoD and other militaries

AirBoss Defense Group
Low Burden Gas Mask
• Latest generation CBRN mask, won recent contract
awards for Australia ($11M) and Canada (C$30M)*
• Received highest technical score for European NATO
countries in 2020 but edged out on pricing
• Working on lowering costs in preparation for upcoming U.S.
competition, and potential for supply to other European
countries including special forces
*Contract maximum value if all units delivered
Air
Bo
ss
of A
me
rica
|2
5
Best technical gas mask

33
37
28%36%
10%
20%
30%
40%
50%
60%
70%
80%
90%
100%
31
32
33
34
35
36
37
38
H1 2020 H1 2021
EBITDA $M
ADG % of Net Sales
39
46
33%45%
10%
20%
30%
40%
50%
60%
70%
80%
90%
100%
34
36
38
40
42
44
46
48
H1 2020 H1 2021
Gross Profit $M
ADG % of Net Sales
Air
Bo
ss
of A
me
rica
|
7 11 17
99
11% 15% 20%
33%
10%
20%
30%
40%
50%
60%
70%
80%
90%
100%
0
20
40
60
80
100
120
2017 2018 2019 2020
EBITDA $M
ADG % of Net Sales
64 73 83
298
2 3 3
4
2017 2018 2019 2020
Net Sales $M
External Sales Inter-Segment Sales
Targeting market share expansion
Financial Review & OutlookAirBoss Defense Group
REVIEW• H1 2021 sales decrease of 13% due to large FEMA PAPR contract
substantially completed in Q2 2020, partially offset by completion of HHS
PAPR order in H1 2021
• Gross profit and EBITDA growth driven by margin expansion partially offset
by lower volume due to FEMA contract in Q2 2020
• Obtained new purchase order with HHS for up to $288M to supply nitrile
rubber gloves, to be delivered primarily in H2 2021
• Significant growth in 2020 driven by creation of ADG, including contribution
from CSI, and subsequent major healthcare contracts with FEMA and HHS
and organic growth in other PPE lines
OUTLOOK• Continued high growth in 2021 sales including through HHS nitrile glove order
• Pursuing $1B+ in contract opportunities across survivability platform, not
including potential Blast Gauge and gas mask contract opportunities in the U.S.
• Continue to target market share expansion over medium term:
• Global CBRN-E market is estimated at $16.5B in 2020 and anticipated to grow at a
4.1% CAGR from 2020 to 20251
1 BIS Research, CBRNE Defense System Market - A Global Market and Regional Analysis: Focus on CBRNE Defense System Product
and Application, Supply Chain Analysis, and Country Analysis - Analysis and Forecast, 2020-2025
12 16 22
112 19% 21% 26%
37%
0%
20%
40%
60%
80%
100%
-
20
40
60
80
100
120
2017 2018 2019 2020
Gross Profit $M
ADG % of Net Sales
26
115
99
2
3
H1 2020 H1 2021
Net Sales $M
External Sales Inter-Segment Sales

Air
Bo
ss
of A
me
rica
|
Rubber Solutions
Leader in Custom Rubber Compounding
27

Air
Bo
ss
of A
me
rica
|
30-year operating history
North America’s 2nd Largest CustomCompounder
MILLIONpound capacity
75M lbs. added
in 2019
2017-2019
EBITDA CAGR
~500 2,000+
Rubber Solutions
Market Overview
• North American rubber
compound market estimated at
~$2B in 2019, forecast to grow
at 3.7% from 2018-251
Third-party Rubber
Compounders Landscape
1. Hexpol Group (incl. Preferred
Compounding) – combination
completed July 2019
2. AirBoss
Multiple private players
Market Share Expansion
Significant opportunity to capture
market share by becoming
secondary supplier to customers
seeking redundancy due to
Hexpol/Preferred combination
15%
1 Global Info Research, “Global Rubber Compound Market 2019 by Manufacturers, Regions, Type and Application, Forecast to 2025”
proprietary compounds
28

Air
Bo
ss
of A
me
rica
|
Significant customer and sector diversification
Diverse and Growing CustomerBase
Significant
volume from
blue chipcustomers
Volume by Sector – 2020
Rubber Solutions
• Trusted supplier with multi decade
key customer relationships
• Diversified end markets
• Stable recurring applications
exposure:• Tire and OTR/Retread not dependent
on new auto/truck sales
• ~10% volume used for internal
segments
150+customers
OTR/Retread21%
Major Tires18%
Conveyor Belts 14%
Resources12%
Track 8%
Infrastructure 6%
Anti-Vibration 6%
Industrial 5%
Niche 3%Defense 3%
Other 4%
29

Air
Bo
ss
of A
me
rica
|
Increasing profits through specialization and scale
Rubber Solutions
ARS Growth Strategy
Fill new capacity
in Kitchener &
Scotland Neck
Leverage enhanced
scale to improve raw
material buying power
Develop new
specialty
compounds
Expand operations in
selected high-growth
markets
M&A – traditional
and specialty
compounders
30

8 9
14% 11%0%
10%
20%
30%
40%
50%
60%
70%
80%
90%
100%
0
1
2
3
4
5
6
7
8
9
10
H1 2020 H1 2021
EBITDA $M
EBITDA % of Net Sales
10 11
17% 14%0%
20%
40%
60%
80%
100%
0
2
4
6
8
10
12
H1 2020 H1 2021
Gross Profit $M
Gross Profit % of Net Sales
Air
Bo
ss
of A
me
rica
|
1719
2019
15% 14% 15% 16%0%
20%
40%
60%
80%
100%
0
5
10
15
20
25
2017 2018 2019 2020
Gross Profit $M
Gross Profit % of Net Sales
94114 120
101
21
19 17
18
87
104 115
106
2017 2018 2019 2020
Rubber Lbs Sold & Net Sales
Inter-Segment Net Sales $M
External Net Sales $M
Rubber Lbs. Sold M (excludes internal)
0.70
0.75
0.80
0.85
0.90
0.95
1.00
1.05
20
19
-10
-01
20
19
-11
-01
20
19
-12
-01
20
20
-01
-01
2020
-02-0
1
20
20
-03
-01
20
20
-04
-01
20
20
-05
-01
20
20
-06
-01
20
20
-07
-01
20
20
-08
-01
20
20
-09
-01
20
20
-10
-01
20
20
-11
-01
20
20
-12
-01
U.S. Plastics and Rubber Products Manufacturing
(Source: Federal Reserve, rebased to 1 as of Oct. 2019)
AirBoss has outperformed broader N.A. industry
REVIEW
• 37% increase in net sales in H1 2021 driven by
increased customer volumes, but margins
compressed due to increased raw material and
logistics costs
• Decline in 2020 driven by COVID-related impact on
economy and industry volumes, though volumes
rebounded in back half of year
• Continued progress on filling new compounding
capacity including specialty and color
Financial Review & OutlookRubber Solutions
OUTLOOK
• Volumes improving despite global supply chain issues
impacting customer sectors
• Rebound in AirBoss’ rubber compounding anticipated following
COVID-driven declines, though timing of full recovery in
customer volumes dependent on normalization of economy
• Anticipated ARS growth to be driven by increased volume by
existing customers followed by new business
• North American custom rubber compounding market estimated
to grow at ~4% annually
+15%CAGR
Lbs. Sold
1416
19
15
12% 12% 14% 12%
0%
20%
40%
60%
80%
100%
0
5
10
15
20
2017 2018 2019 2020
EBITDA $M
EBITDA % of Net Sales
31
51
69
7
10
H1 2020 H1 2021
Net Sales $M
Inter-Segment Net Sales $M
External Net Sales $M

Air
Bo
ss
of A
me
rica
|
Engineered Products
Innovator in Anti-Vibration
32

Air
Bo
ss
of A
me
rica
|
Engineered Products
Anti-Vibration Platform
Suspension Powertrain & Drive
Steering Chassis & Exhaust
90%
HybridRubber/MetalEssential anti-vibration,noise and harshnesscomponents
of components produced by AirBoss
are for light trucks, SUVs & minivans
Leader in anti-vibration & noise-reductionsolutions
33

More technically sophisticated parts generate higher margins
Engineered Products
Focus on Efficiencies and Innovation
GROMMETS
DUST
BOOTS
JOUNCE
BUMPER
SPRING
ISOLATOR
MASS
DAMPER
STABILIZER
BAR
BUSHINGS
EXHAUST
MOUNTING
SHOCK
BUSHINGS
TOP
MOUNT
CONTROL
ARM
BUSHINGS
HYDRAULIC
BUSHINGS
HYDRAULIC
MOUNTS
Leverage
automation
for high-
volume
lower
margin parts
Advance
products
up the
technical
curve
Air
Bo
ss
of A
me
rica
|3
4
Air
Bo
ss
of A
me
rica
|
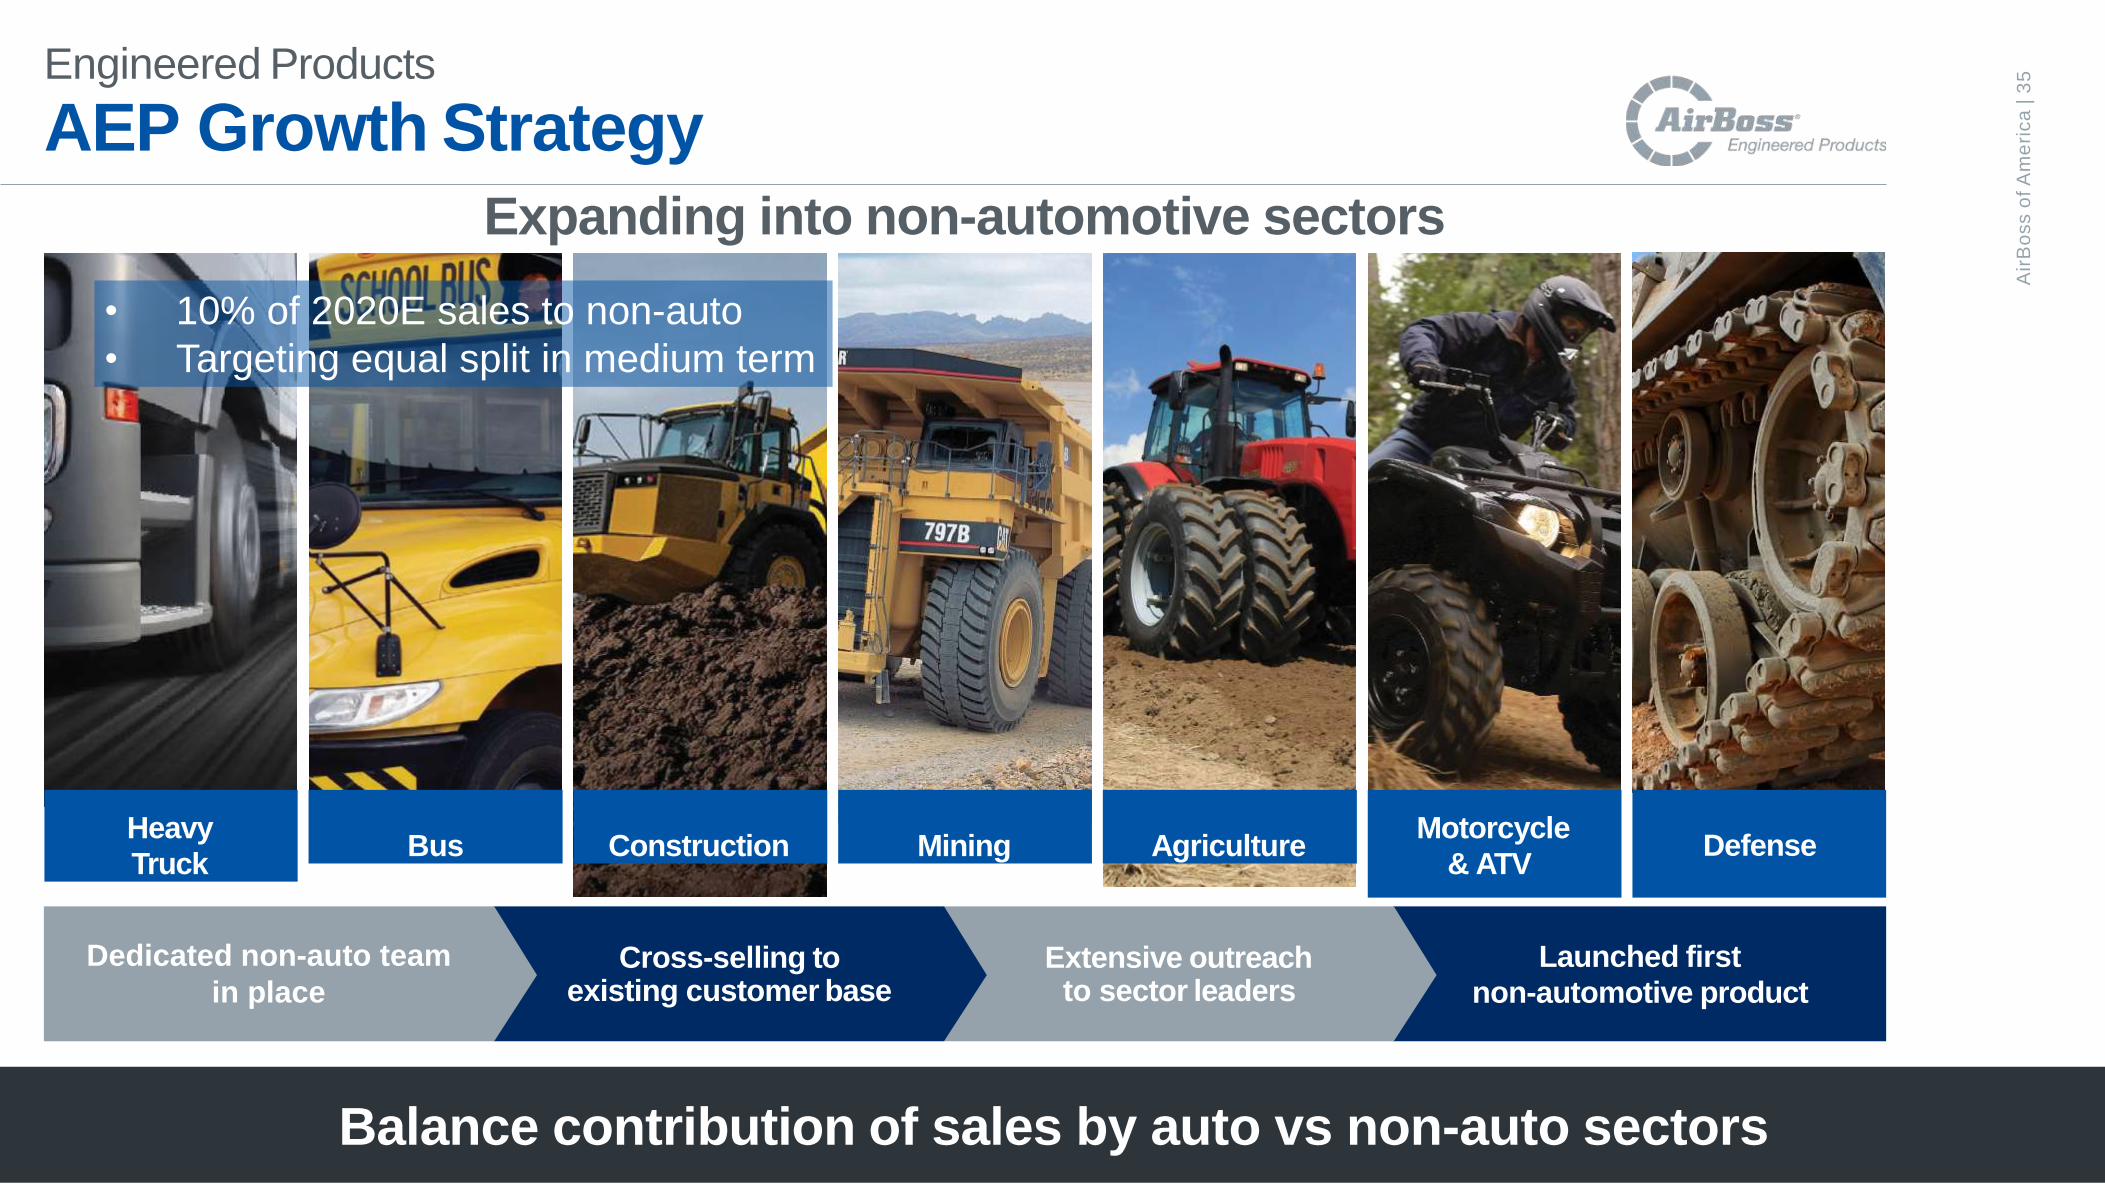
Balance contribution of sales by auto vs non-auto sectors
Launched first
non-automotive productExtensive outreach
to sector leaders
Engineered Products
AEP Growth Strategy
Heavy
TruckBus Construction Mining Agriculture
Motorcycle
& ATV
Cross-selling toexisting customer base
Expanding into non-automotive sectors
Dedicated non-auto team
in place
Defense
• 10% of 2020E sales to non-auto
• Targeting equal split in medium term
35

(2)
0
-5%1%
-20%-15%-10%-5%0%5%10%15%20%
-5-3-1135
H1 2020 H1 2021
EBITDA $M
EBITDA % of Net Sales
123%
4%
-10%
-8%
-6%
-4%
-2%
0%
2%
4%
6%
8%
10%
-5
-4
-3
-2
-1
0
1
2
3
4
5
H1 2020 H1 2021
Gross Profit $M
Gross Profit % of Net Sales
Air
Bo
ss
of A
me
rica
|
Turnaround strategy underway to drive return to profitability
Financial Review & OutlookEngineered Products
REVIEW
• Net sales increased 38% in H1 2021 due to stronger volumes in automotive
sector; gross profit and EBITDA increase driven by stronger volumes and focus
on operational cost containment supported by government subsidies, partially
offset by higher labor, material and logistics costs
• Turnaround strategy for AEP began successfully in 2020, though hindered by
COVID-19 impact on auto sector (-20.5% decline in N.A. production in 2020F1):
• Moved into supply of anti-vibration components for non-auto; almost 10% of 2020 sales,
with target to have balance between auto and non-auto in five years
• Customer retention has been high with no shrink in base; ~80-90% rollover annually
• Undertaking cost containment through capital investments to increase automation of low
margin parts and shifting lower margin production volumes to Malaysia
• Became supplier to AirBoss Defense Group
OUTLOOK
• North American car/light truck production estimated to grow at ~4.8% annually
between 2020 and 2025, with large rebound in 20211
• Rebound in volumes dependent on continued impact of COVID on U.S. economy
and subject to volatility due to global electronic chip shortages combined with raw
material shortages in addition to freight and logistics constraints
• AEP target of getting close to EBIT breakeven in near term if economy normalizes
1 IHS Markit, Dec. 2020
132 129 125102
12
2017 2018 2019 2020
Net Sales $M
External Net Sales Inter-Segment Net Sales (Defense)
15
10
6 512%8% 5% 5%
0%
5%
10%
15%
20%
25%
30%
35%
40%
45%
50%
0
2
4
6
8
10
12
14
16
18
2017 2018 2019 2020
Gross Profit $M
Gross Profit % of Net Sales
9
4
0
(1)
7%3%
0%-1%
-10%
0%
10%
20%
30%
40%
50%
-2
0
2
4
6
8
10
2017 2018 2019 2020
EBITDA $M
EBITDA % of Net Sales
36
41
573
3
H1 2020 H1 2021
Net Sales $M
Inter-Segment Net Sales (Defense)
External Net Sales

Air
Bo
ss
of A
me
rica
|
Outlook for Continued Strong Growth
>25% growth anticipated in FY2021 vs FY2020
-
100
200
300
400
500
600
700
800
2019 2020 2021E
Revenues $M
-
20
40
60
80
100
120
2019 2020 2021E
Adj. EBITDA $M
$-
$0.50
$1.00
$1.50
$2.00
$2.50
2019 2020 2021E
Adj. Earnings per Diluted Share US$
Low end of
guidance rangeLow end of
guidance range
Upper end
Upper end
• 20211 growth outlook excludes:
• Potential HHS option to acquire further nitrile rubber gloves
• Other potentially significant contracts AirBoss is pursuing among ~$175M in additional opportunities
• Tuck in or transformational M&A
1 2021 Outlook is as of March 16, 2021 and is subject to a number of risk factors and accounting assumptions, as outlined in the Company’s March 16, 2021 press release ‘AirBoss Announces Positive Outlook for 2021 Fueled by Strong Organic Sales’ available on SEDAR
Low end of
guidance range
Upper end
37

Air
Bo
ss
of A
me
rica
|
Investment Highlights
Focus on innovationand collaboration with largely blue-chip
customerbase
Leadingplayer in the large & growing North
American rubber
compounding market
Strategyto grow and diversify
anti-vibration business
Largeowned asset base
Significant recent
investments in capacity
and capabilities
A history ofconsistentdividends
38
Strong platformto build defense & survivability
business

Air
Bo
ss
of A
me
rica
|
Appendix Slides
39

Market Data
Exchange: Ticker TSX: BOS, OTCQX: ABSSF
Recent Share Price (Sept. 2, 2021) $42.09
Basic Shares Outstanding 26.9 million
Market Capitalization $1.1 billion
3 mo. Avg. Daily Volume of Shares Traded 220,888
52-week Range $15.09 - $43.88
Board & Management Ownership ~21%
Quarterly Dividend $0.10
Dividend Yield (as % of Annualized Quarterly) 1.0%
Analyst Coverage Canaccord Genuity, CIBC, Cormark, PI Financial,
Stifel-GMP, TD
(In Canadian dollars)
40
Air
Bo
ss
of A
me
rica
|

Air
Bo
ss
of A
me
rica
|
Significant diversified industrial, defense and public company expertise
Experienced Board and ManagementTeam
Management Board of Directors
1 Member of Audit Committee 2 Member of Compensation Committee 3 Member of Nominating and Corporate Governance Committee
P. Gren Schoch
MSc(A), P.Eng
CEO & Chairman
Founded and chaired Petromet Resources in 1982; sold to Talisman for
$900 million
Co-founder Aurora Oil & Gas; sold for $2.6 billion in 2014
Founded AirBoss in 1989; Chairman 1989, CEO 2013
Chris Bitsakakis
BSc, MBA
President & COO
More than 25 years in the rubber and automotive industries
Extensive operational experience in the North America, Mexico, South
America, Europe and Asia
Frank Ientile
BA, CA, CPA
CFO
30 years of progressive financial leadership experience
Significant diversified industrials experience including the automotive,
heavy trucking and construction sectors
Chris Figel
BASc, LLB
EVP and General Counsel
10 years in private practice with a major Canadian law firm focused on
M&A and Corporate Finance
Patrick Callahan
CEO of ADG
More than 18 years of defense and leadership experience, including
expertise in business development, program management, strategic
planning and international business
Carl Chapman
Sr. VP and GM, ARS
More than 16 years of manufacturing and operations leadership in rubber
solutions and automotive industries.
Chris Laycoe
Sr. VP and GM, Engineered
Products
More than 27 years experience in manufacturing and engineering, with
solid track record of implementing manufacturing process improvements,
program launches, problem solving, systems implementation and team
development.
P. Gren Schoch
MSc(A), P.Eng
CEO & Chairman
Founded and chaired Petromet Resources in 1982; sold to Talisman for
$900 million
Co-founder Aurora Oil & Gas; sold for $2.6 billion in 2014
Founded AirBoss in 1989; Chairman 1989, CEO 2013
Anita Antenucci
Director
25+ years investment banking experience in aerospace/
defense/government services.
Senior Managing Director Houlihan Lokey Inc.
David Camilleri (1)
Director
25+ years of advanced manufacturing experience (aerospace, NVH)
Former President Noranco; VP Precision Castparts Corp (a Berkshire
Hathaway company)
Mary Matthews (1)(2)(3)
Director
Held numerous senior financial positions with both public and private
companies including EVP at Sprott Asset Management and VP at CIBC
Robert McLeish (1)(2)(3)
Lead Independent Director
35 years in the investment business, most recently as Vice- Chairman
Merrill Lynch Canada
Former Chairman Dundee Wealth Management Inc.
Brian A. Robbins (1)
Director
President & CEO of Exco Technologies (TSX:XTC)
Director of Heroux-Devtek Inc. (TSX: HRX)
Stephen M. Ryan (2)
Director
Highly regarded attorney for 40 years in Washington, D.C.
Has been adjunct professor at Georgetown University Law Center for over
a decade and co-author of a book on government procurement ethics
Alan J. Watson (2)(3)
Director
30-year investment banking career with American and U.K.-based
investment banks
Chairman of Pinnacle Investment Management (ASX:PNI)
41

Building Our Sustainability Future
In the process of introducing metrics and frameworks
based on the Task Force on Climate-related Financial
Disclosures (“TCFD”) and the Sustainability Accounting
Standards Board (“SASB”) reporting standards
Integrating ESG practices into the business
Air
Bo
ss
of A
me
rica
|4
2

43
Air
Bo
sso
f A
me
rica
|
$0.65
$0.27
Q2 2021Q2 2020
Diluted EPS
Q2 2021 Financial Summary
• Net Sales increased 5% driven by growth in ARS and AEP and
ADG’s substantial completion of the HHS PAPR contract
supported by its continued integration of Critical Solutions
International partially offset by the large FEMA contract
substantially completed by ADG in Q2 2020
• Gross Profit increased 6% driven by increased volumes at ARS
and AEP, further supported by gov’t. subsidies, and margin
improvement at ADG
• Adjusted EBITDA decreased 2% driven by decline at ADG due to
large FEMA contract substantially completed in Q2 2020
• Diluted EPS and Adjusted Diluted EPS increase
driven by improved sales volumes, lower taxes,
and consolidation of all ADG profits stemming from
acquisition of remaining 45% minority interest in
October 2020
33
31
Q2 2021Q2 2020
Gross Profit $M
25
26
Q2 2021Q2 2020
Adjusted EBITDA $M
$0.65
$0.27
Q2 2021Q2 2020
Adjusted Diluted EPS
118
112
Q2 2021Q2 2020
Net Sales $M

44
Air
Bo
sso
f A
me
rica
|Selected Financial InformationIn thousands of US dollars, except share data
Three months
ending June 30:
Six months ending
June 30:For years ended December 31:
2021 2020 2021 2020 2020 2019 2018
Financial results:
Net sales 118,449 112,450 225,778 206,647 501,572 328,126 316,603
Profit attributable to
owners of the Company
18,320 6,675 24,639 6,155 33,703 10,219 8,536
Adjusted Profit attributable
to owners of the
Company1
18,474 6,710 24,793 8,483 36,087 10,948 8,926
Earnings per share
- Basic 0.68 0.29 0.91 0.26 1.40 0.44 0.37
- Diluted 0.65 0.27 0.87 0.26 1.35 0.44 0.37
Adjusted earnings per
share1
- Basic 0.68 0.29 0.92 0.36 1.50 0.47 0.38
- Diluted 0.65 0.27 0.88 0.35 1.45 0.47 0.38
EBITDA1
24,914 25,630 39,304 33,065 103,211 32,082 25,675
Adjusted EBITDA1
25,068 25,665 39,458 35,393 105,595 32,196 26,065
Net cash from operating
activities
(6,693) 17,323 (10,669) 29,732 104,399 11,706 19,867
Free cash flow1
(9,731) 13,947 (18,947) 24,514 89,965 (7,775) 11,632
Dividends declared per
share (CAD$)
0.10 0.07 0.17 0.14 0.28 0.28 0.28
Capital additions 3,055 3,376 12,836 6,017 15,606 26,700 8,476
As at: Jun. 30, 2021 Dec. 31, 2020 Dec. 31, 2019 Dec. 31, 2018
Financial Position:
Total assets 393,093 367,369 249,664 232,528
Term loan and other debt 76,051 90,734 74,144 62,956
Net debt1
12,884 (9,718) 59,481 44,859
Shareholders’ equity 216,718 194,588 125,979 121,483
Outstanding shares 26,984,987 26,908,802 23,392,442 23,392,442
1 Non – IFRS Financial Measures: EBITDA, Adjusted EBITDA, Adjusted profit attributable to owners of the Company, Adjusted earnings per share, Free cash flow and Net debt are directly derived from the consolidated financial statements but do not have a standardized meaning prescribed by IFRS
and are not necessarily comparable to similar measure presented by other issuers. The Company discloses these terms for use in financial measurements made by interested parties and investors to monitor the ability of the Company to generate cash from operations for debt service, to finance working
capital and capital expenditures, potential acquisitions and to pay dividends. These terms are not a measure of performance under IFRS and should not be considered in isolation or as a substitute for net income under IFRS. Reconciliations of net income to EBITDA and Adjusted EBITDA, net income to
Adjusted Profit attributable to owners of the Company and Adjusted earnings per share, loans and borrowings to Net Debt and net cash provided by (used in) operating activities to Free Cash Flow are presented in this presentation.
45
Air
Bo
sso
f A
me
rica
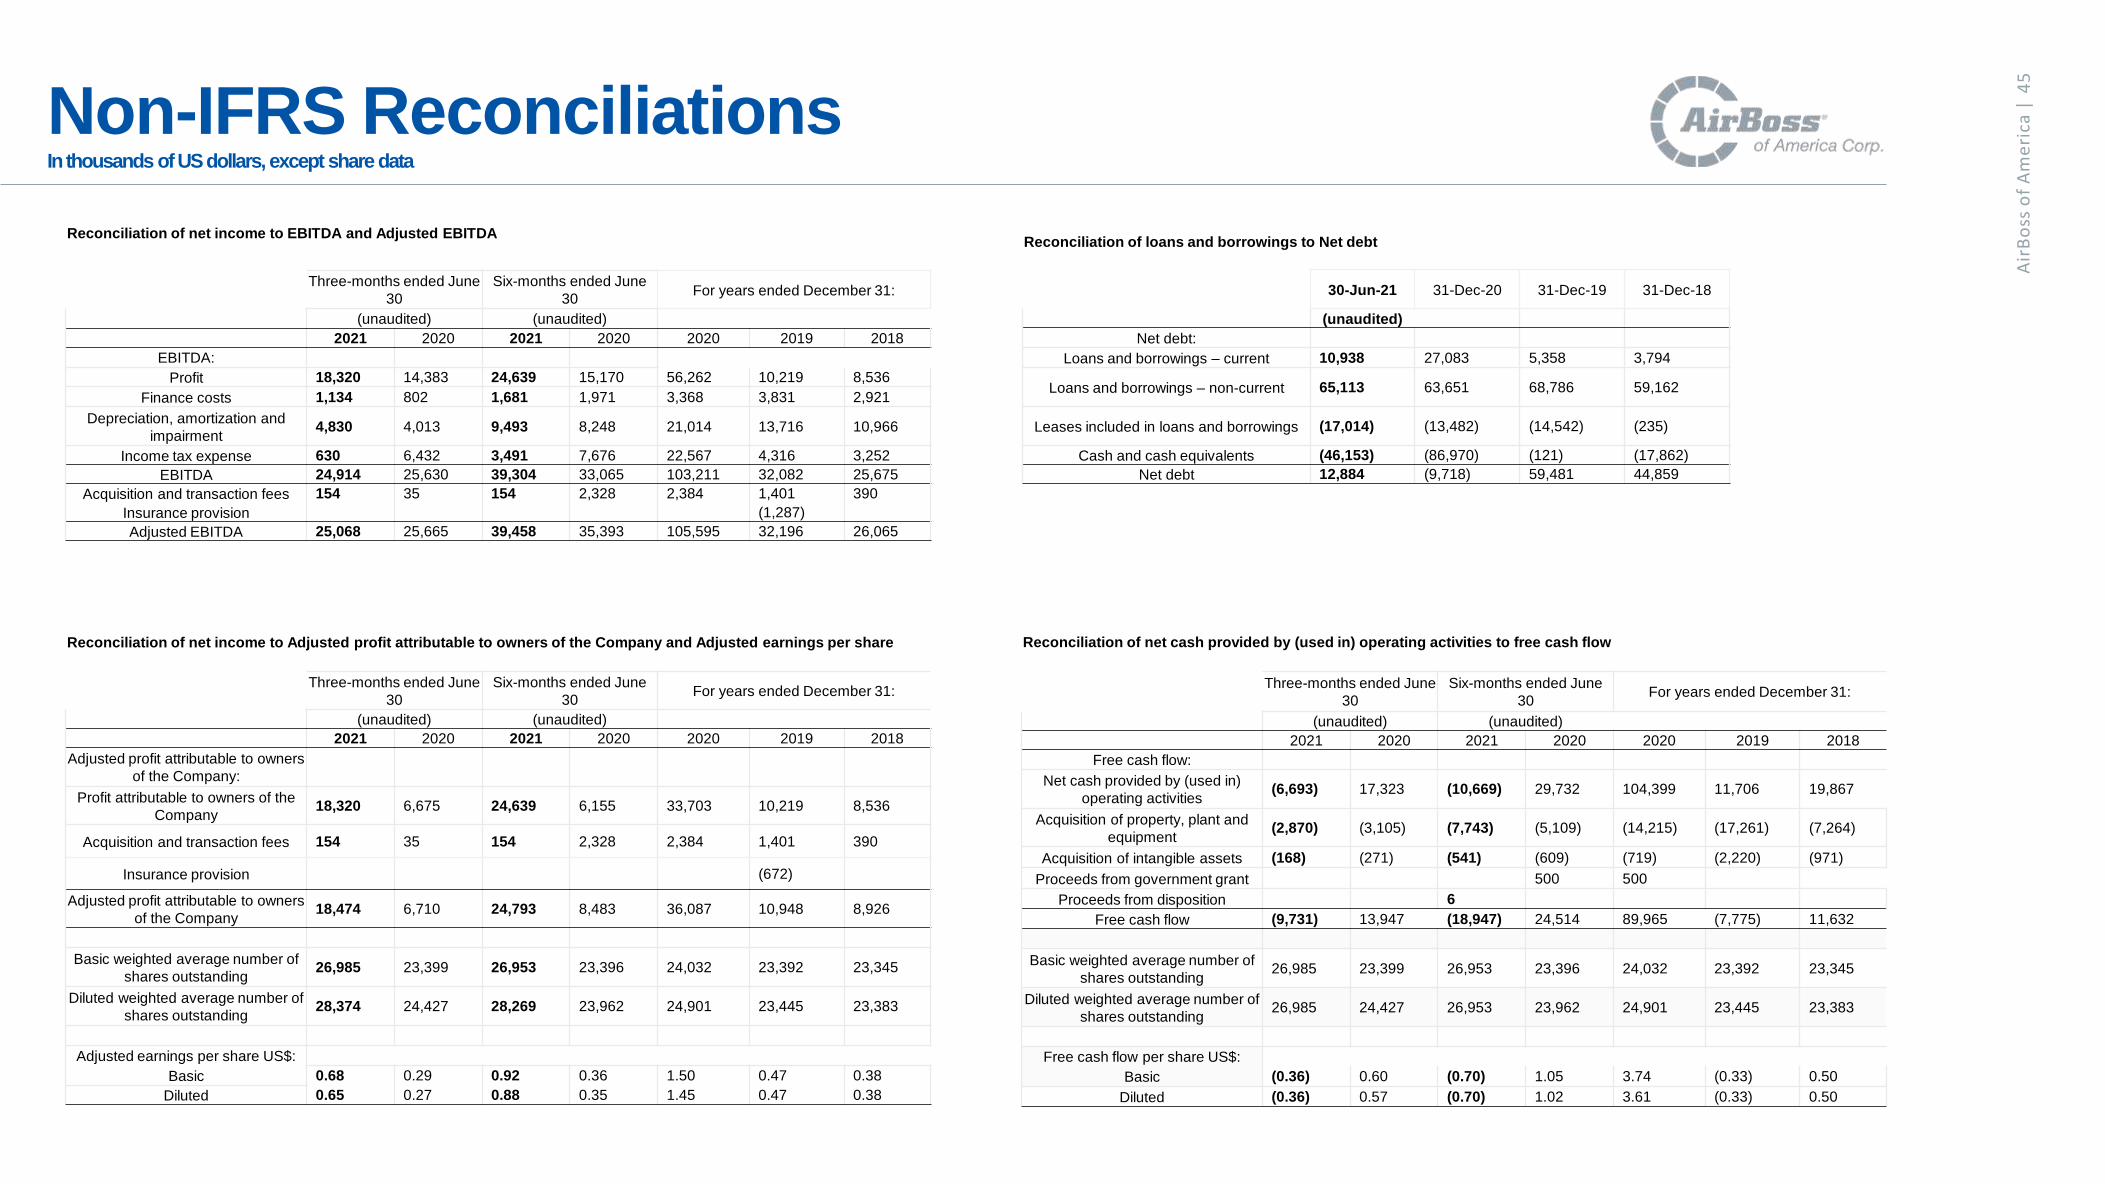
|Non-IFRS ReconciliationsIn thousands of US dollars, except share data
Reconciliation of net income to EBITDA and Adjusted EBITDA
Three-months ended June
30
Six-months ended June
30For years ended December 31:
(unaudited) (unaudited)
2021 2020 2021 2020 2020 2019 2018
EBITDA:
Profit 18,320 14,383 24,639 15,170 56,262 10,219 8,536
Finance costs 1,134 802 1,681 1,971 3,368 3,831 2,921
Depreciation, amortization and
impairment4,830 4,013 9,493 8,248 21,014 13,716 10,966
Income tax expense 630 6,432 3,491 7,676 22,567 4,316 3,252
EBITDA 24,914 25,630 39,304 33,065 103,211 32,082 25,675
Acquisition and transaction fees 154 35 154 2,328 2,384 1,401 390
Insurance provision (1,287)
Adjusted EBITDA 25,068 25,665 39,458 35,393 105,595 32,196 26,065
Reconciliation of net income to Adjusted profit attributable to owners of the Company and Adjusted earnings per share
Three-months ended June
30
Six-months ended June
30For years ended December 31:
(unaudited) (unaudited)
2021 2020 2021 2020 2020 2019 2018
Adjusted profit attributable to owners
of the Company:
Profit attributable to owners of the
Company18,320 6,675 24,639 6,155 33,703 10,219 8,536
Acquisition and transaction fees 154 35 154 2,328 2,384 1,401 390
Insurance provision (672)
Adjusted profit attributable to owners
of the Company18,474 6,710 24,793 8,483 36,087 10,948 8,926
Basic weighted average number of
shares outstanding26,985 23,399 26,953 23,396 24,032 23,392 23,345
Diluted weighted average number of
shares outstanding28,374 24,427 28,269 23,962 24,901 23,445 23,383
Adjusted earnings per share US$:
Basic 0.68 0.29 0.92 0.36 1.50 0.47 0.38
Diluted 0.65 0.27 0.88 0.35 1.45 0.47 0.38
Reconciliation of loans and borrowings to Net debt
30-Jun-21 31-Dec-20 31-Dec-19 31-Dec-18
(unaudited)
Net debt:
Loans and borrowings – current 10,938 27,083 5,358 3,794
Loans and borrowings – non-current 65,113 63,651 68,786 59,162
Leases included in loans and borrowings (17,014) (13,482) (14,542) (235)
Cash and cash equivalents (46,153) (86,970) (121) (17,862)
Net debt 12,884 (9,718) 59,481 44,859
Reconciliation of net cash provided by (used in) operating activities to free cash flow
Three-months ended June
30
Six-months ended June
30For years ended December 31:
(unaudited) (unaudited)
2021 2020 2021 2020 2020 2019 2018
Free cash flow:
Net cash provided by (used in)
operating activities(6,693) 17,323 (10,669) 29,732 104,399 11,706 19,867
Acquisition of property, plant and
equipment(2,870) (3,105) (7,743) (5,109) (14,215) (17,261) (7,264)
Acquisition of intangible assets (168) (271) (541) (609) (719) (2,220) (971)
Proceeds from government grant 500 500
Proceeds from disposition 6
Free cash flow (9,731) 13,947 (18,947) 24,514 89,965 (7,775) 11,632
Basic weighted average number of
shares outstanding26,985 23,399 26,953 23,396 24,032 23,392 23,345
Diluted weighted average number of
shares outstanding26,985 24,427 26,953 23,962 24,901 23,445 23,383
Free cash flow per share US$:
Basic (0.36) 0.60 (0.70) 1.05 3.74 (0.33) 0.50
Diluted (0.36) 0.57 (0.70) 1.02 3.61 (0.33) 0.50

AirBoss of America 46
Questions?
Airboss.com
Air
Bo
ss
of A
me
rica
|4
6