Innovation A Practical Applications Guide for Analytical ...
8
A Practical Applications Guide for Analytical Pyrolysis - GC/MS Polymer and Rubber Innovation Year CDS Analytical www.cdsanalytical.com
Transcript of Innovation A Practical Applications Guide for Analytical ...

A Practical Applications Guide for Analytical Pyrolysis - GC/MS
Polymer and Rubber
Innovation
Year
CDS Analyticalwww.cdsanalytical.com

It possible to obtain a significant amount of information without chromatographic sep-aration of the pyrolysis products by connecting the pyrolyzer directly an MS detector. Here, a GC column is replaced with a 1-meter piece of fused silica, so mass spectral data is produced relative to temperature. Below is a comparison of the evolved gases of sev-eral different polymers containing Bisphenol A. They have different thermal stabilities as indicated by the temperatures of maximum production. The epoxy powder-coat reveals an early peak, the evolution of semi-volatiles like additives prior its thermal degradation. Examining the mass spectra at various times in the analysis can identify the types of compounds being volatilized at a certain time and the corresponding temperature. This is a quick and simple way to identify polymer characteristics and their constituents.
Evolved Gas Analysis
Pyroprobe Setting
Initial: 100°C
Ramp: 100°C/min
Final: 800°C
Interface: 300°
Valve oven: 300°C
Transfer Line: 315°C
GC/MS Setting
Column: 1 m x 0.1 mm uncoated
Carrier: Helium
Split: 100:1
Oven program: 275°C for 10 minutes
EGA of various polymers

When a material is made using several different monomers, like a styrene/butadiene rubber, or a latex paint, PY-GC/MS can identify relative amounts of each monomer used. Here, a calibration curve is made to determine the amount of methyl methacrylate (MMA) monomer is present in a largely polystyrene polymer. Figure 1 is a pyrogram of the 0.4% product MMA, showing the styrene monomer, dimer and trimer of polystyrene, as well as a small peak for MMA monomer. Figure 2 contrasts 0.1% and 0.4% samples. As the amount of MMA increases, the MMA peak becomes larger, relative to other more constant peaks. The ratio of the MMA peak area to the toluene peak area shows a linear relationship to the concentration of MMA. Using a peak area ratio of two peaks makes the assay independent of the sample size, producing a calibration table that can be used to determine how much MMA in an unknown polymer.
Quantify Methyl Methacrylate in a Copolymer
Figure 2: 0.1% and 0.4% sample
Pyroprobe Setting
Set-point: 750°C 15 seconds
Interface: 300°C
Valve Oven: 300°C
Transfer Line: 325°C
GC/MS Setting
Column: 5% phenyl
Carrier: Helium, 50:1 split
Injector: 350°C
Oven: 40°C for 2 minutes
10°C/min to 325°C
Mass Range: 35-600 amu
Figure 1: pyrogram of the 0.4% sample
Figure 3: MMA Calibration Curve

A polyvinylchloride-polymethyl methacrylate copolymer was treated to multiple tempera-tures to better understand its thermal behavior. When heated, PVC releases HCl, then produces aromatics, including benzene and toluene. Figure 1 shows the benzene peak for a series of runs on the same sample, heating sequentially to 200°, 300°, 400°, 500°, 600°, 700° and then 1000°C. Figure 2 compares the production of benzene, from the PVC to the formation of methyl methacrylate from the PMMA, at 600°C and 1000°C. Although the PVC continues to generate benzene at higher temperatures, the PMMA is essentially unzipped well before that temperature.
Thermal Degradation
Pyroprobe Setting
Set-point: 200°-1000°C for 15 sec
Interface: 300°C
Valve Oven: 300°C
Transfer Line: 325°C
GC/MS Setting
Column: 5% phenyl
Carrier: Helium,
Split: 50:1
Injector: 300°C
Oven: 40°C for 2 min
8°C/min to 300°C
Mass Range: 35-600 amu
Figure 1: Benzene peaks from runs
Figure 2: Benzene and methyl methacry-late peaks from uns

Polyurethanes are a versatile group of polymers found in a wide array of manufactured products ranging from packaging foams, through elastics, paints and molded goods. Diisocyanates can be used as marker compounds to determine polyurethane type. This is true whether the material is a pure polyurethane or a blend or composite with only a small amount of polyurethane in the composition. Below are pyrograms of two different polyurethanes, a clear gloss finish, and a shoe sole. Toluene diisocyanate (TDI) is the largest peak in the chromatogram, indicating the finish is made from TDI. The shoe sole, the regenerated diisocyanate was 1,1’-methylenebis(4-isocyanato-benzene) (MDI).
Analysis of Urethane Type
Pyroprobe Setting
Set-point: 750°C 15 seconds
Interface: 300°C
Valve Oven: 300°C
Transfer Line: 325°C
GC/MS Setting
Column: 5% phenyl
Carrier: Helium, 50:1 split
Injector: 300°C
Oven: 40°C for 2 minutes
10°C/min to 300°C hold 5 min
Mass Range: 35-600 amu
Top: Pyrolysis of a clear gloss finish shows it is a polyurethane made of TDIBottom: Pyrolysis of a shoe sole shows it is a polyurethane made of MDI
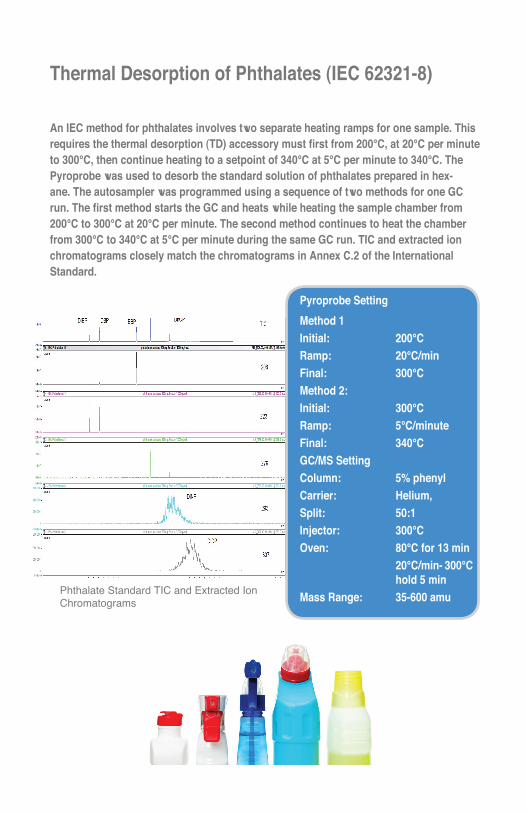
An IEC method for phthalates involves two separate heating ramps for one sample. This requires the thermal desorption (TD) accessory must first from 200°C, at 20°C per minute to 300°C, then continue heating to a setpoint of 340°C at 5°C per minute to 340°C. The Pyroprobe was used to desorb the standard solution of phthalates prepared in hex-ane. The autosampler was programmed using a sequence of two methods for one GC run. The first method starts the GC and heats while heating the sample chamber from 200°C to 300°C at 20°C per minute. The second method continues to heat the chamber from 300°C to 340°C at 5°C per minute during the same GC run. TIC and extracted ion chromatograms closely match the chromatograms in Annex C.2 of the International Standard.
Thermal Desorption of Phthalates (IEC 62321-8)
Pyroprobe Setting
Method 1 Initial: 200°CRamp: 20°C/minFinal: 300°CMethod 2:Initial: 300°CRamp: 5°C/minuteFinal: 340°CGC/MS SettingColumn: 5% phenyl Carrier: Helium, Split: 50:1Injector: 300°COven: 80°C for 13 min 20°C/min- 300°C hold 5 minMass Range: 35-600 amu
Phthalate Standard TIC and Extracted Ion Chromatograms
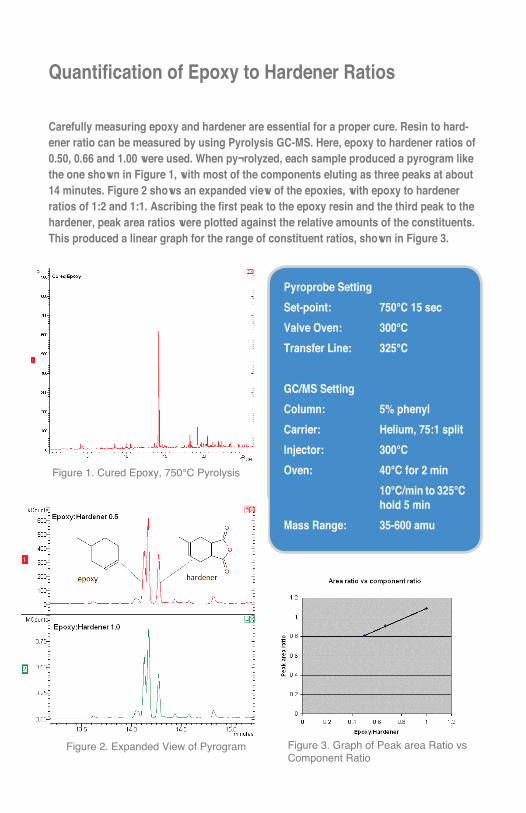
Carefully measuring epoxy and hardener are essential for a proper cure. Resin to hard-ener ratio can be measured by using Pyrolysis GC-MS. Here, epoxy to hardener ratios of 0.50, 0.66 and 1.00 were used. When py¬rolyzed, each sample produced a pyrogram like the one shown in Figure 1, with most of the components eluting as three peaks at about 14 minutes. Figure 2 shows an expanded view of the epoxies, with epoxy to hardener ratios of 1:2 and 1:1. Ascribing the first peak to the epoxy resin and the third peak to the hardener, peak area ratios were plotted against the relative amounts of the constituents. This produced a linear graph for the range of constituent ratios, shown in Figure 3.
Quantification of Epoxy to Hardener Ratios
Pyroprobe Setting
Set-point: 750°C 15 sec
Valve Oven: 300°C
Transfer Line: 325°C
GC/MS Setting
Column: 5% phenyl
Carrier: Helium, 75:1 split
Injector: 300°C
Oven: 40°C for 2 min
10°C/min to 325°C hold 5 min
Mass Range: 35-600 amu
Figure 1. Cured Epoxy, 750°C Pyrolysis
Figure 2. Expanded View of Pyrogram Figure 3. Graph of Peak area Ratio vs Component Ratio

CDS Analytical Headquarters:465 Limestone Road P.O. Box 277 Oxford, PA 19363-0277 Tel: 800.541.6593 610.932.3636
© CDS Analytical LLC. 2018 All Rights Reserved AP-12 11/08 5K Printed in USA
Pyrolysis-GC has long been used to analyze for the polymers used in manufacturing the tire rubber. A multi-stepped temperature approach can help facilitate the analysis of the total organic composition by permitting selective vaporization of various volatiles & semi-volatiles, as well as pyrolysis of the polymer for identifi¬cation of the monomers. A first run at a relatively low temperature, as in Figure 1, can eliminate volatile contami-nants from “real world” samples, so that these peaks do not show up in analytical runs. Heating the sample again to 300°C (Figure 2) reveals several additives intrinsic to the rubber formulation, like hydrocarbon oil and the antioxidant 6-PPD. The pyrolysis run at 700° shown in Figure 3, with volatiles and semi-volatiles now removed, shows that the tire sample is a butadiene-isoprene rubber clearly displaying the polymer monomers and dimers formed from pyrolysis.
Multi-step Analysis of Automobile Tire Rubber
Pyroprobe Setting
Set-point: 150°C for 20s 300°C for 15s 700°C for 10sValve Oven: 300°CTransfer Line: 315°CGC/MS SettingColumn: 5% phenyl Carrier: Helium, Split: 100:1Injector: 300°COven: 40°C for 2 min 10°C/min- 325°C hold 5 minMass Range: 35-600 amu
Figure 1. Tire Rubber heated to 150°C
Figure 2. Tire Rubber heated to 300°C Figure 3. Tire rubber heated to 700°C