Inland Navigation & Container Terminal Efficiency · Inland Navigation & Container Terminal...
23
Page | 1 © Gunther Ginckels www.seasc4u.com 25-apr-14 Inland Navigation & Container Terminal Efficiency This paper addresses the challenges and opportunities container transportation logistics will encounter over the coming 2-3 years specifically in the context of development of the Ports of Rotterdam and Antwerp with current and upcoming Terminal facilities, Delta 1 and Delta 2 and expected growth in the ARA Range. The move in Antwerp by MSC to Deurganckdock will also add new challenges. Other elements contributing to changes in the Intermodal Scene in Europe are the upcoming P3 concept (short term) and the Maasvlakte long term Modal Split objective Road 35%, Rail 20% and Inland Navigation 45% by 2035. The consolidation of Inland Navigation Operators in the Rhine-Rurh area and the financial impact of the DB Rail pricing policies will likewise create a shift of ownership and decision power process in the European Intermodal scene. 1. Purpose & Objectives Analyse the Central European Inland Navigation scene in the ARA (Amsterdam – Rotterdam – Antwerp) Range and North-West Germany, North France, Belgium and The Netherlands Identify the weaknesses of current Inland Navigation operations and evaluate the role and responsibility of the respective stakeholders Recommend possible solutions improving Inland Navigation efficiency and its sustainable development Formulate suggestions and ideas to be explored for further actions and engagement of all stakeholders
-
Upload
hoangduong -
Category
Documents
-
view
256 -
download
0
Transcript of Inland Navigation & Container Terminal Efficiency · Inland Navigation & Container Terminal...
P a g e | 1
© Gunther Ginckels www.seasc4u.com 25-apr-14
Inland Navigation & Container Terminal Efficiency
This paper addresses the challenges and opportunities container transportation logistics
will encounter over the coming 2-3 years specifically in the context of development of the
Ports of Rotterdam and Antwerp with current and upcoming Terminal facilities, Delta 1 and
Delta 2 and expected growth in the ARA Range. The move in Antwerp by MSC to
Deurganckdock will also add new challenges. Other elements contributing to changes in
the Intermodal Scene in Europe are the upcoming P3 concept (short term) and the
Maasvlakte long term Modal Split objective Road 35%, Rail 20% and Inland Navigation
45% by 2035. The consolidation of Inland Navigation Operators in the Rhine-Rurh area
and the financial impact of the DB Rail pricing policies will likewise create a shift of
ownership and decision power process in the European Intermodal scene.
1. Purpose & Objectives
Analyse the Central European Inland Navigation scene in the ARA (Amsterdam –
Rotterdam – Antwerp) Range and North-West Germany, North France, Belgium and
The Netherlands
Identify the weaknesses of current Inland Navigation operations and evaluate the
role and responsibility of the respective stakeholders
Recommend possible solutions improving Inland Navigation efficiency and its
sustainable development
Formulate suggestions and ideas to be explored for further actions and engagement
of all stakeholders
P a g e | 2
© Gunther Ginckels www.seasc4u.com 25-apr-14
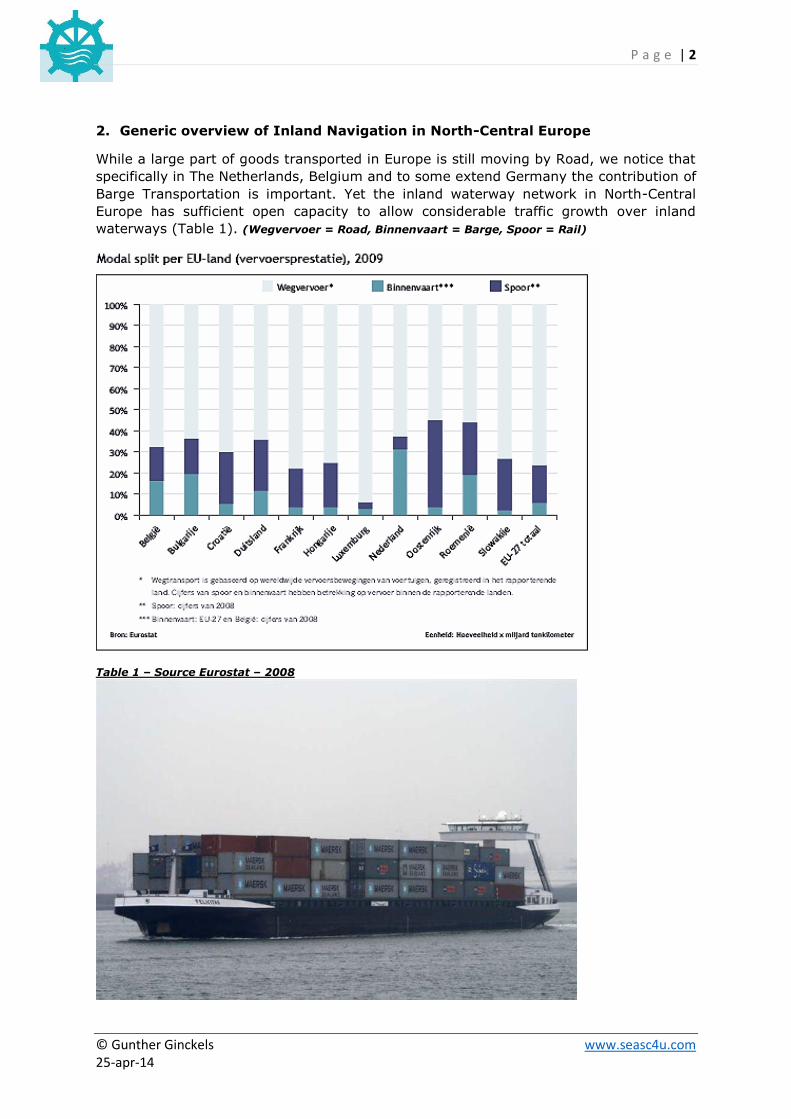
2. Generic overview of Inland Navigation in North-Central Europe
While a large part of goods transported in Europe is still moving by Road, we notice that
specifically in The Netherlands, Belgium and to some extend Germany the contribution of
Barge Transportation is important. Yet the inland waterway network in North-Central
Europe has sufficient open capacity to allow considerable traffic growth over inland
waterways (Table 1). (Wegvervoer = Road, Binnenvaart = Barge, Spoor = Rail)
Table 1 – Source Eurostat – 2008

P a g e | 3
© Gunther Ginckels www.seasc4u.com 25-apr-14
The modal split in Container Transportation to /from the ports in the Hamburg – Le Havre
range is showing the significance of the ports of Antwerp and Rotterdan with respect to
Barge Transportation (Binnenvaart), while Bremerhaven, Hamburg and Zeebrugge are
more profiled as Railports (Table 2). (From left to right Wegvervoer = Road, Binnenvaart = Barge,
Spoorvervoer = Rail)
Table 2 – Source Eurostat
P a g e | 4
© Gunther Ginckels www.seasc4u.com 25-apr-14
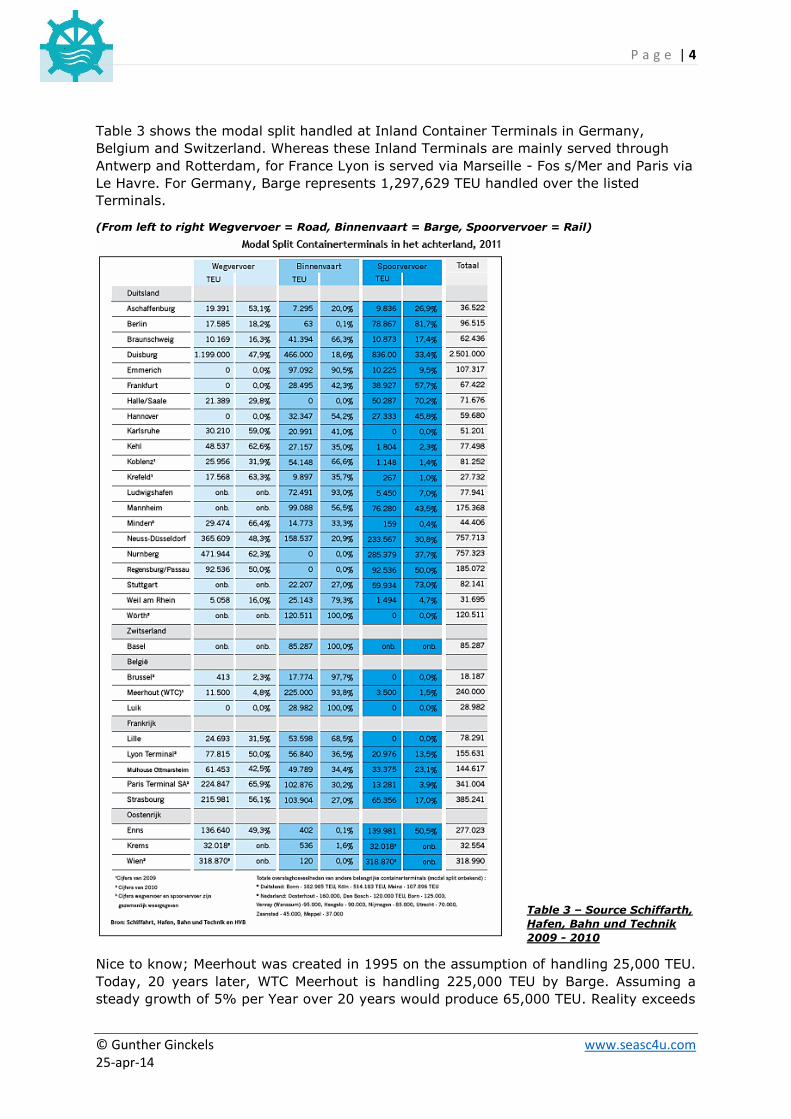
Table 3 shows the modal split handled at Inland Container Terminals in Germany,
Belgium and Switzerland. Whereas these Inland Terminals are mainly served through
Antwerp and Rotterdam, for France Lyon is served via Marseille - Fos s/Mer and Paris via
Le Havre. For Germany, Barge represents 1,297,629 TEU handled over the listed
Terminals.
(From left to right Wegvervoer = Road, Binnenvaart = Barge, Spoorvervoer = Rail)
Table 3 – Source Schiffarth,
Hafen, Bahn und Technik
2009 - 2010
Nice to know; Meerhout was created in 1995 on the assumption of handling 25,000 TEU.
Today, 20 years later, WTC Meerhout is handling 225,000 TEU by Barge. Assuming a
steady growth of 5% per Year over 20 years would produce 65,000 TEU. Reality exceeds
P a g e | 5
© Gunther Ginckels www.seasc4u.com 25-apr-14
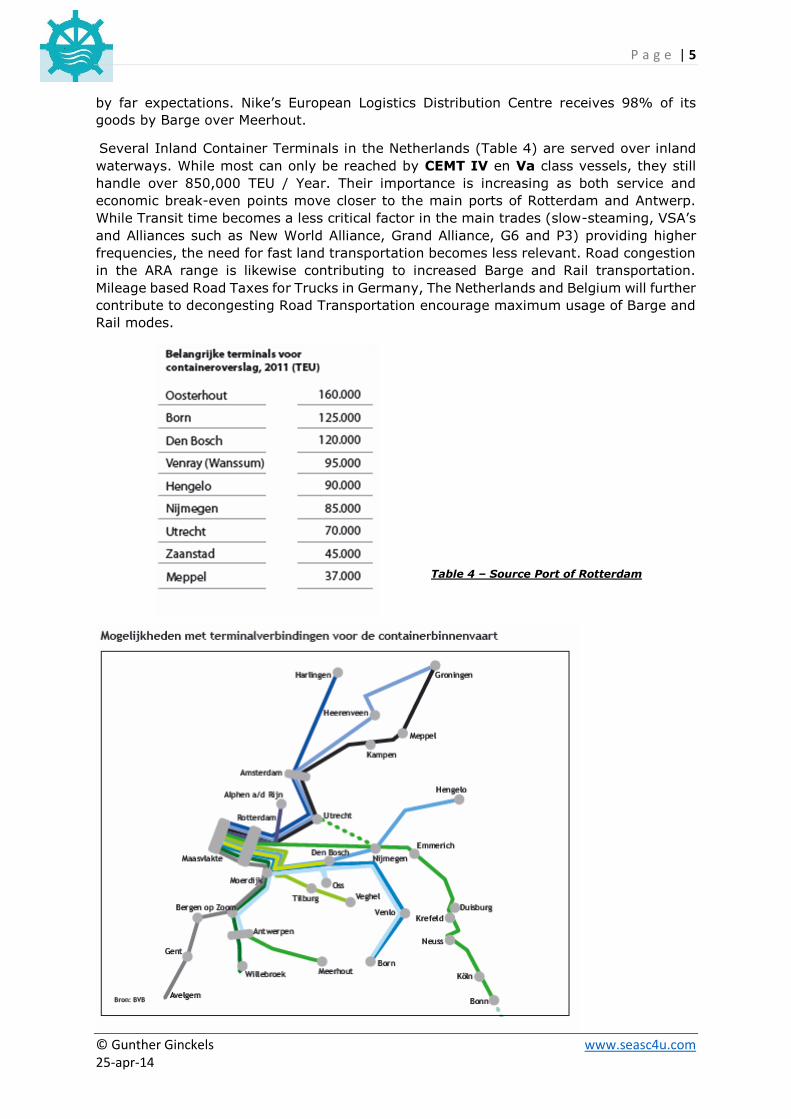
by far expectations. Nike’s European Logistics Distribution Centre receives 98% of its
goods by Barge over Meerhout.
Several Inland Container Terminals in the Netherlands (Table 4) are served over inland
waterways. While most can only be reached by CEMT IV en Va class vessels, they still
handle over 850,000 TEU / Year. Their importance is increasing as both service and
economic break-even points move closer to the main ports of Rotterdam and Antwerp.
While Transit time becomes a less critical factor in the main trades (slow-steaming, VSA’s
and Alliances such as New World Alliance, Grand Alliance, G6 and P3) providing higher
frequencies, the need for fast land transportation becomes less relevant. Road congestion
in the ARA range is likewise contributing to increased Barge and Rail transportation.
Mileage based Road Taxes for Trucks in Germany, The Netherlands and Belgium will further
contribute to decongesting Road Transportation encourage maximum usage of Barge and
Rail modes.
Table 4 – Source Port of Rotterdam

P a g e | 6
© Gunther Ginckels www.seasc4u.com 25-apr-14
3. Inland Navigation Vessels – Sizes and Capacity in Europe
CEMT (Conference of European Ministers of Transport) approved in 1992 a classification
for Inland Navigation Vessels (Table 5).
Table 5 – Source CEMT
P a g e | 7
© Gunther Ginckels www.seasc4u.com 25-apr-14
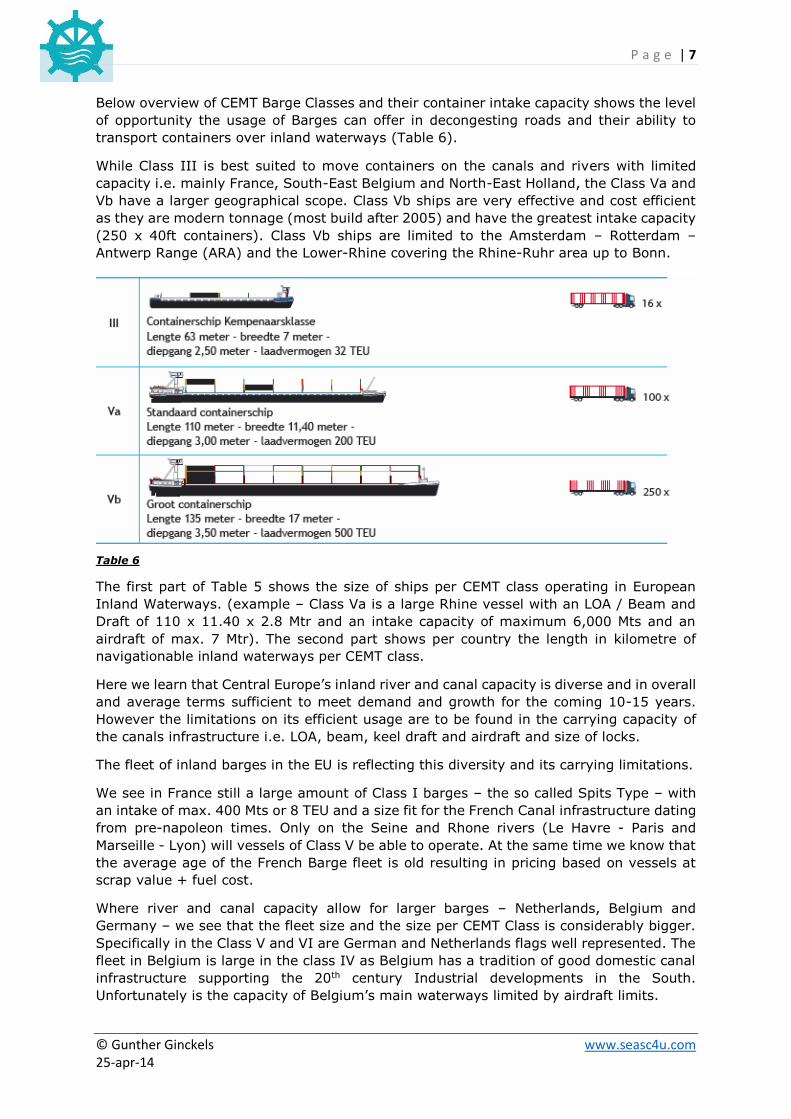
Below overview of CEMT Barge Classes and their container intake capacity shows the level
of opportunity the usage of Barges can offer in decongesting roads and their ability to
transport containers over inland waterways (Table 6).
While Class III is best suited to move containers on the canals and rivers with limited
capacity i.e. mainly France, South-East Belgium and North-East Holland, the Class Va and
Vb have a larger geographical scope. Class Vb ships are very effective and cost efficient
as they are modern tonnage (most build after 2005) and have the greatest intake capacity
(250 x 40ft containers). Class Vb ships are limited to the Amsterdam – Rotterdam –
Antwerp Range (ARA) and the Lower-Rhine covering the Rhine-Ruhr area up to Bonn.
Table 6
The first part of Table 5 shows the size of ships per CEMT class operating in European
Inland Waterways. (example – Class Va is a large Rhine vessel with an LOA / Beam and
Draft of 110 x 11.40 x 2.8 Mtr and an intake capacity of maximum 6,000 Mts and an
airdraft of max. 7 Mtr). The second part shows per country the length in kilometre of
navigationable inland waterways per CEMT class.
Here we learn that Central Europe’s inland river and canal capacity is diverse and in overall
and average terms sufficient to meet demand and growth for the coming 10-15 years.
However the limitations on its efficient usage are to be found in the carrying capacity of
the canals infrastructure i.e. LOA, beam, keel draft and airdraft and size of locks.
The fleet of inland barges in the EU is reflecting this diversity and its carrying limitations.
We see in France still a large amount of Class I barges – the so called Spits Type – with
an intake of max. 400 Mts or 8 TEU and a size fit for the French Canal infrastructure dating
from pre-napoleon times. Only on the Seine and Rhone rivers (Le Havre - Paris and
Marseille - Lyon) will vessels of Class V be able to operate. At the same time we know that
the average age of the French Barge fleet is old resulting in pricing based on vessels at
scrap value + fuel cost.
Where river and canal capacity allow for larger barges – Netherlands, Belgium and
Germany – we see that the fleet size and the size per CEMT Class is considerably bigger.
Specifically in the Class V and VI are German and Netherlands flags well represented. The
fleet in Belgium is large in the class IV as Belgium has a tradition of good domestic canal
infrastructure supporting the 20th century Industrial developments in the South.
Unfortunately is the capacity of Belgium’s main waterways limited by airdraft limits.
P a g e | 8
© Gunther Ginckels www.seasc4u.com 25-apr-14
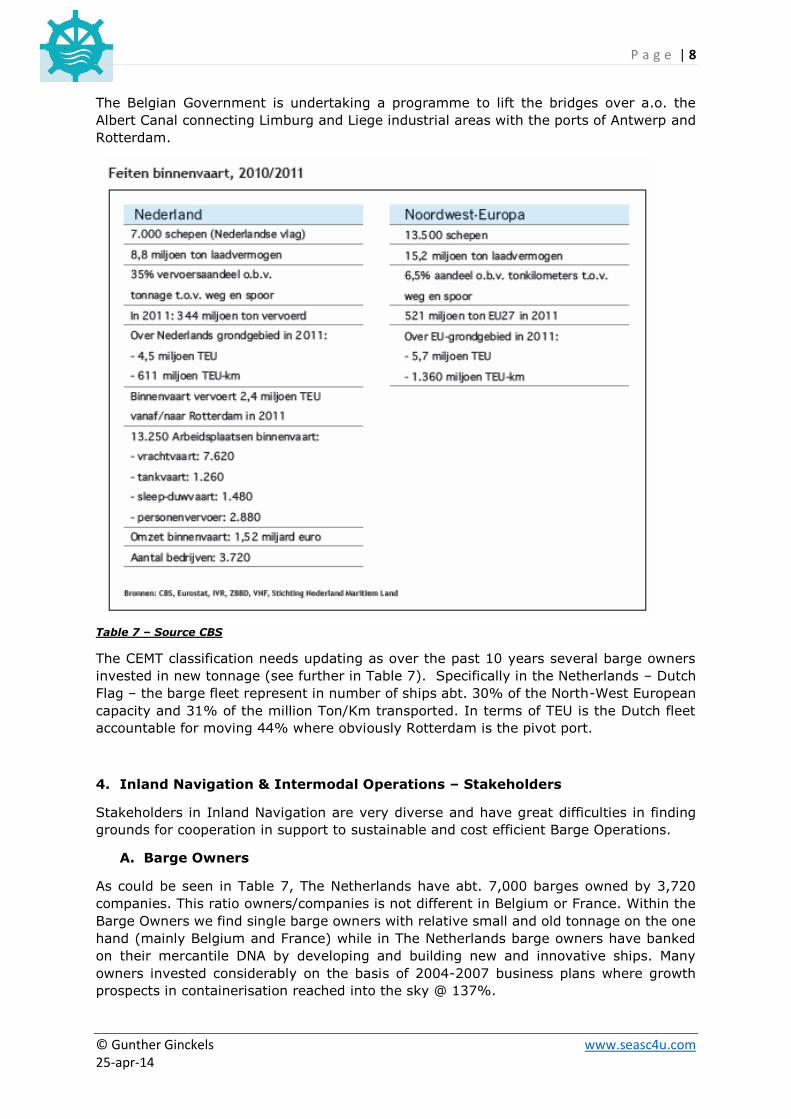
The Belgian Government is undertaking a programme to lift the bridges over a.o. the
Albert Canal connecting Limburg and Liege industrial areas with the ports of Antwerp and
Rotterdam.
Table 7 – Source CBS
The CEMT classification needs updating as over the past 10 years several barge owners
invested in new tonnage (see further in Table 7). Specifically in the Netherlands – Dutch
Flag – the barge fleet represent in number of ships abt. 30% of the North-West European
capacity and 31% of the million Ton/Km transported. In terms of TEU is the Dutch fleet
accountable for moving 44% where obviously Rotterdam is the pivot port.
4. Inland Navigation & Intermodal Operations – Stakeholders
Stakeholders in Inland Navigation are very diverse and have great difficulties in finding
grounds for cooperation in support to sustainable and cost efficient Barge Operations.
A. Barge Owners
As could be seen in Table 7, The Netherlands have abt. 7,000 barges owned by 3,720
companies. This ratio owners/companies is not different in Belgium or France. Within the
Barge Owners we find single barge owners with relative small and old tonnage on the one
hand (mainly Belgium and France) while in The Netherlands barge owners have banked
on their mercantile DNA by developing and building new and innovative ships. Many
owners invested considerably on the basis of 2004-2007 business plans where growth
prospects in containerisation reached into the sky @ 137%.
P a g e | 9
© Gunther Ginckels www.seasc4u.com 25-apr-14
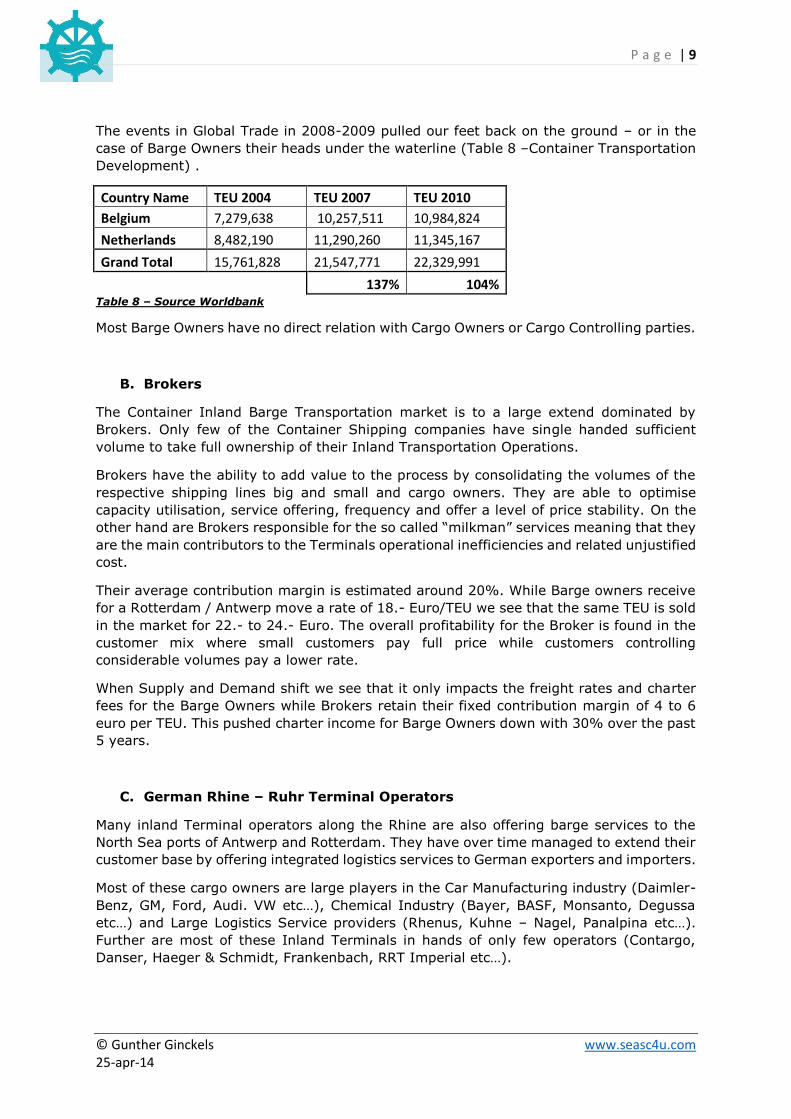
The events in Global Trade in 2008-2009 pulled our feet back on the ground – or in the
case of Barge Owners their heads under the waterline (Table 8 –Container Transportation
Development) .
Country Name TEU 2004 TEU 2007 TEU 2010
Belgium 7,279,638 10,257,511 10,984,824
Netherlands 8,482,190 11,290,260 11,345,167
Grand Total 15,761,828 21,547,771 22,329,991
137% 104% Table 8 – Source Worldbank
Most Barge Owners have no direct relation with Cargo Owners or Cargo Controlling parties.
B. Brokers
The Container Inland Barge Transportation market is to a large extend dominated by
Brokers. Only few of the Container Shipping companies have single handed sufficient
volume to take full ownership of their Inland Transportation Operations.
Brokers have the ability to add value to the process by consolidating the volumes of the
respective shipping lines big and small and cargo owners. They are able to optimise
capacity utilisation, service offering, frequency and offer a level of price stability. On the
other hand are Brokers responsible for the so called “milkman” services meaning that they
are the main contributors to the Terminals operational inefficiencies and related unjustified
cost.
Their average contribution margin is estimated around 20%. While Barge owners receive
for a Rotterdam / Antwerp move a rate of 18.- Euro/TEU we see that the same TEU is sold
in the market for 22.- to 24.- Euro. The overall profitability for the Broker is found in the
customer mix where small customers pay full price while customers controlling
considerable volumes pay a lower rate.
When Supply and Demand shift we see that it only impacts the freight rates and charter
fees for the Barge Owners while Brokers retain their fixed contribution margin of 4 to 6
euro per TEU. This pushed charter income for Barge Owners down with 30% over the past
5 years.
C. German Rhine – Ruhr Terminal Operators
Many inland Terminal operators along the Rhine are also offering barge services to the
North Sea ports of Antwerp and Rotterdam. They have over time managed to extend their
customer base by offering integrated logistics services to German exporters and importers.
Most of these cargo owners are large players in the Car Manufacturing industry (Daimler-
Benz, GM, Ford, Audi. VW etc…), Chemical Industry (Bayer, BASF, Monsanto, Degussa
etc…) and Large Logistics Service providers (Rhenus, Kuhne – Nagel, Panalpina etc…).
Further are most of these Inland Terminals in hands of only few operators (Contargo,
Danser, Haeger & Schmidt, Frankenbach, RRT Imperial etc…).
P a g e | 10
© Gunther Ginckels www.seasc4u.com 25-apr-14
Through maximised control over the Inland Terminals and the Transport Chain – both
Barge and Rail - and acting on behalf of the large cargo owners are these Operators de
facto manipulating the market. This is done by adding to inefficiencies for 3rd party barge
operators through extended lay-time and berthing window manipulation at their Terminals
and through non-transparent tariff constructions.
The Rhine-Ruhr Operators engage with Barge Owners through medium and long-term
charter contracts at reasonable rates. The Contribution Margin is weighed over the total
chain i.e. Handlings, Storage, Transport, Value Added and Forwarding & Logistic Services
etc… and delivers good EBITDA’s. They do however also contribute to the “milkman”
phenomena by also contributing to the Terminals operational inefficiencies and related
unjustified cost.
D. Seaport Container Terminal Operators
Most Container Terminal Operators in Seaports are reluctant to extend their service
offerings with Intermodal products. The Extended Gate Concept is on the table for many
years yet Terminal Operators do not explore the opportunities. The rationale for this policy
is not always clear. Fear for entering into a conflict of interest with their customers – the
Shipping Lines – is a frequently used argument. Yet, towards 2035 they will have an
obligation to move 20% of their handled containers by Rail and 45% by Barge. Most of
the Top-10 Shipping Lines have engaged into partnerships with a Terminal Operator in
one or more ports in the Le Havre – Hamburg Range. A consolidation of volumes and quest
for synergies is a must and needs to be initiated now – not in December 2034.
The development of Maasvlakte II in Rotterdam is contributing to the logistics complexity
where some operators (APM terminals, ECT) have two or more separated sites of
operations. Likewise we see in Antwerp the Leftbank Deurganckdock (Antwerp Gateway
by DP World, PSA and soon MSC) facilities separated by the Scheldt River and locks from
the Rightbank Terminals (PSA 420, MSC at Delwaidedock).
E. Container Shipping Lines
Over the past 30-40 years shipping lines have engaged in Intermodal Operations under
the protection of Conference Inland Tariffs.
Soon after the abolishment of Conference Inland Tariffs they disengaged on the argument
that Intermodal Service Offerings where not their core-business acknowledging their
inability to offer cost efficient Inland products.
Occasionally they re-engaged as the markets and customers where demanding party for
STDO services while volumes and economy of scale justified such engagement.
Fact is that only few Container Shipping Companies have the volumes and economy of
scale allowing for a cost efficient Intermodal product and service offering. In their drive to
outsource non-core activities they have also handed over cargo control to 3rd party
operators.
Their inability to set-up effective service organisations and provide ancillary services
pushed often lucrative cargo flows out of their bottom line. An example is the abortion of
LCL acceptance where NVOCC’s and Consolidators recovered these very lucrative activities
leaving the Shipping Lines at the very best with FAK rated shipments.

P a g e | 11
© Gunther Ginckels www.seasc4u.com 25-apr-14
Few Container Shipping Companies have integrated Inland Activities into their Customer
Service processes and service offerings while considering such services more as a hassle
than a product adding value to their product portfolio. The result is loss over cargo control
and subjecting their activities to unpredictable global market fluctuations only.
Even recent consolidation initiatives such as New World Alliance, Grand Alliance, G6 and
P3 seem unable to take the next step of moving forward by developing also sustainable
transport solutions beyond the freeboard of the vessels. While finding their way in
coalitions on the seas we see that they exclude the Landside Operations from such
alliances leaving it with the individual Shipping Lines at the very best and in most cases
with Cargo Owners, Brokers, Forwarders, Logistic Service Providers and Intermodal
Operators to complete cargo journeys.
The Container Liner Operators consider the phenomena of “Port Equalisation” in the
Antwerp / Rotterdam B/L concept as a hassle adding Cost, Complexity and Risk to the
Transportation Process. Attempts to abolish this have failed as cargo owners reject
accountability referring to the Shipping Lines making the choice of entry / exit port. The
new P3 schedules will change this by offering more direct calls evenly distributed over
Antwerp and Rotterdam reducing the need for Antwerp/Rotterdam Port Equalisation traffic.
Last but not least; by only selectively engaging in Intermodal Operations are shipping lines
not suffering from any negative economic or efficiency impact leaving the cost of non-
conformance with all other stakeholders. Some of these stakeholders have ceased this as
an opportunity and turned it around into lucrative business.
5. Rotterdam - Barge Operations @ Maasvlakte Container Terminals
Maasvlakte will handle in 2035 an estimated 15 million TEU (4.6 million in 2011). The
concession agreements between the 7 main Terminal Operators at Maasvlakte and the
Port of Rotterdam contain the obligation to handle a modal split where Road received and
delivered containers is to be reduced from the current 48% down to 35% only. The balance
will have to move by Rail and Inland Navigation Barges. (Table 9)
Whereas 1.8 million TEU where moved by barge in 2011, by 2035 the Terminal Operators
will have to handle 45% of their throughput or an estimated 7 million TEU on Barges.
P a g e | 12
© Gunther Ginckels www.seasc4u.com 25-apr-14
Table 9 – Source PoRA
Visualizing current (2010 data used however 2010-2013 growth marginal) flows of
Maasvlakte movements we see already today figures causing concern although no surprise
(Table 11).
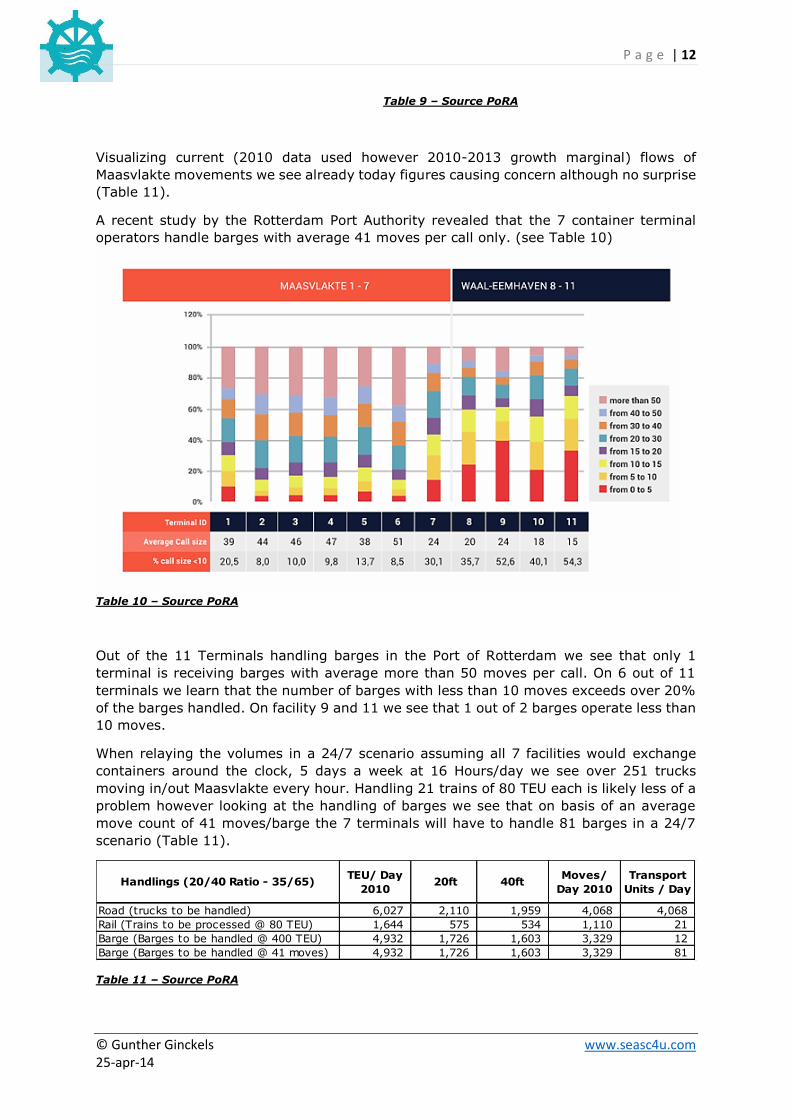
A recent study by the Rotterdam Port Authority revealed that the 7 container terminal
operators handle barges with average 41 moves per call only. (see Table 10)
Table 10 – Source PoRA
Out of the 11 Terminals handling barges in the Port of Rotterdam we see that only 1
terminal is receiving barges with average more than 50 moves per call. On 6 out of 11
terminals we learn that the number of barges with less than 10 moves exceeds over 20%
of the barges handled. On facility 9 and 11 we see that 1 out of 2 barges operate less than
10 moves.
When relaying the volumes in a 24/7 scenario assuming all 7 facilities would exchange
containers around the clock, 5 days a week at 16 Hours/day we see over 251 trucks
moving in/out Maasvlakte every hour. Handling 21 trains of 80 TEU each is likely less of a
problem however looking at the handling of barges we see that on basis of an average
move count of 41 moves/barge the 7 terminals will have to handle 81 barges in a 24/7
scenario (Table 11).
Table 11 – Source PoRA
Handlings (20/40 Ratio - 35/65)TEU/ Day
2010 20ft 40ft
Moves/
Day 2010
Transport
Units / Day
Road (trucks to be handled) 6,027 2,110 1,959 4,068 4,068
Rail (Trains to be processed @ 80 TEU) 1,644 575 534 1,110 21
Barge (Barges to be handled @ 400 TEU) 4,932 1,726 1,603 3,329 12
Barge (Barges to be handled @ 41 moves) 4,932 1,726 1,603 3,329 81
P a g e | 13
© Gunther Ginckels www.seasc4u.com 25-apr-14
Handlings (20/40 Ratio - 35/65)TEU/ Day
2035 20ft 40ft
Moves/ Day
2035
Transport
Units / Day
Road (trucks to be handled) 13,699 4,795 4,452 9,247 9,247
Rail (Trains to be processed @ 80 TEU) 8,219 2,877 2,671 5,548 103
Barge (Barges to be handled @ 400 TEU) 19,178 6,712 6,233 12,945 48
Barge (Barges to be handled @ 41 moves) 19,178 6,712 6,233 12,945 316
Reducing the portion of Road transported containers from current 48% to 35% by 2035
will still add another 8,000 TEU/day on the roads. Over 100 trains will need to be formed
everry day while the 9 Maasvlakte Terminals will need to handle over 19,000 TEU every
day – 24/7. (see Table 12)
Table 12 – Source PoRA
Over 9 terminals, the number of trucks moving in/out per hour in a 16/5 scenario will be
578 per hour. While this is manageable it appears less evident for Rail as here average
103 trains per day will need to be handled by the 9 Terminals or at least 4 trains are to be
processes every hour.
While the current volumes require the Terminals to handle 81 barges at average 41
moves/Barge, in 2035 the Barge handling capacity of the 9 terminals will have to be 4
times more compared to today (from 4,932 to 19,178 TEU/Day) (Table 13).
Table 13 – Source PoRA
In 2035 - To host 316 barges every day with an average berth stay of 2 hours handling
41 moves on Barges with an LOA of 110 meter (safe mooring space @ 130 meter) one
would have to allocate 3,400 Mtrs quay length permanently to handle exclusively barges.
The future facilities – including dedicated barge berths – offer 10,700 meter berthing space
resulting that 32% of the total Rotterdam Container Terminals Berth capacity will be
needed to handle exclusively Barge transported containers.
Today - To host 81 barges every day with an average berth stay of 2 hours handling 41
moves on Barges with an LOA of 110 meter (safe mooringspace @ 130 meter) one is to
allocate 900 Mtrs quay length permanently to handle exclusively barges. The current
facilities – excluding Maasvlakte II facilities – offer 7,500 meter berthing space resulting
that 12% of the current Rotterdam Container Terminals Berth capacity is used to handle
exclusively Barge transported containers.
For the evaluation of Barge Operations in the Port of Rotterdam we looked at the 7 main
container terminals at Maasvlakte i.e. Maasvlakte 1 and the 2 upcoming Terminals on
Maasvlakte 2. (see Figure below).
Throughput 2010 /
TEU / year
2010 /
TEU / day
2035 /
TEU / year
2035 / TEU
/ day
Road 2,200,000 6,027 5,000,000 13,698.63
Rail 600,000 1,644 3,000,000 8,219.18
Barge 1,800,000 4,932 7,000,000 19,178.08

P a g e | 14
© Gunther Ginckels www.seasc4u.com 25-apr-14
The Maasvlakte area is covered by following operators.
Hutchison Port Holdings – ECT
P a g e | 15
© Gunther Ginckels www.seasc4u.com 25-apr-14
APM terminals
DP World – RWG
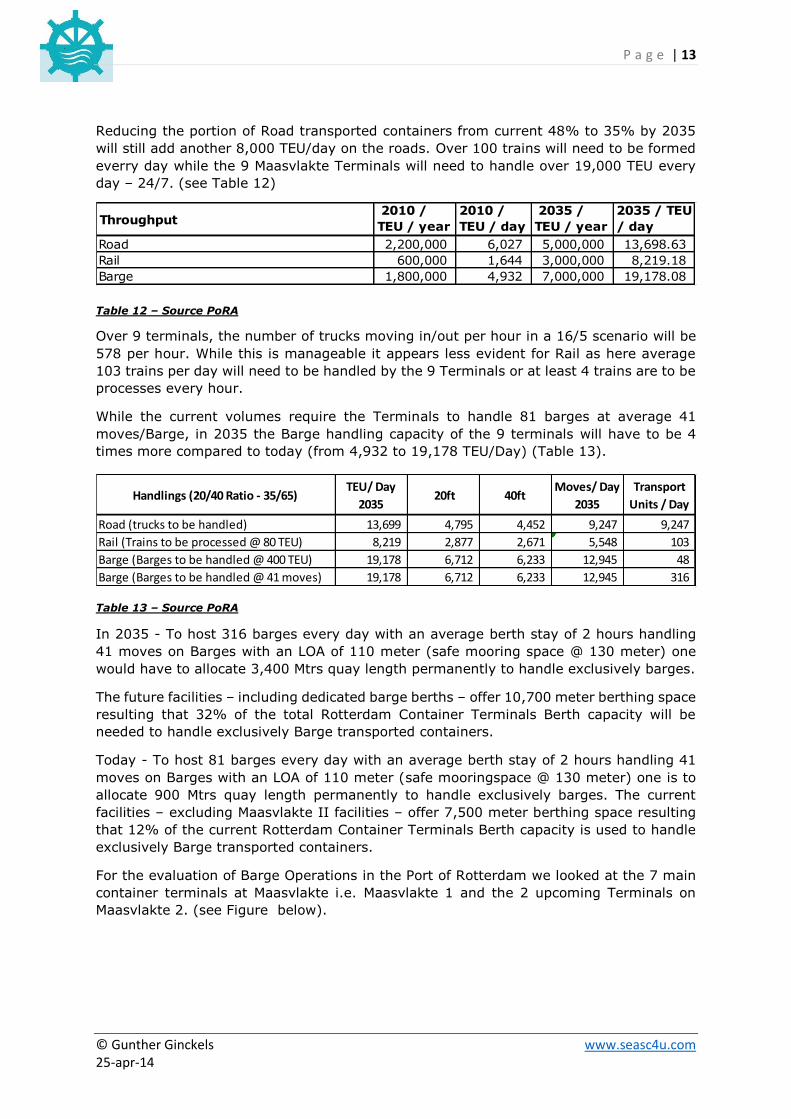
The Maasvlakte area include Delta II where APMT2 and RWG will become operational 3rd
– 4th quarter 2014. Both these terminals have dedicated Barge facilities of 500 meter quay
length and dedicated cranes although the draft alongside quay leaves the handling of
feeder vessels open. This will allow for the handling of barges separately without impacting
the berth capacity for ocean vessels. This is currently sufficient however as indicated in
para 4, the current – likely including the upcoming Maasvlakte II Terminals – capacity is
today already stretched to its maximum.
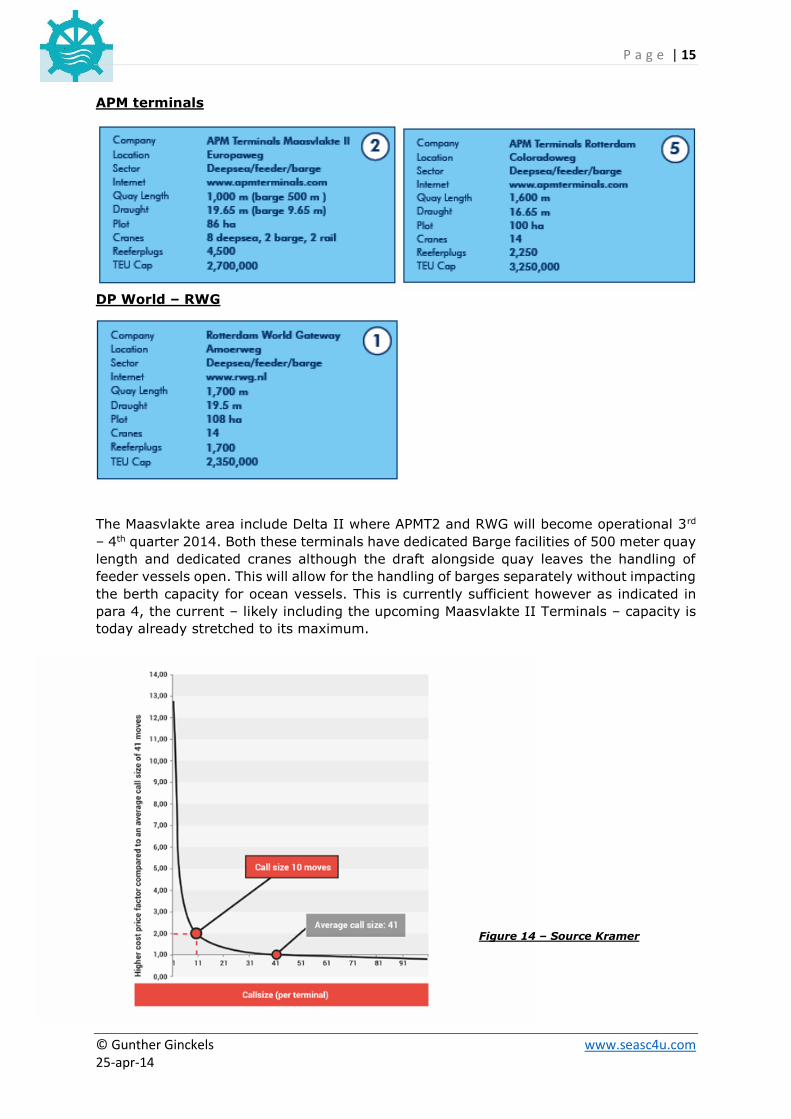
Figure 14 – Source Kramer
P a g e | 16
© Gunther Ginckels www.seasc4u.com 25-apr-14
Based on the current average number of moves it is estimated that the handling cost to
handle a barge with only 10 moves is double compared to barges with 41 moves (Figure
14)
If we assume that the economic break-even point to handle a barge in a cost effective
manner is 80 moves and the current handling rate is 70.- Euro we can establish that the
base cost to operate a barge is 5,600 Euro.
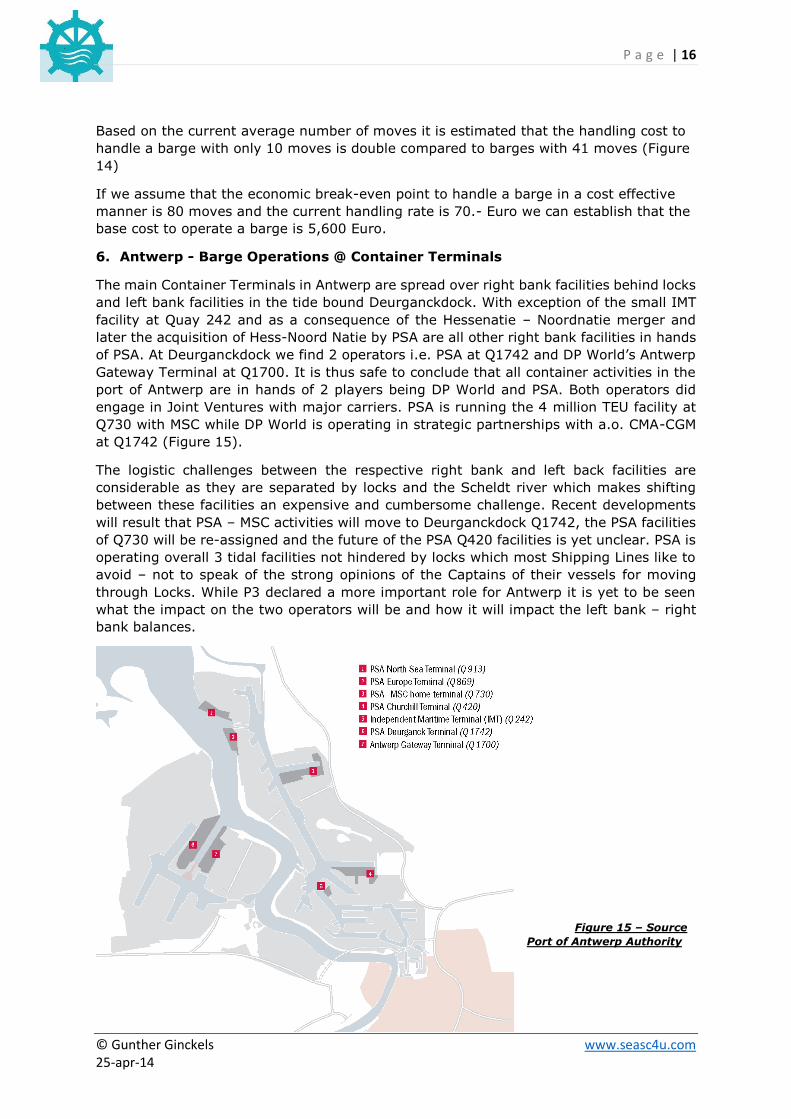
6. Antwerp - Barge Operations @ Container Terminals
The main Container Terminals in Antwerp are spread over right bank facilities behind locks
and left bank facilities in the tide bound Deurganckdock. With exception of the small IMT
facility at Quay 242 and as a consequence of the Hessenatie – Noordnatie merger and
later the acquisition of Hess-Noord Natie by PSA are all other right bank facilities in hands
of PSA. At Deurganckdock we find 2 operators i.e. PSA at Q1742 and DP World’s Antwerp
Gateway Terminal at Q1700. It is thus safe to conclude that all container activities in the
port of Antwerp are in hands of 2 players being DP World and PSA. Both operators did
engage in Joint Ventures with major carriers. PSA is running the 4 million TEU facility at
Q730 with MSC while DP World is operating in strategic partnerships with a.o. CMA-CGM
at Q1742 (Figure 15).
The logistic challenges between the respective right bank and left back facilities are
considerable as they are separated by locks and the Scheldt river which makes shifting
between these facilities an expensive and cumbersome challenge. Recent developments
will result that PSA – MSC activities will move to Deurganckdock Q1742, the PSA facilities
of Q730 will be re-assigned and the future of the PSA Q420 facilities is yet unclear. PSA is
operating overall 3 tidal facilities not hindered by locks which most Shipping Lines like to
avoid – not to speak of the strong opinions of the Captains of their vessels for moving
through Locks. While P3 declared a more important role for Antwerp it is yet to be seen
what the impact on the two operators will be and how it will impact the left bank – right
bank balances.
Figure 15 – Source
Port of Antwerp Authority
P a g e | 17
© Gunther Ginckels www.seasc4u.com 25-apr-14
26
51
35
15
35
31
11
23
15
13
19
21
0 10 20 30 40 50 60
1
2
3
4
5
6
Barge Activity - Antwerp
Avg Barges / Day Average Callsize
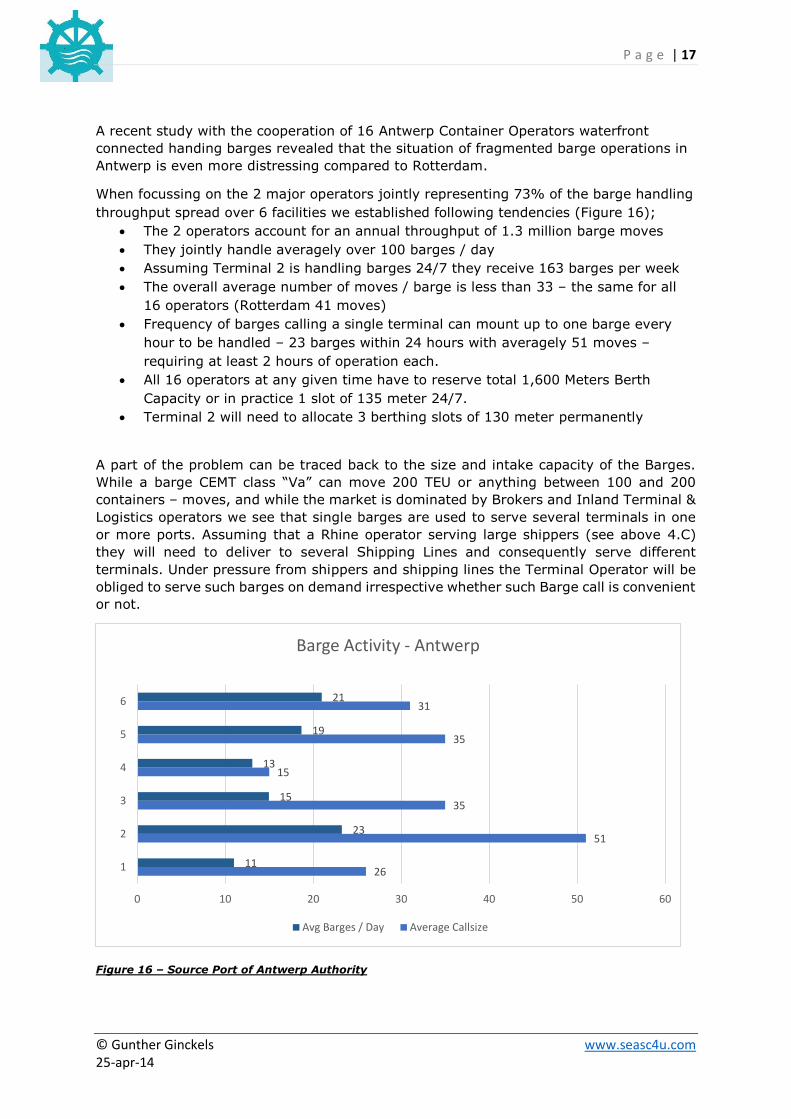
A recent study with the cooperation of 16 Antwerp Container Operators waterfront
connected handing barges revealed that the situation of fragmented barge operations in
Antwerp is even more distressing compared to Rotterdam.
When focussing on the 2 major operators jointly representing 73% of the barge handling
throughput spread over 6 facilities we established following tendencies (Figure 16);
The 2 operators account for an annual throughput of 1.3 million barge moves
They jointly handle averagely over 100 barges / day
Assuming Terminal 2 is handling barges 24/7 they receive 163 barges per week
The overall average number of moves / barge is less than 33 – the same for all
16 operators (Rotterdam 41 moves)
Frequency of barges calling a single terminal can mount up to one barge every
hour to be handled – 23 barges within 24 hours with averagely 51 moves –
requiring at least 2 hours of operation each.
All 16 operators at any given time have to reserve total 1,600 Meters Berth
Capacity or in practice 1 slot of 135 meter 24/7.
Terminal 2 will need to allocate 3 berthing slots of 130 meter permanently
A part of the problem can be traced back to the size and intake capacity of the Barges.
While a barge CEMT class “Va” can move 200 TEU or anything between 100 and 200
containers – moves, and while the market is dominated by Brokers and Inland Terminal &
Logistics operators we see that single barges are used to serve several terminals in one
or more ports. Assuming that a Rhine operator serving large shippers (see above 4.C)
they will need to deliver to several Shipping Lines and consequently serve different
terminals. Under pressure from shippers and shipping lines the Terminal Operator will be
obliged to serve such barges on demand irrespective whether such Barge call is convenient
or not.
Figure 16 – Source Port of Antwerp Authority
P a g e | 18
© Gunther Ginckels www.seasc4u.com 25-apr-14
The challenges for Barges in Antwerp are aggravated where the Left Bank Container
Terminals are separated from the Right Bank Terminals by the river Scheldt and locks.
From the 16 facilities, 2 are located on the Left Bank behind the Kallo Locks, 2 on the Left
Bank at the Deurganckdock tidal impacted but direct accessible from the river Scheldt, 2
Terminals are located on the right bank on the River Scheldt while all other 10 facilities
are located behind the locks. Apart from stowage and load planning challenges this also
causes serious issues in planning berthing schedules where lock coordinators obviously
prioritise ocean vessels prior inland barges.
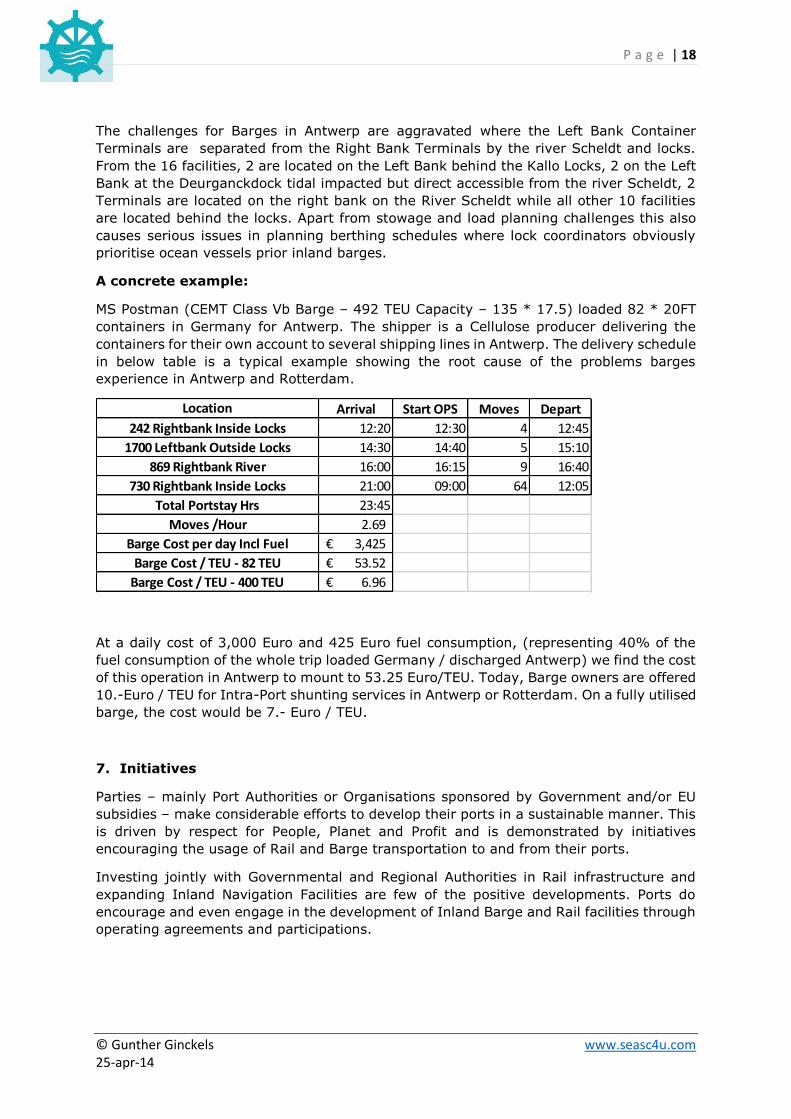
A concrete example:
MS Postman (CEMT Class Vb Barge – 492 TEU Capacity – 135 * 17.5) loaded 82 * 20FT
containers in Germany for Antwerp. The shipper is a Cellulose producer delivering the
containers for their own account to several shipping lines in Antwerp. The delivery schedule
in below table is a typical example showing the root cause of the problems barges
experience in Antwerp and Rotterdam.
At a daily cost of 3,000 Euro and 425 Euro fuel consumption, (representing 40% of the
fuel consumption of the whole trip loaded Germany / discharged Antwerp) we find the cost
of this operation in Antwerp to mount to 53.25 Euro/TEU. Today, Barge owners are offered
10.-Euro / TEU for Intra-Port shunting services in Antwerp or Rotterdam. On a fully utilised
barge, the cost would be 7.- Euro / TEU.
7. Initiatives
Parties – mainly Port Authorities or Organisations sponsored by Government and/or EU
subsidies – make considerable efforts to develop their ports in a sustainable manner. This
is driven by respect for People, Planet and Profit and is demonstrated by initiatives
encouraging the usage of Rail and Barge transportation to and from their ports.
Investing jointly with Governmental and Regional Authorities in Rail infrastructure and
expanding Inland Navigation Facilities are few of the positive developments. Ports do
encourage and even engage in the development of Inland Barge and Rail facilities through
operating agreements and participations.
Arrival Start OPS Moves Depart
12:20 12:30 4 12:45
14:30 14:40 5 15:10
16:00 16:15 9 16:40
21:00 09:00 64 12:05
23:45
2.69
3,425€
53.52€
6.96€
730 Rightbank Inside Locks
Total Portstay Hrs
Moves /Hour
Barge Cost per day Incl Fuel
Barge Cost / TEU - 82 TEU
Barge Cost / TEU - 400 TEU
Location
242 Rightbank Inside Locks
1700 Leftbank Outside Locks
869 Rightbank River
P a g e | 19
© Gunther Ginckels www.seasc4u.com 25-apr-14
Both the Port of Rotterdam and Antwerp acknowledge the challenges in terms of berth
capacity for Barge Operations and initiated cross-stakeholder initiatives to support
planning efficiency. The objectives of both Projects are similar;
The improvement of the Integrated Planning of Terminals and Depots in the Port
To realise the efficient consolidation of streams (Call Optimisation)
Measure Performance
Effective Information Exchange
The Port of Antwerp Authority developed in-house the BTS (Barge Traffic System -
http://www.portofantwerp.com/nl/node/4667 ) where 16 facilities handling containers are
encouraged to participate. While the Port of Antwerp Authority is the driver of BTS, the 2
main Container Terminal Operators PSA and DP World are actively contributing to the next
phases. Overall the system works well and will resolve part of the issues Container Barges
and Terminal Operators are facing in Antwerp. As the BTS development is a continuous
process they entered recently in the next phase of BTS development.
The Port of Rotterdam recently started a similar programme named “NextLogic”
(http://www.nextlogic.nl/uk/ ). The IT solution they intend to develop as a common
planning platform is named “BRAIN”. Although BRAIN is not operational yet, NextLogic is
also entering into the next phase of development. While the NextLogic Team visited the
BTS Team in Antwerp, it seems that they are about to re-invent the wheel again intending
the deployment of a Rotterdam exclusive IT solution. This would be a sensible approach if
and when the underlying Business Processes of Integrated Planning of Terminals and
Depots for Barges would be fundamentally different in Rotterdam compared to Antwerp.
While such planning tools will add value to the operational processes between Barges and
Terminals, it does not contribute to resolving the fundamental problem of fragmented
Barge utilisation, the diversity of container supply per Barge and the consequent excessive
number of barges to be handled every day versus the available berth capacity of the
Terminals. BTS and BRAIN will – with all the best of intentions - only address the
symptomatic issues and not resolve the fundamental challenges in the Barge Industry.
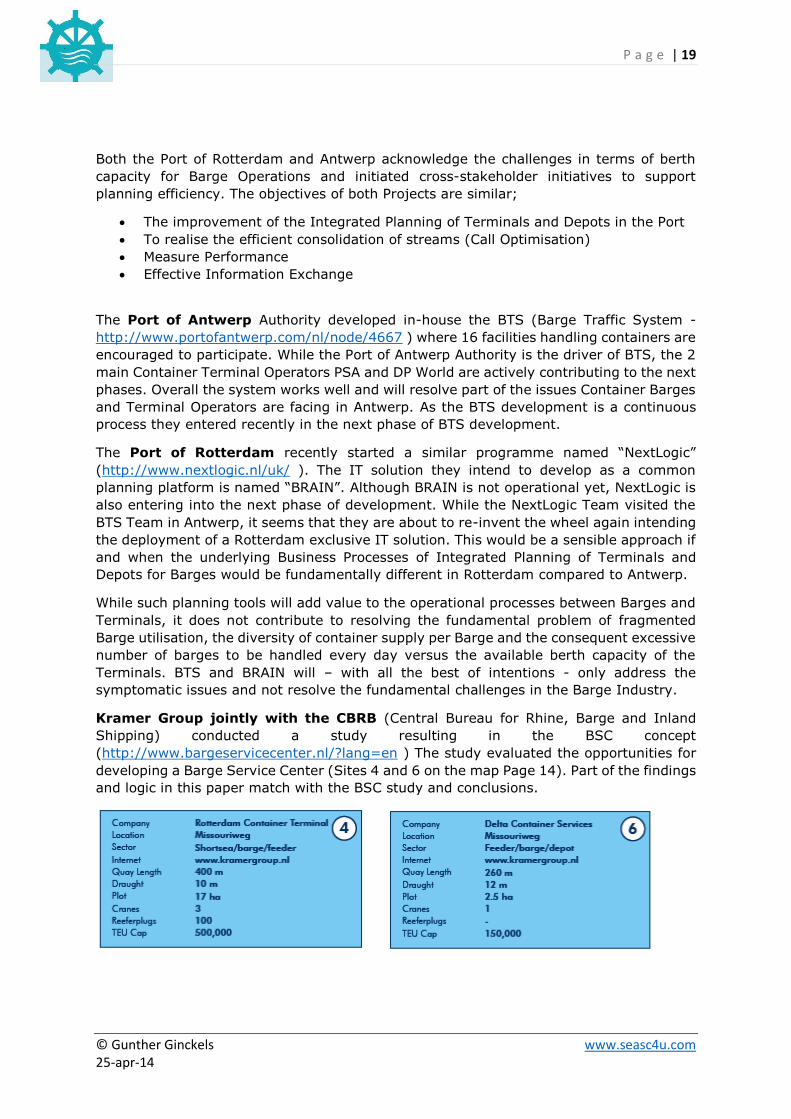
Kramer Group jointly with the CBRB (Central Bureau for Rhine, Barge and Inland
Shipping) conducted a study resulting in the BSC concept
(http://www.bargeservicecenter.nl/?lang=en ) The study evaluated the opportunities for
developing a Barge Service Center (Sites 4 and 6 on the map Page 14). Part of the findings
and logic in this paper match with the BSC study and conclusions.
P a g e | 20
© Gunther Ginckels www.seasc4u.com 25-apr-14
The study concluded that bundling of container numbers to and from the various seaport
terminals at Maasvlakte through a Barge Service Centre (BSC) will provide a real solution
within a short period of time.
Rotterdam Container Terminal (RCT) of the Kramer Group has been identified as the best
suitable location for the operation of the BSC. The effects are beneficial for both barge
operators and seaport terminals.
A BSC at RCT can also be launched immediately in a cost-effective manner and without
requiring complicated agreements. It is in the communal interest of the Port of Rotterdam,
the seaport terminals and barge operators that agreements are quickly reached on the
operation of a BSC. A condition to be fulfilled for the smooth and cost-efficient operation
of a BSC at Maasvlakte is the connection of all seaport terminals, empty container depots
and the BSC to the Internal Road System which allows for the transportation of containers
on 10-teu multi-trailer systems.
8. Recapitulation
Antwerp & Rotterdam are located within the EU Barge intense region connecting
the German Rhine-Ruhr, France, The Netherlands and Belgium through Inland
Waterways.
There is little synergy between the capacity of the Inland Navigation Infrastructure
and the CEMT Class Barges available in the market. Small Barges are often used
for Intra-Port shunting services while the intake capacity of CEMT Class Va and Vb
barges is poorly utilised.
Most of the European Barge Fleet is owned by single barge owners who invested in
new tonnage on basis of 2005-2007 Business Plans while at time of delivery in
2008-2009 the market for Inland Navigation collapsed
Brokers add value to some extend by consolidating volumes within designated
trade lanes as much as possible however are not sharing the burden of rate
pressure and tariff devaluation fairly by balancing this exclusively on Barge Owners
The German Barge scene has seen a consolidation of operators establishing a
virtual monopoly by holding both the Barge services and Inland Terminals under
control limiting the efficiency and effectiveness of 3rd party operators
Container Terminal Operators are confronted with an excessive number of barges
presented by different stakeholders and lack the courage to enforce barge
operation services on cost recovery basis
Shipping Lines abstain from seriously entering into Multimodal operations partly
due to lack of sufficient volume or strategies established to preserve their relations
with large logistic service providers by not entering into added value services on
the landside
The Container Terminal Operators have committed through their Concession
Agreements with Port Authorities to change the balance of Road – Rail – Barge
processed containers to the benefit of increasing the Barge transported portion
P a g e | 21
© Gunther Ginckels www.seasc4u.com 25-apr-14
The Container Terminals in Rotterdam receive Barges with average 41 moves per
call occupying considerable and disproportional berth capacity exclusively assigned
to Barge operations in a 24/7 working program
The Container Terminals in Antwerp receive Barges with average 33 moves per call
occupying considerable and disproportional berth capacity exclusively assigned to
Barge operations in a 24/7 working program
Initiatives to optimise berth planning in the Ports of Antwerp (BTS) and Rotterdam
(NextLogic) are not addressing the fundamental problems of underutilised barge
capacity and do not resolve the issue of low move count and inefficient usage of
Berth & Terminal Resources
9. Suggestions
There is no single solution to improve the current situation, nor is there a single
stakeholder holding the key to Inland Navigation efficiency. Fact is that already today we
see a need for action. Leaving the situation as-is today is irresponsible from a Profit point
of view, it would disregard People en be unrespectfull for the Planet. It is thus
unsustainable.
EBS (European Barge Shuttle)
By the Barge and Inland Terminal Operators
From a cost efficiency viewpoint and in the interest of their customers Inland Barge
Operators are to set-up JVC’s P3 alike. Establish a Barge Shipping entity where all partners
entering their tonnage and let this JVC unit deploy and operate a tailored barge fleet.
The JVC unit will operate as a cost centre maximising intake of available barge capacity
and consolidate volumes to reduce the number of Terminals in the Hinterland and in the
Ports. The partners will commit and buy-in 80% of the capacity with own controlled
volumes while 20% will be marketed for 3rd party spot business in as far as it fits in the fixed schedule, rotation and Terminals calling.
Barge Handling Sliding Scale
By the Port Container Terminals
Today the Ocean Container Terminal Operators are not recovering the cost of operating
barges. With averagely 41 and 33 moves per barge in respectively Rotterdam and Antwerp
they handle barges at a loss.
It can be argued that the fixed cost for loading /discharging a barge relates to
administration by producing discharge lists, loading and stowage plans, walking time of
gangs, allocating straddle carriers or other handling equipment, positioning cranes etc.. can be recovered when the number of moves breaks-even at a minimum.
From earlier calculations we learned that the minimum fixed cost prior handling the first container is estimated at 5,600 Euro.
P a g e | 22
© Gunther Ginckels www.seasc4u.com 25-apr-14
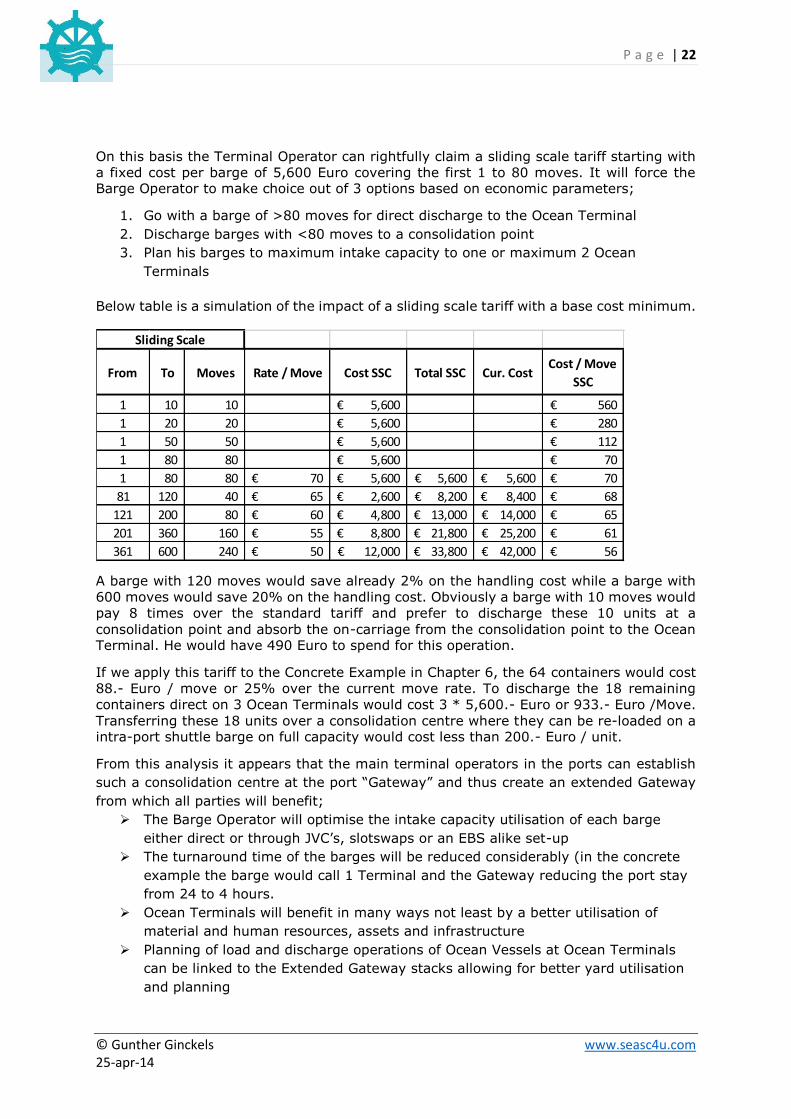
On this basis the Terminal Operator can rightfully claim a sliding scale tariff starting with
a fixed cost per barge of 5,600 Euro covering the first 1 to 80 moves. It will force the Barge Operator to make choice out of 3 options based on economic parameters;
1. Go with a barge of >80 moves for direct discharge to the Ocean Terminal
2. Discharge barges with <80 moves to a consolidation point
3. Plan his barges to maximum intake capacity to one or maximum 2 Ocean
Terminals
Below table is a simulation of the impact of a sliding scale tariff with a base cost minimum.
A barge with 120 moves would save already 2% on the handling cost while a barge with
600 moves would save 20% on the handling cost. Obviously a barge with 10 moves would
pay 8 times over the standard tariff and prefer to discharge these 10 units at a
consolidation point and absorb the on-carriage from the consolidation point to the Ocean Terminal. He would have 490 Euro to spend for this operation.
If we apply this tariff to the Concrete Example in Chapter 6, the 64 containers would cost
88.- Euro / move or 25% over the current move rate. To discharge the 18 remaining
containers direct on 3 Ocean Terminals would cost 3 * 5,600.- Euro or 933.- Euro /Move.
Transferring these 18 units over a consolidation centre where they can be re-loaded on a intra-port shuttle barge on full capacity would cost less than 200.- Euro / unit.
From this analysis it appears that the main terminal operators in the ports can establish
such a consolidation centre at the port “Gateway” and thus create an extended Gateway
from which all parties will benefit;
The Barge Operator will optimise the intake capacity utilisation of each barge
either direct or through JVC’s, slotswaps or an EBS alike set-up
The turnaround time of the barges will be reduced considerably (in the concrete
example the barge would call 1 Terminal and the Gateway reducing the port stay
from 24 to 4 hours.
Ocean Terminals will benefit in many ways not least by a better utilisation of
material and human resources, assets and infrastructure
Planning of load and discharge operations of Ocean Vessels at Ocean Terminals
can be linked to the Extended Gateway stacks allowing for better yard utilisation
and planning
From To Moves Rate / Move Cost SSC Total SSC Cur. CostCost / Move
SSC
1 10 10 5,600€ 560€
1 20 20 5,600€ 280€
1 50 50 5,600€ 112€
1 80 80 5,600€ 70€
1 80 80 70€ 5,600€ 5,600€ 5,600€ 70€
81 120 40 65€ 2,600€ 8,200€ 8,400€ 68€
121 200 80 60€ 4,800€ 13,000€ 14,000€ 65€
201 360 160 55€ 8,800€ 21,800€ 25,200€ 61€
361 600 240 50€ 12,000€ 33,800€ 42,000€ 56€
Sliding Scale
P a g e | 23
© Gunther Ginckels www.seasc4u.com 25-apr-14
10. Conclusions
This paper has the sincere intention to provide an upright view on the current situation of
Inland Navigation in North West Europe. It has by no means the pretention to be complete
nor is it claiming to be right on everything nor that it offers “million dollar” solutions. Some
readers might disagree with some of the information, facts or figures. Some might feel
offended however feel free to fit the shoes and point-out such differences and express
disagreements – it will contribute to an open and industry wide debate from which all
stakeholders can benefit. Be however aware that the information is sourced from insiders
and main stakeholders in the Transportation Industry and shared out of a genuine sense
of concern and urgency to take action.
Only when we keep an open mind and focus on the real important objectives on how to
develop our multimodal and logistic operations in a sustainable way with empathy to future
generations we will be able to keep the engine oiled and moving.
Transporting 45% by Barge by 2035 is a less than ambitious target – we can and need to
do better and reach this target much sooner if we want. Transporting goods over inland
waterways is a key factor to the possible solutions where we see that current Infrastructure
of canals and rivers on the one hand and cargo carrying capacity of the Barges on the
other hand have all the potential to meet the objectives of current and future sustainable
logistic solutions. A platform balancing People, Profit and Planet is a solid foundation for
such developments. This study a modest contributor.
Gunther Ginckels
Brand Owner – SEASC4U
M: +32 475 350 755
E-Mail: [email protected]
www.seasc4u.com