Injet Printer Life Cycle Inventory-final - Amazon S3s3.amazonaws.com/zanran_storage/ Cycle Inventory...
42
Life Cycle Inventory for an Inkjet Printer Jason Ord Tom DiCorcia December 21, 2005 ME 589 EcoDesign and Manufacturing FALL 2005 University of Michigan Ann Arbor, Michigan, USA
Transcript of Injet Printer Life Cycle Inventory-final - Amazon S3s3.amazonaws.com/zanran_storage/ Cycle Inventory...

Life Cycle Inventory
for an Inkjet Printer
Jason Ord
Tom DiCorcia
December 21, 2005
ME 589 EcoDesign and Manufacturing
FALL 2005
University of Michigan
Ann Arbor, Michigan, USA

Abstract In this report we provide a lifecycle inventory for an inkjet printer. The goal of the study is to increase awareness among engineers and product planners of the extended (lifecycle) material flows of the components that make up a typical inkjet printer. In addition, this study can be used to identify parts of the printer lifecycle that have large flows of materials of concern (such as green-house gases) for a more in-depth look. We built the inventory with the assistance of a life-cycle database and via a literature search. This approach is relatively fast and can yield high-level, crude, but useable results.
The study identifies the use phase as having the greatest environmental resource flows. The measured consumption of raw materials, production of solid waste and effluents into air and water were all dominated by use of paper, the flow of electricity to the printer and the consumption of ink cartridges.
Although the electronics used in the printer make up less than 14% of the printer weight, these parts had significant associations with greenhouse gases and SOX – probably from the amount of copper reported. The Boustead database provided little information for electronics. This is an area where a better estimate would be valuable.
Acknowledgements The authors would like to thank the following individuals for providing assistance: Professor Steven J. Skerlos Professor Gregory A. Keoliean David V. Spitzley

(Table of Contents)
I. Introduction In selecting materials, product engineers have been trained to optimize quality, cost and delivery. If the cost of a material reflected the environmental impact of its use, then traditional design methodologies would yield products that would have a low impact. In fact, this is not the case. Material costs usually do not include most of the environmental costs associated with their extraction, processing of by-products and eventual disposal.
Life Cycle Assessment (LCA) is a powerful tool for measuring the environmental impacts that otherwise may not be adequately accounted for. Armed with this information, product engineers can make material and process selections that can make a product more environmentally friendly, which – besides being a generally good thing – can be of considerable economic value. Businesses, institutions and consumers are increasingly evaluating products and vendors on their environmental performance. Access to entire markets can depend on meeting legislated environmental design standards.
A complete LCA includes a life cycle inventory, an analysis of the environmental impacts, and an analysis of potential improvements. The life cycle inventory defines the materials and energy associated with a product over its life cycle – from extraction of the raw materials, throughout its useful life, to eventual reuse, recycling or disposal at end of life. See the figure below for a visual explanation of the life-cycle inventory [1].
raw material gathering & processing
manufacturing use end-of-life
transport transport transport
materials
energy water
water effluents airborne
emssionssolid waste
utility
recovered materials
recovered energy
Figure 1. A Product’s Life-cycle Inventory

The impact analysis evaluates the effects of the material flows identified in the inventory stage. The improvement analysis – or life cycle interpretation – includes recommendations for lessening environmental impacts.
II. Goal of the Study The goal of the study is to take a first-pass look at the extended (lifecycle) material flows of the components that make up a typical home inkjet printer. This “rough-cut” at the overall material flows will help guide more detailed studies that can more accurately assess the true flows as well as evaluate the effects different design strategies have on the material flows.
The advent of computers and the internet have drastically increased the amount of printing done at home from the days of electric typewriters. Given the amount of school reports, photos, recipes printed at home every day in the United States, it is very likely that home printing exerts a significant impact on our planet. Since the majority of home printers incorporate inkjet technology, this report focuses on printers of that type.
The intended audience of product engineers can use this study to gain a broad appreciation of the magnitude of the material flows for different parts of the printing system life cycle, to stimulate thinking about the environmental impacts of their decisions and to build support for more extensive life cycle analysis within the printer division.
This study is not intended to provide information at a level of accuracy or completeness that would be needed to assess the actual environmental impact of the specific printers involved, so it should not be used to evaluate these printers against any external standard, nor should this study be used to compare these printers with an LCA for another product.
III. Scope of the Study Rather than a complete Life Cycle Assessment, this study is limited to a Life Cycle Inventory Analysis. An Inventory Analysis can still provide a snapshot of a product’s interactions with the environment. Although this snapshot does not directly tell the story of the actual impacts the product has on the environment, we will present the inventory results of material flows that are know to have high environmental impacts.
Given the limited time we had to conduct this study, the scope is limited to the that of the material inventory database we used and as is the case for electronics, the data we could find via our own searches. In general the material inventory database estimates the inventory down to the raw material level but this is not true for every element we analyzed. Therefore, the scope varies for different elements in our study and depends on the depth of data readily available. Although this scope definition is not adequate for a “true” LCA we feel it serves our original goal, which is to identify the key material flows in a home inkjet printer’s lifecycle. We estimated the inventories for the following items in this LCI:
1. Production Phase (includes raw material gathering and processing, manufacturing)

a. Printer
i. Mechanical components
ii. Electrical components
iii. Final printer packaging
iv. Final printer shipping (container-shipping portion only)
2. Use Phase
a. Printer Electricity Consumption
b. Printer Paper Consumption
c. Printer Cartridge Consumption
i. Mechanical components (not including ink)
ii. Electrical components
iii. Final cartridge packaging
iv. Final cartridge shipping (container-shipping portion only)
This LCI does not include the end-of-life phase beyond tracking the amount of solid waste material. No energy recovery or recycling was considered.
IV. LCA Methodology, Modifications and Limitations
4.1 Methodology
Wherever possible, the LCA definitions and guidelines of the ISO 14040 standards are employed.
The LCA database used is Boustead Model 5.0 from Boustead Consulting Ltd. Therefore, the system boundaries, energy mix and material flows will be consistent with the Boustead model.
4.2 Functional Unit
The functional unit for this study is 100 pages of printed output. The lifetime we assume for the printer is 3 years. We further assume that an average of 7500 pages will be printed in these three years, so 100 pages represents 1/75th of the printer’s life.
4.3 Key Assumptions
Some of the information used in this report is taken or measured from an actual inkjet printer. For instance, the printer mechanical and electrical inventories, and the printer electricity usage are based directly on the measurements of one inkjet printer brand and model. Other information, such as cartridge yields are taken from the manufacturers published data are were not independently verified. When neither of the first two categories of information were available, we made our own assumptions and documented them. An example of this is the printer usage profile, which includes our assumptions on the lifetime of a printer, the types of pages printed, etc. The use profile is described in the results section and detailed in the appendix.

4.4 Limitations
Printed wiring board (PWB) and electronic components are not modeled in the Boustead database and life cycle inventory information for these items is not readily available from other sources. We broke down the electronic components as best as we could, isolating and weighing key materials and using external references to estimate key resources used in the production of the circuit boards and semiconductors. Refer to the section on PWBs for more detail. Materials we could measure or estimate– which are a subset of the total – were entered into Boustead and aggregated with the other, non-electronic, materials that were previously entered into the model.
As is typical of products that consume materials and energy, much of the environmental impact for these printers involves the use phase. Inkjet printers are machines for producing printed pages, and they unavoidably consume paper and ink throughout their useful life. Printed paper and the cartridge materials are included in this study, but the ink in the cartridges is not.
Inkjet printers are energy consuming products. Although this study uses accurate information for the energy consumed by the printers during the different modes of operation – printing, standby, and sleep mode – assumptions are made regarding the average use profile. Refer to the section on energy use for more detail.
V. Life Cycle Inventory Analysis
5.1 General Product Description
The subject of this analysis is a general purpose inkjet printer designed for home use. General purpose refers to the fact that it is designed to do a satisfactory job of printing both text and photos, but not optimized for either, so it will likely be used for both types of work by most owners.
There is no mechanical duplexer, but the printer will prompt the user to turn over the pages for printing on two-sides. The printer accepts two types of ink cartridges – one optimized for text printing, another optimized for photo printing.
A packaged printer comes with a black ink cartridge, a color ink cartridge, a power cord, an external power supply (“brick”), a USB cable a CD-ROM (with software), and documentation.
The dimensions are approximately 460 mm wide by 220 mm deep by 170 mm high and it weighs about 3.6 kg. The list price for the printer at the time of the analysis is under $100.
5.2.1 Polymers
The printer uses polymers for its covers, primary structure, and mechanical parts. The two most common polymers in printer we analyzed are primarily high-impact-polystyrene (HIPS) and acrylonitrile-butadiene styrene (ABS). In order to make this study more tractable, the printer plastics not ABS or HIPS were assumed to be ABS for modeling purposes. 86% of the polymers in the printer are recyclable, where the others

are not due to the presence of fillers. The Boustead database had codes for the ABS and HIPS, but no manufacturing codes such as palletizing and injection molding. Thus, the intermediate material processing, packaging, and shipping are not included in the scope of this report.
5.2.2 Metals
The printer employs galvanized steel sheet-metal for structure, plated steel shafts, copper (in the motors) and some aluminum. All of this material is considered recyclable, although the copper in the motors could be considered a “knock-out” element that would inhibit steel recycling. Again, the Boustead database had codes for all three metal’s raw materials but nothing for the processing, packaging, and shipping and thus were not included in this report.
5.2.3 Electronic Assemblies
There are surprisingly few published LCAs for electronic products – particularly for PWB assemblies and electronic components. PWB and electronic components are not modeled in the Boustead database used for this printer LCA, so we turned to published papers and industrial sources to estimate inventory flows for the electronic assemblies in the printer. The information is not comprehensive and what we were able to collect does not neatly align with Boustead, but the affect of these distortions on the overall LCA for the printer should be small as the weight of the electronic components make up just 3% of the printer weight. Even so, we chose not to ignore the electronics because their environmental impact can be disproportionate to their weight.
The electronics in the printer consist of six printed wiring board (PWB) assemblies totaling 256 grams. These are all lead-free assemblies. The circuit boards are made of 1.6 mm thick epoxy coated glass fiber cloth laminate plated with copper. This is consistent with standard FR4 laminate – a very popular substrate. Through a complex, wet process of masking, lithography and plating, electronics manufacturers create a printed circuit board (PCB) from the un-patterned laminates. The epoxy (polyamide resin) may be mixed with a brominated flame retardant. Standard FR4 boards come in “one ounce” and “two ounce” copper – referring to the amount of copper foil per square foot. Some of this copper is stripped away and additional copper is plated on to form the circuit pattern. The total estimated weight of copper in these circuit boards is 11.9 g. Based on industry average figures provided by the Printed Wiring Board Resource Center (PWBRC) water used to make this printer’s boards totaled 8 liters.
In this printer’s assemblies, small electronic components are surface mounted and larger components are mounted to the boards using through-holes. The equipment manufacturer Vitronics estimates that wave soldering consumes 0.000202446 kWh/cm2
of PWB area. This is the figure for lead-free solder and VOC-free flux – which are environmentally preferable, but require more energy in process.
Connecting wires and cables in the printer were measured, and contain 88 g of copper. There is an additional 17 g of copper in two coils and two transformers mounted on circuit boards.
The passive components mounted on the PWBs are ignored. There are 16 semiconductors of varying size and type. All use plastic packages. Williams published an oft cited paper

that highlighted the fact that input materials for a semiconductor have a mass that is many times the weight of the finished product. We used figures from this paper to estimate some of the major inputs for the semiconductors in the printer. Some of these figures have been questioned, but alternative figures are not available.
For all of the electronic assemblies we obtained the following total inputs, which were entered into Boustead: Major Inputs (electronics)
Process Electric (MJ) 52.5 Process Water (l) 150.5 Copper (g) 121.8 Epoxy (g) 34.6
Glass (fiber) (g) 22.0
For supporting information please refer to the electronics section of the appendix.
5.2.4 Printer Packaging
The printer packaging consisted primarily of a cardboard box, along with paperboard and polystyrene restraints. In addition, the printer packing included polycarbonate (in the form of a compact disc), and paper (user’s manuals). All of these items were modeled with the limitations described in the polymers section. The details of the paper modeling will be described shortly.
5.2.5 Printer Shipping
Since we did not know the final assembly location for this particular printer, we assumed it was manufactured in Tianjin, China, which is an industrial city near Beijing. We included in this model an estimate of the container-shipping from a port near Tianjin to Oakland, California.
5.3 Use Phase
As is typical of products that consume materials and energy, much of the environmental impact for these printers involve the use phase. The three primary aspects of a printer’s use phase are paper, ink cartridges, and electricity. We assumed in this study that the printer is used in the United States, and thus used average United States figures for the energy generation inventories.
5.3.1 Consumables
InkJet printers are machines for producing printed pages, and they unavoidably consume paper and ink throughout their useful life.
5.3.1.1 Paper
Printer paper was not included in the Boustead model, but information suitable for the inventory was collected from other sources.
5.3.1.2 Ink Cartridges
The cartridges in this study are simplified to consist of polyethylene terephthalate (PET) glass-filled polyester and electronics. The estimates of these materials are subject to the

same polymer and electronics modeling constraints listed previously. The ink is not included in the scope of this study due to the analytical complexity of reducing it to its constituent elements and the general lack of information about the material flows associated with those elements.
5.3.2 Energy Use
Inkjet printers are energy consuming products. Although this study uses accurate information for the energy consumed by the printers during the different modes of operation – printing, standby, and sleep mode – we make several assumptions regarding the average use profile described in more detail later in this report.

VI. Results and Discussion
VI.1 Outputs Reported For each functional unit of 100 pages printed, we provide the amount of lifecycle resources expended. We track 11 items in four categories described in the table below. We chose these items because they are significant factors in the planet’s ecology.
Main Output Category Sub-categories Units per 100 pages
Energy/CO2 Energy MJ
CO2 Equivalent 1EE4 mg
Air Emissions Dust (PM10) mg
CO mg
SOX as SO2 mg
NOX as NO2 mg
Hydrocarbons mg
Water Emissions BOD – Biological Oxygen Demand mg
COD – Chemical Oxygen Demand mg
Raw Materials / Solid Waste Raw Materials mg
Solid Waste mg
These outputs are defined per Boustead as:
Energy – Total gross energy, which is the sum of fuel production and delivery energy, energy content of delivered fuel, energy use in transport and feedstock energy.
CO2 Equivalent – The 20-year Global Warming Potential (GWP) from all Greenhouse gases (GHG) emitted, expressed as an equivalent weight of CO2. This total figure is the sum of GHG from fuel production, fuel use, transport, process, biomass (negative) and fugitive emissions (from the storage and transport of gasses).
Dust (PM10) – The amount of dust, with a particle size of less than 10 microns, that is released into the atmosphere.
CO – Carbon Monoxide released.
SOX as SO2 – The amount of Sulfur Oxides (SOX) released, expressed as an equivalent weight of SO2.
NOX as NO2 – The amount of Nitrogen Oxides (NOX) released, expressed as an equivalent weight of NO2.
Hydrocarbons – The weight of hydrocarbons released into the air from all sources.

BOD – The weight of chemicals that impose a Biological Oxygen Demand (BOD) in the water into which it is released. Water emissions are the cumulative totals traced back to material extraction and they are net releases – after treatment.
COD – The weight of chemicals that impose a Chemical Oxygen Demand (COD) in the water into which it is released. Water emissions are the cumulative totals traced back to material extraction and they are net releases – after treatment.
Raw Materials – Sum of the weight of all materials extracted from the earth including compressed gases, and adjusted for sulfur obtained from other waste processes – such as oil refining.
Solid Waste – The total weight of solid waste traced back to material extraction. Total waste exceeds materials used in the printer and consumables because activities, such as mining coal for electricity generation, create a substantial amount of waste.
VI.2 Base Case Description A base case was constructed that represents the expected usage for an average printer.. This use profile is detailed in a table in the appendix. The key features are:
Use Parameter Assumed Value for Base case
Printer lifetime 3 years
Total number of pages printed 7500
Pages printed per week 48
Printing time per week 0.16 hours
Standby time (power on, not printing) 50% 24 hrs/7 days; 50% 8 hrs/5 days per week
Power off time (plugged in) 50% zero time off; 50% 104 hours per week
The electricity consumed, the weight of paper used and the number of ink cartridges consumed were derived from the base case use assumptions. Electricity and paper weight were directly entered into Boustead. The ink cartridge was broken down into its materials and the weights of these were entered into Boustead.
The weights of all non-consumable materials in the printer were put into the production subcategory. This category was further subdivided into additional categories, including:
Production – Printer Mechanical – The resources expended in production of the non-electronic components of the printer, but not including the packaging, shipping or consumables.
Production – Printer Electronics – The resources expended in production of the electronic components of the printer, including the electronic circuit board (PWB) assemblies, power supply, power cords, and all cabling, but not including electronic components in the consumable ink cartridges.

Production – Printer Shipping and packaging – The resources expended in production of the packaging and transport of the printer to its user.
Use – Electricity – Electric energy consumed in operation of the printer following the base case assumptions.
Use – Paper – Paper consumed in operation of the printer following the base case assumptions.
Use – Cartridges – Ink cartridges consumed in operation of the printer following the base case assumptions.
The following report sections present the results of our analysis with discussion.

VI.3 Base Case: Energy and CO2 Equivalent This section examines energy consumed and CO2 equivalents emitted in the production of the printer and also its consumables – electricity, paper and ink cartridges.
Energy and CO2, Base Case (per 100 pages printed)
0
20
40
60
80
100
120
Total Energy (MJ) CO2 Equivalent (1E4 mg)
ProductionUseOverall
Figure XXA shows that the use phase dominates the lifecycle energy consumed. The CO2 emissions, as expected, are also highest for the use case, but the use phase for CO2 does not dominate the production phase to the extent it does for energy consumed.
In figure XXB, we see that paper consumed in the use phase provides a negative contribution to CO2 equivalent emissions. This explains why the use phase is not as dominant for CO2. The negative CO2 emissions surprised us, and although we tried to get an explanation for this phenomena from the Boustead software group (who were generally very helpful throughout this process) we were unable to obtain one as of this writing. One possible explanation is that the Boustead model assumes that the trees cut for the paper are replaced with new trees which consume greater amounts of CO2 than the mature trees cut down.

Energy and C02, Base Case (per 100 pages printed)
-100
-50
0
50
100
150
Total Energy (MJ) CO2 Equivalent (1E4 mg)
Production- Printer MechanicalProduction- Printer ElectronicsProduction- Printer Shipping and PackagingUse- ElectricityUse- PaperUse- Cartridges

VI.4 Base Case: Air Emissions This section examines the pollutants emitted to the air in the production of the printer and also its consumables – electricity, paper and ink cartridges.
Air Emissions, Base Case (per 100 pages printed)
0
2000
4000
6000
8000
10000
12000
14000
Dust (PM10) CO SOX as SO2 NOX as NO2
mg
ProductionUseOverall
The figure above shows that the use phase dominates the lifecycle air effluents in every category reported here. In the figure below, we see SOX is at least as much caused by paper consumption as it is by electricity consumption. On the other hand, NOX is mostly a product of electricity consumption. Paper consumption is also associated with most of the particulate generation.

Air Emissions, Base Case (per 100 pages printed)
0
500
1000
1500
2000
2500
3000
3500
4000
4500
5000
Dust (PM10) CO SOX as SO2 NOX as NO2
mg
Production- Printer Mechanical
Production- Printer Electronics
Production- Printer Shipping andPackagingUse- Electricity
Use- Paper
Use- Cartridges

VI.5 Base Case: Water Emissions This section examines the pollutants emitted to water in the production of the printer and also its consumables – electricity, paper and ink cartridges.
Water Emissions, Base Case (per 100 pages printed)
0
1000
2000
3000
4000
5000
6000
7000
8000
COD BOD
mg
ProductionUseOverall
The figure above shows that the use phase highly dominates the lifecycle water effluents, and that Chemical Oxygen Demand seems to be much more of a problem than Biological Oxygen Demand. In figure below, we see that paper consumption is, by far, the largest cause of Chemical Oxygen Demand.

Water Emissions, Base Case (per 100 pages printed)
0
1000
2000
3000
4000
5000
6000
7000
COD BOD
mg
Production- Printer Mechanical
Production- Printer Electronics
Production- Printer Shipping andPackagingUse- Electricity
Use- Paper
Use- Cartridges

VI.6 Base Case: Raw Materials and Solid Waste This section examines the materials used and solid waste generated related to the production of the printer and use of its consumables – electricity, paper and ink cartridges
Raw Materials and Waste, Base Case (per 100 pages printed)
0
500000
1000000
1500000
2000000
2500000
Raw Materials Solid Waste
mg
ProductionUseOverall
The figure above shows that the use phase highly dominates the weight of total raw materials consumed.
In the figure below, we see that paper consumption is, by far, the greatest contributor to raw material depletion and solid waste production.
The amount of solid waste is greater than the amount of raw materials used, because primary material and industrial waste is generated during the process of extracting raw materials.

Raw Materials and Waste, Base Case (per 100 pages printed)
0
200000
400000
600000
800000
1000000
1200000
1400000
1600000
Raw Materials Solid Waste
mg
Production- Printer Mechanical
Production- Printer Electronics
Production- Printer Shipping andPackagingUse- Electricity
Use- Paper
Use- Cartridges

VII. Improvement Scenarios This section addresses the question of what could be done to reduce the environmental impact of using this inkjet printer. The two largest contributors to inventory categories are paper consumption and electricity consumption – both during the use phase.
Paper clearly dominates in raw materials consumption and water emissions. Paper use also is a major contributor to SOX and particulate air emissions, as well as solid waste.
Electricity use dominates greenhouse gas production, and is the primary cause of SOX / NOX air pollutants. Not surprisingly, electricity use is also a major contributor to the total energy consumed – about equal to that for paper.
VII.1 Reduction in Paper Use The amount of paper used in the production of printed pages can be cut significantly by greater use of duplex (two-sided) printing. This printer does not have a mechanical feature that automatically flips paper over. It does have a software feature where the printer can be directed to print alternate pages, instruct the user to manually return the printed paper stack to the feeder in the proper position for printing of the remaining sides.
If more users could be encouraged to use the software duplexing feature, or if the manufacturer were to offer automated duplex printing on this model, a significant amount of paper could be saved – and this would reduce the overall environmental impact of the product.
To test this Life Cycle Inventory outputs were recalculated assuming that full duplexing were used. For purposes of analysis, we cut the number of pages of paper consumed in half. In practice, the actual amount of paper saved would be somewhat less than half because not every page would be printed on both sides. Single page (one-sided) print outs make up a significant portion of documents printed. Photographs, in particular, tend to be printed on one side. Multiple-page documents also usually include some single-sided pages.
Results are shown in the charts below, which compare several outputs for single-sided versus full-duplex printing. Wherever paper was the dominant driver for a particular environmental impact, cutting paper consumption in half – naturally – nearly cut that environmental impact in half. It is interesting to note that the equivalent CO2 emissions rise with the duplex scenario, clearly a function of paper’s negative CO2 emission described earlier. Whatever the mechanics of this phenomena, the net impact to the environment from increased paper consumption is harmful, when the increase in pollutants such as COD and SOX are considered.

Energy and CO2, Base Case (per 100 pages printed)
0
20
40
60
80
100
120
140
160
Total Energy (MJ) CO2 Equivalent (1E4 mg)
Overall BaseOverall Duplex
Air Emissions, Base Case (per 100 pages printed)
0
2000
4000
6000
8000
10000
12000
14000
Dust (PM10) CO SOX as SO2 NOX as NO2
mg Overall Base
Overall Duplex

Water Emissions, Base Case (per 100 pages printed)
0
1000
2000
3000
4000
5000
6000
7000
8000
COD BOD
mg Overall Base
Overall Duplex

VII.2 Reduction in Electricity Use In our base case we assumed that half of printer users would leave their printer power switch on all of the time, and half would turn their printer’s power switch off at nights and on weekends. Even when in so-called standby mode – that is power switch on, not printing – this printer draws 5.9 watts of power. The printer is not designed to go into a sleep mode after printing because it takes some time to reset itself if power is cut, and this delay could affect customer satisfaction.
Notwithstanding the problems with start up delays, Life Cycle Inventory outputs were recalculated assuming that the printer was turned off whenever it was not printing. This reduced energy scenario is probably not achievable given customer desires and the price level of this printer, but this extreme case provides a good test case should future technology permit a low cost printer to go into very low power standby when not printing.
The chart below shows that total energy consumption for the low power mode (identified as “off”) is 32% lower than our “base” mode. The improvement for greenhouse gas emissions was dramatically better – a reduction of 92%. The total energy reduction drop is not as significant as the CO2 drop because the feedstock energy of the paper is also a significant contributor to total energy.
Energy and CO2, Base Case (per 100 pages printed)
0
20
40
60
80
100
120
Total Energy (MJ) CO2 Equivalent (1E4 mg)
Overall BaseOverall "Off"

VIII. Sensitivity Analysis Although the bulk of the printer and consumable materials had codes in the Boustead database, there were some components, materials and processes that were not in the database. In these cases either a reasonable substitute was entered, or, in some cases, the component or material was omitted. To test the impact of these substitutions and omissions on our overall conclusions, we performed some sensitivity analysis.
VIII.1 Sensitivity Analysis – Production- Printer- Electronics Electronic components and electronic fabrication processes, in particular, were not well-represented in Boustead. Electronic components make up about 13.6% of the total weight of the unpackaged printer, but only 1.5% of the weight of the paper consumed over a typical printer lifetime. To better understand the sensitivity of our results to different input values for the electronics we recalculated the LCI outputs two times and plus and minus 50% of our nominal (estimated) impact from the electronics in the printer.
The figure above shows that the parameter in the model most sensitive to production electronics, total equivalent CO2, changes about 10% with a 50% change in the total production electronics inventory. Considering that it is likely we under-estimated the electronics inventory, this sensitivity is important but not great enough to invalidate our model for the purposes intended.
Model Sensitivity to Production Electronics Inventory(Total Equivalent CO2)
-15%
-10%
-5%
0%
5%
10%
15%
-50% 0% +50%
% Change of Total Production Electronics Inventory
% C
hang
e in
Tot
al C
O2
Equ
ival
ent

VIII.1 Sensitivity Analysis – Production- Printer Mechanical We feel that we were able to do a reasonable job breaking down the printer mechanical items into material inventories, albeit with some simplifying assumptions and the inability to model processes such as injection molding and stamping. However, the sensitivity analysis below shows that the portion of the model most sensitive to the production mechanical phase only swings 6% when the entire mechanical inventory is changed 50%. Thus, the mechanical modeling is adequate for our model’s goals.
Model Sensitivity to Production Mechanical Inventory(Total Equivalent CO2)
-8%
-6%
-4%
-2%
0%
2%
4%
6%
8%
-50% 0% +50%
% Change of Total Production Mechanical Inventory
% C
hang
e in
Tot
al C
O2
Equ
ival
ent
Finally we tested our model’s sensitivity to the assumption that one printer is used for every 7500 pages. We tested the model’s response at a printer life of 7500±50%. This is a large turn on a significant knob, so we expected some dramatic results. First we looked at the most sensitive parameter to production, total equivalent CO2. This parameter showed a large response, +35% given a 50% decrease in printer life in pages. This large swing is likely due to the fact that the paper is modeled as having a negative CO2 contribution and keeps the use phase from completely dominating this category. A more representative response is seen in the next figure, which shows a 15% increase in total electricity consumed for a 50% reduction in printer life in pages.

Model Sensitivity to Pages per Printer Assumption(Total Equivalent CO2)
-15%
-10%
-5%
0%
5%
10%
15%
20%
25%
30%
35%
40%
-50% 0% +50%
% Change of Pages per Printer Assumption
% C
hang
e in
Tot
al C
O2
Equ
ival
ent
Model Sensitivity to Pages per Printer Assumption(Total Energy)
-10%
-5%
0%
5%
10%
15%
20%
-50% 0% +50%
% Change of Pages per Printer Assumption
% C
hang
e in
Tot
al E
nerg
y
IX. Conclusion and Recommendations
We believe we met our goal of creating a high-level life-cycle inventory of an inkjet printer that could serve to show general trends in material flows and to point out key areas for more in-depth study. The sensitivity analyses clearly show two dominant contributors: paper and electricity. The material flows associated with paper consumption impact water quality (oxygen level via COD), resource consumption, solid waste, and air quality via SOX and particulate emissions. Electricity consumption impacts the planet temperature with greenhouse gas production. The air pollutants NOX and SOX are hazardous at ground level but are more likely released at higher altitude

where they have time to form acids and therefore cause acid rain. In addition, NOX enables urban smog production.
Our goal in this study is to understand the parameters of the inkjet printer and its operation and communicate these parameters to individuals in a position to make decisions that can reduce environmental impact of the printer over its full lifecycle. The individuals with the most impact on lifecycle impact for most products are the designers and product managers who engineer and request product attributes.
The first product attributes that a designer is likely to consider would be the materials, components and processes used in the physical printer. While these product characteristics do impact lifecycle impact, our study clearly shows that the consumables in the use phase of a printer have a much greater impact than printer itself. To understand this, one need only consider that the paper consumed in a typical home printer’s lifetime weighs over ten times the amount of the printer itself. Instead of focusing on material, mass and process decisions, decision makers should look more closely at how they can reduce consumption of paper, electricity and ink cartridges.
There may be apparent obstacles to reducing impact in the use phase. The manufacturer’s business model may be based on sales of consumables. Eliminating paper entirely from the process would probably not be an operational recommendation, because we work from the assumption that customers purchase the printer in order to get hard copy printed outputs. It may seem that electricity consumption is determined by user behavior and hence out of the hands of the designer. It is not our purpose to provide advice on how to overcome these kinds of obstacles, the report just identifies areas where the biggest problems exist and these may be the areas that provide the most opportunity for improvement.

References [1] Streamlined Life-Cycle Assessment, Thomas Graedel 1998, Prentice-Hall
“A SURVEY AND TUTORIAL OF DIELECTRIC MATERIALS USED IN THE MANUFACTURE OF PRINTED CIRCUIT BOARDS,” by Lee W. Ritchey, Speeding Edge, for publication in November 1999 issue of Circuitree magazine. Copyright held by Lee Ritchey of speeding edge, September 1999.
“Stabcor: Groundbreaking PCB and Substrate material,” Marketing information by VME Bus Systems. At http://www.vmebus-systems.com/pdf/ThermalWorks.Apr05.pdf.
(CTS) “Lead Free Process Overview,” CTS Manufacturing Solutions, June 2005. http://www.ctscorp.com/ems/datasheets/CTS_EMS_Lead_Free_Process_Overview.pdf
(Turbini) Laura J. Turbini, Gregory C. Munie, Dennis Bernier, Jürgen Gamalski, and DavidW. Bergman. “Examining the Environmental Impact of Lead-Free Soldering Alternatives,” IEEE Transactions on Electronics Packaging Manufacturing, Vol. 24, No. 1, January 2001.
(Vitronics) Marquez, Ursula, “Lead Free Soldering,” Vitronics Soltec powerpoint presentation, October 18, 2003. http://thor.inemi.org/webdownload/newsroom/Presentations/09.pdf
Williams, Eric D., Ayres, Robert U., Heller, Miriam. “The 1.7 Kilogram Microchip: Energy and Material Use in the Production of Semiconductor Devices,” Environmental Science and Technology, Vol. 36, No. 24, 2002. 2002, American Chemical Society.
Printed Wiring Board Resource Center. http://www.pwbrc.org/.

Appendices
A1. Electronics The printer has six printed wiring board (PWB) assemblies totaling 97.3 grams – 3% of the weight of the printer. These are all lead-free assemblies.
There are also three ribbon cables and three small wire cables, as well as one piece of ferrite ceramic.
Table A.1 – PWB Assemblies
ID Wt (g)
Area (cm2)
Circuit layers
A*Lay(cm2)
Vol (cm3)
Board wt (g)
Glass wt (g)
Epoxywt (g)
Cu wt (g)
1 03 62.5 37.1 2 74.2 5.89 10.60 5.94 4.66 4.53
2 41 17.8 15.0 2 30.0 2.38 4.29 2.40 1.89 1.83
3 13 7.8 6.0 2 12.0 0.95 1.72 0.96 0.76 0.73
4 05 5.4 5.2 1 5.2 0.83 0.99 0.83 0.16 .32
5 55 2.0 2.6 1 2.6 0.41 0.50 0.42 0.08 .16
6 14 1.8 2.1 1 2.1 0.33 0.40 0.34 0.06 .13
7 L 158.2 69.6 1 69.6 11.05 13.26 11.14 2.12 4.25
Tot 255.6 137.6 195.7 10.80 31.75 22.02 9.73 11.94
* Board Material: FR4 PCB is 1.8 gm/cm3; glass cloth with weight 0.16 g/cm2. Epoxy weight is taken as Board weight – glass weight.
A1.1 Printed Circuit Boards Through a complex, wet process of masking, lithography and plating, electronics manufacturers create a printed circuit board (PCB) from the un-patterned laminates.
The boards are 1/16” (approximately 1.6 mm) thick epoxy coated glass fiber cloth laminate. These dimensions suggest that the boards are made of FR4 material. The FR stands for “Flame retardant.” A brominated flame retardant is mixed in with the epoxy. FR4 has a density of 1.80 g/cm3 (Vme Bus). It uses 8 layers of glass fiber cloth with a weight of 0.02 g/cm2 per layer, or 0.16 g/cm2 for eight glass layers. The epoxy (polyamide resin) has a density of 1 g/cm3. A layer of copper foil is adhered to the outer surface of the board. Two (circuit) layer boards have two copper foils – one on each side. One layer (single sided) boards have one copper foil. The un-patterned copper-clad laminates are manufactured in a press.
Copper cladding standards are “one-ounce copper” and “two-ounce copper” which refers to the weight of copper covering one square foot of board – per layer of cladding. Assuming two-ounce copper for these boards, the relative weight of copper foil is:
(2 oz / ft2) x (28.3495231 g / oz) x (0.0010764 ft2 / cm2) = 0.061 g/cm2

The total estimated weight of copper in these circuit boards is 11.9 g.
Average water used in PCB manufacturing is 10 gallons per layer-foot-squared (PWBRC). For these boards:
195.7 cm2 * 0.0010764 ft2/cm2 * 10 gal/ft2 * 3.7854118 liters/gal = 7.97 liters
The average amount of sludge created (for offsite shipping) is 26 pounds per 1000 layer ft2 (PWBRC). For these boards:
195.7 cm2 * 0.0010764 ft2/cm2 * 0.026 lbs/ft2 * 453.5924 g/lb = 2.5 g
A.1.2 Electronic Components The board assemblies include a wide variety of electronic components including connectors, coils integrated circuits (ICs), electrolytic capacitors, ceramic capacitors, resistors, diodes, light emitting diodes (LEDs), and a crystal oscillator.
A.1.2.1 Integrated Circuits
There are seven ICs on the board assemblies -- four larger logic and memory devices, one intermediate sized chip, and six small chips.
Williams estimated the following impacts for a mature 32 Megabit DRAM chip manufactured on 200 mm diameter wafers. The package size is 2.7 cm2. The die size is 1.2 cm2.
Weight of chip – 2.0 g. Weight of epoxy in chip – 0.7 g. Weight of copper in chip – 1.2 g. (Boustead: epoxy is 64 MJ/kg; Copper is 140 MJ/kg)
Considering yield, input silicon wafer is 1.6 cm2 per chip.
Chemical input (45 g/cm2 x 1.6 cm2): 72 g Energy to produce these chemicals – 1.5 MJ to 39 MJ, depending on assumptions.
A1.3 Electronic Assembly The board assembly components are both through-hole and surface-mounted. The largest board has components mounted on both sides. All boards are RoHS standard lead-free. The solder is probably SnAgCu. The most common ratio outside Japan is the NIST standard of 95.6-3.5-0.9 tin-silver-copper, but the Japanese ratio of 96.5-3.0-0.5 tin-silver-copper is increasingly specified worldwide (CTS). These solder alloys have a melting temperature of 217 C, as compared with 183 C for SnPb (tin-lead) solders (Turbini), which means that energy consumption in fabrication will be higher for the lead-free solder. One manufacturer of wave soldering machines for leaded and lead free solders estimates that lead-free wave soldering requires 3% more energy. Use of VOC-free solder flux (vs. alcohol-based) increases energy consumption by 8%. Wave solder machines have a forced convection pre-heater to set up flux. The power consumption for 162 boards using SnAgCu solder and VOC-free flux was measured at 19.5 kWh for 162

boards. Each board in this study was 9.6 x 9.6 inches (Vitronics). Energy consumption per cm2 of PWB assembly is:
19.5 kWh / (9.6x9.6)*(1/2.54x2.54)*162 = 0.000202446 kWh/cm2
Wave solder energy for the board assemblies in the printer:
EWS = (0.000202446 kWh/cm2)*(137.6 cm2) = 0.027857 kWh (27.86 Wh) Wave soldering is the most energy-intensive process in board assembly. The energy required for the automated assembly and pick and place machines will be ignored.
A1.4 Cables and Wires There are three ribbon cables and three bundled copper wire cables, as well as one piece of ferrite ceramic associated with the ribbon cable.
The ribbon cable material is from Hitachi Cable Co., Ltd. and consists of tinned copper foil traces in a PET polyester insulation. The total weight of the ribbon material in this printer is 7.0 g. Of this weight approximately 3.7 g is copper and 3.3 g is PET.
The copper wire (standard electrical) has a total copper content of 1.8 g.
The ferrite filter weighs 9.9 g.
A1.5 Copper Content The total estimated weight of copper in these circuit boards is about 12 g
Total weight of copper in all connecting wires and cables is 88 g.
There is also a significant amount of copper wire in two coils and two transformers on PWB assemblies. The total weight of copper in these coils is 17 g.
The total weight of copper in the semiconductor chips is about 5 g.
All other copper in the circuit board assemblies is deemed to be negligible.
The total copper in the electronic assemblies is 122 g. Note that additional copper in the printer can be found in the electric motors and the power cable/power supply unit.

Table A.2 – Electronics Breakdown
No. Identifier Length Width
Pkg Area (cm2)
Die/Pkg ratio
Die Area (cm2) Yield
Wafer Area (cm2)
Chip Weight
(g)
Cu Weight
(g)
Epoxy Weight
(g) 1 1825-0069 18.7 18.7 3.497 0.444 1.554 0.625 2.487 2.6 1.6 0.92 Hynix 519A 22.2 9.5 2.109 0.444 0.937 0.625 1.500 1.6 0.9 0.53 ST 1825-0035 13.5 13.5 1.823 0.444 0.810 0.625 1.296 1.4 0.8 0.54 TI 54E73RTG4 9.5 9.5 0.903 0.444 0.401 0.625 0.642 0.7 0.4 0.25 ST25P32V6G 9.5 7.1 0.675 0.444 0.300 0.625 0.480 0.5 0.3 0.26 ST B5205 4.4 4 0.176 0.444 0.078 0.625 0.125 0.1 0.1 0.07 f df2AR 4 3 0.120 0.444 0.053 0.625 0.085 0.1 0.1 0.08 PHN210T/AM330 4 3 0.120 0.444 0.053 0.625 0.085 0.1 0.1 0.09 MCRBLEPD 4 3 0.120 0.444 0.053 0.625 0.085 0.1 0.1 0.0
10 S516/R518 4 3 0.120 0.444 0.053 0.625 0.085 0.1 0.1 0.011 S516/R518 4 3 0.120 0.444 0.053 0.625 0.085 0.1 0.1 0.012 power 9 7 0.630 0.444 0.280 0.625 0.448 0.5 0.3 0.213 twin1 6 4 0.240 0.444 0.107 0.625 0.171 0.2 0.1 0.114 twin2 6 4 0.240 0.444 0.107 0.625 0.171 0.2 0.1 0.115 small 4 3 0.120 0.444 0.053 0.625 0.085 0.1 0.1 0.016 small 4 3 0.120 0.444 0.053 0.625 0.085 0.1 0.1 0.0
Totals 7.916 8.245 4.947 2.886
Semicon Process inputs / cm2 all
chips Source Notes Fab Electricity (kWh) 1.5 11.87 Williams Packgng Elect (kWh) 0.34 2.691 Williams Water (l) 18 142.5 Williams 2 to 58 liters per cm2 Cu 4.947 Williams Epoxy 2.886 Williams Chemicals, input (g) 45.2 357.8 Williams PCB Cu (g) 11.94 Ritchey Glass (g) 22.02 Ritchey Epoxy (g) 31.75 Ritchey Water (l) 7.97 PWBRC Sludge (g) 2.5 PWBRC PWB Assembly (kWh) 2E-04 0.028 CTS Mfg
Copper in Wires (g) 87.98 Copper in Coils (g) 16.97 Al in wires, USB (g) 0.1
Major Inputs (electronics) Notes
Process Electric (MJ) 52.5 Process Water (l) 150.5 Assume de-mineralized Copper (g) 121.8 Assume electrolytic copper Epoxy (g) 34.6
Glass (fiber) (g) 22.0

A2. Base Use Case Assumptions
Usage Calculations – Base Case Description Figure Note
Printer Lifetime (years) 3 Estimate, sensitivity analysis required. Printer Lifetime (pages) 7500 Estimate, sensitivity analysis required. Average Print Mode Speed 5 Slow to allow for photos, etc. Printing Power (watts) 44.0 Standby Power (watts) 5.9 Off Power (watts) 0.6 Energy Useage Calculations Weekly Pages Printed 48
Weekly Printing Time (hours) 0.16 Weekly Printing Time (s) 574.96 Weekly Printing Energy (joules/week) 25298 Weekly Time Not Printing (hours) 167.8 Weekly Time On Standby (hours) 103.9 See assumption below. Weekly Time Off (hours) 63.9 See assumption below.
Weekly Time On Standby (s) 374044 Weekly Time Off (s) 230181 Weekly Standby Energy (joules/week) 2206860 Weekly Off Energy (joules/week) 138109 Total Printing Energy (megajoules) 4 Total Standby Energy (megajoules) 345
Total Off Energy (megajoules) 22 Total Energy (megajoules) 371 Paper Useage Calculations
20 lb, 30 gsm 75.2Assume 20 lb average paper weight, virgin. Photo paper not considered.
A-size area (in^2) 93.5 A-size area (m^2) 0.06 Mass per Page (g) 4.54 Paper consumed over printer lifetime (kg) 34
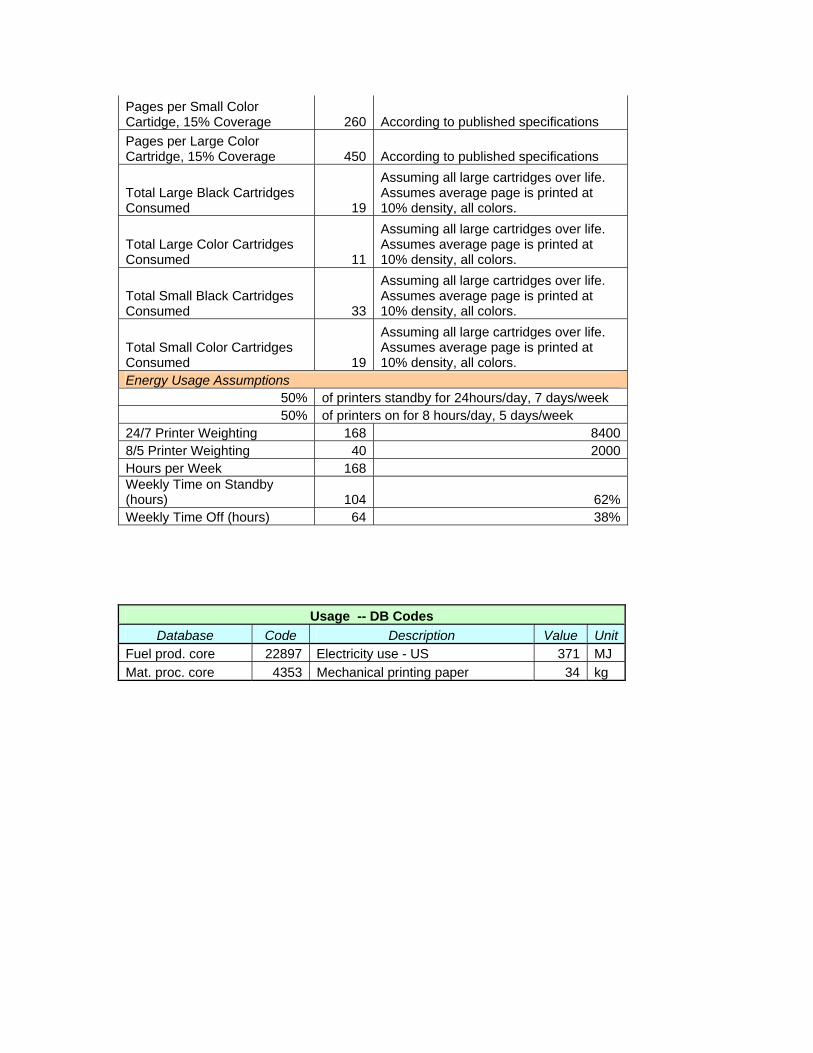
Waste code omitted because it is embedded in 4353.
Cartridge Useage Calculations Pages per Small Black Cartridge, 5% Coverage 450 According to published specifications Pages per Large Black Cartridge, 5% Coverage 800 According to published specifications

Pages per Small Color Cartidge, 15% Coverage 260 According to published specifications Pages per Large Color Cartridge, 15% Coverage 450 According to published specifications
Total Large Black Cartridges Consumed 19
Assuming all large cartridges over life. Assumes average page is printed at 10% density, all colors.
Total Large Color Cartridges Consumed 11
Assuming all large cartridges over life. Assumes average page is printed at 10% density, all colors.
Total Small Black Cartridges Consumed 33
Assuming all large cartridges over life. Assumes average page is printed at 10% density, all colors.
Total Small Color Cartridges Consumed 19
Assuming all large cartridges over life. Assumes average page is printed at 10% density, all colors.
Energy Usage Assumptions 50% of printers standby for 24hours/day, 7 days/week 50% of printers on for 8 hours/day, 5 days/week
24/7 Printer Weighting 168 8400 8/5 Printer Weighting 40 2000 Hours per Week 168 Weekly Time on Standby (hours) 104 62% Weekly Time Off (hours) 64 38%
Use Case -- DB Codes Database Code Description Value Unit
Fuel prod. core 22897 Electricity use - US 371 MJ Mat. proc. core 4353 Mechanical printing paper 34 kg

A3. Low-Power Use Case Assumptions
Usage Calculations -- Low Power Case Description Figure Note
Printer Lifetime (years) 3 Estimate, sensitivity analysis required. Printer Lifetime (pages) 7500 Estimate, sensitivity analysis required. Average Print Mode Speed 5 Slow to allow for photos, etc. Printing Power (watts) 44.0 Standby Power (watts) 5.9 Off Power (watts) 0.6 Energy Useage Calculations Weekly Pages Printed 48
Weekly Printing Time (hours) 0.16 Weekly Printing Time (s) 574.96 Weekly Printing Energy (joules/week) 25298 Weekly Time Not Printing (hours) 167.8 Weekly Time On Standby (hours) 0.0 See assumption below. Weekly Time Off (hours) 167.8 See assumption below.
Weekly Time On Standby (s) 0 Weekly Time Off (s) 604225 Weekly Standby Energy (joules/week) 0 Weekly Off Energy (joules/week) 362535 Total Printing Energy (megajoules) 4 Total Standby Energy (megajoules) 0
Total Off Energy (megajoules) 57 Total Energy (megajoules) 61 Paper Useage Calculations
20 lb, 30 gsm 75.2Assume 20 lb average paper weight, virgin. Photo paper not considered.
A-size area (in^2) 93.5 A-size area (m^2) 0.06 Mass per Page (g) 4.54 Paper consumed over printer lifetime (kg) 34
Waste code omitted because it is embedded in 4353.
Cartridge Useage Calculations Pages per Small Black Cartridge, 5% Coverage 450 According to published specifications Pages per Large Black Cartridge, 5% Coverage 800 According to published specifications
Pages per Small Color Cartidge, 15% Coverage 260 According to published specifications Pages per Large Color Cartridge, 15% Coverage 450 According to published specifications
Total Large Black Cartridges Consumed 19
Assuming all large cartridges over life. Assumes average page is printed at 10% density, all colors.
Total Large Color Cartridges Consumed 11
Assuming all large cartridges over life. Assumes average page is printed at 10% density, all colors.
Total Small Black Cartridges Consumed 33
Assuming all large cartridges over life. Assumes average page is printed at 10% density, all colors.
Total Small Color Cartridges Consumed 19
Assuming all large cartridges over life. Assumes average page is printed at 10% density, all colors.
Energy Usage Assumptions 50% of printers standby for 24hours/day, 7 days/week 50% of printers on for 8 hours/day, 5 days/week
24/7 Printer Weighting 168 8400 8/5 Printer Weighting 40 2000 Hours per Week 168 Weekly Time on Standby (hours) 104 62% Weekly Time Off (hours) 64 38%
Usage -- DB Codes Database Code Description Value Unit
Fuel prod. core 22897 Electricity use - US 371 MJ Mat. proc. core 4353 Mechanical printing paper 34 kg

A4. Inventory Tables
Printer Materials Item Mass (g) Note
Metals (total) 910 Steel 696 Aluminum 165 Copper 49 Motor windings.
Plastics (total) 2179 Recyclable 1887 Non-recyclable 292
ABS 163851 g of ABS includes other categories
HIPS 1472 Other Plastics 544 Modeled as ABS.
Other, General (total) 144Includes elastomers, etc. Modeled as ABS.
Electronics 507Includes external cables and power supply.
Printer (total) 3740
Recyclable Materials (total) 2947Includes metals, recyclable plastic, copper.
Recyclable Materials (%) 79%
Printer Mechanical – DB Codes Solid waste 9 Metals (Process)
Mat. proc. core 4499 Cold roll alloy 3004 Mat. proc. core 4619 Produce general steel products Mat. proc. core 4710 Copper wire production Solid waste 8 Plastics (Process) SA core 30 ABS Solid waste 8 Plastics (Process) SA core 50 High impact polystyrene
Printer Electronics – DB Codes Database Code Description
Solid waste 28 Electronics waste (Process) SA core 24 Epoxy liquid resin SA core 74 Electrolytic copper Fuel prod. core 4297 Electricity use - CN Mat. proc. core 3612 Demineralised water production Mat. proc. core 3643 Iron chromite production Mat. proc. core 4499 Cold roll alloy 3004 Mat. proc. core 4619 Produce general steel products Mat. proc. core 4904 Glass fibre production

Cartridge Materials Item Mass (g) Note
Plastics (total) 20 PET + 15%GF 20
Other Plastics ? Not measured. Assumed to be PET.
Other, General (total) ? Not measured. Assumed to be PET.
Electronics 4Printing integrated circuit, flexible circuit.
Ink 21Black-21g, Color-42g. Not modeled.
Cartridge (total) 45
Cartridge -- DB Codes Database Code Description
Mat. proc. core 4209 PET (high mol wt) production Solid waste 8 Plastics (Process) Solid waste 28 Electronics waste (Process) SA core 24 Epoxy liquid resin SA core 74 Electrolytic copper Fuel prod. core 4297 Electricity use - CN Mat. proc. core 3612 Demineralised water production

Printer Packaging Item Mass (g) Note
Polystyrene 0.014 Shipping restraints. Polycarbonate 0.015 CD. Paperboard, Cardboard 0.881
Office Paper 0.107Manual, etc. Waste code is embedded in 4353.
Packaging (total) 1.017
Printer Packaging -- DB Codes Database Code Description
Solid waste 2 Paperboard containers (Process) Solid waste 8 Plastics (Process) SA core 27 Polycarbonate
SA core 49 General purpose polystyrene Mat. proc. core 4350 Production of paperboard Mat. proc. core 4353 Mechanical printing paper
Cartridge Packaging Item Mass (g) Note
Paperboard 27includes cartons, brochures, and return envelope.
Other, General (total) 1Hybrid plastic/foil pouch. Not modeled.
Packaging (total) 28
Cartridge Packaging -- DB Codes Database Code Description
Solid waste 2 Paperboard containers (Process) Mat. proc. core 4350 Production of paperboard

Final Shipping Description Figure Note
Sea Shipping Distance (km) 9537
Assumed printer and cartridge final assembly in Tianjin, China and shipped out of Tanggu via container ship to Oakland California. Direct distance (not actual shipping route). Initial and subsequent trucking inventory ignored.
Printer mass (kg) 3.74Assume product is shipped in bulk and boxed in the United States.
Cartridge mass (kg) 0.093 Includes packaging. Printer Sea Figure (tonne-km) 35.7
This is the figure used in the Boustead Model.
Cartridge Sea Figure (tonne-km) 1
This is the figure used in the Boustead Model.
Final Shipping -- DB Codes Database Code Description
Mat. proc. core 3547 Sea transport - average Mat. proc. core 3547 Sea transport - average
Put in raw data from boustead model runs