Initiating Coverage – Nishat Power Limited
8
Synergy of Finance & Opportunities M.M. Securities (Pvt.) Ltd INITIATING COVERAGE NISHAT POWER LIMITED We initiate our coverage on Nishat Power Limited (NPL) with a DDM based fair value of PKR 21.66/share. We recommend ‘Buy’ stance on NPL as its currently offering upside potential of 27.4% from our fair value. Further, NPL is offering attrac- tive dividend yield of 17.6% at current level as compared to sector dividend yield of 15% and trading discounted P/Ex of 3.77 and P/Bx of 1.44. Reason To Invest in NPL NPL is the first Independent Power Producer (IPP) under power policy 2002, which has completed Reliability Run Test (RRT) as required under Power Purchase Agreement (PPA) in its first attempt at 132 KV transmission lines. The project has finally started its commercial production in June’10. NEPRA has approved revised tariff for the company which have increased overall profitability of the company for 1QFY11 and also positive for the forthcoming years. we estimate that plant to operate at efficiency level of 95% capacity factor in 2QFY11 which will be one of the highest efficiency level in the country. Whereas, NPL plant effi- ciency level in 1QFY11 was highest in power generation sector as plants operated at an optimal efficiency of 91.2% capacity factor and dispatched 393,287 MWh power to national grid during 1QFY11. NPL is offering highest dividend yield in the power sec- tor. We expect company to announce first ever cash divi- dend of PKR 3.0 per share during FY11. Based on last closing price of the stock, its currently offering attractive dividend yield of 17.6% as compared to HUBCO & KAPCO dividend yield of 15.8% and 14.3% respectively for the period of FY11. Relative Price Performance—PKR Disclaimer: This report has been prepared by MMSPL. The information and opinions contained herein have been compiled or arrived at based upon information obtained from sources believed to be reliable and in good faith. Such information has not been independently verified and no guaranty, representation or warranty, express or implied is made as to its accuracy, completeness or correctness. All such information and opinions are subject to change without notice. This document is for information purposes only. Descriptions of any company or companies or their securities mentioned herein are not intended to be complete and this document is not, and should not be construed as, an offer, or solicitation of an offer, to buy or sell any securities or other financial instruments. MMSPL may, to the extent permissible by applicable law or regulation, use the above material, conclusions, research or analysis before such material is disseminated to its customers. Not all customers will receive the material at the same time. MMSPL, their respective directors, officers, representatives, employees, related persons may have a long or short position in any of the securities or other financial instruments mentioned or issuers described herein at any time and may make a purchase and/or sale, or offer to make a purchase and/or sale of any such securities or other financial instruments from time to time in the open market or otherwise, either as principal or agent. MMSPL may make markets in securities or other financial instruments de- scribed in this publication, in securities of issuers described herein or in securities underlying or related to such securities. This document may not be reproduced, distributed or published for any purposes. Jan 06, 2011 Equity Our research available on: Bloomberg http://www.mmsecurities.com.pk Shahid Ali Senior Research Analyst [email protected] +92-21-35317703 Ext. 106 0 5 10 15 20 Jan-10 Feb-10 Mar-10 Apr-10 May-10 Jun-10 Jul-10 Aug-10 Sep-10 Oct-10 Nov-10 Dec-10 Jan-11 NPL KSE 100 Index FY10 FY11E FY12E FY13E FY14E Net Sales (PKR mn) 1,018 17,095 18,702 19,892 20,464 PAT (PKR mn) 47 1,599 1,846 1,990 2,094 EPS (PKR) 0.13 4.51 5.21 5.62 5.91 DPS (PKR) - 3.00 3.90 4.50 4.85 Dividend Yield 0.0% 17.6% 23.0% 26.5% 28.5% P/Ex N/A 3.77 3.26 3.03 2.88 P/Bx N/A 1.44 1.30 1.20 1.11 Recommendation BUY Current Price - As of Jan 05, 2011 PKR 17.01 Fair Value - (DDM ) PKR 21.66 Upside Potential % 27.4% EPS - FY11E PKR 4.51 EPS - FY12E PKR 5.21 DPS - FY11E PKR 3.00 DPS - FY12E PKR 3.90 Div Yield FY11E % 17.6% Div Yield FY12E % 23.0% P/E FY11E x 3.77 P/E FY12E x 3.26 KATS Code NPL Bloomberg Code NPL.PA Outstanding Shares mn 354.1 Market Capitalization PKR-mn 6,023 1Yr High - Low PKR 17.10-9.75 Daily Avg Volume in '000 1,414
-
Upload
shahid-ali -
Category
Documents
-
view
163 -
download
0
description
Comprehensive Research Report on Nishat Power Limited
Transcript of Initiating Coverage – Nishat Power Limited

Synergy of Finance & OpportunitiesM.M. Securities (Pvt.) Ltd
INITIATING COVERAGE
NISHAT POWER LIMITED
We initiate our coverage on Nishat Power Limited (NPL) with a DDM based fair value of PKR 21.66/share. We recommend ‘Buy’ stance on NPL as its currently offering upside potential of 27.4% from our fair value. Further, NPL is offering attrac-tive dividend yield of 17.6% at current level as compared to sector dividend yield of 15% and trading discounted P/Ex of 3.77 and P/Bx of 1.44.
Reason To Invest in NPL
NPL is the first Independent Power Producer (IPP) under power policy 2002, which has completed Reliability Run Test (RRT) as required under Power Purchase Agreement (PPA) in its first attempt at 132 KV transmission lines. The project has finally started its commercial production in June’10.
NEPRA has approved revised tariff for the company which have increased overall profitability of the company for 1QFY11 and also positive for the forthcoming years.
we estimate that plant to operate at efficiency level of 95% capacity factor in 2QFY11 which will be one of the highest efficiency level in the country. Whereas, NPL plant effi-ciency level in 1QFY11 was highest in power generation sector as plants operated at an optimal efficiency of 91.2% capacity factor and dispatched 393,287 MWh power to national grid during 1QFY11.
NPL is offering highest dividend yield in the power sec-tor. We expect company to announce first ever cash divi-dend of PKR 3.0 per share during FY11. Based on last closing price of the stock, its currently offering attractive dividend yield of 17.6% as compared to HUBCO & KAPCO dividend yield of 15.8% and 14.3% respectively for the period of FY11.
Relative Price Performance—PKR
Disclaimer: This report has been prepared by MMSPL. The information and opinions contained herein have been compiled or arrived at based upon information obtained from sources believed to be reliable and in good faith. Such information has not been independently verified and no guaranty, representation or warranty, express or implied is made as to its accuracy, completeness or correctness. All such information and opinions are subject to change without notice. This document is for information purposes only. Descriptions of any company or companies or their securities mentioned herein are not intended to be complete and this document is not, and should not be construed as, an offer, or solicitation of an offer, to buy or sell any securities or other financial instruments. MMSPL may, to the extent permissible by applicable law or regulation, use the above material, conclusions, research or analysis before such material is disseminated to its customers. Not all customers will receive the material at the same time. MMSPL, their respective directors, officers, representatives, employees, related persons may have a long or short position in any of the securities or other financial instruments mentioned or issuers described herein at any time and may make a purchase and/or sale, or offer to make a purchase and/or sale of any such securities or other financial instruments from time to time in the open market or otherwise, either as principal or agent. MMSPL may make markets in securities or other financial instruments de-scribed in this publication, in securities of issuers described herein or in securities underlying or related to such securities. This document may not be reproduced, distributed or published for any purposes.
Jan 06, 2011
Equity
Our research available on:Bloomberg
http://www.mmsecurities.com.pk
Shahid Ali Senior Research Analyst
[email protected]+92-21-35317703 Ext. 106
0
5
10
15
20
Jan-
10
Feb-
10
Mar
-10
Ap
r-10
May
-10
Jun-
10
Jul-
10
Au
g-10
Sep
-10
Oct
-10
Nov
-10
Dec
-10
Jan-
11
NPL KSE 100 Index
FY10 FY11E FY12E FY13E FY14E
Net Sales (PKR mn) 1,018 17,095 18,702 19,892 20,464
PAT (PKR mn) 47 1,599 1,846 1,990 2,094
EPS (PKR) 0.13 4.51 5.21 5.62 5.91
DPS (PKR) - 3.00 3.90 4.50 4.85
Dividend Yield 0.0% 17.6% 23.0% 26.5% 28.5%
P/Ex N/A 3.77 3.26 3.03 2.88
P/Bx N/A 1.44 1.30 1.20 1.11
Recommendation BUY
Current Price - As of Jan 05, 2011 PKR 17.01
Fair Value - (DDM ) PKR 21.66
Upside Potential % 27.4%
EPS - FY11E PKR 4.51 EPS - FY12E PKR 5.21 DPS - FY11E PKR 3.00
DPS - FY12E PKR 3.90
Div Yield FY11E % 17.6%
Div Yield FY12E % 23.0%
P/E FY11E x 3.77 P/E FY12E x 3.26
KATS Code NPL
Bloomberg Code NPL.PAOutstanding Shares mn 354.1 Market Capitalization PKR-mn 6,023 1Yr High - Low PKR 17.10-9.75Daily Avg Volume in '000 1,414
2
Synergy of Finance & OpportunitiesM.M. Securities (Pvt.) Ltd
INITIATING COVERAGE
Valuation Methodology
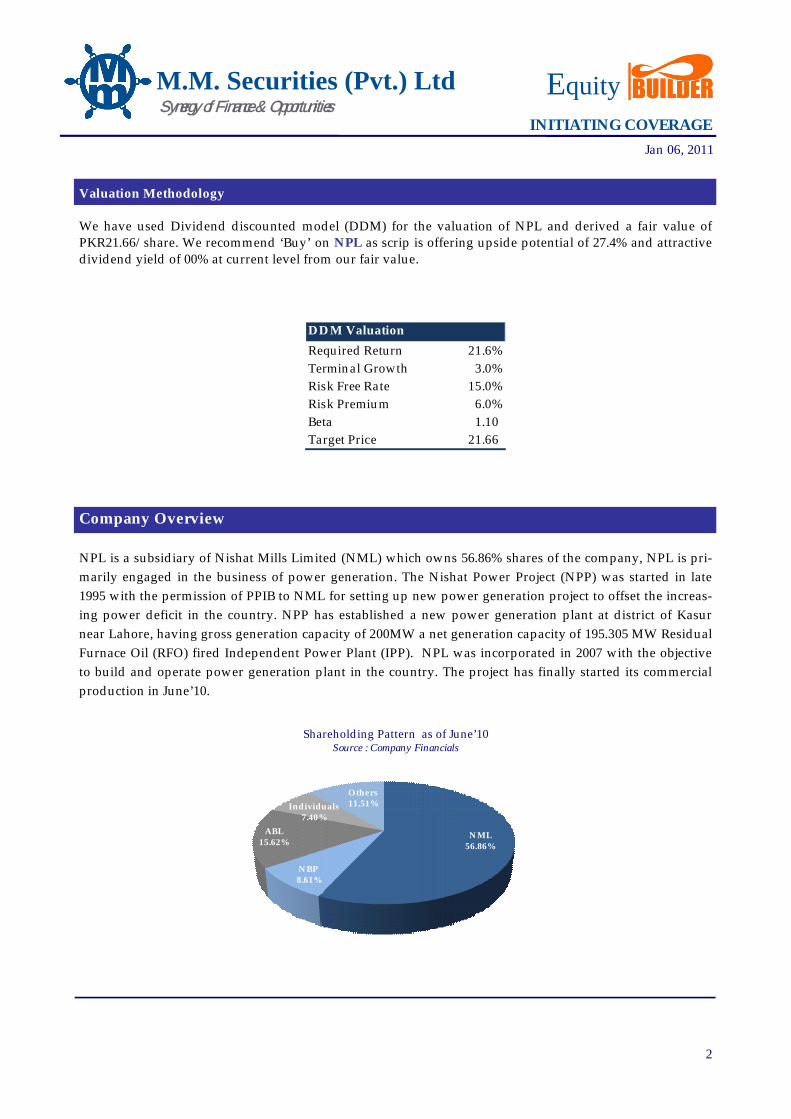
We have used Dividend discounted model (DDM) for the valuation of NPL and derived a fair value of PKR21.66/share. We recommend ‘Buy’ on NPL as scrip is offering upside potential of 27.4% and attractive dividend yield of 00% at current level from our fair value.
Company Overview
NPL is a subsidiary of Nishat Mills Limited (NML) which owns 56.86% shares of the company, NPL is pri-marily engaged in the business of power generation. The Nishat Power Project (NPP) was started in late 1995 with the permission of PPIB to NML for setting up new power generation project to offset the increas-ing power deficit in the country. NPP has established a new power generation plant at district of Kasur near Lahore, having gross generation capacity of 200MW a net generation capacity of 195.305 MW Residual Furnace Oil (RFO) fired Independent Power Plant (IPP). NPL was incorporated in 2007 with the objective to build and operate power generation plant in the country. The project has finally started its commercial production in June’10.
Equity
Jan 06, 2011
DDM Valuation
Required Return 21.6%Terminal Growth 3.0%Risk Free Rate 15.0%Risk Premium 6.0%Beta 1.10 Target Price 21.66
NML56.86%
NBP8.61%
ABL15.62%
Individuals7.40%
Others 11.51%
Shareholding Pattern as of June’10Source : Company Financials

3
Project Detail
Plant Specification The entire plant, machinery and equipment required for the project has been procured from Wartsila Finland. Whereas, Wartsila Pakistan (Private) limited has been appointed for the construction, erection, installation testing and commissioning of the entire project. The total cost of the project including interest during the construction period is ~PKR R17.7 billion (bn). The project was finance with debt to equity ratio of 75%:25% which is stander ratio for new IPP.
Power Purchase and Sale Agreement NPL has entered into a 25 years Power Purchase Agreement (PPA) with Water and power development
authority (WAPDA) through National Transmission and Dispatch Company Limited (NTDCL), be the sole purchaser of power generated by NPL. NTDCL has contracted to purchase the total net generation capacity of 195.305 MW produced by NPL during the contracted period.
Fuel Supply AgreementNPL has finalized its Fuel Supply Agreement (FSA) with Shell Pakistan Limited as the plant is operating on residual furnace oil, for a period of ten years after the commencement of commercial production. Fur-nace oil price will be depend on market price or as announced by ministry of petroleum for a specified time period.
Commercial Date of Operations NPL had successfully achieved Commercial Operation date (COD) on 09th June’10 after the delayed of ~5months due to some technical issues. However, plant of the company operated at an optimal capacity of 86% in FY11 and dispatched 88,692 MW electricity to the national grid. Further, NPL has become the first IPP of under power policy 2002. Moreover, capacity utilization of the company has improved to 91.2% in 1QFY11 and expected to improve further in upcoming quarters.
Synergy of Finance & OpportunitiesNISHAT POWER LIMITED
M.M. Securities (Pvt.) Ltd Equity
Jan 06, 2011
4
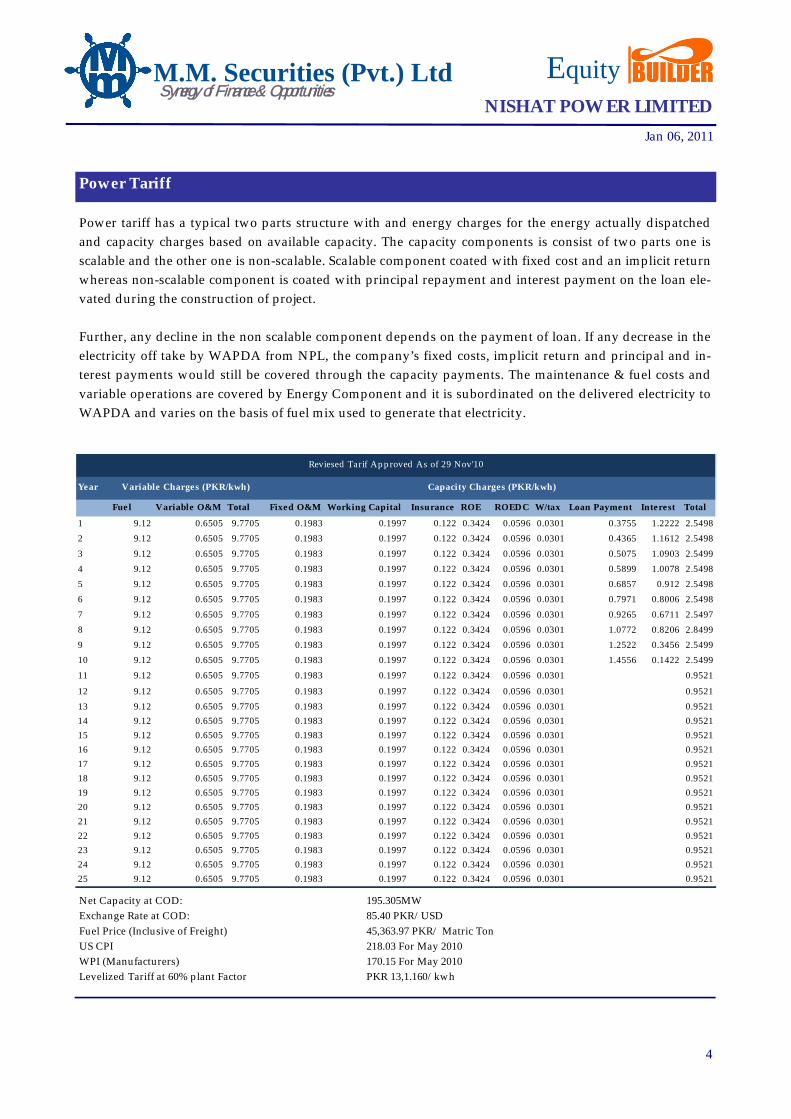
Power Tariff
Power tariff has a typical two parts structure with and energy charges for the energy actually dispatched and capacity charges based on available capacity. The capacity components is consist of two parts one is scalable and the other one is non-scalable. Scalable component coated with fixed cost and an implicit return whereas non-scalable component is coated with principal repayment and interest payment on the loan ele-vated during the construction of project.
Further, any decline in the non scalable component depends on the payment of loan. If any decrease in the electricity off take by WAPDA from NPL, the company’s fixed costs, implicit return and principal and in-terest payments would still be covered through the capacity payments. The maintenance & fuel costs and variable operations are covered by Energy Component and it is subordinated on the delivered electricity to WAPDA and varies on the basis of fuel mix used to generate that electricity.
Synergy of Finance & OpportunitiesNISHAT POWER LIMITED
M.M. Securities (Pvt.) Ltd Equity
Jan 06, 2011
Year
Fuel Variable O&M Total Fixed O&M Working Capital Insurance ROE ROEDC W/tax Loan Payment Interest Total
1 9.12 0.6505 9.7705 0.1983 0.1997 0.122 0.3424 0.0596 0.0301 0.3755 1.2222 2.5498
2 9.12 0.6505 9.7705 0.1983 0.1997 0.122 0.3424 0.0596 0.0301 0.4365 1.1612 2.5498
3 9.12 0.6505 9.7705 0.1983 0.1997 0.122 0.3424 0.0596 0.0301 0.5075 1.0903 2.5499
4 9.12 0.6505 9.7705 0.1983 0.1997 0.122 0.3424 0.0596 0.0301 0.5899 1.0078 2.5498
5 9.12 0.6505 9.7705 0.1983 0.1997 0.122 0.3424 0.0596 0.0301 0.6857 0.912 2.5498
6 9.12 0.6505 9.7705 0.1983 0.1997 0.122 0.3424 0.0596 0.0301 0.7971 0.8006 2.5498
7 9.12 0.6505 9.7705 0.1983 0.1997 0.122 0.3424 0.0596 0.0301 0.9265 0.6711 2.5497
8 9.12 0.6505 9.7705 0.1983 0.1997 0.122 0.3424 0.0596 0.0301 1.0772 0.8206 2.8499
9 9.12 0.6505 9.7705 0.1983 0.1997 0.122 0.3424 0.0596 0.0301 1.2522 0.3456 2.5499
10 9.12 0.6505 9.7705 0.1983 0.1997 0.122 0.3424 0.0596 0.0301 1.4556 0.1422 2.5499
11 9.12 0.6505 9.7705 0.1983 0.1997 0.122 0.3424 0.0596 0.0301 0.9521
12 9.12 0.6505 9.7705 0.1983 0.1997 0.122 0.3424 0.0596 0.0301 0.9521
13 9.12 0.6505 9.7705 0.1983 0.1997 0.122 0.3424 0.0596 0.0301 0.952114 9.12 0.6505 9.7705 0.1983 0.1997 0.122 0.3424 0.0596 0.0301 0.952115 9.12 0.6505 9.7705 0.1983 0.1997 0.122 0.3424 0.0596 0.0301 0.952116 9.12 0.6505 9.7705 0.1983 0.1997 0.122 0.3424 0.0596 0.0301 0.952117 9.12 0.6505 9.7705 0.1983 0.1997 0.122 0.3424 0.0596 0.0301 0.952118 9.12 0.6505 9.7705 0.1983 0.1997 0.122 0.3424 0.0596 0.0301 0.952119 9.12 0.6505 9.7705 0.1983 0.1997 0.122 0.3424 0.0596 0.0301 0.952120 9.12 0.6505 9.7705 0.1983 0.1997 0.122 0.3424 0.0596 0.0301 0.952121 9.12 0.6505 9.7705 0.1983 0.1997 0.122 0.3424 0.0596 0.0301 0.952122 9.12 0.6505 9.7705 0.1983 0.1997 0.122 0.3424 0.0596 0.0301 0.952123 9.12 0.6505 9.7705 0.1983 0.1997 0.122 0.3424 0.0596 0.0301 0.952124 9.12 0.6505 9.7705 0.1983 0.1997 0.122 0.3424 0.0596 0.0301 0.952125 9.12 0.6505 9.7705 0.1983 0.1997 0.122 0.3424 0.0596 0.0301 0.9521
Capacity Charges (PKR/kwh)
Reviesed Tarif Approved As of 29 Nov'10
Variable Charges (PKR/kwh)
Net Capacity at COD: 195.305MWExchange Rate at COD: 85.40 PKR/USD Fuel Price (Inclusive of Freight) 45,363.97 PKR/ Matric Ton US CPI 218.03 For May 2010 WPI (Manufacturers) 170.15 For May 2010 Levelized Tariff at 60% plant Factor PKR 13,1.160/kwh
5
Circular Debt
The major issue for the power sector is prevailing circular debt issue in the country which has restricted power sector to utilize their maximum capacity and lower dividend to their share holders. As for as NPL is concern its receivables are continuously increasing from the starting of power generation business to date as of Sept’10 NPL trade debt rises to PKR 4.44bn from PKR 2.66bn last year. However, we have discussed this issue with the management they said that currently the impact of circular debt on NPL is not significant as they are continuously receiving cash which is sufficient to meet their requirement.
Despite the fact Govt. had made commitment during IMF program in 2008 that Govt. to settle circular debt issue but in last three year Govt. is not able to do so. However, recently IMF has mounted pressure on Paki-stan to resolve circular debt issue due to which power tariff is rising on monthly basis. Govt. has plan to rises power tariff by ~20% to eliminate overall subsidy on power sector.
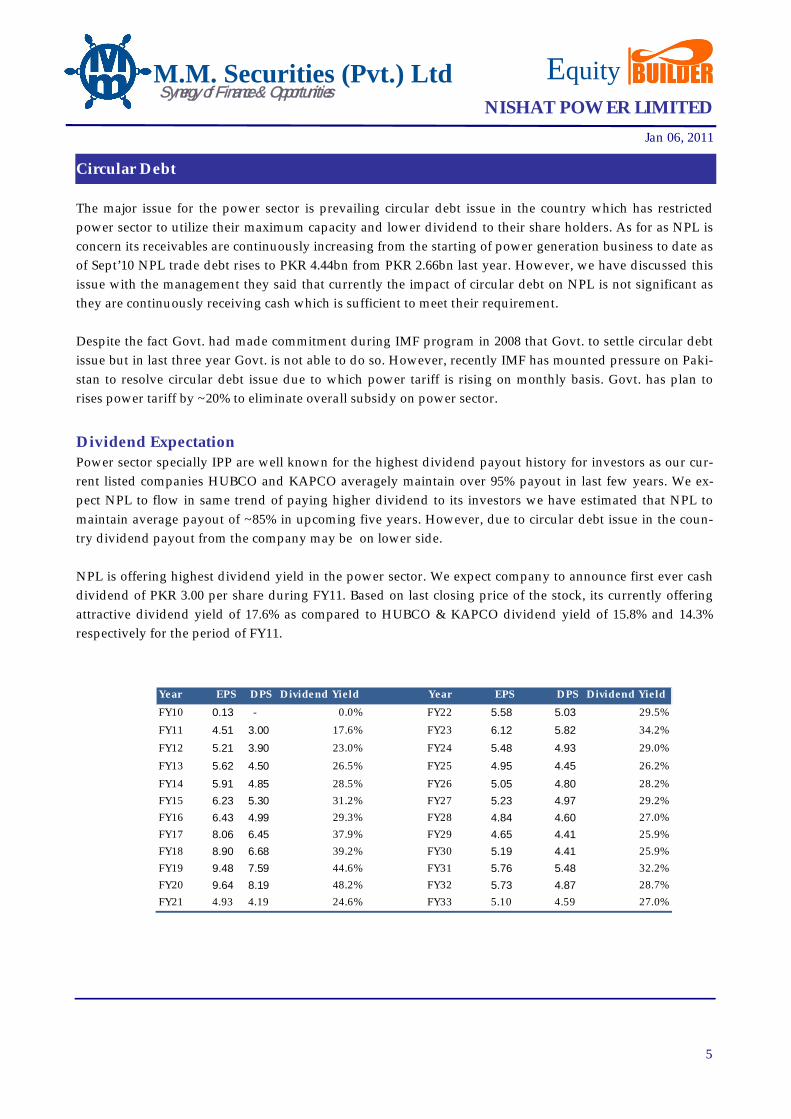
Dividend Expectation Power sector specially IPP are well known for the highest dividend payout history for investors as our cur-rent listed companies HUBCO and KAPCO averagely maintain over 95% payout in last few years. We ex-pect NPL to flow in same trend of paying higher dividend to its investors we have estimated that NPL to maintain average payout of ~85% in upcoming five years. However, due to circular debt issue in the coun-try dividend payout from the company may be on lower side.
NPL is offering highest dividend yield in the power sector. We expect company to announce first ever cash dividend of PKR 3.00 per share during FY11. Based on last closing price of the stock, its currently offering attractive dividend yield of 17.6% as compared to HUBCO & KAPCO dividend yield of 15.8% and 14.3% respectively for the period of FY11.
Synergy of Finance & OpportunitiesNISHAT POWER LIMITED
M.M. Securities (Pvt.) Ltd Equity
Jan 06, 2011
Year EPS DPS Dividend Yield Year EPS DPS Dividend Yield
FY10 0.13 - 0.0% FY22 5.58 5.03 29.5%
FY11 4.51 3.00 17.6% FY23 6.12 5.82 34.2%
FY12 5.21 3.90 23.0% FY24 5.48 4.93 29.0%
FY13 5.62 4.50 26.5% FY25 4.95 4.45 26.2%
FY14 5.91 4.85 28.5% FY26 5.05 4.80 28.2%FY15 6.23 5.30 31.2% FY27 5.23 4.97 29.2%FY16 6.43 4.99 29.3% FY28 4.84 4.60 27.0%FY17 8.06 6.45 37.9% FY29 4.65 4.41 25.9%FY18 8.90 6.68 39.2% FY30 5.19 4.41 25.9%FY19 9.48 7.59 44.6% FY31 5.76 5.48 32.2%FY20 9.64 8.19 48.2% FY32 5.73 4.87 28.7%FY21 4.93 4.19 24.6% FY33 5.10 4.59 27.0%
6
Financial Highlights
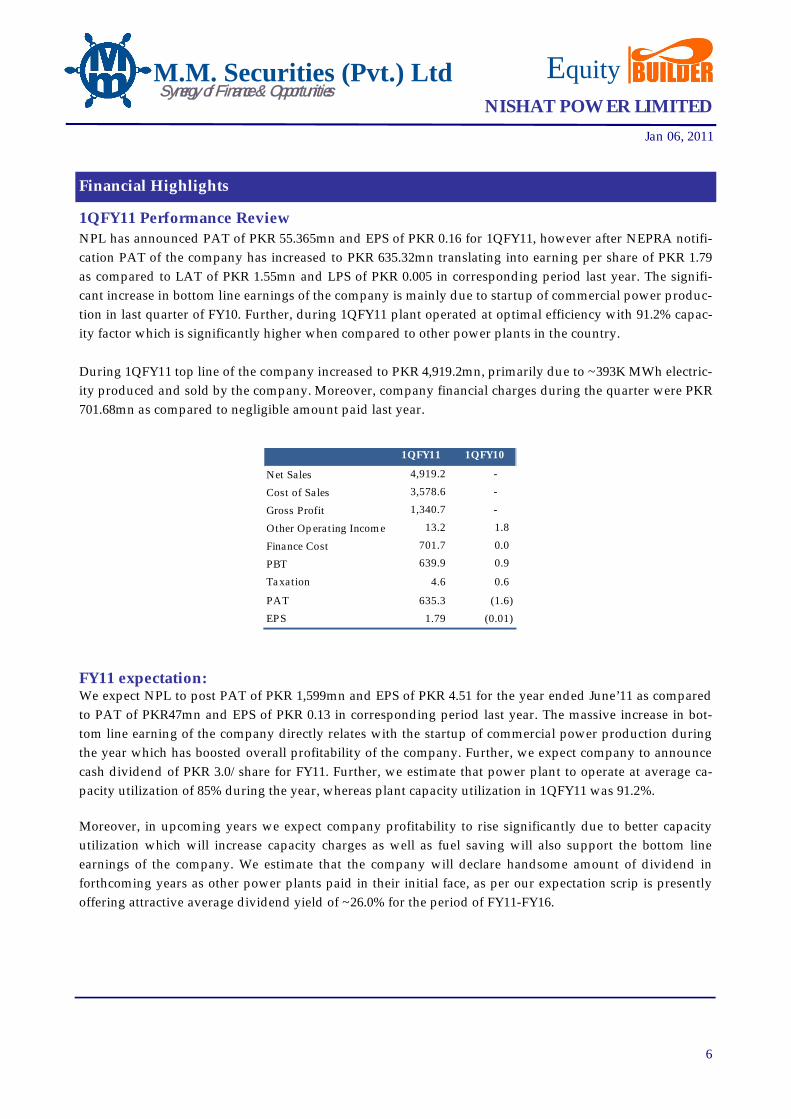
1QFY11 Performance Review NPL has announced PAT of PKR 55.365mn and EPS of PKR 0.16 for 1QFY11, however after NEPRA notifi-cation PAT of the company has increased to PKR 635.32mn translating into earning per share of PKR 1.79 as compared to LAT of PKR 1.55mn and LPS of PKR 0.005 in corresponding period last year. The signifi-cant increase in bottom line earnings of the company is mainly due to startup of commercial power produc-tion in last quarter of FY10. Further, during 1QFY11 plant operated at optimal efficiency with 91.2% capac-ity factor which is significantly higher when compared to other power plants in the country.
During 1QFY11 top line of the company increased to PKR 4,919.2mn, primarily due to ~393K MWh electric-ity produced and sold by the company. Moreover, company financial charges during the quarter were PKR 701.68mn as compared to negligible amount paid last year.
FY11 expectation:We expect NPL to post PAT of PKR 1,599mn and EPS of PKR 4.51 for the year ended June’11 as compared to PAT of PKR47mn and EPS of PKR 0.13 in corresponding period last year. The massive increase in bot-tom line earning of the company directly relates with the startup of commercial power production during the year which has boosted overall profitability of the company. Further, we expect company to announce cash dividend of PKR 3.0/share for FY11. Further, we estimate that power plant to operate at average ca-pacity utilization of 85% during the year, whereas plant capacity utilization in 1QFY11 was 91.2%.
Moreover, in upcoming years we expect company profitability to rise significantly due to better capacity utilization which will increase capacity charges as well as fuel saving will also support the bottom line earnings of the company. We estimate that the company will declare handsome amount of dividend in forthcoming years as other power plants paid in their initial face, as per our expectation scrip is presently offering attractive average dividend yield of ~26.0% for the period of FY11-FY16.
Synergy of Finance & OpportunitiesNISHAT POWER LIMITED
M.M. Securities (Pvt.) Ltd Equity
Jan 06, 2011
1QFY11 1QFY10
Net Sales 4,919.2 -
Cost of Sales 3,578.6 -
Gross Profit 1,340.7 -
Other Operating Income 13.2 1.8
Finance Cost 701.7 0.0
PBT 639.9 0.9
Taxation 4.6 0.6
PAT 635.3 (1.6)
EPS 1.79 (0.01)
7
Financial Highlights
Synergy of Finance & OpportunitiesNISHAT POWER LIMITED
M.M. Securities (Pvt.) Ltd Equity
Jan 06, 2011
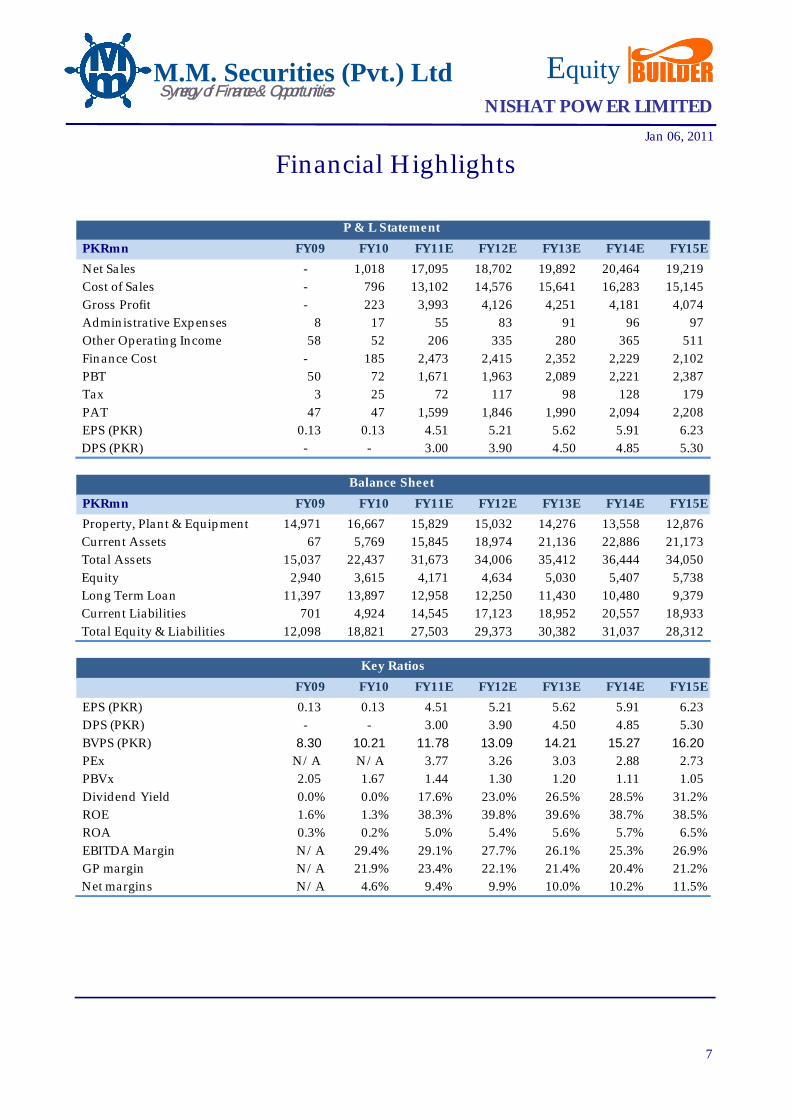
PKRmn FY09 FY10 FY11E FY12E FY13E FY14E FY15E
Net Sales - 1,018 17,095 18,702 19,892 20,464 19,219 Cost of Sales - 796 13,102 14,576 15,641 16,283 15,145 Gross Profit - 223 3,993 4,126 4,251 4,181 4,074 Administrative Expenses 8 17 55 83 91 96 97 Other Operating Income 58 52 206 335 280 365 511 Finance Cost - 185 2,473 2,415 2,352 2,229 2,102 PBT 50 72 1,671 1,963 2,089 2,221 2,387 Tax 3 25 72 117 98 128 179 PAT 47 47 1,599 1,846 1,990 2,094 2,208 EPS (PKR) 0.13 0.13 4.51 5.21 5.62 5.91 6.23
DPS (PKR) - - 3.00 3.90 4.50 4.85 5.30
PKRmn FY09 FY10 FY11E FY12E FY13E FY14E FY15E
Property, Plant & Equipment 14,971 16,667 15,829 15,032 14,276 13,558 12,876 Current Assets 67 5,769 15,845 18,974 21,136 22,886 21,173 Total Assets 15,037 22,437 31,673 34,006 35,412 36,444 34,050 Equity 2,940 3,615 4,171 4,634 5,030 5,407 5,738 Long Term Loan 11,397 13,897 12,958 12,250 11,430 10,480 9,379 Current Liabilities 701 4,924 14,545 17,123 18,952 20,557 18,933 Total Equity & Liabilities 12,098 18,821 27,503 29,373 30,382 31,037 28,312
FY09 FY10 FY11E FY12E FY13E FY14E FY15E
EPS (PKR) 0.13 0.13 4.51 5.21 5.62 5.91 6.23 DPS (PKR) - - 3.00 3.90 4.50 4.85 5.30 BVPS (PKR) 8.30 10.21 11.78 13.09 14.21 15.27 16.20 PEx N/A N/A 3.77 3.26 3.03 2.88 2.73 PBVx 2.05 1.67 1.44 1.30 1.20 1.11 1.05 Dividend Yield 0.0% 0.0% 17.6% 23.0% 26.5% 28.5% 31.2%ROE 1.6% 1.3% 38.3% 39.8% 39.6% 38.7% 38.5%ROA 0.3% 0.2% 5.0% 5.4% 5.6% 5.7% 6.5%EBITDA Margin N/A 29.4% 29.1% 27.7% 26.1% 25.3% 26.9%GP margin N/A 21.9% 23.4% 22.1% 21.4% 20.4% 21.2%
Net margins N/A 4.6% 9.4% 9.9% 10.0% 10.2% 11.5%
P & L Statement
Balance Sheet
Key Ratios

8
Analysts’ Certification:
We, Mohsin Ali & Shahid Ali, are the authors of this report, hereby certify that all of the views expressed in this research report accurately reflect our personal views about any and all of the subject issuer(s) or securities. We also certify that no part of my compensation was, is, or will be di-rectly or indirectly related to the specific recommendation(s) or view(s) in this report.
Research Team
Amjad Nazir Chief Operating Officer & Head of Research [email protected] +92-21-35396983 Shahid Ali Senior Research Analyst [email protected] +92-21-35317703 Muhammad Mohsin Ali Research Analyst [email protected] +92-21-35317704
Contact us:
M.M. Securities (Pvt.) Ltd.M. M. Tower, 3 – C,Khayaban-e-Ittehad,Phase – II, Extension,Defence Housing Authority,Karachi – 75500, Pakistan.P.O.Box # 12414Tel : +9221-35317703-04Fax: +9221-35895328http://www.mmsecurities.com.pkE-mail: [email protected]
Group: http://www.mmgoc.com.pk
Sales Team
Saqib Hussain Head of Sale & Portfolio Management [email protected] +92-21-35313911
Salma Aamir Sales Coordinator [email protected] +92-21-35317706Rana Saghir Ahmed Sales Coordinator [email protected] +92-21-35317705Sania Zulfiqar Sales Coordinator [email protected] +92-21-35313912Shahzada Haris Rashid Sales Coordinator [email protected] +92-21-35388719Muhammad Imran Alvi Sales Coordinator [email protected] +92-21-35396982Muhammad Farhan Sales Coordinator [email protected] +92-21-35897063Asif Raza Rawjani Sales Coordinator [email protected] +92-21-35313913Shahwaiz Jouzy Sales Coordinator [email protected] +92-21-35396982
Disclaimer: This report has been prepared by MMSPL. The information and opinions contained herein have been compiled or arrived at based upon information obtained from sources believed to be reliable and in good faith. Such information has not been independently verified and no guaranty, representation or warranty, express or implied is made as to its accuracy, completeness or correctness. All such information and opinions are subject to change without notice. This document is for information purposes only. Descriptions of any company or companies or their securities mentioned herein are not intended to be complete and this document is not, and should not be construed as, an offer, or solicitation of an offer, to buy or sell any securities or other financial instruments. MMSPL may, to the extent permissible by applicable law or regulation, use the above material, conclusions, research or analysis before such material is disseminated to its customers. Not all customers will receive the material at the same time. MMSPL, their respective directors, officers, representatives, employees, related persons may have a long or short position in any of the securities or other financial instruments mentioned or issuers described herein at any time and may make a purchase and/or sale, or offer to make a purchase and/or sale of any such securities or other financial instruments from time to time in the open market or otherwise, either as principal or agent. MMSPL may make markets in securities or other financial instruments de-scribed in this publication, in securities of issuers described herein or in securities underlying or related to such securities. This document may not be reproduced, distributed or published for any purposes.
Synergy of Finance & OpportunitiesNISHAT POWER LIMITED
M.M. Securities (Pvt.) Ltd Equity