Initiating Coverage Analysts’ Name Ravi Sodah Indian Cement...
87
1 ICICIdirect.com | Equity Research April 20, 2009 | Cement Initiating Coverage Indian Cement Sector Near term macros improve… With softening interest rates, sharp correction in coal and petcoke prices and firming up of cement prices due to strong demand, we believe the near term macroeconomic conditions for the cement industry have improved significantly. We believe that due to healthier balance sheets, moderate consolidation, use of more cost efficient technology and change in the macro environment over the last two quarters cement players will be better off compared to the earlier down cycle. We are initiating coverage on the cement sector with a positive view on Shree Cement, Orient Paper, JK Cement and UltraTech Cement, neutral on India Cement and negative view on ACC, Ambuja and Dalmia Cement. Demand growth accelerates After reporting cement dispatch growth of merely 6.7% in the first seven months of FY09 (April-October ’08), cement growth has accelerated to 10.5% in November ’08-March ’09. We believe the Indian cement industry will continue to grow by 1.2x GDP growth in FY10. Oversupply is inevitable About 62 million tonnes (MT) of cement capacity is scheduled to come on stream by the end of FY10. We expect the capacity utilisation of the industry to drop from 88% in FY09 and further to 79% in FY10. Thus, cement prices are likely to come under pressure with the beginning of the monsoon season. Subsiding cost pressure to cushion margins in near term A 4% cut in excise duty, sharp correction in imported coal, petcoke and crude prices by 67.8%, 49% and 66% respectively from their peak levels have reduced cost pressures for the cement industry. Apart from this, softening of interest rates would reduce the interest burden of smaller cement players, who have funded their capex by debt and cushion their PAT margins. However, we believe that in the long run, the demand-supply situation will force cement players to cut prices and pass on the benefits. Recommendation Some of the cement stocks are currently trading at valuations lower than the value given to loss making cement companies in the last 10 years. This is despite the fact that replacement cost for cement companies has increased significantly over the last decade. We believe that long-term value has emerged in select cement stocks. We also believe that companies that have completed a majority of their capacity addition, undertaken cost cutting measures or have low cost structure with lower earning sensitivity to price declines will be better off compared to their peers. Timely capacity addition will reduce the payback period while a low cost structure will enable them to cut prices and push volumes in a down cycle. We prefer UltraTech Cement among large caps, Shree Cement in the mid cap space and JK Cement and Orient Paper in small caps. Analysts’ Name Ravi Sodah [email protected] Vijay Goel [email protected] Ambuja Cement (GUJAMB) CMP 80 TP 64 Rating Underperformer Dalmia Cements (DALCEM) CMP 95 TP 81 Rating Underperformer India Cements (INDCEM) CMP 120 TP 110 Rating Hold Orient Paper & Ind. (ORIPAP) CMP 28 TP 36.2 Rating Outperformer ACC (ACC) CMP 617 TP 500 Rating Underperformer JK Cements (JKCEME) CMP 54 TP 62 Rating Performer Shree Cement (SHRCEM) CMP 796 TP 900 Rating Performer UltraTech Cement (ULTCEM) CMP 546 TP 630 Rating Performer CMIE Cement Stock Index 1200 2200 3200 4200 Mar'08 Apr'08 May'08 Jun'08 July'08 Aug'08 Sep'08 Oct'08 Nov'08 Dec'08 Jan'09 Feb'09 Mar'09
Transcript of Initiating Coverage Analysts’ Name Ravi Sodah Indian Cement...

1
ICICIdirect.com | Equity Research
April 20, 2009 | Cement
Initiating Coverage
Indian Cement Sector
Near term macros improve…
With softening interest rates, sharp correction in coal and petcoke prices and firming up of cement prices due to strong demand, we believe the near term macroeconomic conditions for the cement industry have improved significantly. We believe that due to healthier balance sheets, moderate consolidation, use of more cost efficient technology and change in the macro environment over the last two quarters cement players will be better off compared to the earlier down cycle. We are initiating coverage on the cement sector with a positive view on Shree Cement, Orient Paper, JK Cement and UltraTech Cement, neutral on India Cement and negative view on ACC, Ambuja and Dalmia Cement.
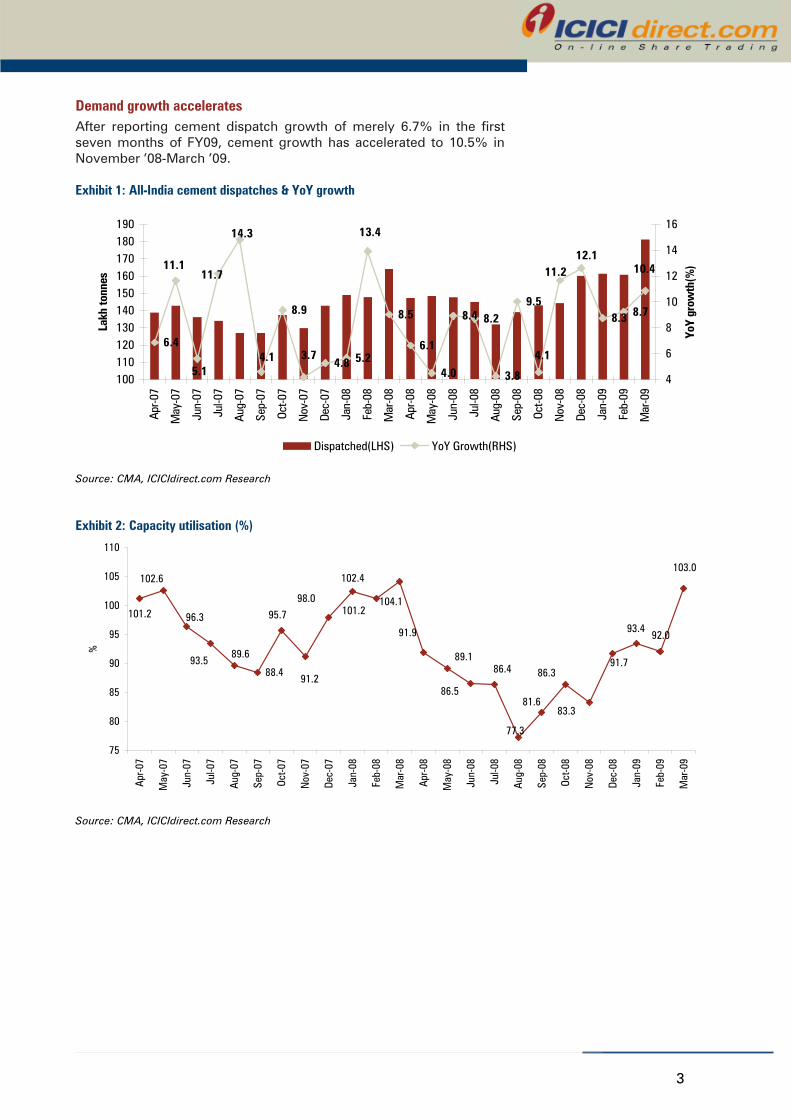
Demand growth accelerates After reporting cement dispatch growth of merely 6.7% in the first seven months of FY09 (April-October ’08), cement growth has accelerated to 10.5% in November ’08-March ’09. We believe the Indian cement industry will continue to grow by 1.2x GDP growth in FY10.
Oversupply is inevitable About 62 million tonnes (MT) of cement capacity is scheduled to come on stream by the end of FY10. We expect the capacity utilisation of the industry to drop from 88% in FY09 and further to 79% in FY10. Thus, cement prices are likely to come under pressure with the beginning of the monsoon season.
Subsiding cost pressure to cushion margins in near term A 4% cut in excise duty, sharp correction in imported coal, petcoke and crude prices by 67.8%, 49% and 66% respectively from their peak levels have reduced cost pressures for the cement industry. Apart from this, softening of interest rates would reduce the interest burden of smaller cement players, who have funded their capex by debt and cushion their PAT margins. However, we believe that in the long run, the demand-supply situation will force cement players to cut prices and pass on the benefits.
Recommendation Some of the cement stocks are currently trading at valuations lower than the value given to loss making cement companies in the last 10 years. This is despite the fact that replacement cost for cement companies has increased significantly over the last decade. We believe that long-term value has emerged in select cement stocks. We also believe that companies that have completed a majority of their capacity addition, undertaken cost cutting measures or have low cost structure with lower earning sensitivity to price declines will be better off compared to their peers. Timely capacity addition will reduce the payback period while a low cost structure will enable them to cut prices and push volumes in a down cycle. We prefer UltraTech Cement among large caps, Shree Cement in the mid cap space and JK Cement and Orient Paper in small caps.
Analysts’ Name
Ravi Sodah [email protected] Vijay Goel [email protected]
Ambuja Cement (GUJAMB)CMP 80TP 64Rating Underperformer
Dalmia Cements (DALCEM)CMP 95TP 81Rating Underperformer
India Cements (INDCEM)CMP 120TP 110Rating Hold
Orient Paper & Ind. (ORIPAP)CMP 28TP 36.2Rating Outperformer
ACC (ACC)CMP 617TP 500Rating Underperformer
JK Cements (JKCEME)CMP 54TP 62Rating Performer
Shree Cement (SHRCEM)CMP 796TP 900Rating Performer
UltraTech Cement (ULTCEM)CMP 546TP 630Rating Performer
CMIE Cement Stock Index
1200
2200
3200
4200
Mar
'08
Apr
'08
May
'08
Jun'
08
July
'08
Aug
'08
Sep'
08
Oct'0
8
Nov
'08
Dec'
08
Jan'
09
Feb'
09
Mar
'09

2
Content
• Demand growth accelerates 3
• Oversupply unavoidable 7
• Subsiding cost pressure to cushion margins in near term 12
• Recommendation 19
Companies Section
Initiating Coverages
• Ambuja Cement 23
• Dalmia Cement 32
• India Cements 42
• Orient Paper & Industries 54
Company Updates
• ACC 68
• JK Cements 73
• Shree Cements 78
• Ultratech Cements 82
Page No.
3
Demand growth accelerates After reporting cement dispatch growth of merely 6.7% in the first seven months of FY09, cement growth has accelerated to 10.5% in November ’08-March ’09.
Exhibit 1: All-India cement dispatches & YoY growth
6.4
8.9
4.8 5.2
8.5
6.1
4.0
8.4 8.2
3.8
9.58.3 8.7
10.4
3.7
14.3
11.7
5.1
11.1 11.2
4.14.1
12.1
13.4
100110120130140150160170180190
Apr-0
7
May
-07
Jun-
07
Jul-0
7
Aug-
07
Sep-
07
Oct-0
7
Nov
-07
Dec-
07
Jan-
08
Feb-
08
Mar
-08
Apr-0
8
May
-08
Jun-
08
Jul-0
8
Aug-
08
Sep-
08
Oct-0
8
Nov
-08
Dec-
08
Jan-
09
Feb-
09
Mar
-09
Lakh
tonn
es
4
6
8
10
12
14
16
YoY
grow
th(%
)
Dispatched(LHS) YoY Growth(RHS)
Source: CMA, ICICIdirect.com Research
Exhibit 2: Capacity utilisation (%)
88.4
103.0
81.6
104.198.0
91.2
95.7
89.693.5
96.3
102.6
101.2
102.4
101.2
91.9
89.1
86.5
77.3
86.4 86.3
83.3
91.7
93.492.0
75
80
85
90
95
100
105
110
Apr-0
7
May
-07
Jun-
07
Jul-0
7
Aug-
07
Sep-
07
Oct-0
7
Nov
-07
Dec-
07
Jan-
08
Feb-
08
Mar
-08
Apr-0
8
May
-08
Jun-
08
Jul-0
8
Aug-
08
Sep-
08
Oct-0
8
Nov
-08
Dec-
08
Jan-
09
Feb-
09
Mar
-09
%
Source: CMA, ICICIdirect.com Research

4
Increased plan expenditure in the fiscal stimulus package by Rs 20,000 crore, pre-election spending led increase in demand from the infrastructure sector coupled with capacity additions have driven the volumes of the industry. Also, cooling off of raw material prices and softening interest rates have increased the viability of infrastructure projects that had turned unviable. We have determined that individual housing demand in rural and semi-urban areas has revived due to the following factors: • Efforts by the government to boost the demand for houses in the
below Rs 20-lakh category in stimulus packages • Cooling off of land prices and steel prices • Good agricultural harvest • Increase in minimum support price (MSP) (wheat's MSP has risen
to Rs 1,080 per quintal in 2008-09 from Rs 750 per quintal in 2006-07 while the figure for rice in the corresponding period has jumped to Rs 850 per quintal from Rs 580 per quintal),
• Increase in pay for workers under the flagship rural job guarantee scheme
• Implementation of debt waiver scheme and • Implementation of the Sixth Pay Commission All-India cement dispatches grew by 6.7% in April-October ’08, mainly driven by the southern region, which had reported growth of 11.5% (Andhra Pradesh had been the main contributor in the southern region with growth of 15.7% mainly driven by higher spending on irrigation projects) as compared to just 4.4% for the rest of India, which forced players like ACC and Shree Cement to shut down their plants. In November ’08-March ’09, cement demand accelerated in other regions with the central region growing at 8.8% due to higher cement demand on part of the UP government on low-cost housing and demand from infrastructure projects such as Yamuna (Taj) Express Highway. In the northern region the growth was 18.7% due to incremental demand from major projects, viz Commonwealth Games, sewerage line project in Punjab, national irrigation project in Haryana and Delhi Metro, fly-over & Delhi Airport and re-imposition of countervailing duty (CVD) of 8% and Special CVD (special additional duty of customs) of 4%, which has dried up cement imports. Demand in the western region has continued to be muted as the organised real estate sector, which contributes a significant chunk in overall demand, has witnessed a slowdown.
Exhibit 3: Region wise cement dispatches growth in FY09(in Lakh tonnes)
Regions Apr-Oct'08 Apr-Oct'07 Var.(%) Nov-Mar'09 Nov-Mar'08 Var.(%)
North 222.2 205.2 8.3 189.2 159.4 18.7
East 139.5 128.7 8.4 120.5 103.5 16.5
West 156.7 159 -1.4 127.9 127.8 0.1
Central 140.1 138 1.5 116.8 107.4 8.8
South 343.9 308.3 11.5 253.2 233.2 8.6
All India Ex South 658.5 630.9 4.4 554.4 498.0 11.3
All India Inc South 1002.4 939.2 6.7 807.6 731.2 10.5
Source: CMA, ICICIdirect.com Research

5
Cement demand had grown at 8.1% CAGR during FY94-FY08 and at 10% CAGR during FY06-FY08. In the near future, cement consumption has been growing in line with the GDP growth rate with the correlation being close to 97%. We believe that in the long run, the cement industry will continue to grow by 1.2x GDP. With a consensus estimate of 5.9% GDP growth, we expect cement demand to grow at 7% in FY10. We are expecting around 59 MT of demand to be generated by the infrastructure sector and 11 MT by real estate projects in Tier-I cities. Exhibit 4: Cement consumption growth, GDP growth and cement to GDP multiple
-4
-2
0
2
4
6
8
10
12
14
FY94
FY95
FY96
FY97
FY98
FY99
FY00
FY01
FY02
FY03
FY04
FY05
FY06
FY07
FY08
Grow
th(%
)
-1.0
-0.5
0.0
0.5
1.0
1.5
2.0
2.5
Cem
ent c
onsu
mpt
ion
to G
DP
Mul
tiple
Cement consumption growth(%) (LHS) Cement consumption to GDP Multiple (RHS) GDP growth(%) (LHS)
Source: Bloomberg, CMA, ICICIdirect.com Research
Exhibit 5: Per capita consumption of cement of major countries
777
522
348 342 301
131
0
250
500
750
1000
China Europe WorldAverage
USA Asia (exchina)
India
Per c
apita
con
sum
ptio
n (K
g)
Source: ICICIdirect.com Research
Average GDP to cement consumption growth multiple of last 15 years is 1.2x
r =0.97

6
Exhibit 6: Estimated cement demand from infrastructure sector
11th Five year Plan Roads/ Railways Urban Irrigation Ports *PowerBridges Infra
Investment expected from 11th Plan (Rs. Bn) 3142 2618 1661 2533 880 1760
Assumed that 70% will be spent 2199 1833 1163 1773 616 1232
Civil Construction (%) 100 42 60 45 45
Cement Component(%) 25 20 33 12 30
Total Cement (Rs. Bn) 550 154 230 96 83
Cement Prices Rs/Tonne 4200 4200 4200 4200 4200
Total cement required (Mn Tonnes) 131 37 55 23 20 30
Total Cement for 11th Five year Plan (Mn Tonnes) 295
Average annual Cement consumption (Mn Tonnes) 59*Cement demand as estimated by "White Paper on strategy for 11th Plan"
Source: Planning Commission, ICICIdirect.com Research
Exhibit 7: Year-wise planned expenditure
3892.7
4791.2
5959.1
2702.7
3215.8
6.06.5
7.3
8.29.3
2000
2500
3000
3500
4000
4500
5000
5500
6000
6500
FY08 FY09 FY10 FY11 FY12
Inve
stm
ent i
n Rs
Bill
ion
0
1
2
3
4
5
6
7
8
9
10
as a
% o
f GD
P
Investment in infrastructure (Rs Crore) (LHS) Investment as % of GDP (RHS)
Source: Planning Commission, ICICIdirect.com Research
Exhibit 8: Estimated cement demand from real estate projects in Tier-I cities
Residential(Mn.Sq.Ft.)
Commercial(Mn.Sq.Ft.) Retail (Mn.Sq.Ft.)
City Supply Supply SupplyMumbai 19.2 6.2 NAPune 14.5 3.6 NAChennai 28.4 5 NADelhi NCR 164.8 8 NABangalore 59.0 9.1 NAHyderabad 58.7 1.1 NAKolkata 31.9 1.25 NATotal 376.6 34.3 143.0
553.80.0422.211.1
Total developable area Cement consumptions per sq ft per tonneCement demand over next two years (Mn Tonnes)Average annual cement consumption (Mn Tonnes)
Source: Industry, ICICIdirect.com Research

7
Oversupply unavoidable About 62 MT of cement capacity is scheduled to come on stream by the end of FY10. We expect the capacity utilisation of the industry to drop from 95% in FY08 to 87% in FY09 and further to 79% in FY10. Thus, cement prices are likely to come under pressure from the beginning of the monsoon season. Exhibit 9: Demand-Supply scenario; Capacity Utilisation to drop Million Tonnes FY05 FY06 FY07 FY08 FY09 FY10EEffective Capacity 153.6 158.1 166.7 175.7 206.5 246.0Production 127.6 141.8 155.7 168.3 181.4 195.6Capacity Utilisation (%) 83 90 93 95 88 79Domestic consumption 121.1 135.6 149.0 164.0 177.0 189.8*Export 10.1 9.2 9.0 6.0 6.1 5.8Import 0.4 0.7 0.0
Source: CMA, ICICIdirect.com Research
*Cement and clinker
Exhibit 10: Region wise capacity addition in FY10
47%
30%
11%
12%
South North East West
Source: Industry, ICICIdirect.com Research

8
Exhibit 11: Capacity addition in FY09 Capacity at the beginning of the year 2008-2009 was 198.30 Mn.T.
Month of CapacityCommissioning Existing
(a) NewOCL India-Kapilas (G) Orissa May-09 - 0.9Rain Comdt. Unit-II Line 2 A.P. Jun-09 - 2.0India Cements-Vallur (G) T.N. Aug-09 - 1.1UltraTech-Ginigera (G) KAR Sep-09 - 1.3Lakshmi Cmt-Kalol (G) GUJ Feb-09 - 0.6Madras Cmts-Ariyalur T.N. Mar-09 - 2.0Chettinad-Ariyalur T.N. Mar-09 - 2.0Total – (a) 9.9(b) ExpansionMadras Cements - R.S. Raja Nagar TN Apr-09 1.2 0.6Vasvadatta Cement KAR Apr-09 3.7 0.5Rain Comdt. Unit-1 A.P. Jun-09 1.0 0.4Rain Comdt. Unit-II Line 1 A.P. Jun-09 0.5 0.1My Home Indus. Ltd. A.P. Jun-09 2.8 0.4Mangalam Cement RAJ Sep-09 0.5 0.5J.K. Gotan RAJ Sep-09 0.1 0.4Kesoram Cement A.P. Nov-09 1.2 0.3Dalmia Cement T.N. Dec-09 3.5 0.5Total – (b) 3.7Total – (a+b) 13.5Capacity as on 31st March 2009 – 211.81 Mn.T.
Name of the Plant State Capacity Added
Source: CMA, ICICIdirect.com Research
Over the last 13 years, the steepest annual fall in cement WPI has been 3.4% as the quantum and timing of the decline has historically been different for different regions. Historically, the southern region has reported the highest decline in cement prices (due to its larger size and presence of a number of players) while the western region has shown least price declines. Exhibit 12: Cement WPI
120
140
160
180
200
220
240
FY96
FY97
FY98
FY99
FY00
FY01
FY02
FY03
FY04
FY05
FY06
FY07
FY08
WPI
-5.0%
0.0%
5.0%
10.0%
15.0%
20.0%
Chan
ge(%
)
Change(%) (RHS) WPI (LHS)
Base Year 1992-93=100 Note: Cement WPI indicates movement of average cement prices in India
Source: MOSPI, ICICIdirect.com Research

9
We believe that moderate concentration of the industry and low leverage will prevent a very sharp decline in prices. It should be noted that in the last down cycle, the cement sector was not consolidated as ACC and Ambuja were not under one group and UltraTech was not a part of the AV Birla group. The top five players now control about 52% (38% by combined Holcim and AV Birla group) of the total capacity. Exhibit 14: Debt equity ratio of cement industry
0.0
0.5
1.0
1.5
2.0
2.5
3.0
3.5
4.0
FY94
FY95
FY96
FY97
FY98
FY99
FY00
FY01
FY02
FY03
FY04
FY05
FY06
FY07
FY08
Deb
t equ
ity ra
tio (x
)
Source: Capitaline, ICICIdirect.com Research
Exhibit 13: Cement price changes in major cities
-20%
-15%
-10%
-5%
0%
5%
10%
15%
20%
25%
30%
FY98
FY99
FY00
FY01
FY02
FY03
FY04
FY05
FY06
FY07
FY08
FY09
Delhi Mumbai Chennai Kolkata
Unlike other regions, prices in South had declined by 10% for 2 consecutive years
Source: CMA, ICICIdirect.com Research

1 0
Exhibit 15: Herfindahl -Hirschman Index
Source: ICICIdirect.com Research
Note: HH Index is calculated by adding square of market share of industry players. The Indian cement industry has HHI of approx. 0.1, which indicates moderate concentration
An increase in the level of coordination in the industry was seen in the recent past in the northern region, which witnessed oversupply in the initial part of FY09. During April-November ’08, when cement consumption grew by 6.3% in Rajasthan and only by 2.3% in the northern region, cement players were able to maintain retail cement prices on a YoY basis despite the fact that Rajasthan added 9.2 MT (38%) capacity while the northern region added 12.1 MT (33%) capacity during the period. However, prices had declined in the bulk cement segment. North-based players, having a presence in the bulk cement segment, reported a decline in net realisations of 6.5% YoY in Q3FY09 on account of their inability to pass on the higher excise duty on bulk cement due to weak demand. Exhibit 16: Installed capacity (million tonne) and consumption growth (%)
Consumption Growth (%)
Nov'08 Nov'07 Capacity additions Apr-Nov'08
Rajasthan 33.2 24 9.2 6.3Northern region 48.3 36.3 12.1 2.3
Installed Capacity
Source: CMA, ICICIdirect.com Research
Exhibit 17: Cement prices in major northern cities Rs/Bag Nov'08 Nov'07 Var.(%)Delhi 233 232 0%Jaipur 220 213 4%Ludhiana 241 231 4%Chandigarh 237 229 3%Jammu 296 285 4% Source: CMA, ICICIdirect.com Research
Un-concentrated Moderately concentrated Highly concentrated
0 0.1 0.18 1.0
India Cement Industry

1 1
In order to recover cost of capital, a cement company should earn EBITDA per tonne of Rs 700 on a Greenfield plant and Rs 490 on a brownfield plant. Thus, even with 10% price correction and over Q3FY09 levels, cement industry will be able to recover its cost of capital. The actual price decline will also be a function of the decline in average cost of production of the industry. Exhibit 18: Sustainable EBITDA per tonne for cement industry
(a) Average Realisations 3493(b) Average EBITDA Per tonne 946(c) Capex For Greenfield 5000(d) Cost of capital 14%(e) Required EBITDA per tonne (c*d) 700(f) Decline in EBITDA per tonne (b-e) 246(g) Implied decline in cement price( f/a) 7%(h) Capex For Brownfield 3500(i) Required EBITDA per tonne (h*d) 490(j) Decline in EBITDA per tonne (b-i) 456(k) Implied decline in cement price (j/a) 13%(h) *Average Implied decline in cement price((k+g/2)) 10%*assuming cost structure remain same and no capacity is added by debottlenecking Source: ICICIdirect.com Research
Exhibit 19: Cement stock price index and major developments
0
1000
2000
3000
4000
5000
6000
Jan-
07
Feb-
07
Mar
-07
Apr-0
7
May
-07
Jun-
07
Jul-0
7
Aug-
07
Sep-
07
Oct-0
7
Nov
-07
Dec-
07
Jan-
08
Feb-
08
Mar
-08
Apr-0
8
May
-08
Jun-
08
Jul-0
8
Aug-
08
Sep-
08
Oct-0
8
Nov
-08
Dec-
08
Jan-
09
Feb-
09
Mar
-09
Import duty withdrawn
Dual excise duty on cement introduced
Cement players agreed to hold prices
Abolition of CVD & SAD
Ad valorem duty introduced
Liberalisation in imports from Pakistan
Excise duty on clinker increased to Rs 450/tn and on bulk cement increased to Rs 400/tn or 14%
Export ban
Cement clinker ban onexport to Nepal lifted
Export allowed from Gujarat ports Cenvat duty cut
of 4%
Excise duty on bulk cement decreased to Rs 230/tn or 8%
Source: CMIE, ICICIdirect.com Research

1 2
Subsiding cost pressure to cushion margins in near term Power & fuel constitutes 30-35% of the total expenditure for cement manufacturers. Companies mainly use coal and petcoke as fuel for power plants and kilns during the process of making cement. Due to worsening of the macroeconomics scenario, international coal and domestic petcoke prices have corrected by 67.8% and 49%, respectively, from their peak levels. The correction in sea freight has further reduced the landed cost of imported coal. The benchmark index for sea freights, the Baltic Dry Index is 80.8% down from its peak level. However, part of the benefit of softening of international coal prices has been taken away by a weaker rupee, which has deprecated 31% YoY. Exhibit 20: Baltic Dry Index & international coal prices
0
2000
4000
6000
8000
10000
12000
14000
Mar
-09
Feb-
09
Jan-
09
Dec-
08
Nov
-08
Oct-
08
Sep-
08
Aug-
08
Jul-0
8
Jun-
08
May
-08
May
-08
Apr-
08
Mar
-08
Feb-
08
Jan-
08
Dec-
07
Nov
-07
Oct-
07
Sep-
07
Aug-
07
0
25
50
75
100
125
150
175
200
USD
per T
onne
Baltic dry Index (RHS) Coal price Richards Bay, South Africa (LHS)
$57/Tonne
67.8% decline from peak of $177/tonne
80.8% decline from peak of 11612 2225
Note: Baltic Dry Index indicates the movement of sea freight rate
Source: Bloomberg, ICICIdirect.com Research
Exhibit 21: Rupee – US dollar exchange rate
38
40
42
44
46
48
50
52
Dec-
07
Jan-
08
Feb-
08
Mar
-08
Apr-0
8
May
-08
May
-08
Jun-
08
Jul-0
8
Aug-
08
Sep-
08
Oct-0
8
Nov
-08
Dec-
08
Jan-
09
Feb-
09
Mar
-09
Rupee has depreciated nearly 31% from its peak of 39.8, which has partly neutralised the benefits of decline in international coal prices.
Source: Reuters, ICICIdirect.com Research

1 3
Exhibit 22: Thermal coal prices spot prices, NCDEX
3000
3300
3600
3900
4200
4500
4800
Sep- 08 Oct- 08 Oct- 08
Nov
-08
Dec- 08
Dec- 08 Jan- 09
Feb- 09
Mar
-09
Rs
per
Ton
ne
Rs 3430/tonne
33% decline from its Sept high of Rs 4560/tonne
Source: NCDEX, ICICIdirect.com Research
Exhibit 23: Domestic petcoke prices
6073 5956
6343
58076073
63666065
4793
4053
3271
3000
4000
5000
6000
7000
Apr-0
8
May
-08
Jun-
08
Jul-0
8
Aug-
08
Sep-
08
Oct-0
8
Nov-
08
Dec-
08
Jan-
09
Rs p
er to
nne
Source: Industry, ICICIdirect.com Research

1 4
As far as domestic linkage of coal prices is concerned, it was last revised in Q3FY08 by 10-15%. Players, who depend on domestic coal, are unlikely to see a sharp decline in their average coal cost per tonne due to a decline in incremental coal linkages. Exhibit 24: Fuel receipts by cement industry (in million tonne)
Year Coal linkage Receipts against
linkageCoal
production
Coal Receipts as % of Coal
production
1992-93 15.6 10.5 238.3 4.4
1993-94 15.7 10.3 246.0 4.2
1994-95 17.0 10.3 253.8 4.1
1995-96 18.0 10.1 270.1 3.7
1996-97 16.9 10.5 285.7 3.7
1997-98 17.1 9.6 296.1 3.2
1998-99 14.1 8.2 290.8 2.8
1999-00 13.8 9.0 299.3 3.0
2000-01 13.5 9.7 309.8 3.1
2001-02 15.1 11.1 323.0 3.4
2002-03 15.7 12.4 324.2 3.8
2003-04 16.1 13.3 356.2 3.7
2004-05 17.1 14.8 376.6 3.9
2005-06 17.1 14.8 407.0 3.6
2006-07 15.5 14.4 430.9 3.3
2007-08 16.4 14.6 457.0 3.2 Source: CMA, Crisil, Coal India, ICICIdirect.com Research
Exhibit 25: Pithead coal prices
0
200
400
600
800
1000
1200
Dec-
91Ju
n-92
Dec-
92Ju
n-93
Dec-
93Ju
n-94
Dec-
94Ju
n-95
Dec-
95Ju
n-96
Dec-
96Ju
n-97
Dec-
97Ju
n-98
Dec-
98Ju
n-99
Dec-
99Ju
n-00
Dec-
00Ju
n-01
Dec-
01Ju
n-02
Dec-
02Ju
n-03
Dec-
03Ju
n-04
Dec-
04Ju
n-05
Dec-
05Ju
n-06
Dec-
06Ju
n-07
Dec-
07
Rs p
er to
nne
Note: Coal prices are for D-grade coal from Singareni Collieries.
Source: Crisil, ICICIdirect.com Research

1 5
Exhibit 26: Fuel mix of ICICIdirect.com cement universe Company Domestic Coal(%) Imported Coal(%) Petcoke(%)ACC 85 15 0Ultra Tech Cement 57 43 0Shree Cement 0 0 100Dalmia Cement 0 100 0India Cement 30 70 0JK Cement 10 0 90Orient Paper 100 0 0Ambuja Cement 70 30 0 Source: Company, ICICIdirect.com Research
Exhibit 27: Fuel and power cost of major players for FY08/CY07 Average per tonne coal of Fuel in last FY08/CY07
Company Rate/tonne for coal used in Klin CPP cost per unitGrid cost per unit
ACC 2580 2.44 3.55 59#Ambuja Cement - 2.06 3.62 52#India Cement 3863 NA 3.22 NA#Ultra Tech 3017 1.73 4.69 23*Shree cement 4587 2.16 5.38 95*JK Cement 4118 3.12 4.33 52Orient Paper 2018 NA 3.1 0Dalmia 4349 3.9 2.5 25Average 3586 2.6 3.8 52*Use Petoke# Imported Coal
Power cost per unit
% of power requirement met through CPP(Coal
&pet coke based)
Source: Company, ICICIdirect.com Research
Exhibit 28: Electricity consumption per tonne of cement
8985
8985
79
93
80.774
01020
3040506070
8090
100
ACC AmbujaCement
IndiaCement
Ultra Tech Shreecement
*JK cement Orient paper Dalmia
KWH/
tonn
e
*Including white cement
Source: Company, ICICIdirect.com Research

1 6
Crude oil prices have also corrected by 66% from their peak. This, in turn, has led to a saving in packing cost (decline of about Rs 4 per bag) and cut in domestic diesel prices by Rs 2 per litre each in December ’08 and January ’09. However, Indian Railways has changed the product classification for cement and coal in December ’08, which has resulted in an increase of 7-8% in freight charges. Apart from this, Railways has continued to levy a busy season surcharge of 7%. About 38% of the total industry volumes are dispatched by rail. With a worsening of the demand-supply situation, the lead distance to market is also expected to increase. Thus, we do not expect any significant saving in freight cost for the cement industry, which constitutes 25-30% of the total expenditure for cement manufactures. Exhibit 29: Transport mix Company Road Rail SeaACC 50 50 0Ultratech Cement 56 37 7Shree Cement 70 30 0JK Cement 78 22 0Dalima Cement 70 30 0Orient Paper 60 40 0Ambuja Cement 65 6 29 Source: Company, ICICIdirect.com Research
Exhibit 30: International crude oil prices & domestic diesel price
32
33
34
35
36
37
38
39
40
Dec-
07
Jan-
08
Feb-
08
Mar
-08
Apr-0
8
May
-08
Jun-
08
Jul-0
8
Aug-
08
Sep-
08
Oct-0
8
Nov
-08
Dec-
08
Jan-
09
Feb-
09
Mar
-09
Rs p
er li
tre
0
20
40
60
80
100
120
140
160
US$
per
bar
rel
Diesel (LHS) Crude Oil (RHS)
Source: Bloomberg, ICICIdirect.com Research
Govt has cut diesel prices by Rs 4 per ltr

1 7
Exhibit 31: Indian road freight index
171
173
172
171171171171
172
172
172
172
170
171
171
172
172
173
173
174M
ay-0
8
Jun-
08
Jul-0
8
Aug-
08
Sep-
08
Oct-0
8
Nov
-08
Dec-
08
Jan-
09
Feb-
09
Mar
-09
Source: TCIL, ICICIdirect.com Research
Exhibit 32: HDPE prices (packing material)
0
500
1000
1500
2000
2500
Mar
-08
Apr
-08
May
-08
Jun-
08
Jul-0
8
Aug
-08
Sep-
08
Oct-0
8
Nov
-08
Dec-
08
Jan-
09
Feb-
09
Mar
-09
USD
per
tonn
e
USD 970 Per tonne
Source: Bloomberg, ICICIdirect.com Research

1 8
In Q3FY09, the impact of receding cost pressures was already visible in the form of sequential improvement in financials of some of the cement companies. It should be noted that high cost inventories and contracts that cement players had entered into, have prevented major cost relief in Q3FY09. Q3FY09 Result review Exhibit 33: QoQ (Q3FY09 vs. Q2FY09) change in OPM (in bps)
-10
-420
520
-680
510 520
270
-100
-800
-600
-400
-200
0
200
400
600
ACC AmbujaCement
UltraTechCement
IndiaCement
ShreeCement
JKCement
OrientPaper
DalmiaCement
bps
Source: Company, ICICIdirect.com Research
Exhibit 34: QoQ (Q3FY09 vs. Q2FY09) % change in net profit and operating profit
22
0
61
13
-41
70
11
-14
24
45
-45
38
10
45
-38
-60
-40
-20
0
20
40
60
80
ACC AmbujaCement
UltraTechCement
IndiaCement
ShreeCement
JKCement
OrientPaper
DalmiaCement
QoQ
grow
th(%
)
Net Profit Growth Q0Q (%) Operating Profit growth QoQ (%)
Source: Company, ICICIdirect.com Research

1 9
Recommendation Some of the cement stocks are currently trading at valuations lower than the value given to loss making cement companies in the last 10 years. This is despite the fact that the replacement cost for cement companies has increased significantly over the last decade. We believe that long-term value has emerged in select cement stocks and companies that have completed a majority of their capex, undertaken cost-cutting measures or have a low cost structure and have lower earning sensitivity to price declines. These companies will be better off than their peers. Timely capex will reduce the payback period while low cost structure will enable them to cut prices and push volumes in a down cycle. We prefer UltraTech in large caps, Shree Cement in mid caps and JK Cement and Orient Paper in small caps. Our rating rationale is based on P/E & earnings risk, RoNW, EBITDA margins & EV per tonne and normalised P/E & RoNW matrix. We believe that as the cement sector is expected to witness a surplus in the near future, earnings risk will be key rather than CAGR of earnings (PEG). We have estimated the earning risk of cement companies by estimating the impact of cement price decline on earnings. Cement being a cyclical industry, we have also considered EV per tonne and normalized P/E as during a downturn, earnings contract significantly on account of the companies high earnings sensitivity to cement prices. We have calculated normalised earnings of cement companies by multiplying book value with normalized RoNW (average of business cycle RoNW). Cyclical industry stocks normally have a low P/E at the end of boom and a high P/E at the end of a down cycle. Use of normalized P/E reduces this anomaly. We have used this valuation methodology for pure cement companies having a long history. It is inappropriate to use it for diversified companies as the portion of capital employed in a cement division changes over a period of time. Exhibit 35: Some past M&A deals
Year Acquirer Target Capacity (mt) EV/tonne (US$)1998 Guj Ambuja Modi 2 421998 Grasim Sri Digvijay 1.1 41
1999 Ambuja ACC 12 1442003 Grasim L&T cement 17 822005 Holcim ACC 18 1102006 Holcim Guj Ambuja 13.4 1952007 Cimphor Sri Digvijay 1 1522008 CRH My Home 3 2202008 Vicat Sagar 2.5 105
Source: ICICIdirect.com Research

2 0
Exhibit 36: RoNW vs. EV/tonne
0
10
20
30
40
50
0 20 40 60 80 100 120
EV/Tonne (US$)
RoN
W (%
)
ACC Ambuja UltraTech Shree Cem
India Cem JK Cem Orient Paper Dalmia Cem
Source: ICICIdirect.com Research
Note: The size of the bubble indicates FY10E/CY09E OPM (%) Exhibit 37: FY10 P/E vs. earnings risk
0
2
4
6
8
10
1.0 3.0 5.0 7.0 9.0 11.0
P/E
Earn
ings
risk
(%)
ACC Ambuja UltraTech Shree Cem
India Cem JK Cem Orient Paper Dalmia Cem
Source: ICICIdirect.com Research

2 1
Exhibit 38: FY10 Normalised P/E & normalised RoNW (%)
4
8
12
16
20
24
6 7 8 9 10 11 12 13
Normalized RoNW(%)
Nor
mal
ized
P/E
ACC Ambuja Shree India Cem
Source: ICICIdirect.com Research
Exhibit 39: Earnings yield (%) & Earnings CAGR (%)
-40
-20
0
20
5 10 15 20 25 30 35 40 45
Earning yield(%)
Earn
ing
CAGR
(%)
ACC Ambuja Shree Cem India Cem
JK Cem Orient Paper Dalmia Cem UltraTech
As ACC and Ambuja has a negative earning CAGR with earning yield close to AAA bond, investors have no reward for bearing systematic risk in these stocks
AAA bond yield
Source: ICICIdirect.com Research

2 2
Exhibit 40: Q3FY09 cost structure of cement industry
-150
350
850
1350
1850
2350
2850
3350
ACC Ambuja Cement India Cement Ultra Tech Shree Cement *JK cement
Rs P
er to
nne
Stock Adj Raw material Employee cost Power and Fuel Freight Other Expenditure EBIDTA
*includes White Cement
Source: Company, ICICIdirect.com Research
Exhibit 41: Valuation matrix
FY08 FY09 FY10 FY08 FY09 FY10 FY08 FY09 FY10 FY08 FY09 FY10 FY08 FY09 FY10 FY08 FY09 FY10ACC 67.5 62.5 51.6 9.1 9.9 12.0 5.4 6.0 7.3 94.8 94.9 88.4 34.8 25.9 18.7 39.7 32.8 23.9Ambuja 8.3 7.4 7.2 9.7 10.7 11.1 5.2 6.6 6.2 121.7 109.1 106.3 30.8 21.9 18.0 39.6 27.7 23.1UltraTech 80.4 75.9 68.7 6.8 7.2 8.0 4.8 5.1 4.6 94.1 76.1 61.7 45.2 30.4 21.8 40.7 28.9 23.4Shree Cem 82.6 152.2 131.6 9.6 5.2 6.0 3.5 2.9 2.4 69.0 60.2 45.0 51.1 59.1 34.7 26.6 35.5 26.9India Cem 23.5 18.6 19.0 5.2 6.5 6.4 4.2 3.9 3.6 105.7 86.8 59.4 32.9 18.8 16.8 24.3 18.6 17.4JK Cem 37.9 18.4 22.3 1.4 2.9 2.4 1.8 5.4 3.3 34.8 67.6 36.1 41.5 15.7 16.3 26.0 12.5 13.5Orient Paper 10.9 12.2 9.3 2.6 2.5 3.0 1.9 1.8 1.7 33.6 33.5 17.7 66.9 38.5 24.3 59.7 39.7 27.0Dalmia Cem 43.0 18.2 17.4 2.2 5.2 5.5 3.5 5.7 4.4 79.8 115.8 59.9 36.6 12.1 10.3 22.9 10.7 10.0
RoNW (%) RoCE (%)EPS P/E EV/EBITDA EV/Tonne
Source: Company, ICICIdirect.com Research
Note: ACC’s and Ambuja’s numbers are for CY07, CY08 and CY09

2 3
Exhibit 1: Key Financials
CY06 CY07 CY08 CY09E CY10ENet Profit 1,461.5 1,256.5 1,133.5 1,093.6 868.8EPS 9.6 8.3 7.4 7.2 5.7% Growth -14.3 -9.8 -3.5 -20.6P/E (x) 8.3 9.7 10.7 11.1 14.0P/BV (x) 3.5 2.6 2.1 1.9 1.7EV/EBITDA (x) 5.4 5.2 6.6 6.2 6.7OPM% 34.0 35.8 27.4 29.7 25.2NPM % 23.3 22.0 18.2 17.7 13.9RoNW % 51.6 30.8 21.9 18.0 12.8RoCE % 45.2 39.6 27.7 23.1 16.9 Source: Company, ICICIdirect.com Research
Analysts’ Name
Ravi Sodah [email protected] Vijay Goel [email protected]
Sales & EPS trend
5,4005,6005,8006,0006,2006,400
CY06 CY07 CY08 CY09E CY10E
Rs
Cror
e
0
5
10
15
Rs
Net Sales EPS
Stock Metrics
Bloomberg Code ACEM INReuters Code ABUJ.BOFace value (Rs) 2Promoters Holding 46%Market Cap (Rs cr) 1306452 week H/L 119 / 43Sensex 10947Average volumes 335798 Comparative return metrics
Stock return(%) 3M 6M 12MAmbuja Cements 18 47 -25ACC 25 28 -23India Cement 18 35 -30Ultratech Cement 53 52 -28 Price Trend
40
60
80
100
120
140
Apr-
Jun-
Aug-
Oct-
Dec-
Feb-
Apr-
Close Price Target Price
April 20, 2009 | Cement
Initiating Coverage
Ambuja Cements (GUJAMB)
Unjustified premium… Ambuja Cements (ACL) is trading at steep premium to its peers despite not having best return ratios and margins in the industry. Also, company is adding 4.5 million tonnes (MT) of new capacity by CY11, the time by which the demand-supply situation will turn adverse. With realisation and capacity utilisation set to fall, we expect EPS to decline by 12.5% CAGR (CY08-CY10). Hence, we are initiating coverage on the stock with an UNDERPERFORMER rating on account of its expensive valuations.
Capacity addition to bring modest volume growth
Ambuja has expanded its capacity to 22 MT by adding 3.5 MT in CY08. The company is planning to further add 4.5 MT, which will take its capacity to 26.5 MT by CY11. 4.5 MT of capacity is scheduled to come on stream after mid CY09, the time by which the demand-supply situation will turn adverse.
Industry to face demand-supply mismatch; pricing pressure ahead
With 62 MT of capacity addition in FY10 and an expected slowdown in construction activities, we expect the demand-supply scenario to worsen. We have seen demand growth in the last couple of months on the back of pre-election spending and the government’s stimulus packages. However, we believe this is a temporary relief for the players. We expect a decline in realisations and capacity utilisation.
Cement exports to come under pressure Ambuja has exported 0.8 MT of cement (4.7% of the total sales volume) in CY08. The company mainly exports to Middle East countries. As the infrastructure and real estate projects around the Middle East slow down, Ambuja will find it difficult to divert higher volumes to export.
Valuations At the CMP of Rs 80, Ambuja Cement is trading at 11.1x and 14.0x its CY09E and CY10E earnings, respectively. On an EV/tonne basis, it is trading at $106/tonne and $94/tonne of its CY09E and CY10E capacities, respectively. Thus, we are initiating coverage on Ambuja Cement with an UNDERPERFORMER rating and a target price of Rs 64.
Current Price Rs 80
Target Price Rs 64
Potential upside -20%
Time Frame 12 months
UNDERPERFORMER
ICICIdirect.com | Equity Research

2 4
Company Background
Ambuja Cements was set up in 1986. The company is controlled by the Holcim group, which owns 45.68% of the company. The total capacity of the company, as on CY08, is 22 MT. Ambuja has a presence in the north, east and western regions of India. Its plants are situated in Gujarat, Maharashtra, Himachal Pradesh, Punjab, Rajasthan, Uttarakhand, Chhattisgarh and West Bengal. Ambuja has bulk cement terminals at Muldwarka (Gujarat), Panvel, Navi Mumbai and Surat. Ambuja is the largest exporter of cement in India. The company largely exports to the Middle East. The company was one of the first to be equipped with a shipping fleet and make use of the sea as a medium to transport cement across the globe. It has a port terminal at Muldwarka, Gujarat that handles ships with 40,000 DWT. Exhibit 2: Region wise capacity break up(as on Mar’09)
35%
43%
22%
North West East
Source: Company, ICICIdirect.com Research
Share holding pattern (Q4CY08)
Shareholder % holdingPromoters 46.47Institutional investors 37.91Other investors 11.00General public 4.62
Promoter & Institutional holding trend (%)
46% 46% 46% 46%37%37%37%38%
0%
20%
40%60%
80%
100%
Q1 Q2 Q3 Q4
Promoter Holding Institutional Holding

2 5
Investment Concerns
Capacity addition to bring modest volume growth Ambuja has expanded its capacity to 22 MT by adding 3.5 MT in CY08. The company is planning to further add 4.5 MT, which will take its capacity to 26.5 MT by CY11. 4.5 MT of capacity is scheduled to come on stream after mid CY09, the time by which the demand-supply situation will turn adverse. Thus, the sales volume of Ambuja is expected to grow at a CAGR of only 5.7% (CY08-CY10) while the end of the year installed capacity is expected to grow at 8% CAGR during the same period. Exhibit 3: Capacities commissioned in CY08 (million tonnes) Location Caoacity Completion
Surat (GJ) 1 CY08
Bhatapara (CG) 1 CY08
Maratha (Chandrapur) 1.5 CY08
Total 3.5
Source: Company, ICICIdirect.com Research
Exhibit 4: Capex plan (million tonnes) Location Grinding Clinker Expected Completion
Bhatapara (CG) - 2.2 Mid 2009
Ahemdabad (GJ) 1.5 - First half of 2011
Rauri (HP) - 2.2 End of 2009
Dadri (UP) 1.5 - Mid 2009
Nalagarh (HP) 1.5 - First half of 2010
Total 4.5 4.4 Source: Company, ICICIdirect.com Research
Industry to face demand-supply mismatch; pricing pressure ahead
With around 62 MT of capacity addition in FY10, we expect the demand-supply scenario to worsen. We have seen demand growth in the last couple of months on the back of pre-election spending and government’s stimulus packages. However, we believe this is a temporary relief for the players. We expect a decline in realisations and capacity utilisation. Cement exports in difficulty; gulf region faces oversupply Ambuja has exported 0.8 MT of cement (4.7% of the total sales volume) in CY08. The company mainly exports to Middle East countries. As infrastructure and real estate projects around the Middle East slow down, Ambuja will find it difficult to divert higher volumes to exports.

2 6
Financials
Earnings to decline During CY08-CY10, Ambuja’s net sales are expected to remain flat, a CAGR of 0.1% to Rs 6243 crore in CY10 from Rs 6235 crore in CY08 on account of 5.3% CAGR decline in realisation in the next two years. However, the sales volume is expected to grow at a CAGR of only 5.6% (CY08-CY10). Exhibit 5: Revenue to remain flat; volume to grow by 5.6% CAGR
0
1000
2000
3000
4000
5000
6000
7000
CY05 CY06 CY07 CY08 CY09E CY10E0
5
10
15
20
25
Sales Sales Volume
Source: Company, ICICIdirect.com Research
The operating profit is expected to decline by 4.0% CAGR to Rs 1573.2 crore in CY10 from Rs 1708.7 crore in CY08 on account of a decline in operating margin. Exhibit 6: Margins to decline
25.2
29.727.4
35.834.0
23.3 22.0
18.2
13.9
17.7
10
15
20
25
30
35
40
CY06 CY07 CY08 CY09E CY10E
EBITDA margin (%) NPM %
Source: Company, ICICIdirect.com Research

2 7
The reported net profit is expected to decline by 21.3% CAGR to Rs 869 crore in CY10 from Rs 1402 crore in CY08 as Ambuja had a high base in CY08. The company had a net extraordinary income on account of sale of investments, change in inventory policy and one-time retirement benefits charges. Thus, the adjusted PAT is expected to decline by 12.5% CAGR to Rs 869 crore in CY10 from Rs 1134 crore in CY08.
Return ratios to decline
Exhibit 7: RoNW & RoCE
16.9%
12.8%
30.8%
21.9%18.0%
27.7%23.1%
39.6%
0%
10%
20%
30%
40%
50%
CY07 CY08 CY09E CY10E
RoNW ROCE
Source: Company, ICICIdirect.com Research

2 8
Risks to our call
Captive power usage Ambuja sources around 64% of its power requirements from captive power generation. During 2008, one new 18.7 MW power plant was commissioned at the Rabriyawas plant. Additional captive power projects are in progress at Ambujanagar, Bhatapara and Maratha. These will add approximately another 90 MW, most commissioned in 2009 and taking the total capacity to more than 400 MW. For CY08, the average cost of power generation from coal-based CPP was Rs 2.60/Kwh as against Rs 3.86/Kwh for the power purchased from grid. Strong balance sheet Ambuja has cash and bank balance of Rs 852 crore and investments of Rs 332 crore at the end of CY08. It has a debt/equity ratio of 0.05 at the end of CY08. We expect it to further reduce to 0.03 by CY10 as the company’s total capex plan of Rs 3500 crore will be funded totally through internal accruals. Cost pressure eases The company meets 30% of its fuel requirement through imported coal. As international coal prices have dropped sharply by 67.8% from their peak, the company is expected to benefit from the March quarter only because it had been consuming high-cost coal inventory till now. With a worsening of the demand-supply scenario, the lead distance of the company to the markets is expected to increase. However, the cut in diesel prices by Rs 4/litre would enable the company to maintain its freight cost at current levels on a per tonne basis. Quantum of clinker purchase to decline in future Ambuja purchased 7.04 lakh tonnes of clinker (Rs 231.7 crore) in CY08 accounting for 38% of the total raw material cost. With new clinker capacities coming up, the company is likely to reduce clinker purchase in CY09 and CY10. The impact on the EBITDA margin of using purchased clinker rather than own produced clinker is approximately 260 bps.

2 9
Valuations
On an EV/tonne basis, Ambuja is trading at a steep premium to its peers despite the fact that it does not have the best return ratios and best margins in the industry. Even on a P/E basis, it is trading at richer valuations to its peers despite the fact that it does not have the lowest earnings risk in the industry. At the CMP of Rs 80, Ambuja Cement is trading at 11.1x and 14.0x its CY09E and CY10E earnings, respectively. On an EV/tonne basis, it is trading at $106/tonne and $94/tonne its CY09E and CY10E capacities, respectively. Thus, we are initiating coverage on Ambuja Cement with an UNDERPERFORMER rating and a target price of Rs 64. Exhibit 8: Movement of EV/tonne with change in RoE and RoCE
0
50
100
150
200
250
300
FY94
FY95
FY96
FY97
FY98
FY99
FY00
FY01
FY02
FY03
FY04
FY05
FY06
CY07
CY08
E
CY09
E
CY10
E
EV/t
onne
($)
-5
5
15
25
35
45
55
%
EV/Tonne ($) (RHS) ROE(%) (LHS) ROCE (%) (LHS)
Source: Company, ICICIdirect.com Research
Exhibit 9: P/BV, Market cap to sales, P/CEPS, EV/EBITDA
0
1
2
3
4
5
6
7
FY93
FY94
FY95
FY96
FY97
FY98
FY99
FY00
FY01
FY02
FY03
FY04
FY05
FY06
CY07
CY08
E
CY09
E
CY10
E
P/BV
& M
cap/
Sal
es
0
5
10
15
20
25
P/CE
PS &
EV/
EBIT
A
P/BV (LHS) M Cap/Sales (LHS) P/CEPS (RHS) EV/EBIDTA (RHS)
Source: Company, ICICIdirect.com Research

3 0
Profit and Loss Account Rs Crore Year Ending March 31 CY06 CY07 CY08 CY09E CY10E Net Sales 6,274.5 5,704.8 6,234.7 6,187.8 6,243.0 % Growth -9.1 9.3 -0.8 0.9 Total Expenditure 4138.1 3659.7 4456.7 4348.4 4669.8 EBITDA 2136.4 2045.1 1708.7 1839.4 1573.2 Other income 94.1 193.5 175.4 114.0 91.0 Depreciation 326.1 236.3 259.8 398.3 413.3 Interest 113.2 75.9 32.1 14.9 9.8 Extra ordinary items 47.5 785.9 377.6 0.0 0.0 PBT 1838.7 2712.4 1969.9 1540.3 1241.1 Taxation 338.4 943.3 567.6 446.7 372.3 Reported PAT 1500.3 1769.1 1402.3 1093.6 868.8 Extra ordinary items(net of tax) 38.8 512.6 268.8 0.0 0.0 Adjusted PAT 1461.5 1256.5 1133.5 1093.6 868.8 EBITDA margin (%) 34.0 35.8 27.4 29.7 25.2 NPM % 23.3 22.0 18.2 17.7 13.9 Shares O/S (crore) 151.7 152.2 152.3 152.3 152.3 EPS (Rs) 9.6 8.3 7.4 7.2 5.7
Balance Sheet Rs Crore Year Ending March 31 CY06 CY07 CY08 CY09E CY10E Sources of funds Equity Share Capital 304.5 304.9 304.9 304.9 304.9 Reserves & Surplus 3,187.2 4,356.4 5,368.0 6,156.0 6,782.0 Secured Loans 317.8 100.0 100.0 100.0 100.0 Unsecured Loans 547.6 230.4 188.7 158.7 128.7 Deferred Tax Liability 383.9 378.4 380.8 380.8 380.8 Total Liability 4,741.0 5,370.1 6,342.3 7,100.3 7,696.3 Application of Funds Net Block 2,489.2 2,959.9 3,192.8 5,902.8 5,821.3 Capital WIP 634.9 696.8 1,947.2 112.7 0.0 Investments 1,133.1 1,288.9 332.4 332.4 332.4 Cash 378.1 642.6 851.8 736.9 1,526.7 Sundry Debtors 90.0 145.7 224.6 222.9 224.9 Inventories 408.8 581.6 939.8 916.9 984.7 Loans & Advances 295.7 205.4 299.9 297.6 300.3 Current Liabilities & Provisions 701.6 1,169.1 1,473.8 1,449.4 1,521.8 Miscellaneous Expenditure 12.8 18.3 27.7 27.5 27.7 Total Asset 4,741.0 5,370.1 6,342.3 7,100.3 7,696.3

3 1
Cash Flow Statement Rs Crore Year Ending March 31 CY06 CY07 CY08 CY09E CY10E Profit Before Tax 1,841.6 2,712.4 1,969.9 1,540.3 1,241.1 Depreciation 326.1 236.3 259.8 398.3 413.3 Changes In working Capital 46.3 (117.9) (261.2) 2.6 (0.3) Others (412.3) (1,279.1) (1,002.2) (511.2) (418.9) Cash Flow from Operating activities 1,801.7 1,551.8 966.2 1,429.9 1,235.2 Inc/Dec in Investment 87.8 266.8 1,241.7 0.0 0.0 Capex (756.4) (521.5) (1,641.5) (1,273.8) (219.1) others 36.0 91.8 125.0 79.4 56.3 Cash Flow from Investing activities (632.7) (162.9) (274.9) (1,194.4) (162.8) Inc/Dec in capital 48.1 32.3 1.2 0.0 0.0 Inc/Dec in Loan Funds (340.2) (525.3) (43.4) (30.0) (30.0) Others (596.7) (631.4) (439.9) (320.5) (252.5) Cash Flow from Financing activities (888.9) (1,124.4) (482.1) (350.5) (282.5) Net Inc/dec in cash 280.2 264.4 209.3 (115.0) 789.9 Opening Balance of Cash 98.0 378.2 642.6 851.8 736.9 Closing Balance of Cash 378.1 642.6 851.8 736.9 1,526.7
Ratios Year Ending March 31 CY06 CY07 CY08 CY09E CY10E EPS 9.6 8.3 7.4 7.2 5.7 Cash EPS 12.0 13.2 10.9 9.8 8.4 OPM (%) 34.0 35.8 27.4 29.7 25.2 NPM (%) 23.3 22.0 18.2 17.7 13.9 Debt/Equity 0.25 0.07 0.05 0.04 0.03 RoCE (%) 45.2 39.6 27.7 23.1 16.9 RoNW (%) 51.6 30.8 21.9 18.0 12.8 Valuation Ratios P/E (x) 8.3 9.7 10.7 11.1 14.0 P/BV (x) 3.5 2.6 2.1 1.9 1.7 EV/EBITDA (x) 5.4 5.2 6.6 6.2 6.7 EV/Tonne (US$) 150.0 121.7 109.1 106.3 93.7 Turnover Ratios Fixed asset turnover ratio 1.4 1.1 1.1 0.7 0.7 inventory turnover ratio 10.1 6.3 4.7 4.7 4.7 Debtors turnover ratio 92.4 48.4 33.7 27.7 27.9

-
32
Exhibit 1: Key financials
FY07 FY08 FY09E FY10E FY11ENet Profit 230.2 348.0 147.3 140.5 105.2EPS 53.8 43.0 18.2 17.4 13.0% Growth -20.1 -57.7 -4.6 -25.2P/E (x) 1.8 2.2 5.2 5.5 7.3P/BV (x) 0.5 0.7 0.6 0.5 0.5EV/EBITDA (x) 3.7 3.5 5.7 4.4 4.5OPM% 25.0 32.0 25.0 22.0 18.0NPM % 23.0 23.0 8.0 6.0 4.0RoNW % 39.0 36.6 12.0 10.0 7.0RoCE % 22.8 22.9 11.0 10.0 9.0 Source: Company, ICICIdirect.com Research
Analysts’ Name
Ravi Sodah [email protected] Vijay Goel [email protected]
Sales & EPS trend
0
500
1000
1500
2000
2500
3000
FY07 FY08 FY09E FY10E FY11E
Rs C
rore
0
10
20
30
40
50
60
Rs
Net Sales EPS (Rs) Stock Metrics
Bloomberg Code DCB INReuters Code DLMI.BOFace value (Rs) 2Promoters Holding 54.8%Market Cap (Rs cr) 79252 week H/L 355 / 67.2Sensex 10947Average volumes 21736 Comparative return metrics
Stock return(%) 3M 6M 12MDalmia Cem 28 1 -65Jk Cem 36 -18 -62Shree Cem 69 74 -24Orient Paper 56 46 -33 Price Trend
3080
130180230280330
Mar
-
May
-
Jul-
Sep-
Nov
-
Jan-
Mar
-
Close Price Target Price
April 20, 2009 | Cement
Initiating Coverage
Dalmia Cement (DALCEM)
Caught in equity market woes… Dalmia Cement (Bharat) (DCBL) is expanding its capacity from 3.5 million tonnes (MT) to 8 MT. All plants of the company will be located in the southern region, which is expected to have surplus supplies in the next financial year. This will lead to deterioration in the return ratio below WACC. Apart from this, DCBL has had notional loss on its investments and has highest leverage in our coverage universe. Hence, we are initiating coverage on the stock with an UNDERPERFORMER rating and one-year target price of Rs 81 per share.
Regional player The company has presence only in southern markets. Out of the expected 62 MT capacity addition at an all-India level in FY10, around 47% is coming up in the southern region, which will lead to a worsening
High debt to equity DCBL has total capex of around Rs 1250 crore and is funded by debt of Rs 1100 crore and balance through internal accruals. The company has debt equity ratio of 1.9 for FY09E, highest among our coverage universe.
High exposure to equity investments DCBL has exposure to equity market investments on which it had a notional loss of Rs 160 crore on its investment books as on December 31 2008.
High debt to increase payoff period The company is adding capacity at nearly Rs 2778/tonne. 80% of the capex has been funded through debt. The payoff period for the company after accounting for interest expense and interest accrued during the moratorium period will be close to six years. Valuations At the CMP of Rs 95, DCBL is trading at 5.2x and 5.5x its FY09E and FY10E earnings, respectively. On an EV/tonne basis, it is trading at $116/tonne and $60/tonne its FY09E and FY10E capacities, respectively. We are initiating coverage on the stock with an UNDERPERFORMER rating and a target price of Rs 81.
Current Price Rs 95
Target Price Rs 81
Potential upside -15%
Time Frame 12-15 months
UNDERPERFORMER
ICICIdirect.com | Equity Research

-
33
Company Background
Dalmia Cements (Bharat) Ltd (DCBL) was established in 1935. DCBL has two major business segments — cement and sugar. The company started its cement operations in 1939. DCBL has a presence only in the southern region. The company’s other product profile includes power, refractories and refractory products, multilayer ceramic chip capacitors, industrial alcohol and others. DCBL has a current cement capacity of 3.5 MT with a plant in Tamil Nadu. The company is in the process of expanding its cement capacity by 4.5 MT by setting up plants at Kadapa, Andhra Pradesh and Ariyalur, Tamil Nadu of 2.25 MT each. DCBL has expanded its sugar business to 22500 TCD at three locations of Uttar Pradesh with cogeneration power plant capacity of 79 MW and ethanol plant with a capacity of 80 KL per day. The company also has a 16-MW wind farm power generation unit. The power generated from this unit is utilised for consumption at the cement unit by wheeling through the state electricity grid. Exhibit 2: Revenue mix (FY08)
77%
18%
5%
Cement Sugar Others
Source: Company, ICICIdirect.com Research
Exhibit 3: Cement geographical mix (FY08)
60%27%
9%4%
Tamil Nadu Kerala Karnataka Others
Source: Company, ICICIdirect.com Research
Share holding pattern (Q3FY09)
Shareholder % holdingPromoters 54.79Institutional investors 5.06Other investors 11.00General public 29.15
Promoter & Institutional holding trend (%)
55% 55% 55% 55%
5% 5% 5% 6%
0%
20%
40%60%
80%
100%
Q4 Q1 Q2 Q3
Promoter Holding Institutional Holding

-
34
Investment concerns
Regional player The company has 100% presence in the southern markets. Out of the expected 62 MT capacity addition at an all-India level, around 47% is coming up in the southern region in FY10. This will lead to a worsening of the demand-supply scenario.
High debt to equity DCBL has a total capex of around Rs 1250 crore and is funded by debt of Rs 1100 crore with the balance through internal accruals. The company has a debt equity ratio of 1.9 for FY09E. This is the highest in our coverage universe. However, the debt repayment will start after two years. Thus, we do not expect the company to face a cash crunch for two years.
High debt to increase payoff period The company is adding capacity at nearly Rs 2778/tonne. 80% of the capex has been funded through debt. The payoff period for the company after accounting for interest expense and interest accrued during the moratorium period will be close to six years.
High exposure to equity investments The company has exposure to equity market investments on which it had notional loss of Rs 160 crore on its investment books as on December 31 2008.
High-cost coal inventories procurement till Q4FY09 Dalmia had procured imported coal at nearly $190 per tonne. We expect these high-cost coal inventories to be consumed by Q4FY09. Thus, it will depress the Q4FY09 earnings of the company. We expect the company to only benefit in terms of coal cost from Q1FY10 as imported coal prices have corrected by nearly 67.8% from their peak.

-
35
Financials
Topline to grow at 22% CAGR (FY08-FY11) Net sales is expected to grow at 23.1% CAGR (FY08-FY11) to Rs 2762.7 crore in FY11 from Rs 1482 crore in FY08 on the back of 25.2% CAGR increase in cement sales volume during the same period. Exhibit 4: Revenue to grow at 23% CAGR (FY08-FY11)
0
500
1000
1500
2000
2500
3000
FY08 FY09E FY10E FY11E
Rs c
rore
0%
10%
20%
30%
40%
50%
60%
Net Sales % Growth
Source: Company, ICICIdirect.com Research
Exhibit 5: Revenue mix
0
500
1000
1500
2000
2500
3000
FY08 FY09E FY10E FY11E
Rs c
rore
Cement Sugar Others
Source: Company, ICICIdirect.com Research

-
36
Margins The OPM is expected to decline to 17.9% in FY11 from 31.8% in FY08 on the back of a fall in cement realisations. Exhibit 6: OPM of cement and sugar business
44%
36%32%
27%
11% 11% 10%6%
0%
10%
20%
30%
40%
50%
FY08 FY09E FY10E FY11E
Cement Sugar
Source: Company, ICICIdirect.com Research
Exhibit 7: OPM & NPM
17.9%
23.5%
3.8%
31.8%
21.6%25.2%25.4%
8.4%5.9%
23.3%
0%
5%
10%
15%
20%
25%
30%
35%
FY07 FY08 FY09E FY10E FY11E
OPM% NPM %
Source: Company, ICICIdirect.com Research
Exhibit 8: EBITDA per tonne of cement and sugar business
15191389
1129920
2125 2240 2145
1181
0
500
1000
1500
2000
2500
FY08 FY09E FY10E FY11E
Rs p
er to
nne
Cement Sugar
Source: Company, ICICIdirect.com Research

-
37
Net profit The net profit is expected to decline by 33% CAGR (FY08-FY11) to Rs 105.2 crore from Rs 348 crore on account of the lower operating margin and high interest cost. Exhibit 9: Net profit to decline by 33% CAGR (FY08-FY11)
230.17
348.02
147.34 140.50105.15
050
100150200250300350400
FY07 FY08 FY09E FY10E FY11E
Rs
Net Profit
Source: Company, ICICIdirect.com Research
Return ratios to decline RoNW and RoCE are expected to decline to 7.1% and 8.9% in FY11 from 36.6% and 22.9% in FY08, respectively. Exhibit 10: RoNW & RoCE
36.6%
22.9%
7.1%10.3%
39.0%
12.1%8.9%10.0%
22.8%
10.7%
0%
10%
20%
30%
40%
FY07 FY08 FY09E FY10E FY11E
RoNW % RoCE %
Source: Company, ICICIdirect.com Research

-
38
Risks to our call
Capacity addition to drive cement volume growth by 25% CAGR (FY08-FY10) DCBL is expanding its cement capacity by 4.5 MT to 8 MT by adding two units of 2.25 MT each. Clinker production from the AP plant has already been commissioned in December 2008 whereas production from the Tamil Nadu plant is expected from July 2009. We expect the cement sales volume of DCBL to grow at 25% CAGR (FY08-FY10). This would enable the company to maintain its bottomline in FY10 despite a fall in cement prices. Location Capacity (Million Tonnes) Expected CompletionKadapa, Andhra Pradesh * 2.25 Mar-09Ariyalur, Tamil Nadu 2.25 Jul-09* Clinker unit commisioned in Dec'08 Presence in highly priced markets The company has a presence in the highly priced southern region markets, viz. Tamil Nadu, Kerala, Karnataka and Andhra Pradesh. On account of its market mix, DCBL has the highest realisations in our coverage universe. The net realisation of the company for Q3FY09 was Rs 3891/tonne and for 9MFY09 was Rs 3758/tonne. Exhibit 11: Net realisation of our coverage as of Dec 08 quarter
3455 3606 3765 35683049
36542952
3891
0
1000
2000
3000
4000
5000
ACC
Am
buja
Indi
aCe
m
Ultr
atec
h
Shre
eCe
m
JK C
em
Orie
ntPa
per
Dal
mia
Rs p
er to
nne
Source: Company, ICICIdirect.com Research
Meets entire fuel requirement through imported coal The company meets its entire fuel requirement through imported coal for its kiln and power plant operations. As imported coal prices have corrected by nearly 67.8% from their peak, the company is likely to benefit in terms of coal cost from Q1FY10. Firm sugar prices to drive sugar revenue India’s sugar inventory has declined to 4.6 MT in 2009 from 9.1 MT in 2008. The current favourable demand-supply scenario has led to a surge in sugar prices to Rs 23 per kg (ex-factory). In the short to medium term, sugar prices are likely to remain firm on the back of tight supply in India and a global deficit.

-
39
Valuations
At the CMP of Rs 95, DCBL is trading at 5.2x and 5.5x its FY09E and FY10E earnings, respectively. On an EV/tonne basis, it is trading at $116/tonne and $60/tonne its FY09E and FY10E capacities, respectively. We believe Dalmia Cement being a regional player having high debt/equity is more vulnerable to its peers in a down cycle. Also we expect the return ratios of DCBL to decline below WACC in the current down cycle. Factoring in concerns like lower return ratios, high leverage and presence in price sensitive markets of southern India, we expect Dalmia Cement to continue to trade at a steep discount to its replacement cost. Thus, we are initiating coverage on Dalmia Cement with an UNDERPERFORMER rating and a target price of Rs 81. Exhibit 12: Historical Valuations
0
2
4
6
8
10
12
FY94
FY95
FY96
FY97
FY98
FY99
FY00
FY01
FY02
FY03
FY04
FY05
FY06
FY07
FY08
FY09
FY10
FY11
P/C
EPS,
EV/
EBIT
DA
0
0.5
1
1.5
2
2.5
3
3.5
P/BV
, MCa
p/Sa
lesP/CEPS (LHS) EV/EBIDTA (LHS) P/BV (RHS) M Cap/Sales (RHS)
Source: Company, ICICIdirect.com Research

-
40
Profit and Loss Account Rs Crore Year Ending March 31 FY07 FY08 FY09E FY10E FY11E
Net Sales 986.5 1,482.0 1,752.8 2,395.6 2,762.7 % Growth 50.2 18.3 36.7 15.3 Total Expenditure 735.9 1011.0 1311.9 1879.1 2269.2 EBITDA 250.6 471.0 440.9 516.6 493.5 Other income 156.1 164.0 14.0 14.0 15.4 Depreciation 55.1 87.1 92.5 129.3 131.3 Interest 54.0 112.9 141.8 206.1 231.5 Extra ordinary items 0.0 0.0 0.0 0.0 0.0 PBT 297.6 435.0 220.5 195.1 146.0 Taxation 67.5 86.9 73.2 54.6 40.9 Reported PAT 230.2 348.0 147.3 140.5 105.2 Extra ordinary items(net of tax) 0.0 0.0 0.0 0.0 0.0 Adjusted PAT 230.2 348.0 147.3 140.5 105.2 EBITDA margin (%) 25.4 31.8 25.2 21.6 17.9 NPM % 23.3 23.5 8.4 5.9 3.8 Shares O/S (crore) 4.3 8.1 8.1 8.1 8.1 EPS (Rs) 53.8 43.0 18.2 17.4 13.0
Balance Sheet Rs Crore Year Ending March 31 FY07 FY08 FY09E FY10E FY11E Sources of funds Equity Share Capital 8.6 16.2 16.2 16.2 16.2 Reserves & Surplus 745.0 1,131.0 1,278.3 1,418.8 1,524.0 Secured Loans 930.6 1,050.1 1,700.1 1,798.1 1,918.1 Unsecured Loans 84.0 533.3 733.3 733.3 733.3 Deferred Tax Liability 129.3 163.0 163.0 163.0 163.0 Total Liability 1,897.4 2,893.5 3,890.8 4,129.3 4,354.5 Application of Funds Net Block 1,227.1 1,324.7 2,082.2 2,453.0 2,371.7 Capital WIP 116.5 501.3 673.7 0.0 0.0 Investments 378.6 613.8 613.8 613.8 613.8 Cash 103.8 87.0 73.1 412.8 607.8 Sundry Debtors 82.1 105.1 124.3 169.8 195.9 Inventories 197.5 491.6 637.9 913.7 1,103.4 Loans & Advances 292.2 433.2 512.4 700.3 807.6 Current Liabilities & Provisions 500.3 663.3 826.5 1,134.0 1,345.7 Miscellaneous Expenditure 0.0 0.0 0.0 0.0 0.0 Total Asset 1,897.4 2,893.5 3,890.8 4,129.3 4,354.5

-
41
Cash Flow Statement Rs Crore Year Ending March 31 FY07 FY08 FY09E FY10E FY11E Profit Before Tax 296.4 434.1 220.5 195.1 146.0 Depreciation 55.4 87.3 92.5 129.3 131.3 Changes In working Capital 123.1 (299.2) (81.5) (201.6) (111.4) Others (120.8) (88.8) 54.6 137.5 175.2 Cash Flow from Operating activities 354.2 133.4 286.2 260.3 341.1 Inc/Dec in Investment (66.9) 250.3 0.0 0.0 0.0 Capex (611.5) (575.2) (1,022.4) 173.5 (50.0) others (0.1) (345.3) 14.0 14.0 15.4 Cash Flow from Investing activities (678.5) (670.2) (1,008.4) 187.5 (34.6) Inc/Dec in capital 117.3 90.6 0.0 0.0 0.0 Inc/Dec in Loan Funds 333.1 569.3 850.0 98.0 120.0 Others (81.2) (139.8) (141.8) (206.1) (231.5) Cash Flow from Financing activities 369.2 520.1 708.2 (108.1) (111.5) Net Inc/dec in cash 44.8 (16.7) (14.0) 339.7 195.0 Opening Balance of Cash 58.9 103.7 87.0 73.0 412.7 Closing Balance of Cash 103.7 87.0 73.0 412.7 607.8
Ratios Year Ending March 31 FY07 FY08 FY09E FY10E FY11E EPS 53.8 43.0 18.2 17.4 13.0 Cash EPS 66.7 53.8 29.7 33.4 29.2 OPM (%) 25.4 31.8 25.2 21.6 17.9 NPM (%) 23.3 23.5 8.4 5.9 3.8 Debt/Equity 1.3 1.4 1.9 1.8 1.7 RoCE (%) 22.8 22.9 10.7 10.0 8.9 RoNW (%) 39.0 36.6 12.1 10.3 7.1 Valuation Ratios P/E (x) 1.8 2.2 5.2 5.5 7.3 P/BV (x) 0.5 0.7 0.6 0.5 0.5 EV/EBITDA (x) 3.7 3.5 5.7 4.4 4.5 Turnover ratios Fixed asset turnover ratio 0.6 0.8 0.6 0.7 0.8 inventory turnover ratio 3.7 2.1 2.1 2.1 2.1 Debtors turnover ratio 9.0 9.6 10.6 11.1 11.6

42
Analysts’ Name
Ravi Sodah [email protected] Vijay Goel [email protected]
Sales & EPS trend
1000
2000
3000
4000
FY07
FY08
FY09
E
FY10
E
FY11
E
Rs C
rore
15
20
25
R
Sales EPS Stock Metrics
Bloomberg Code ICEM IN Reuters Code ICMN.BO Face value (Rs) 10 Promoters Holding 28 Market Cap (Rs cr) 3680 52 week H/L 195 / 68 Sensex 10947 Average volumes 252982
Comparative return metrics
Stock return (%) 3M 6M 12MIndia Cement 18 35 -30ACC 25 28 -23Ambuja Cements 18 47 -25Ultratech Cement 53 52 -28 Price Trend
40
90
140
190
Apr-0
8
Jun-
08
Aug-
08
Oct-0
8
Dec-
08
Feb-
09
Apr-0
9
Close Price Target Price
April 20, 2009 | Cement
Initiating Coverage
India Cement (INDCEM)
Fairly valued… India Cement (ICL) is currently trading at lower valuations on EV/tonne and EV/EBIDTA basis than the last down-cycle, in which it incurred losses due to higher leverage. However, in terms of P/BV, Mcap/sales and normalised P/E it is still trading at a premium to the last down cycle. Even on a relative valuations basis, it is richly valued compared to north-based players. Thus, we are initiating coverage on the stock with a HOLD rating and price target of Rs 110 per share.
To benefit from decline in coal prices Imported coal meets approximately 70% of ICL’s fuel requirement. The prices of imported coal have declined by 67.6% to $57 per tonne from their peak of $177 per tonne. The benefit of the decline in coal prices is likely to be visible from Q4FY09.
Dependence on grid power India Cement (ICL) does not have captive power plants (CPPs) at any of its unit except for a waste heat recovery power plant (of 8 MW), wind power (of 10 MW) and DG sets. However, it has power supply arrangement with APGPCL and Coromondel Power Company for the rest of the requirement.
FCCB may require Rs 575 crore cash outflow in FY12 ICL has outstanding foreign currency convertible bonds (FCCBs) of US475 million, which are to be converted at the price of Rs 305 or are redeemable at 147.7% of its face value. Thus, this could result in a cash outgo of Rs 575 crore (i.e. approximately half of the reported EBITDA of FY08) in May 2011.
Valuations At the CMP of Rs 120 per share, the stock is trading at 6.5x and 6.4x its FY09E and FY10E earnings, respectively. It is trading at an EV/tonne of $87 and $60 its FY09E and FY10E capacities, respectively. We are initiating coverage on the stock with a HOLD rating and a price target of Rs 110 per share.
Current Price Rs 120
Target Price Rs 110
Potential upside -9%
Time Frame 12 months
HOLD
Exhibit 1: Key Financials
Year Ending March 31 FY07 FY08 FY09E FY10E FY11E
Net Profit (Rs Cr) 478.8 661.3 523.8 535.7 527.1
EPS (Rs) 18.4 23.5 18.6 19.0 18.7
% Growth 27.6 -20.8 2.3 -1.6
P/E (x) 6.6 5.2 6.5 6.4 6.5
P/BV (x) 2.2 1.3 1.1 1.0 0.9
EV/ 6.6 4.2 3.9 3.6 3.2 OPM(%) 32.6 35.4 30.4 27.8 25.2
NPM (%) 21.2 21.7 15.4 14.5 13.2
RoNW (%) 37.4 32.9 18.8 16.8 14.6
RoCE (%) 20.2 24.3 18.6 17.4 15.8 Source: Company, ICICIdirect.com Research
ICICIdirect.com| Equity Research

43
Company background Established in 1946, India Cement (ICL) is among the largest players in South India, with a cement capacity of 10.8 million tonnes (MT). The company has seven plants of which four are in Andhra Pradesh and three are in Tamil Nadu. India Cement’s key markets are Andhra Pradesh, Tamil Nadu, Kerala, parts of Karnataka and Maharashtra. ICL has historically been a south-based player. However, going forward, it is in the process of diversifying its presence by venturing into North India.
India Cement sells its cement under the brand name of ’Sankar Super Power’, ‘Coromandel Super Power’ and ‘Raasi Super Power’.
India Cement has acquired the Chennai franchisee in the Indian Premier League (IPL), the 20:20 format tournament started by the Board of Control of Cricket in India (BCCI) for US$91 million in January 2008. The investment in IPL was done by the company from the point of view of advertising its brands all across the country.
Exhibit 2: Volume break up
36%
24%
16%
15%
7% 2%
Tamil Nadu Andhra Pradesh Kerala
Karnataka Maharashtra Others
Source: Company, ICICIdirect.com Research
Shareholding pattern (Q3FY09)
Shareholder % holdingPromoters 28.0Institutional investors 46.9Other investors 17.9General public 7.2
Promoter & Institutional holding trend (%)
35% 36% 37% 37%
28%28%27% 28%
0%
20%
40%
Q4 Q1 Q2 Q3
Promoter Holding Institutional Holding

44
Investment Rationale
To benefit from decline in coal prices Imported coal meets approximately 70% of ICL’s coal requirements. The prices of imported coal have declined by 66% to $57 per tonne from their peak of $177 per tonne. The benefit of decline in coal prices is likely to be visible from Q4FY09. India Cement has also acquired two second-hand dry bulk carriers of about 40,000 tonne each to transport coal from international markets. However, due to sharp corrections in sea freights (benchmark index Baltic Dry Index has corrected around 80% from its peak), we do not expect any significant saving in transportation cost of coal. Nevertheless, it will hedge the company from the volatility in sea freights.
Capacity additions to contribute to volume growth
ICL is in the process of increasing its cement capacity from 10.8 MT to 14.3 MT through debottlenecking and brownfield expansions. India Cement will be further adding 1.5 MT in Rajasthan. The company has deferred its 2 MT greenfield plant in Himachal Pradesh for the time being. On account of capacity additions, we expect India Cement’s volumes to grow at a CAGR of 10.7% between FY08 - FY11 period.
Exhibit 3: Power & fuel cost per tonne
600
750
900
1050
FY06
FY07
FY08
FY09
E
FY10
E
FY11
E
Rs p
er to
nne
Source: Company, ICICIdirect.com Research
Exhibit 4: Cement sales volumes (in million tonnes)
9.2 9.1
11.012.5
0
2
4
6
8
10
12
14
FY08 FY09E FY10E FY11E
Cem
ent S
ales
vol
umes
Source: Company, ICICIdirect.com Research

45
Presence in high priced, high growth markets of South India The company sells more than 91% of its production in the high-priced and high growth market of South India. As against an all-India cement consumption growth of 8%, South India’s consumption has grown by 10% in FY10. Apart from this, cement prices in South India are higher than in any other region in India by about Rs 29 per bag (13%). However, it may also be noted that historically cement prices have declined much more sharply in the southern region compared to other regions in the event of surplus due to it bigger size, presence of a number of small players and higher leverage of south-based players.
Exhibit 5: Installed capacity (in million tonnes)
1.62.8
4.0
6.8 7.09.1
15.8
1
4
7
10
13
16
89-9
0
90-9
7
97-9
8
98-9
9
99-0
1
01-0
7
09-1
0E
Mill
ion
tone
s
Source: Company, ICICIdirect.com Research
Exhibit 7: YTD (Apr08-Feb09) cement consumption growth
10.0%
8.0%
5%
7%
9%
11%
All India Southern Region
Cons
umpt
ion
Grow
th(%
)
Source: CMA, ICICIdirect.com Research
Exhibit 6: Cement prices in major cites in first week of March ’09
City Rs per 50 kg
Jammu N 293
Trivandrum S 280
Cochin S 280
Bangalore S 268
Chennai S 265
Mumbai W 259
Guwahati E 250
Simla N 242
Ludhiana N 236
Calcutta E 235
Chandigarh N 233
Delhi N 232
Ahmedabad W 228
Nagpur W 227
Karnal N 223
Patna E 219
Bhubaneshwar E 219
Jaipur N 219
Hyderabad S 217
Lucknow C 206
Bhopal C 205
All India Average 240 All India Average ex South 233 South India Average 262
Source: CMA, ICICIdirect.com Research
N-North, S-South, W-West, E-East, C-Central

46
Financials
ICL’s revenue is expected to grow at 9.5% CAGR (FY08-FY11) to Rs 3998.4 crore in FY11 from Rs 3047.1 crore in FY08. OPM is expected to shrink by 1020 bps to 25.2% in FY11 from 35.4% in FY08 due to decline in cement realisations. The adjusted net profit is expected to decline at 7.3% CAGR (FY08-FY11) to Rs 527.1 crore in FY11 from Rs 661.3 crore in FY08.
Exhibit 8: Revenue to grow at CAGR of 9.5%
2000
3000
4000
5000
FY07
FY08
FY09
E
FY10
E
FY11
E
Rs c
rore
5%
15%
25%
35%
45%
55%
Grow
th (%
)Revenue Growth(%)
Source: Company, ICICIdirect.com Research
Exhibit 9: PAT to decline at a CAGR of 7.3%
0
100
200
300
400
500
600
700
FY07 FY08 FY09E FY10E FY11E
Rs in
cro
re
-250%
0%
250%
500%
750%
1000%
1250%
Grow
th (%
)
Net profit Growth(%)
Source: Company, ICICIdirect.com Research

47
Exhibit 10: EBITDA margin (%) and adjusted net profit margin (%)
10%
20%
30%
40%
FY07 FY08 FY09E FY10E FY11E
EBIDTA Margin(%) Adjusted Net Profit Margin (%)
Source: Company, ICICIdirect.com Research

48
Risks & concerns
Capacity additions to put pressure on cement prices About 29 million tonnes of cement capacity is scheduled to be added in South India by the end of FY10. Historically, cement prices in South India have been more vulnerable than other region on account of its bigger size. Also, out of the seven plants of the company, three are located in Tamil Nadu while the balance is in southern Andhra Pradesh. Due to the location of its plants, India Cement will find it difficult to divert its volume to other regions.
Dependence on grid power ICL does not have CPPs at any of its units except for a waste heat recovery power plant (of 8 MW) wind power (of 10 MW) and DG set, which in FY08 met about 11% of the company’s power requirement. However, it has power supply arrangements with APGPCL and Coromondel Power Company for the rest of the requirement.
Had lower EBITDA per tonne than efficient players in last down cycle In the last down cycle, ICL reported net losses (on account of higher debt equity ratio) and had to undergo debt restructuring. Also, the company had earned EBITDA of only Rs 66 per tonne as compared to Rs 500 per tonne earned by efficient players. However, in the current down cycle, we do not expect the company to incur losses as it has lower gearing than the last down cycle. Apart from this, improvement in technology and increase in blended cement proportions have improved the cement to clinker ratio of the company, which, in turn, has reduced power consumption and made its cost structure more efficient compared to the last down cycle.
Exhibit 11: Sources of power and per unit cost
2
3
4
5
FY99
FY00
FY01
FY02
FY03
FY04
FY05
FY06
FY07
FY08
FY09
E
FY10
E
FY11
E
Rs p
er u
nit
0%
25%
50%
75%
100%
% o
f ow
n ge
nera
tion
% of Own Generation (RHS) Power purchased from external sources (LHS)
Own generation (LHS) Average rate per unit (LHS)
Source: Company, ICICIdirect.com Research

49
Exhibit 12: Net realisation and EBITDA per tonne
2081 2047
2667
496 610805
3117
32813591
3285
18061733
1689
2346
20292058
936
11321226883354236
17966
341559
50
1050
2050
3050
4050FY
99
FY00
FY01
FY02
FY03
FY04
FY05
FY06
FY07
FY08
FY09
E
FY10
E
FY11
E
Rs p
er to
nne
Net Relisation per tonne EBIDTA per tonne
Source: Company,ICICIdirect.com Research
Exhibit 13: Net debt equity ratio, interest cover and interest expenses as a % of sales
0
5
10
15
20
25
FY00
FY01
FY02
FY03
FY04
FY05
FY06
FY07
FY08
FY09
E
FY10
E
FY11
E
Net
deb
t/Eq
uity
& In
tere
stCo
vera
ge
0%
10%
20%
30%
40%
Inte
rest
as a
% o
f Sal
es
Net Debt/Equity (LHS) Net Interest Cover (LHS) Interest exp as a % to Sales (RHS)
Source: Company, ICICIdirect.com Research

50
Valuations
At the CMP of Rs 121 per share, the stock is trading at 6.5x and 6.4x its FY09E and FY10E earnings, respectively. It is trading at an EV/tonne of $87 and $60 its FY09E and FY10E capacities, respectively. We are initiating coverage on the stock with a HOLD rating and a price target of Rs 110 per share. On EV-based multiples (EV per tonne and EV/EBIDTA), ICL is available at the valuations of the last down cycle when it had incurred losses due to higher leverage as compared to the current down-cycle. In terms of P/BV and market cap to sales (Mcap/sales), it is still trading at 118% and 442% premium, respectively, to its last down-cycle valuations. In the last down-cycle, the company was trading at the lowest multiple of 0.46x its book value and 0.17x Mcap to sales. As the company had reported losses in the last down cycle, on a P/E base it cannot be compared to its last down-cycle valuation. Thus, we have used normalised P/E (we have calculated EPS for each year by multiplying book value with RoNW) for determining if the company is available at trough valuations. In terms of normalised P/E, ICL is trading at 96% premium to the last down-cycle. In terms of relative valuations, ICL is available at a premium to efficient North Indian players. We expect an oversupply situation in South India, similar to North India (witnessed in H1FY09). Thus, we believe, going ahead, the valuation gap between North Indian and South Indian players will get reduced.
Exhibit 14: Movement of EV/tonne with change in RoCE & RoNW (%)
30
50
70
90
110
130
150
170
FY94
FY95
FY96
FY97
FY98
FY99
FY00
FY01
FY02
FY03
FY04
FY05
FY06
FY07
FY08
FY09
E
FY10
E
FY11
E
EV/to
nne
(in U
SD)
-50
-40
-30
-20
-10
0
10
20
30
40
%
EV/Tonne(USD) ROE(%) ROCE (%)
Source: Company, ICICIdirect.com Research

51
Exhibit 6: Valuations Ratios
Source: ICICIdirect Research
Exhibit 15: Valuation ratios
0.0
0.5
1.0
1.5
2.0
2.5
3.0
3.5
4.0
4.5FY
94
FY95
FY96
FY97
FY98
FY99
FY00
FY01
FY02
FY03
FY04
FY05
FY06
FY07
FY09
E
FY10
E
FY11
E
P/BV
& M
cap/
Sale
s
0
10
20
30
40
50
60
70
P/CE
PS &
EV/
EBIT
A
Price to Book Value ( P/BV) Market Cap/Sales Price/Cash EPS (P/CEPS) EV/EBIDTA
Source: Company, ICICIdirect.com Research
Exhibit 16: Normalised P/E
50.4
28.4
9.8
28.8
28.612.1
9.5
8.618.8
8.5
5.6
19.6
51.5
49.3
70.8
13.2
12.6
11.04.0
16.0
28.0
40.0
52.0
64.0
76.0
FY94
FY96
FY98
FY00
FY02
FY04
FY06
FY08
FY10
E
Nor
mal
ized
P/E
Source: Company, ICICIdirect.com Research

52
Profit and Loss Account
Rs Crore Year Ending March 31 FY07 FY08 FY09E FY10E FY11E Net Sales 2255.3 3047.1 3392.9 3700.2 3998.4 % Growth 35.1 11.3 9.1 8.1 Total Expenditure 1521.0 1967.7 2363.1 2669.9 2991.8 EBITDA 734.3 1079.4 1029.8 1030.3 1006.6 Other income 10.1 41.0 45.9 46.3 53.7 Depreciation 102.6 127.9 201.8 221.1 233.2 Interest Expenses 149.8 109.9 106.8 67.7 51.9 Extra ordinary items 0.0 38.0 64.5 0.0 0.0 PBT 492.0 844.6 702.6 787.8 775.2 Taxation 13.1 207.1 237.1 252.1 248.1 RPAT 478.8 637.5 465.5 535.7 527.1 EO (net of tax) 0.0 23.8 58.3 0.0 0.0 Adj. PAT 478.8 661.3 523.8 535.7 527.1 EBITDA margin (%) 32.6 35.4 30.4 27.8 25.2 NPM (%) 21.2 21.7 15.4 14.5 13.2 Shares O/S (crore) 26.0 28.2 28.2 28.2 28.2 EPS (Rs) 18.4 23.5 18.6 19.0 18.7
Balance Sheet
Rs Crore Year Ending March 31 FY07 FY08 FY09E FY10E FY11E Sources of funds Equity Share Capital 260.4 281.9 281.9 281.9 281.9 Revaluation Reserves 782.0 724.3 724.3 724.3 724.3 Free Reserves 1166.2 2314.9 2687.3 3115.9 3537.6 Secured Loans 1166.0 971.0 672.8 551.6 430.3 Unsecured Loans 892.8 840.5 898.8 898.8 898.8 Deferred Tax Liability 60.3 225.7 225.7 225.7 225.7 Total Liabilities 4327.6 5358.3 5490.8 5798.1 6098.6 Application of Funds Net Block 2795.8 3464.5 3812.6 3991.5 3958.3 Capital WIP 142.8 574.9 140.0 70.0 80.0 Investments 55.1 129.3 129.3 129.3 129.3 Cash 230.2 425.6 663.9 902.7 1258.4 Sundry Debtors 260.2 311.1 346.4 377.7 408.2 Inventories 248.5 350.6 418.3 456.2 492.9 Loans & Advances 978.6 1062.1 1062.1 1062.1 1062.1 Current Assets 1717.5 2149.4 2490.6 2798.7 3221.6 Less: Current Liabilities & Provisions 434.0 983.5 1095.1 1194.3 1290.6 Net Current Assets 1283.5 1165.9 1395.5 1604.4 1931.0 Miscellaneous Expenditure 33.1 23.8 13.4 2.9 0.0 Deferred Tax Asset 17.3 0.0 0.0 0.0 0.0 Total Asset 4327.6 5358.3 5490.8 5798.1 6098.6

53
Cash Flow Statement Rs Crore Year Ending March 31 FY07 FY08 FY09E FY10E FY11E Profit Before Tax 492.0 892.8 767.1 787.8 775.2 Depreciation 102.6 127.9 201.8 221.1 233.2 Others 86.0 -39.6 -225.0 -214.7 -241.4 Cash flow from Operations before WC Change 680.6 981.1 744.0 794.2 767.1 Changes In Working Capital -37.5 35.7 8.6 29.9 29.0 Cash flow from operations 643.1 1016.9 752.6 824.2 796.1 Capex -139.2 -918.2 -115.1 -330.0 -210.0 Inc/Dec in Investment 0.2 -74.2 0.0 0.0 0.0 Others -100.6 -24.9 40.6 40.7 48.1 Cash Flow from Investing activities -239.6 -1017.3 -74.5 -289.3 -161.9 Inc/Dec in Loan Funds -58.4 -191.7 -239.9 -121.2 -121.2 Inc/Dec in capital 125.2 583.3 0.0 0.0 0.0 Others -289.3 -195.8 -199.9 -174.8 -157.3 Cash flow from Financing -222.4 195.9 -439.8 -278.5 Net Cash Inflow / Outflow 181.1 195.5 238.3 238.8 355.7 Taken over on Amalgamation 5.5 0.0 0.0 0.0 0.0 Op Bal Cash & Cash equivalents 43.6 230.2 425.6 663.9 902.7 Closing Cash/ Cash Equivalent 230.2 425.6 663.9 902.7 1258.4
Ratios Year Ending March 31 FY07 FY08 FY09E FY10E FY11E EPS 18.4 23.5 18.6 19.0 18.7 Cash EPS 22.3 26.8 25.7 26.8 27.0 EBIDTA margin (%) 32.6 35.4 30.4 27.8 25.2 NPM (%) 21.2 21.7 15.4 14.5 13.2 Net Debt Equity 1.3 0.5 0.3 0.2 0.0 RoNW (%) 37.4 32.9 18.8 16.8 14.6 RoCE (%) 20.2 24.3 18.6 17.4 15.8 Valuation Ratios P/E (x) 6.6 5.2 6.5 6.4 6.5 P/BV (x) 2.2 1.3 1.1 1.0 0.9 EV/EBIDTA (x) 6.6 4.2 3.9 3.6 3.2 EV/tonne in US$ 111.6 105.7 86.8 59.4 47.0 Turnover ratios Asset Turnover 0.7 0.7 0.7 0.8 0.8 Inventory turnover ratio 40.2 42.0 45.0 45.0 45.0 Debtors turnover ratio 42.1 37.3 37.3 37.3 37.3

54
Analysts’ Name
Ravi Sodah [email protected] Vijay Goel [email protected]
Sales & EPS trend
0
500
1,000
1,500
2,000
FY07 FY08 FY09E FY10E FY11E
Rs C
rore
024681012
Rs
Net Sales EPS (Rs)
Stock Metrics
Bloomberg Code OPI INReuters Code ORPP.BOFace value (Rs) 1Promoters Holding 37Market Cap (Rs cr) 59052 week H/L 51.95/16.9Sensex 10947Average volumes 102540 Comparative return metrics
Stock return (%) 3M 6M 12MOrient Paper 56 46 -33Jk Cem 36 -18 -62Shree Cem 69 74 -24Dalmia Cem 28 1 -65 Price Trend
5
25
45
65
Apr-
Jun-
Aug-
Oct-
Dec-
Feb-
Apr-
Close Price Target Price
April 20, 2009 | Cement
Initiating Coverage
Orient Paper & Industries (ORIPAP)
Regional champ… We are initiating coverage on Orient Paper & Industries Ltd (OPIL) with an OUTPERFORMER rating and a price target of Rs 36.2. We believe that OPIL being a cost-efficient cement player will be able to leverage its cost structure by cutting prices and pushing volumes in a down cycle. New CPPs coming on stream in Q1FY10 will enable OPIL to maintain its cost leadership while new cement capacity additions will drive the sales volume. Despite having highest return ratios margins and low earning risk, OPIL is trading at a steep discount to it peers and its replacement cost.
Growing three time faster than the industry On account of capacity addition in the recent past, OPIL has been growing three times faster than the industry. In FY09 it had reported dispatch growth of 20.2% as compared to 7.9% of the industry. With another 1.6 million tonnes (MT) of capacity, which is expected to come onstream by the end of Q1FY10, OPIL will continue to grow faster than the industry.
Highest margins in the industry Despite having lower realisation as compared to its peers, OPIL’s cement division has highest EBIT per tonne (Rs 1118 per tonne) and EBIT margin (37.9%) in the industry due to low cost of production.
Diversifying into related businesses On account of lower fixed cost, higher efficiency and diversified revenue stream, OPIL’s earnings are least sensitive to price decline. A 1% decline in cement prices reduces the company’s EPS by 3.3% as compared to 4.2%-8.1% for its peers.
Valuations At the CMP of Rs 28 per share, the stock is trading at 2.5x and 3.0x its FY09E & FY10E earnings, respectively. It is trading at an EV/tonne of $33.5 & $17.7 its FY09E and FY10E capacities, respectively. We are initiating coverage on OPIL with OUTPERFORMER rating and a price target of Rs 36.2 per share.
Current Price Rs 28
Target Price Rs 36.2
Potential upside 28%
Time Frame 12-15 months
OUTPERFORMER
Exhibit 1: Key Financials FY07 FY08 FY09E FY10E FY11E
Net Profit 138.5 209.8 215.9 179.2 160.4EPS 9.3 10.9 11.2 9.3 8.3% Growth 16.7 2.9 -17.0 -10.5P/E (x) 3.0 2.6 2.5 3.0 3.4P/BV (x) 2.5 1.2 0.8 0.7 0.6EV/EBITDA (x) 3.0 1.9 1.9 1.7 1.4OPM% 22.9 26.9 25.3 19.8 15.5NPM % 12.6 16.2 14.9 10.7 8.6RoNW % 153.2 66.9 38.5 24.3 18.2RoCE % 49.2 59.7 39.7 27.0 23.1 Source: Company,ICICIdirect.com Research
ICICIdirect.com| Equity Research

55
Company Background
OPIL is the flagship company of the CK Birla Group with business segments viz. cement, paper and electric fans. OPIL has a cement capacity of 3.4 MT. The company has a clinker unit of 2.1 MT & grinding unit of 2.4 MT at Devapur in the Chandrapur cement cluster of Andhra Pradesh. It also has a split grinding unit of 1 MT at Jalgaon, Maharashtra. The locations of cement plants give access to key consumer markets in Maharashtra, Andhra Pradesh and Gujarat. Exhibit 2: Cement plant and markets
Source: Company, ICICIdirect.com Research
Exhibit 3: Cement volume break up (FY08)
37%
5%
57%
1%
Andhra Pradesh Gujarat Maharashtra Others
Source: Company, ICICIdirect.com Research
Share holding pattern (Q3FY09)
Shareholder % holdingPromoters 36.8Institutional investors 30.8Other investors 17.2General public 15.1 Promoter & Institutional holding trend (%)
35% 36% 37% 37%32% 31% 31% 31%
0%
20%
40%
Q4 Q1 Q2 Q3
Promoter Holding Institutional Holding

56
OPIL has two paper manufacturing plants at Amlai (Madhya Pradesh) and Brajrajnagar (Orissa). The operations at the Brajrajnagar plant, which has an installed capacity to produce 76,000 TPA of paper, have been suspended since 1999. The plant had made a loss of Rs 12.8 crore at the EBIT level in FY08. OPIL currently has around 850 acres of land in this unit along with fully developed townships, educational institutions and recreational centres. The Amlai plant has a capacity of 95,000 TPA (including 10,000 tonnes of tissue paper capacity). It produces writing, printing and tissue paper. The company sells paper under the brands ‘Orient’ and ‘Peacock’. OPIL’s fans division is located in Kolkata and Faridabad (in Haryana) with an installed capacity of 3.5 million units per annum. The division sells ceiling fans, portable fans and exhaust fans under the brand name of ‘Orient Fan’ and ‘Orient PSPO’ and also exports to countries in the Middle East and the US. OPIL also has 15.5 lakh shares of Century Textiles and 9 lakh shares of Hyderabad Industries. The market value of the company’s investment is approximately Rs 50.8 crore. Exhibit 4: Revenue break-up (FY08)
21%
57%
22%
0%
Paper Cement Fans Knowhow & Services
Source: Company, ICICIdirect.com Research

57
Exhibit 5: EBIT break up (FY08)
7%
87%
6% 0%
Paper Cement Fans Knowhow & Services
Source: Company, ICICIdirect.com Research
Exhibit 6: EBIT margins (%) (FY08)
9.8%
42.6%
7.7%
43.4%
0%
10%
20%
30%
40%
50%
Paper Cement Fans Knowhow &Services
Source: Company, ICICIdirect.com Research
Exhibit 7: Segmental RoCE & RoNW (%)(FY08)
19.5%
99.3%
29.7%
6.8%
0%
20%
40%
60%
80%
100%
Paper & Board Cement Electric Fans Know-How &Service Fees
Source: Company, ICICIdirect.com Research

58
Investment Rationale
Has been growing three time faster than industry OPIL has increased its cement capacity from 2.4 MT at the end of FY07 to 2.7 MT at the end of H1FY08. On account of capacity additions, OPIL has been growing three times faster than the industry. In FY09 OPIL has reported dispatch growth of 20.2% as compared to 7.9% for the industry. With another 1.6 MT of capacity expected to come on stream by the end of Q1FY10, OPIL is expected to continue to grow faster than the industry. Apart from this, OPIL has added capacity at a cost of only Rs 1538 per tonne. On account of its higher EBITDA per tonne and low capex, the payback period for OPIL will be less than one and a half year.
Exhibit 8: Capex Schedule
FY07 Sep’07 FY08 Q1FY10
Cement capacity (in million tonne) 2.4 2.7 3.4 5Cement Capex (Rs Cr) 170 230
Devapur CPP (MW) 50
CPP capex(Rs in Cr) 200
Fan mn units 2.58 2.58 2.58 3.58CFL facility (Rs in Cr) 40
Tissue paper-Amlai- (tpa) 10000 10000 10000 25000
Photocopying & office paper category Amlai (tpa) 85,000 85,000 85,000 85,000
Paper Capex(Rs in Cr) 100
Total Capex (Rs Crore) 210 530 Source: Company, ICICIdirect.com Research
Exhibit 9: YTD (Apr-Mar’09) Cement dispatches (%)
-3.0% 7.0% 17.0% 27.0%
Shree Cem
Orient
Madras Cem
JP
Industry
Ultratech
Grasim
ACC
Century Textiles
Ambuja Cem
Dalmia
India Cem
JK Cem
Birla Corp
Source: CMA, ICICIdirect.com Research

59
Highest margins in the industry
Despite having lower realisations as compared to its peers, OPIL has the highest margins and EBIT per tonne in the industry due to the low cost of production.
The company has a low cost of production on account of the following reasons:
The limestone mines are located at distances of 2 km from its plant. It has a stripping ratio (quantity of waste rock required to be removed for mining 1 tonne of limestone) of 0.09:1, one of the lowest in the region. Its landed cost of limestone is only Rs 92 per tonne as compared to 150 per tonne for its peers
It is 100% dependent on domestic coal, prices of which are less volatile as compared to imported coal and petcoke. It sources the coal requirement from Singareni Collieries, which is merely 68 km from its Devapur plant. Thus, it has power & fuel cost of Rs 514 per tonne as compared to about Rs 700 per tonne for its peers
Has an average lead distance to market of 350 km as compared to 600 km for its peers in FY08.
It sources fly ash from NTPC Ramagundam plant and Bhusawal thermal power station, which are 40 km and 20 km from its Devapur and Jalgaon plant, respectively. Hence, due to its location advantage, its landed cost of fly ash is Rs 202 per tonne as compared to more than Rs 300 per tonne for its peers.
Has an average raw material cost per tonne of Rs 198 per tonne in FY08 as compared to Rs 255 per tonne for its peers as it procures all major raw material within a radius of 68 km.
OPIL is in the process of setting up a 50 MW CPP, which is expected to come on stream by the end of Q1FY10. The new CPP will meet 100% power requirement of the cement division and OPIL will be able to save Rs 27 crore in FY10. Thus, we believe that, going ahead, OPIL will be able to maintain its cost leadership.
Exhibit 10: Peer comparisons (as per December ’08 quarter)
Company Realisations Cost (Including Depreciation) EBIT
EBIT Margins (%)
ACC 3455 2843 612 17.7Ambuja Cement 3606 2890 716 19.9India Cement 3765 3121 644 17.1Ultra Tech 3568 2801 767 21.5Shree cement 3049 2282 767 25.2*JK cement 3654 3084 570 15.6Dalmia Cement 3891 2887 1004 25.8Orient Paper 2952 1834 1118 37.9 Source: Company, ICICIdirect.com Research

60
Has a presence in high cement growth states of AP OPIL has a plant in the high growth Andhra Pradesh market. Cement consumption in Andhra Pradesh has reported YTD growth of 22% as compared to the all-India growth of 8%. It may also be noted that the OPIL plant is located in northern Andhra Pradesh, which will enable it to divert the surplus volume to the eastern and central region in the event of a surplus.
Exhibit 11: YTD (Apr’08-Feb’09) Cement consumption growth
Andhra Pradesh 22Maharashtra 6Gujarat 4All India 8
States Growth(%)
Source: CMA, ICICIdirect.com Research
Earnings of OPIL less sensitive to cement price declines
On account of lower fixed cost, higher efficiency and a diversified revenue stream, OPIL’s earnings are least sensitive to price declines.
Exhibit 12: Earnings sensitivity to cement price decline
Company % Decline in earnings Orient Paper 3.3Ambuja Cement 4.2Shree Cement 4.4UltraTech 4.4India Cement 4.7ACC 7.6JK Cement 8.1 Source: CMA, ICICIdirect.com Research
Presence in high cement consuming states There are only six states in India, which have monthly cement consumption of more than 1 MT per month. Orient has a plant in two of these states (Andhra Pradesh and Maharashtra). Andhra Pradesh and Maharashtra account for 22% of the total cement demand in India. Gujarat accounts for another 7%. Thus, OPIL caters to more than one-fourth of the all-India cement market.
Exhibit 13: Monthly cement consumption of major states
StateMonthly Cement
ConsumptionMaharashtra 1.8Andhra Pradesh 1.5Uttar Pradesh 1.4Tamil Nadu 1.3Karnataka 1.0Gujarat 1.0India 14.4 Source: CMA, ICICIdirect.com Research

61
Financials
Going ahead, we expect OPIL’s revenues to grow at 12.9% CAGR (FY08-FY11) to Rs 1862.9 crore in FY11 from Rs 1295.8 crore in FY08 on account of growth in cement volumes. The EBITDA margin is expected to dip by 1140 bps due to the decline in cement realisation. Thus, the net profit of OPIL is expected to decline at 8.6% CAGR (FY08-FY11) to Rs 160.4 crore in FY11 from Rs 209.9 crore in FY08. Exhibit 14: Revenues to grow at a CAGR of 12.9%
0
500
1000
1500
2000
FY07 FY08 FY09 FY10 FY11
Rs C
rore
0%
30%
60%
90%
120%
150%
Grow
th(%
)Revenue Growth(%)
Source: Company, ICICIdirect.com Research
Exhibit 15: Net profit to decline at a CAGR 8.6%
0
50
100
150
200
250
FY07 FY08 FY09E FY10E FY11E-200%
0%
200%
400%
600%
Net Profit Growth(%)
Source: Company, ICICIdirect.com Research

62
Exhibit 16: Margins to remain under pressure
0%
10%
20%
30%
FY07 FY08 FY09E FY10E FY11E
EBIDTA Margin(%) Net Profit Margin (%)
Source: Company, ICICIdirect.com Research
Exhibit 17: Return ratios to decline
0%
50%
100%
150%
200%
FY07 FY08 FY09E FY10E FY11E
RoCE(%) RoNW(%)
Source: Company, ICICIdirect.com Research

63
Risks & concerns
Total 8.4 MT of cement capacity to be added in AP Out of 62 MT capacity additions that are scheduled to come on stream by FY10, around 47% of the capacity will come on stream in the south and close to 24% capacity is likely to be added in Andhra Pradesh.
Usage of domestic coal to restrict cost savings Due to usage of domestic coal, the company is unlikely to benefit from the sharp decline in imported coal prices and sea freight.
May write off Rs 10 crore receivables from its JV OPIL’s joint venture company at Kenya, Panafrican Paper Mills (E.A) Ltd, Kenya (Panpaper), in which OPIL holds 29.34% equity and has a technical and management agreement, have stopped due to poor financial conditions. In view of these developments, the company has decided to write off a sum of Rs 48.4 crore receivable from Panpaper against management fees, interest and loan (arising out of conversion of fees) due from Panpaper, subject to approval of the Reserve Bank of India. However, the company had already made provisions aggregating to Rs 38.3 crore up to the end of Q3FY09. Thus, we expect the company to take a hit of the remaining Rs 10 crore in Q4FY09.

64
Valuations
Despite having the highest return ratios & margins, low earning risk, OPIL is trading at a steep discount to it peers and replacement cost. At the CMP of Rs 28 per share, the stock is trading at 2.5x and 3.0x its FY09E and FY10E earnings, respectively. It is trading at an EV/tonne of $33.5 and $17.7 its FY09E and FY10E capacities, respectively. We are initiating coverage on the stock with an OUTPERFORMER rating and a price target of Rs 36.2 per share. We have valued the company on an SOTP basis. We have valued the company’s paper division at EV/EBIDTA multiple of 2.3X, 15% discount to the industry despite the fact that OPIL’s operating paper plants (Amlai Plant) margins are better than the industry. We have valued the fan division of the company at an EV/EBIDTA multiple of 0.8x (i.e. 40% discount to Bajaj Electrical) We have valued the cement division at EV per tonne of $42 of its present capacity. It is the lowest valuation assigned to a loss making cement company in M&A deal over last decade. Also, in the first half of FY09, when the northern region had a surplus, north-based cement players were trading at an EV per tonne of $42. We have valued the equity quoted investments of the company at 40% discount to the CMP and non-quoted investments at book value. Exhibit 18: Target price on SOTP basis Paper EBIDTA 26.7EV/EBITDA(X) 2.3Paper EV 61.3Fan EBIDTA 25.8EV/EBITDA(X) 1.7Fan EV 43.5Value of non cement business 104.8Cement Capacity(MT) 3.4EV/tonne(US$) 42.0USD 51.5EV/tonne(Rs) 2163.0Cement EV 735.4Total EV 840.2Less: Debt 415.3Add:Cash 244.7Add: Investment 28.2Mcap 697.8Nos Shares 19.3
Target Price 36.2CMP 28.0Upside(%) 29%
Source: Company, ICICIdirect.com Research

65
Exhibit 19: Trailing multiple & margins of paper and fan companies
EV/EBITDAEBIT Margin(%)
Company TTM Q3FY08AP Paper 1.4 6.4Ballarpur Inds 4.9 15.9JK Paper 1.2 9.0Mysore Paper 5.0 -0.8Pudumjee Pulp 2.5 4.4Seshasayee Paper 1.9 5.8Shreyans Inds. 1.9 12.3Star Paper Mills 3.7 8.5T N Newsprint 2.1 18.0West Coast Paper 2.4 17.4Average 2.7 9.7Orient Paper (Paper Division) 7.1%Orient Paper (Amlai Paper Plant) 10.0%Bajaj Electrical 2.6 9.5Orient Paper (Fan Division) 4.4%
Source: Company, ICICIdirect.com Research
Exhibit 20: Valuations band
0123456789
10111213
FY94
FY95
FY96
FY97
FY98
FY99
FY00
FY01
FY02
FY03
FY04
FY05
FY06
FY07
FY08
FY09
E
FY10
E
FY11
E
P/BV
& M
Cap/
Sales
0
10
20
30
40
50
60
70
80
90
EV/E
BIDT
A &
P/CE
PS
P/BV(RHS) MCap/Sales(RHS) P/CEPS(LHS) EV/EBIDTA(LHS)
Source: Company, ICICIdirect.com Research

66
Profit and Loss Account Rs Crore Year Ending March 31 FY07 FY08 FY09E FY10E FY11E Net Sales 1,102.2 1,295.8 1,450.6 1,675.4 1,862.9 % Growth 17.6 11.9 15.5 11.2 Total Expenditure 850.0 947.0 1,084.1 1,342.9 1,573.7 EBITDA 252.2 348.8 366.4 332.5 289.1 Other income 14.4 17.5 10.8 11.4 11.9 Depreciation 26.2 27.1 34.0 52.9 53.6 Interest 32.7 17.5 28.2 27.4 8.1 Extra ordinary items -11.7 -8.1 10.0 0.0 0.0 PBT 196.0 313.5 325.1 263.6 239.3 Taxation 65.3 109.0 102.4 84.3 79.0 Reported PAT 130.7 204.5 222.7 179.2 160.4 Extra ordinary items(net of tax) -7.8 -5.3 6.8 0.0 0.0 Adjusted PAT 138.5 209.8 215.9 179.2 160.4 EBITDA margin (%) 22.9 26.9 25.3 19.8 15.5 NPM (%) 12.6 16.2 14.9 10.7 8.6 Shares O/S (crore) 14.84 19.27 19.27 19.27 19.27 EPS (Rs) 9.3 10.9 11.2 9.3 8.3
Balance Sheet Rs Crore Year Ending March 31 FY07 FY08 FY09E FY10E FY11ESources of funds Equity Share Capital 14.8 19.3 19.3 19.3 19.3Preference Capital 20.0 7.0 0.0 0.0 0.0Reserves & Surplus 139.2 467.8 653.5 805.7 939.0Secured Loans 256.2 43.8 293.8 193.8 93.8Unsecured Loans 67.9 121.5 121.5 71.5 21.5Deferred Tax Liability 37.7 45.5 45.5 45.5 45.5Total Liability 535.7 704.9 1,133.5 1,135.7 1,119.0Application of Funds Net Block 285.7 334.0 320.0 817.1 783.5Capital WIP 65.6 199.7 477.0 0.0 0.0Investments 13.4 9.2 9.2 9.2 9.2Cash 17.1 26.0 244.7 222.1 235.0Sundry Debtors 123.6 135.8 152.1 175.6 195.3Inventories 92.6 99.0 110.9 128.1 142.4Loans & Advances 92.3 80.5 80.9 81.3 81.7Other current Assets 16.0 0.7 0.7 0.7 0.8Current Assets 341.6 342.1 589.2 607.8 655.2Less: Current Liabilities & Provisions 182.7 185.5 267.3 303.8 334.3Net Current Assets 158.8 156.6 321.9 304.0 320.9Miscellaneous Expenditure 12.1 5.4 5.4 5.4 5.4Total Asset 535.7 704.9 1,133.5 1,135.7 1,119.0

67
Cash Flow Statement Rs Crore Year Ending March 31 FY07 FY08 FY09E FY10E FY11E Profit Before Tax 196.0 313.5 305.1 263.6 239.3 Depreciation 26.2 27.1 34.0 52.9 53.6 Changes In working Capital (14.8) (37.9) 53.8 (4.7) (4.0) Others 24.5 (29.2) (74.7) (56.9) (70.9) Cash Flow from Operating activities 232.0 273.6 318.2 254.9 218.1 Inc/Dec in Investment 0.0 0.0 0.0 0.0 0.0 Capex (65.6) (204.6) (297.3) (73.0) (20.0) others 2.6 4.2 1.2 2.5 5.4 Cash Flow from Investing activities (62.9) (200.5) (296.1) (70.5) (14.6) Inc/Dec in capital 0.0 144.8 (7.0) 0.0 0.0 Inc/Dec in Loan Funds (115.3) (163.6) 250.0 (150.0) (150.0) Others (54.1) (45.4) (56.4) (57.0) (40.5) Cash Flow from Financing activities (169.4) (64.2) 186.6 (207.0) (190.5) Net Inc/dec in cash (0.4) 8.9 208.7 (22.6) 12.9 Opening Balance of Cash 17.5 17.1 26.0 244.7 222.1 Closing Balance of Cash 17.1 26.0 234.7 222.1 235.0
Ratios Year Ending March 31 FY07 FY08 FY09E FY10E FY11E EPS 9.3 10.9 11.4 9.3 8.3 Cash EPS 10.6 12.0 12.8 12.0 11.1 EBITDA margin (%) 22.9 26.9 25.3 19.8 15.5 NPM(%) 12.6 16.2 14.9 10.7 8.6 Debt/Equity 1.9 0.3 0.3 0.1 -0.1 RoCE (%) 49.2 59.7 39.7 27.0 23.1 RoNW (%) 153.2 66.9 38.5 24.3 18.2 Valuation Ratios P/E (x) 3.0 2.6 2.5 3.0 3.4 P/BV (x) 2.5 1.2 0.8 0.7 0.6 EV/EBITDA (x) 3.0 1.9 1.9 1.7 1.4 EV/Tonne (US$) 59.5 33.6 36.8 17.7 10.3 Turnover ratios Fixed asset turnover ratio 2.3 2.3 1.7 1.6 1.7 inventory turnover ratio 30.7 27.9 27.9 27.9 27.9 Debtors turnover ratio 40.9 38.3 38.3 38.3 38.3
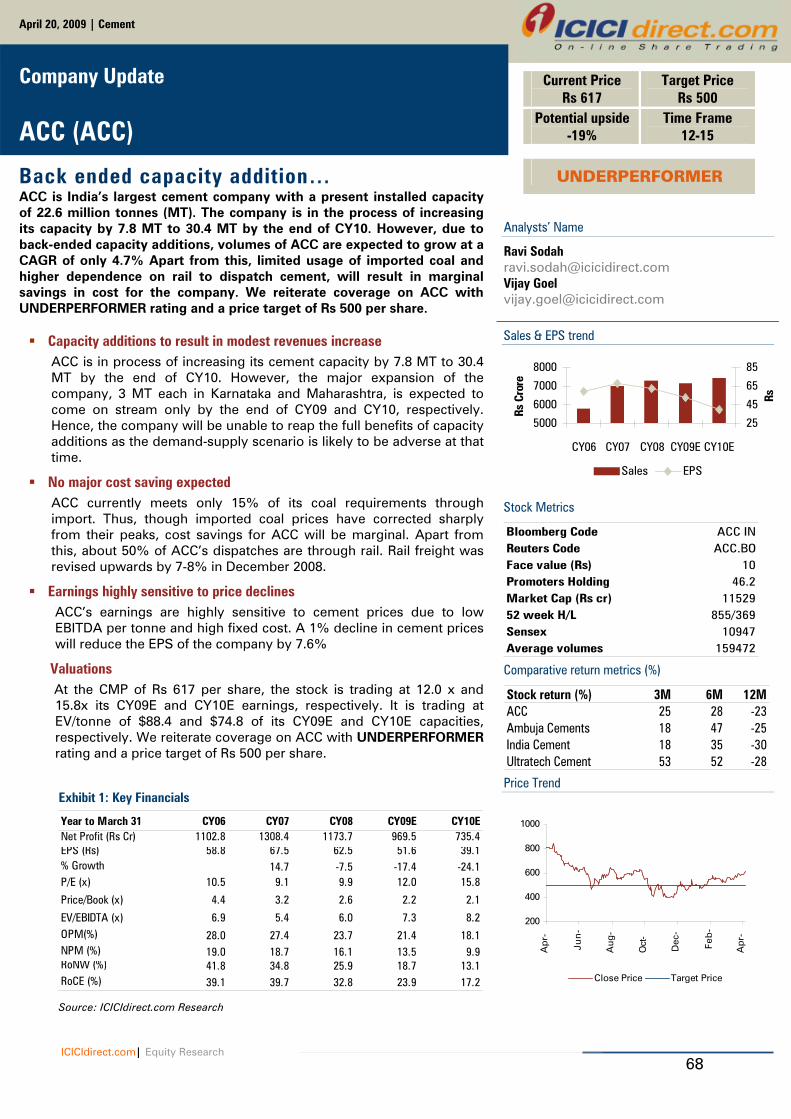
68
Analysts’ Name
Ravi Sodah [email protected] Vijay Goel [email protected]
Sales & EPS trend
5000
6000
7000
8000
CY06 CY07 CY08 CY09E CY10E
Rs C
rore
25
45
65
85
Rs
Sales EPS
Stock Metrics
Bloomberg Code ACC INReuters Code ACC.BOFace value (Rs) 10Promoters Holding 46.2Market Cap (Rs cr) 1152952 week H/L 855/369Sensex 10947Average volumes 159472 Comparative return metrics (%)
Stock return (%) 3M 6M 12MACC 25 28 -23Ambuja Cements 18 47 -25India Cement 18 35 -30Ultratech Cement 53 52 -28 Price Trend
200
400
600
800
1000
Ap
r-
Jun
-
Aug
-
Oct
-
Dec
-
Feb
-
Ap
r-
Close Price Target Price
April 20, 2009 | Cement
Company Update
ACC (ACC)
Back ended capacity addition… ACC is India’s largest cement company with a present installed capacity of 22.6 million tonnes (MT). The company is in the process of increasing its capacity by 7.8 MT to 30.4 MT by the end of CY10. However, due to back-ended capacity additions, volumes of ACC are expected to grow at a CAGR of only 4.7% Apart from this, limited usage of imported coal and higher dependence on rail to dispatch cement, will result in marginal savings in cost for the company. We reiterate coverage on ACC with UNDERPERFORMER rating and a price target of Rs 500 per share.
Capacity additions to result in modest revenues increase ACC is in process of increasing its cement capacity by 7.8 MT to 30.4 MT by the end of CY10. However, the major expansion of the company, 3 MT each in Karnataka and Maharashtra, is expected to come on stream only by the end of CY09 and CY10, respectively. Hence, the company will be unable to reap the full benefits of capacity additions as the demand-supply scenario is likely to be adverse at that time.
No major cost saving expected ACC currently meets only 15% of its coal requirements through import. Thus, though imported coal prices have corrected sharply from their peaks, cost savings for ACC will be marginal. Apart from this, about 50% of ACC’s dispatches are through rail. Rail freight was revised upwards by 7-8% in December 2008.
Earnings highly sensitive to price declines ACC’s earnings are highly sensitive to cement prices due to low EBITDA per tonne and high fixed cost. A 1% decline in cement prices will reduce the EPS of the company by 7.6%
Valuations At the CMP of Rs 617 per share, the stock is trading at 12.0 x and
15.8x its CY09E and CY10E earnings, respectively. It is trading at EV/tonne of $88.4 and $74.8 of its CY09E and CY10E capacities, respectively. We reiterate coverage on ACC with UNDERPERFORMER rating and a price target of Rs 500 per share.
Current Price Rs 617
Target Price Rs 500
Potential upside -19%
Time Frame 12-15
UNDERPERFORMER
Exhibit 1: Key Financials
Year to March 31 CY06 CY07 CY08 CY09E CY10ENet Profit (Rs Cr) 1102.8 1308.4 1173.7 969.5 735.4EPS (Rs) 58.8 67.5 62.5 51.6 39.1% Growth 14.7 -7.5 -17.4 -24.1P/E (x) 10.5 9.1 9.9 12.0 15.8
Price/Book (x) 4.4 3.2 2.6 2.2 2.1
EV/EBIDTA (x) 6.9 5.4 6.0 7.3 8.2OPM(%) 28.0 27.4 23.7 21.4 18.1NPM (%) 19.0 18.7 16.1 13.5 9.9RoNW (%) 41.8 34.8 25.9 18.7 13.1RoCE (%) 39.1 39.7 32.8 23.9 17.2
Source: ICICIdirect.com Research
ICICIdirect.com| Equity Research

69
Company Background
Established in 1936 by the merger of 10 cement companies, ACC is one of India’s oldest cement manufacturing companies. The company’s current capacity stands at 22.6 MT. Swiss cement major Holcim has taken over the control and management of ACC through Ambuja Cement India Pvt Ltd (ACIL). With its stakes in Ambuja Cement and ACC, Holcim controls about 44.6 MT of cement capacity (approximately 20% of the India’s capacity). Exhibit 2: Capacity Share (as on Mar’09)
11%
9%
80%
ACC Ambuja Cement Others
Source: Company, ICICIdirect.com Research
ACC, through its 14 plants, is the only cement company with a presence in all major regions. Out of its total capacity of 22.6 MT, 26% is in the North, 28% in South, 22% in East, 4% in West and 20% in Central India. Exhibit 3: Region wise capacity (as on Mar’09)
22%
4%
20%28%
26%
East West Central South North
Source: Company, ICICIdirect.com Research
Since the entry of Holcim, ACC has decided to focus on its core cement business and has divested most of its non-core businesses including its refractory and asbestos business. The company has also transferred its RMC business to a wholly-owned subsidiary, ACC Concrete Ltd, with effect from January 1, 2008.
Share holding pattern (Q4CY08)
Shareholder % holdingPromoters 46.2Institutional investors 11.4Other investors 26.7General public 15.7
Promoter & Institutional holding trend (%)
43% 43% 46% 46%
32%30%38% 33%
0%
20%
40%
60%
Q1 Q2 Q3 Q4
Promoter Holding Institutional Holding

70
Exhibit 4: Historical valuations
0
1
2
3
4
5
6
7
FY95
FY96
FY97
FY98
FY99
FY00
FY01
FY02
FY03
FY04
FY05
FY06
CY06
CY07
CY08
CY09
E
CY10
E
P/BV
&M
CAP/
Sale
s
0
10
20
30
40
50
EV/E
BID
TA &
P/C
EPS
MCap/Sales(LHS) P/BV(LHS) P/CEPS(RHS) EV/EBIDTA(RHS)
Source: Company, ICICIdirect.com Research
Exhibit 5: EV/tonne, RoNW and RoCE
0
50
100
150
200
250
FY95
FY96
FY97
FY98
FY99
FY00
FY01
FY02
FY03
FY04
FY05
CY05
CY06
CY07
CY08
CY09
E
CY10
E
EV/to
nne
(in U
S$)
-10
0
10
20
30
40
50
%
EV/Tonne in USD (LHS) RoNW (RHS) RoCE (RHS)
Source: Company, ICICIdirect.com Research

71
Profit and Loss Account Rs Crore Year Ending December 31 CY06 CY07 CY08 CY09E CY10E Net Sales 5803.5 6990.7 7308.6 7165.0 7435.1 % Growth 20.5 4.5 -2.0 3.8 Total Expenditure 4180.3 5072.1 5575.4 5634.1 6091.8 EBIDTA 1623.2 1918.6 1733.2 1530.9 1343.3 Other income 164.8 177.5 288.7 234.1 185.0 Depreciation 254.3 305.1 294.2 335.3 435.2 Interest Expenses 75.2 73.9 40.0 44.7 42.4 EO 160.9 213.1 48.9 0.0 0.0 PBT 1619.5 1930.3 1736.6 1385.0 1050.6 Taxation 387.7 491.7 523.8 415.5 315.2 RPAT 1231.8 1438.6 1212.8 969.5 735.4 EO (net of tax) 128.7 170.5 39.1 0.0 0.0 Adj. PAT 1103.1 1268.1 1173.7 969.5 735.4 Profit/(loss) after tax from Discontinued Operation 0.3 -40.3 0.0 0.0 0.0 Adj. PAT with discontinuing Operations 1102.8 1308.4 1173.7 969.5 735.4 EBIDTA margin (%) 28.0 27.4 23.7 21.4 18.1 NPM (%) 19.0 18.1 16.1 13.5 9.9 Shares O/S (crore) 18.78 18.78 18.79 18.79 18.79 EPS (Rs) 58.8 67.5 62.5 51.6 39.1
Balance Sheet Rs Crore Year Ending December 31 CY06 CY07 CY08 CY09E CY10E Equity Share Capital 187.8 187.9 187.9 187.9 187.9 Reserves & Surplus 2955.2 3964.8 4739.9 5277.2 5580.5 Secured Loans 721.0 266.0 450.0 400.0 350.0 Unsecured Loans 50.2 40.4 32.0 26.0 20.0 Deferred Tax Liability(Net) 320.7 331.5 335.8 335.8 335.8 Total Liabilities 4234.8 4790.6 5745.5 6226.9 6474.1 Application of Funds Net Block 2922.5 3314.7 3469.7 5306.4 6421.1 Capital WIP 558.4 649.2 1602.9 1015.0 0.0 Investments 503.5 844.8 679.1 679.1 679.1 Net Current Assets 249.4 -18.1 -6.1 -773.6 -626.1 Miscellaneous Expenditure 0.9 0.0 0.0 0.0 0.0 Total Asset 4234.8 4790.6 5745.6 6226.9 6474.2

72
Cash Flow Statement Rs Crore Year Ending December 31 CY06 CY07 CY08 CY09E CY10E Profit Before Tax 1458.6 1717.2 1687.8 1385.0 1050.6 Depreciation 254.3 305.1 294.2 335.3 435.2 Others -322.5 -185.2 -349.4 -462.0 -307.7 Cash flow from Operations before WC Change 1390.4 1837.1 1632.5 1258.3 1178.1 Changes In Working Capital 31.3 185.7 75.8 16.2 -123.5 Cash flow from operations 1421.7 2022.8 1708.3 1274.5 1054.6 Inc/Dec in Investment -158.6 -292.1 301.7 0.0 0.0 Capex -369.3 -621.3 -1476.2 -1584.1 -535.0 Others 45.2 89.1 4.0 91.2 35.0 Cash from Financing Activities -482.7 -824.3 -1170.4 -1492.9 -500.0 Inc/Dec in Loan Funds -185.5 -458.8 175.6 -56.0 -56.0 Others -257.0 -620.4 -474.1 -476.9 -474.6 Inc/Dec in capital 19.0 4.0 1.4 0.0 0.0 Cash flow from Financing -423.4 -1075.2 -297.1 -532.9 -530.6 Net Cash Inflow / Outflow 515.6 123.3 240.8 -751.3 24.0 Taken over on Amalgamation 1.8 0.0 0.0 0.0 0.0 Op Bal Cash & Cash equivalents 102.8 620.2 743.5 984.2 233.0 Closing Cash/ Cash Equivalent 620.2 743.5 984.2 233.0 257.0
Ratios Year Ending March 31 CY06 CY07 CY08 CY09E CY10E EPS 58.8 67.5 62.5 51.6 39.1 Cash EPS 79.3 92.8 80.2 69.4 62.3 EBIDTA margin (%) 28.0 27.4 23.7 21.4 18.1 NPM (%) 19.0 18.7 16.1 13.5 9.9 RoNW (%) 41.8 34.8 25.9 18.7 13.1 RoCE (%) 39.1 39.7 32.8 23.9 17.2 Net Debt Equity (X) 0.0 -0.1 -0.1 0.0 0.0 Valuation Ratios P/E (x) 10.5 9.1 9.9 12.0 15.8 P/BV (x) 4.4 3.2 2.6 2.2 2.1 EV/EBIDTA (x) 6.9 5.4 6.0 7.3 8.2 EV/tonne in US$ 116.1 94.8 94.9 88.4 74.8 Asset Turnover 1.5 1.5 1.3 1.2 1.1 Inventory turnover ratio 54.5 52.6 51.9 51.9 51.9 Debtors turnover ratio 13.5 15.1 15.5 15.5 15.5

73
Analysts’ Name
Ravi Sodah [email protected] Vijay Goel [email protected]
Sales & EPS trend
500
1000
1500
2000
FY07
FY08
FY09
E
FY10
E
FY11
E
Rs C
rore
15
25
35
45
R
Sales EPS
Stock Metrics
Bloomberg Code JKCE INReuters Code JKCE.BOFace value (Rs) 10Promoters Holding 62Market Cap (Rs cr) 39252 week H/L 165/34.8Sensex 10947Average volumes 50253 Comparative return metrics
Stock return(%) 3M 6M 12MJk Cem 36 -18 -62Shree Cem 69 74 -24Orient Paper 56 46 -33Dalmia Cem 28 1 -65
Price Trend
20
60
100
140
180
Apr
-
Jun
-
Aug
-
Oct
-
Dec
-
Feb
-
Apr
-
Close Price Target Price
April 20, 2009 | Cement
Company Update
JK Cement (JKCEME)
Macro conditions turn favourable… With softening interest rates, a sharp decline in petcoke prices and firming up of cement prices due to strong demand in key markets, we believe the near term macroeconomic conditions of JK Cement have improved significantly. In terms of P/E and P/BV multiples, it is among the cheapest stocks in our universe. With a new greenfield plant expected to come onstream in Q1FY10, the EV based multiples of the company are also expected to reduce significantly. We reiterate coverage on JK Cement with PERFORMER rating with a price target of Rs 62 per share.
To increase cement capacity by 68% JK Cement’s 3 million tonne (MT) greenfield plant at Karnataka is likely to be commissioned in Q1FY10. The new plant will increase grey cement capacity by 68% (from 4.4 MT at present to 7.4 MT at the end of Q1FY10). On account of capacity additions, JK Cement’s grey cement volumes are expected to grow at a CAGR of 19.6% between FY08 and FY10.
Enters high priced, high growth market of South India As the company is entering the high priced and high growth markets of South India, its blended realisations are expected to decline only by 3.6% in FY10.
Decline in pet coke prices to cushion margins JK Cement meets 90% of its fuel requirement through petcoke and 10% from linkage coal and the open market. With a sharp correction in crude oil prices, petcoke prices have also declined by 49% from their peak. Thus, we expect, JK Cement’s power & fuel cost per tonne to decline sharply to Rs 775 per in Q4FY09 from Rs 972 per tonne in Q3FY09.
Valuations At the CMP of Rs 54 per share, the stock is trading at 2.9x and 2.4x its FY09E and FY10E earnings, respectively. It is trading at EV/tonne of $67.6 and $36.1 of its FY09E and FY10E capacities, respectively. We reiterate coverage on JK Cement with a PERFORMER rating with a price target of Rs 62 per share.
Current Price Rs 54
Target Price Rs 62
Potential upside 15%
Time Frame 12-15 months
PERFORMER
Exhibit 1: Key Financials Year Ending March 31 FY07 FY08 FY09E FY10E FY11ENet Profit (Rs Cr) 178.9 265.2 129.0 156.0 154.0EPS (Rs) 25.6 37.9 18.4 22.3 22.0% Growth 48.2 -51.4 20.9 -1.3P/E (x) 2.1 1.4 2.9 2.4 2.5P/BV (x) 0.7 0.5 0.4 0.4 0.3EV/EBIDTA (x) 2.3 1.8 5.4 3.3 2.9OPM (%) 26.7 28.5 19.9 21.7 19.0NPM (%) 14.5 18.2 8.7 8.1 7.4RoNW (%) 41.1 41.5 15.7 16.3 13.9RoCE (%) 23.3 26.0 12.5 13.5 12.3 Source: ICICIdirect.com Research
ICICIdirect.com| Equity Research

74
Company Background
JK Cement, a part of the JK group, was incorporated by acquiring the assets of the cement division of JK Synthetics in November 2004. Currently, JK Cement has grey cement capacity of 4.4 MT and white cement capacity of 0.4 MT. The company is the second largest manufacturer of white cement in India. JK Cement sells cement under brand names Sarvashaktiman (43 grade OPC), JK Super (Blended cement) JK White Cement and JK Wall Putty. Exhibit 2: Cement volume break up (FY08)
21%
33%
27%
19%
Rajasthan Haryana Delhi & U.P Punjab, M.P & Guj.
Source: Company, ICICIdirect.com Research
The JK Cement Works (Fujairah, UAE) FZC, a subsidiary of JK Cement, has signed an MoU with the Municipality of Fujairah. The company has been allotted limestone mines with reserves estimated at 150 MT.
Shareholding pattern (Q3FY09)
Shareholder % holdingPromoters 61.9Institutional investors 21.8Other investors 5.3General public 11.1 Promoter & Institutional holding trend (%)
62% 62% 62% 62%
23% 22%23%23%
0%
20%
40%
60%
Q4 Q1 Q2 Q3
Promoter Holding Institutional Holding

75
Exhibit 3: Historical valuations
0
5
10
15
20
25
FY06
FY07
FY08
FY09
E
FY10
E
FY11
E
P/CE
PS &
EVE
BID
TA
0.0
1.0
2.0
3.0
4.0
P/BV
& M
Cap/
Sale
s
P/CEPS(LHS) EV/EBIDTA(LHS) MCap/Sales(RHS) P/BV(RHS)
Source: Company, ICICIdirect.com Research
Exhibit 4: EV/tonne, RoNW and RoCE
20
40
60
80
100
FY06
FY07
FY08
FY09
E
FY10
E
FY11
E
EV/to
nne
(US
5
15
25
35
45
%EV/Tonne(US $) (LHS) RoNW(%) (RHS) ROCE (%) (RHS)
Source: Company, ICICIdirect.com Research

76
Profit and Loss Account Rs Crore Year Ending March 31 FY07 FY08 FY09E FY10E FY11E Net Sales 1233.3 1458.3 1475.6 1917.1 2070.6 % Growth 18.2 1.2 29.9 8.0 Total Expenditure 903.8 1042.6 1181.4 1501.1 1677.4 EBIDTA 329.5 415.7 294.2 416.0 393.2 Other income 10.7 7.9 3.9 4.1 4.3 Depreciation 33.2 41.1 51.8 92.8 93.4 Interest 34.7 35.9 47.5 97.9 70.8 Extra ordinary items 0.0 0.0 0.0 0.0 0.0 PBT 272.3 346.6 198.8 229.4 233.4 Taxation 93.4 81.4 69.8 73.4 79.3 RPAT 178.9 265.2 129.0 156.0 154.0 EO (net of tax) 0.0 0.0 0.0 0.0 0.0 Adj. PAT 178.9 265.2 129.0 156.0 154.0 EBIDTA margin (%) 26.7 28.5 19.9 21.7 19.0 NPM (%) 14.5 18.2 8.7 8.1 7.4 Shares O/S (crore) 7.0 7.0 7.0 7.0 7.0 EPS (Rs) 25.6 37.9 18.4 22.3 22.0
Balance Sheet Rs Crore Year Ending March 31 FY07 FY08 FY09E FY10E FY11E Sources of funds Equity Share Capital 69.9 69.9 69.9 69.9 69.9 Free Reserves 445.4 692.3 814.3 963.3 1110.3 Revaluation Reserves 304.7 291.2 291.2 291.2 291.2 Secured Loans 429.9 382.8 1086.4 1015.0 868.6 Unsecured Loans 127.8 127.7 127.7 127.7 127.7 Deferred Tax Liability 43.2 51.0 51.0 51.0 51.0 Total Liabilities 1421.0 1614.9 2440.5 2518.1 2518.7 Application of Funds Net Block 922.4 1089.1 2174.9 2092.0 2018.6 Capital WIP 164.4 133.8 0.0 0.0 0.0 Investments 15.9 9.5 9.5 9.5 9.5 Cash 192.5 145.4 16.9 154.3 229.1 Sundry Debtors 62.2 57.3 57.9 115.5 124.8 Inventories 110.0 114.5 115.9 150.6 162.6 Loans & Advances 166.4 353.8 357.4 360.9 364.6 Current Assets 531.1 671.1 548.1 781.3 881.0 Less: Current Liabilities & Provisions 214.6 290.6 294.0 366.8 392.4 Net Current Assets 316.5 380.4 254.2 414.6 488.6 Miscellaneous Expenditure 1.7 2.0 2.0 2.0 2.0 Total Asset 1421.0 1614.9 2440.5 2518.1 2518.7

77
Cash Flow Statement Rs Crore Year Ending March 31 FY07 FY08 FY09E FY10E FY11E Profit Before Tax 272.0 346.6 198.8 229.4 233.4 Depreciation 33.2 41.1 51.8 92.8 93.4 Others -27.8 -64.8 -29.3 17.5 -15.6 Cash flow from Operations before WC Change 277.3 322.9 221.3 339.7 311.2 Changes In Working Capital -63.6 57.6 -2.2 -23.1 0.8 Cash flow from operations 213.8 380.5 219.1 316.6 312.0 Capex -179.3 -191.1 -991.2 -10.0 -20.0 Inc/Dec in Investment -15.4 7.0 0.0 0.0 0.0 Others 13.7 12.5 0.0 0.0 0.0 Cash Flow from Investing activities -181.0 -171.7 -991.2 -10.0 -20.0 Inc/Dec in Loan Funds -26.0 -44.5 703.6 -71.4 -146.4 Inc/Dec in capital Others -99.7 -211.4 -60.1 -97.9 -70.8 Cash flow from Financing -125.7 -255.9 643.5 -169.3 -217.2 Net Cash Inflow / Outflow -92.9 -47.1 -128.5 137.4 74.8 Op Bal Cash & Cash equivalents 285.4 192.5 145.4 17.0 154.3 Closing Cash/ Cash Equivalent 192.5 145.4 16.9 154.3 229.1
Ratios Year Ending March 31 FY07 FY08 FY09E FY10E FY11E EPS 25.6 37.9 18.4 22.3 22.0 Cash EPS 30.3 43.8 25.9 35.6 35.4 EBIDTA margin (%) 26.7 28.5 19.9 21.7 19.0 NPM (%) 14.5 18.2 8.7 8.1 7.4 Net Debt Equity 0.7 0.5 1.4 1.0 0.7 RoNW (%) 41.1 41.5 15.7 16.3 13.9 RoCE (%) 23.3 26.0 12.5 13.5 12.3 Valuation Ratios P/E (x) 2.1 1.4 2.9 2.4 2.5 P/BV (x) 0.7 0.5 0.4 0.4 0.3 EV/EBIDTA (x) 2.3 1.8 5.4 3.3 2.9 EV/tonne in US$ 34.8 34.8 67.6 36.1 30.3 Turnover ratios Asset Turnover 0.9 1.0 0.7 0.8 0.8 Inventory turnover ratio 32.6 28.7 28.7 28.7 28.7 Debtors turnover ratio 18.4 14.3 14.3 22.0 22.0

78
ICICIdirect.com | Equity Research
Exhibit 1: Key financials FY07 FY08 FY09E FY10E FY11E
Net Profit 157.1 287.9 530.3 458.5 415.9
EPS 45.1 82.6 152.2 131.6 119.4% Growth 0.0 83.2 84.2 -13.6 -9.3P/E (x) 17.7 9.6 5.2 6.0 6.7P/BV (x) 5.5 4.1 2.5 1.8 1.5EV/EBITDA (x) 5.6 3.5 2.9 2.4 1.9OPM% 43.1 41.7 33.8 34.3 29.3NPM % 11.5 13.9 19.9 16.5 13.3RoNW % 34.6 51.1 59.1 34.7 24.4RoCE % 12.4 26.6 35.5 26.9 22.4 Source: Company, ICICIdirect.com Research
Analysts’ Name
Ravi Sodah [email protected] Vijay Goel [email protected]
Sales & EPS trend
0
1,000
2,000
3,000
4,000
FY07 FY08 FY09E FY10E FY11E
Rs C
rore
0
50
100
150
200
Rs
Net Sales EPS (Rs) Stock Metrics
Bloomberg Code SRCM INReuters Code SHCM.BOFace value (Rs) 10Promoters Holding 64%Market Cap (Rs cr) 289052 week H/L 1139 / 330Sensex 10947Average volumes 10413 Comparative return metrics
Stock returns (%) 3M 6M 12MShree cement 69 74 -24ACC 25 28 -23Ambuja Cement 18 47 -25India Cement 18 35 -30
Price Trend
250
450
650
850
1050
Ap
r-08
Jun-
08
Aug
-08
Oct
-08
Dec
-08
Feb
-09
Ap
r-09
Close Price Target Price
April 20, 2009 | Cement
Company Update
Shree Cement (SHRCEM)
Empowered by cash… Shree Cement is one of the largest cement manufacturers in North India. The company started its operations in 1985 with a total cement production capacity of 0.6 MTPA, which has now increased to 10.1 MTPA. The outlook for the cement sector is negative. However, taking into account the fact that Shree Cement is the most efficient regional player and is available at a steep discount to its peers, we reiterate coverage on the stock with an PERFORMER rating.
Timely capacity addition Shree Cement has increased its sales volumes at 30% CAGR (FY07-FY09) to 8.1 MTPA in FY09. During the same period, cement prices in the northern region have increased by a CAGR of 11%. We believe that as Shree Cement has the world’s lowest gestations period for adding cement capacity, it will be able to capitalise the most when the demand-supply conditions turn favourable for the cement industry.
High cash per share reduces downside risk At the end of Q3FY09, Shree Cement had cash and liquid investments of Rs 1000 crore, which works out to Rs 287 per share (36% of CMP). We believe that high cash per share will result into low downside risks for investors in the current scenario.
Correction in petcoke prices to reduce fuel cost Shree Cement meets 100% of its fuel requirement through pet coke. Pet coke prices have corrected by 49% from their peaks. Due to the decline in pet coke prices we expect Shree Cement’s power and fuel costs to reduce from Rs 705 per tonne in Q3FY09 to Rs 600 per tonne in Q4FY09.
Valuations
At the CMP of Rs 796 per share, Shree Cement is trading at 5.2x and 6.0x its FY09E and FY10E earnings, respectively. On an EV/tonne basis, it is trading at $60/tonne and $45/tonne of its CY09E and CY10E capacities, respectively. Thus, we reiterate coverage on Shree Cement with a PERFORMER rating on the stock and target price of Rs 900 per share.
Current Price Rs 796
Target Price Rs 900
Potential upside 14%
Time Frame 12-15 months
PERFORMER

79
Company Background
Shree Cement, promoted by the Bangur Group, is India’s leading cement manufacturer in North India and largest manufacturer in Rajasthan. The company has two manufacturing units located at Beawar, Rajasthan, four manufacturing units at Ras and two grinding units at Khushkhera, Rajasthan with a total capacity of 9.1 MT, which contributes to around 20% of the total north region capacity. Shree Cement sells its products across Rajasthan, Uttar Pradesh, Uttarakhand, Delhi, Haryana and Punjab. The cement is marketed under the three brand names, Shree Ultra Jung Rodhak Cement, Bangur Cement and Tuff Cemento. Exhibit 2: P/CEPS, EV/EBITDA, MCap/sales, P/BV
Source: Company, ICICIdirect.com Research
Shareholding pattern (Q3FY09)
Shareholder % holdingPromoters 63.78Institutional investors 14.17Other investors 11.00General public 11.05
Promoter & Institutional holding trend (%)
64% 64% 64% 64%
14% 15% 15% 15%
0%
20%
40%60%
80%
100%
Q4 Q1 Q2 Q3
Promoter Holding Institutional Holding

80
Profit and Loss Account Rs Crore
Year Ending March 31 FY07 FY08 FY09E FY10E FY11E Net Sales 1,368.0 2,065.9 2,666.6 2,773.7 3,127.8 % Growth 51.0 29.1 4.0 12.8 Total Expenditure 778.3 1203.5 1764.5 1823.0 2212.1 EBITDA 589.7 862.4 902.1 950.7 915.7 Other income 21.3 73.3 78.9 142.7 104.0 Depreciation 433.1 478.8 206.0 420.3 403.1 Interest 10.4 49.7 67.1 61.8 46.9 Extra ordinary items -21.2 38.9 22.6 0.0 0.0 PBT 188.8 368.3 685.3 611.3 569.7 Taxation 11.8 107.9 171.9 152.8 153.8 Reported PAT 177.0 260.4 513.4 458.5 415.9 Extra ordinary items(net of tax) -19.9 27.5 16.9 0.0 0.0 Adjusted PAT 157.1 287.9 530.3 458.5 415.9 EBITDA margin (%) 43.1 41.7 33.8 34.3 29.3 NPM % 11.5 13.9 19.9 16.5 13.3 Shares O/S (crore) 3.5 3.5 3.5 3.5 3.5 EPS (Rs) 45.1 82.6 152.2 131.6 119.4
Balance Sheet Rs Crore Year Ending March 31 FY07 FY08 FY09E FY10E FY11E Sources of funds Equity Share Capital 34.8 34.8 34.8 34.8 34.8 Reserves & Surplus 468.9 638.0 1,087.1 1,488.1 1,852.0 Secured Loans 848.3 1,167.1 1,078.1 958.1 808.1 Unsecured Loans 83.1 163.6 163.6 163.6 163.6 Deferred Tax Liability 0.0 0.0 0.0 0.0 0.0 Total Liability 1,435.1 2,003.5 2,363.6 2,644.7 2,858.5 Application of Funds Net Block 548.2 760.0 604.0 633.7 330.6 Capital WIP 343.8 18.0 0.0 0.0 0.0 Investments 50.0 591.0 591.0 991.0 991.0 Cash 353.3 467.4 765.4 589.2 1,053.0 Sundry Debtors 26.3 49.4 63.8 66.3 74.8 Inventories 156.1 176.6 391.2 407.0 458.9 Loans & Advances 238.4 402.6 519.7 540.6 609.6 Current Liabilities & Provisions 284.6 479.9 590.0 601.5 677.8 Miscellaneous Expenditure 3.7 18.5 18.5 18.5 18.5 Total Asset 1,435.1 2,003.5 2,363.6 2,644.7 2,858.5

81
Cash Flow Statement Rs Crore Year Ending March 31 FY07 FY08 FY09E FY10E FY11E Profit Before Tax 188.8 368.3 685.3 611.3 569.7 Depreciation 433.1 478.8 206.0 420.3 403.1 Changes In working Capital (38.0) (53.9) (236.0) (27.7) (53.1) Others (123.3) (130.6) (183.7) (233.7) (210.9) Cash Flow from Operating activities 460.5 662.6 471.6 770.2 708.8 Inc/Dec in Investment (49.3) (536.9) 0.0 (400.0) 0.0 Capex (597.4) (423.4) (32.0) (450.0) (100.0) others 4.2 60.1 78.9 142.7 104.0 Cash Flow from Investing activities (642.5) (900.2) 46.8 (707.3) 4.0 Inc/Dec in capital 0.0 0.0 0.0 0.0 0.0 Inc/Dec in Loan Funds 558.6 399.3 (89.0) (120.0) (150.0) Others (42.4) (47.6) (131.4) (119.2) (99.0) Cash Flow from Financing activities 516.3 351.7 (220.4) (239.2) (249.0) Net Inc/dec in cash 334.2 114.1 298.0 (176.3) 463.8 Opening Balance of Cash 19.1 353.3 467.4 765.4 589.2 Closing Balance of Cash 353.3 467.4 765.4 589.2 1,053.0
Ratios Year Ending March 31 FY07 FY08 FY09E FY10E FY11E EPS 45.1 82.6 152.2 131.6 119.4 Cash EPS 175.1 212.2 206.5 252.2 235.1 OPM (%) 43.1 41.7 33.8 34.3 29.3 NPM (%) 11.5 13.9 19.9 16.5 13.3 Debt/Equity 1.16 0.40 -0.10 -0.30 -0.57 RoCE (%) 12.4 26.6 35.5 26.9 22.4 RoNW (%) 34.6 51.1 59.1 34.7 24.4 Valuation Ratios P/E (x) 17.7 9.6 5.2 6.0 6.7 P/BV (x) 5.5 4.1 2.5 1.8 1.5 EV/EBITDA (x) 5.6 3.5 2.9 2.4 1.9 EV/Tonne (US$) 151.3 69.0 60.2 45.0 33.1 Turnover ratios Fixed asset turnover ratio 0.8 0.9 1.2 1.0 1.1 inventory turnover ratio 5.0 6.8 4.5 4.5 4.8 Debtors turnover ratio 29.6 24.4 27.7 27.5 29.6

82
Analysts’ Name
Ravi Sodah [email protected] Vijay Goel [email protected]
Sales & EPS trend
25003500450055006500
FY07
FY08
FY09
E
FY10
E
FY11
E
Rs C
rore
60
80
100
Rs
Sales EPS Stock Metrics
Bloomberg Code UTCEM INReuters Code ULTC.BOFace value (Rs) 10Promoters Holding 54.8Market Cap (Rs cr) 696752 week H/L 843/250Sensex 10947Average volumes 25450 Comparative return metrics
Stock return (%) 3M 6M 12M
Ultra Tech 53 52 -28
ACC 25 28 -23
Ambuja Cements 18 47 -25
India Cement 18 35 -30 Price Trend
200
300
400
500
600
700
800
Ap
r-
Jun
-
Aug
-
Oct
-
Dec
-
Feb
-
Ap
r-
Close Price Target Price
April 20, 2009 | Cement
Company Update
UltraTech Cement (ULTCEM)
Powered by savings… Historically, UltraTech Cement has been trading at about 30% discount to ACC, despite having better return ratios, better margins and lesser earnings sensitivity to cement price decline. This was primarily on account of its dependence on expensive sources of power. With CPPs (Captive Power Plants) coming onstream, we believe, the valuation gap between ACC and UltraTech to reduce. Also UltraTech, on account of its high dependence on imported coal than ACC, will have a higher savings in fuel cost. We reiterate coverage on Ultra tech with PERFORMER rating with price target of Rs 630.
Power & fuel cost to decline per tonne Imported coal constitutes 43% of UltraTech’s fuel requirement. The prices of imported coal have decline by 67.8% from its peak. Apart from this, UltraTech to set up CPPs with total capacity of 225 MW, which are likely to be commissioned in phased manner by H1FY10E. Upon commissioning, 80% pf the power requirement of the company will be met by captive power. In FY08, UltraTech met only 23% of its electricity requirement by coal based CPP, 64% was from grid, 12% through DG set and 1% Waste Heat Recovery Plant. We expect CPPs to generate saving of Rs 167 crore in FY10.
Increase in capacity to drive volumes UltraTech has started commercial production of clinker from Andhra Pradesh Cement Works (APCW) and cement from the grinding unit at Ginigera in Karnataka. Upon commissioning of grinding capacity at APCW, the total capacity of the company will increase from 19.5 million tonnes to 23.1 million tonnes by the end of FY09. On account of capacity additions, we expect company’s volume to grow at 7.5% CAGR (FY08-FY11).
Valuations At the CMP of Rs 546 per share, the stock is trading at 7.2x and 8.0x its FY09E and FY10E earnings, respectively. It is trading at an EV/Tonne of $76.1 and $61.7 of its FY09E and FY10E capacities, respectively. We reiterate coverage on UltraTech with PERFORMER rating with price target of Rs 630 per share.
Current Price Rs 546
Target Price Rs 630
Potential upside 15.4%
Time Frame 12-15 months
PERFORMER
Exhibit 1: Key Financials
Year Ending March 31 FY07 FY08 FY09E FY10E FY11ENet Profit (Rs Cr) 782.3 1007.6 950.3 860.0 782.7EPS (Rs) 62.8 80.4 75.9 68.7 62.5% Growth 28.0 -5.7 -9.5 -9.0P/E (x) 8.7 6.8 7.2 8.0 8.7P/BV (x) 3.9 2.5 1.9 1.6 1.4EV/EBIDTA (x) 5.5 4.8 5.1 4.6 4.4OPM Margin(%) 28.9 31.2 26.2 25.6 22.3NPM (%) 15.9 18.3 14.8 13.6 11.8RoNW (%) 55.8 45.2 30.4 21.8 16.7RoCE (%) 43.0 40.7 28.9 23.4 19.9 Source: ICICIdirect.com Research
ICICIdirect.com| Equity Research

83
Company Background
UltraTech Cement, erstwhile L&T Cement, is India’s second largest cement company after ACC with a capacity of 19.5 million tonnes. Grasim had acquired 50.2% stake in UltraTech Cement in FY04, making it part of the AV Birla Group. The company was barely breaking even the time Grasim acquired it from L&T, however, over the last 4years, it has been transformed to one of the better managed companies in the industry. Ultra Tech is also the largest exporter of cement clinker from India. It has plant in three out of five regions in India Exhibit 2: Capacity Breakup (as on Mar’09)
56%
21%
23%
West East South
Source: Company, ICICIdirect.com Research
Share holding pattern (Q3FY09)
Shareholder % holdingPromoters 54.8Institutional investors 11.4Other investors 18.2General public 15.7 Promoter & Institutional holding trend (%)
54% 54% 54% 55%
15%15%16%11%
0%
20%
40%
60%
Q4 Q1 Q2 Q3
Promoter Holding Institutional Holding

84
Exhibit 3: Historical Valuations
0.5
1.5
2.5
3.5
4.5
5.5
6.5
7.5
8.5
FY05 FY06 FY07 FY08 FY09 FY10 FY11
P/BV
& M
cap/
Sale
s
0
4
8
12
16
20
EV/E
BID
TA &
P/C
EPS
P/BV (LHS) MCap/Sales(LHS) P/CEPS(RHS) EV/EBIDTA(RHS)
Source: Company, ICICIdirect.com Research
Exhibit 4: EV/tonne, RoNW and RoCE
0
20
40
60
80
100
120
140
FY05 FY06 FY07 FY08 FY09 FY10 FY11
EV/to
nne
0
10
20
30
40
50
60
%
EV/Tonne(US$) (LHS)) RoNW(%) (RHS) ROCE (%) (RHS)
Source: Company, ICICIdirect.com Research

85
Profit and Loss Account Rs Crore Year Ending March 31 FY07 FY08 FY09E FY10E FY11E Net Sales 4910.5 5509.2 6413.9 6308.9 6638.5 % Growth 12.2 16.4 -1.6 5.2 Total Expenditure 3492.7 3789.2 4732.1 4690.8 5156.8 EBIDTA 1417.8 1720.1 1681.8 1618.1 1481.7 Other income 61.5 99.9 95.2 96.2 97.1 Depreciation 226.3 237.2 317.4 372.3 399.3 Interest Expenses 86.8 75.7 130.5 122.2 61.4 Extra ordinary items 0.0 0.0 0.0 0.0 0.0 PBT 1166.2 1507.0 1329.1 1219.8 1118.1 Taxation 383.9 499.4 378.8 359.8 335.4 RPAT 782.3 1007.6 950.3 860.0 782.7 EO (net of tax) 0.0 0.0 0.0 0.0 0.0 Adj. PAT 782.3 1007.6 950.3 860.0 782.7 EBIDTA margin (%) 28.9 31.2 26.2 25.6 22.3 NPM (%) 15.9 18.3 14.8 13.6 11.8 Shares O/S (crore) 12.4 12.5 12.5 12.5 12.5 EPS (Rs) 62.8 80.4 75.9 68.7 62.5
Balance Sheet Rs Crore Year Ending March 31 FY07 FY08 FY09E FY10E FY11E Sources of funds Equity Share Capital 124.5 125.3 125.3 125.3 125.3 Reserves 1639.3 2571.7 3437.5 4205.9 4896.9 Secured Loans 1151.3 982.7 1357.7 882.7 632.7 Unsecured Loans 427.4 757.8 757.8 557.8 457.8 Deferred Tax Liability 560.3 542.4 542.4 542.4 542.4 Total Liabilities 3902.7 4979.8 6220.6 6314.0 6655.1 Application of Funds Net Block 2517.3 2500.5 4933.1 5660.8 5361.5 Capital WIP 697.0 2283.2 990.0 0.0 0.0 Investments 483.5 170.9 170.9 170.9 170.9 Cash 89.6 100.7 253.1 600.0 1257.3 Sundry Debtors 183.5 216.6 252.2 248.1 261.0 Inventories 433.6 609.8 709.9 698.3 734.7 Loans & Advances 253.5 376.8 380.6 384.4 388.2 Current Assets 960.2 1303.9 1595.8 1930.7 2641.3 Less: Current Liabilities & Provisions 755.2 1278.6 1469.1 1448.5 1518.7 Net Current Assets 205.0 25.3 126.6 482.3 1122.6 Miscellaneous Expenditure 0.0 0.0 0.0 0.0 0.0 Total Asset 3902.7 4979.8 6220.6 6314.0 6655.1

86
Cash Flow Statement Rs Crore Year Ending March 31 FY07 FY08 FY09E FY10E FY11E Profit Before Tax 1166.2 1507.0 1329.1 1219.8 1118.1 Depreciation 226.3 237.2 317.4 372.3 399.3 Others -356.1 -439.3 -248.3 -237.7 -274.0 Cash flow from Operations before WC Change 1036.4 1304.9 1398.2 1354.4 1243.4 Changes In Working Capital 76.7 70.3 51.1 -8.8 17.0 Cash flow from operations 1113.1 1375.3 1449.3 1345.7 1260.4 Capex -764.9 -1798.9 -1456.9 -110.0 -100.0 Inc/Dec in Investment -311.0 312.3 0.0 0.0 0.0 Others 30.4 44.8 0.0 0.0 0.0 Cash Flow from Investing activities -1045.5 -1441.8 -1456.9 -110.0 -100.0 Inc/Dec in Loan Funds 131.2 166.7 375.0 -675.0 -350.0 Inc/Dec in capital 0.0 0.0 0.0 0.0 0.0 Others -170.8 -89.0 -215.1 -213.8 -153.0 Cash flow from Financing -39.6 77.6 159.9 -888.8 -503.0 Net Cash Inflow / Outflow 28.0 11.1 152.4 346.9 657.3 Op Bal Cash & Cash equivalents 61.6 89.6 100.7 253.1 600.0 Closing Cash/ Cash Equivalent 89.6 100.7 253.1 600.0 1257.3
Ratios Year Ending March 31 FY07 FY08 FY09E FY10E FY11E EPS 62.8 80.4 75.9 68.7 62.5 Cash EPS 81.0 99.4 101.2 98.4 94.4 EBIDTA margin (%) 28.9 31.2 26.2 25.6 22.3 NPM (%) 15.9 18.3 14.8 13.6 11.8 Net Debt Equity 0.8 0.6 0.5 0.2 0.0 RoNW (%) 55.8 45.2 30.4 21.8 16.7 RoCE (%) 43.0 40.7 28.9 23.4 19.9 Valuation Ratios P/E (x) 8.7 6.8 7.2 8.0 8.7 P/BV (x) 3.9 2.5 1.9 1.6 1.4 EV/EBIDTA (x) 5.5 4.8 5.1 4.6 4.4 EV/tonne in US$ 94.6 94.1 76.1 61.7 53.4 Turnover ratios Asset Turnover 1.7 1.4 1.3 1.1 1.1 Inventory turnover ratio 32.2 40.4 40.4 40.4 40.4 Debtors turnover ratio 13.6 14.4 14.4 14.4 14.4

87
RATING RATIONALE ICICIdirect.com endeavours to provide objective opinions and recommendations. ICICIdirect.com assigns ratings to its stocks according to their notional target price vs current market price and then categorises them as Outperformer, Performer, Hold, and Underperformer. The performance horizon is 2 years unless specified and the notional target price is defined as the analysts' valuation for a stock. Outperformer: 20% or more; Performer: Between 10% and 20%; Hold: +10% return; UnderPerformer: -10% or more;
Pankaj Pandey Head – Research [email protected]
ICICIdirect.com Research Desk,
ICICI Securities Limited, Gr. Floor, Mafatlal House,
163, HT Parekh Marg, Backbay Reclamation
Churchgate, Mumbai – 400 020
ANALYST CERTIFICATION We /I, Ravi Sodah B.com, MBA (Finance) Vijay Goel B.E, MBA (Finance) research analysts, authors and the names subscribed to this report, hereby certify that all of the views expressed in this research report accurately reflect our personal views about any and all of the subject issuer(s) or securities. We also certify that no part of our compensation was, is, or will be directly or indirectly related to the specific recommendation(s) or view(s) in this report. Analysts aren't registered as research analysts by FINRA and might not be an associated person of the ICICI Securities Inc.
Disclosures: ICICI Securities Limited (ICICI Securities) and its affiliates are a full-service, integrated investment banking, investment management and brokerage and financing group. We along with affiliates are leading underwriter of securities and participate in virtually all securities trading markets in India. We and our affiliates have investment banking and other business relationship with a significant percentage of companies covered by our Investment Research Department. Our research professionals provide important input into our investment banking and other business selection processes. ICICI Securities generally prohibits its analysts, persons reporting to analysts and their dependent family members from maintaining a financial interest in the securities or derivatives of any companies that the analysts cover.
The information and opinions in this report have been prepared by ICICI Securities and are subject to change without any notice. The report and information contained herein is strictly confidential and meant solely for the selected recipient and may not be altered in any way, transmitted to, copied or distributed, in part or in whole, to any other person or to the media or reproduced in any form, without prior written consent of ICICI Securities. While we would endeavour to update the information herein on reasonable basis, ICICI Securities, its subsidiaries and associated companies, their directors and employees (“ICICI Securities and affiliates”) are under no obligation to update or keep the information current. Also, there may be regulatory, compliance or other reasons that may prevent ICICI Securities from doing so. Non-rated securities indicate that rating on a particular security has been suspended temporarily and such suspension is in compliance with applicable regulations and/or ICICI Securities policies, in circumstances where ICICI Securities is acting in an advisory capacity to this company, or in certain other circumstances.
This report is based on information obtained from public sources and sources believed to be reliable, but no independent verification has been made nor is its accuracy or completeness guaranteed. This report and information herein is solely for informational purpose and may not be used or considered as an offer document or solicitation of offer to buy or sell or subscribe for securities or other financial instruments. Though disseminated to all the customers simultaneously, not all customers may receive this report at the same time. ICICI Securities will not treat recipients as customers by virtue of their receiving this report. Nothing in this report constitutes investment, legal, accounting and tax advice or a representation that any investment or strategy is suitable or appropriate to your specific circumstances. The securities discussed and opinions expressed in this report may not be suitable for all investors, who must make their own investment decisions, based on their own investment objectives, financial positions and needs of specific recipient. This may not be taken in substitution for the exercise of independent judgement by any recipient. The recipient should independently evaluate the investment risks. The value and return of investment may vary because of changes in interest rates, foreign exchange rates or any other reason. ICICI Securities and affiliates accept no liabilities for any loss or damage of any kind arising out of the use of this report. Past performance is not necessarily a guide to future performance. Investors are advised to see Risk Disclosure Document to understand the risks associated before investing in the securities markets. Actual results may differ materially from those set forth in projections. Forward-looking statements are not predictions and may be subject to change without notice.
ICICI Securities and its affiliates might have managed or co-managed a public offering for the subject company in the preceding twelve months. ICICI Securities and affiliates might have received compensation from the companies mentioned in the report during the period preceding twelve months from the date of this report for services in respect of public offerings, corporate finance, investment banking or other advisory services in a merger or specific transaction. ICICI Securities and affiliates expect to receive compensation from the companies mentioned in the report within a period of three months following the date of publication of the research report for services in respect of public offerings, corporate finance, investment banking or other advisory services in a merger or specific transaction. It is confirmed that Ravi Sodah B.com, MBA (Finance) Vijay Goel B.E, MBA (Finance)research analysts and the authors of this report have not received any compensation from the companies mentioned in the report in the preceding twelve months. Our research professionals are paid in part based on the profitability of ICICI Securities, which include earnings from Investment Banking and other business.
ICICI Securities or its subsidiaries collectively do not own 1% or more of the equity securities of the Company mentioned in the report as of the last day of the month preceding the publication of the research report.
It is confirmed that Ravi Sodah B.com, MBA (Finance) Vijay Goel B.E, MBA (Finance)research analysts and the authors of this report or any of their family members does not serve as an officer, director or advisory board member of the companies mentioned in the report.
ICICI Securities may have issued other reports that are inconsistent with and reach different conclusion from the information presented in this report. ICICI Securities and affiliates may act upon or make use of information contained in the report prior to the publication thereof.
This report is not directed or intended for distribution to, or use by, any person or entity who is a citizen or resident of or located in any locality, state, country or other jurisdiction, where such distribution, publication, availability or use would be contrary to law, regulation or which would subject ICICI Securities and affiliates to any registration or licensing requirement within such jurisdiction. The securities described herein may or may not be eligible for sale in all jurisdictions or to certain category of investors. Persons in whose possession this document may come are required to inform themselves of and to observe such restriction.
This report has not been prepared by ICICI Securities, Inc. However, ICICI Securities, Inc. has reviewed the report and, in so far as it includes current or historical information, it is believed to be reliable, although its accuracy and completeness cannot be guaranteed.