National Stock Exchange Vs Bombay Stock Exchange A Comparative Analysis

INITIATING COVERAGE 29 AUG 2017
Bombay Stock Exchange BUY
HDFC securities Institutional Research is also available on Bloomberg HSLB <GO>& Thomson Reuters
Bombay renaissance* The Bombay Stock Exchange Ltd (BSE) is Asia’s oldest stock exchange (estd. 1875 and listed in Feb-17). Long term investors should take cognizance of its recent (if overdue) renaissance under a market savvy management, including its recent listing. With the latest technology platform (6 microsecond response time), BSE claims to be ten times faster than NSE (its much larger competitor). BSE has a diversified revenue stream, with only 51% of revenues (ex-CDSL) being market-linked (txn charges are ~33%). The rest is more secular (listing fees/data contribute 37/7%). BSE has 17% market share in equity cash and leads the currency derivatives space with ~38% market share. A clever rejig of transaction charges in equity cash (from ad valorem to per trade, the global norm) can help gain market share, esp in block/bulk deals. More evidence of its astute management is visible in the 36x jump in txn charges (0.275bps to 10.0bps) for exclusively listed stocks. In currency derivatives, it has stepped up rates (~6x so far), but is still at 77% discount to NSE. Non-linear benefits are likely. Further, BSE has invested in a mutual fund platform (StAR MF), an SME board and the newly-launched global exchange (India INX). A ~25% hike in equity listing fees for FY18, transaction charge hike across segments, monetisation of investments in new platforms and ADTV growth from increased market activity can combine to boost revenue and EBITDA at 11/33% CAGR over FY18-20E.
Valuation and outlook BSE has been constantly innovating and investing in
technology, thus will remain a valuable franchise. Wesee value based on (1) Embedded non-linearity, (2)Huge net cash (excluding SGF and earmarked funds)of Rs 30bn (~Rs 567/sh, ~58% of MCap), (3) Increasedcontribution from new growth engines (4)Reasonable dividend yield of ~3%.
At 23/22x FY18/19E earnings (a significant discountto MCX (39/32x FY18/19E EPS) and at par with globalaverages, BSE merits a BUY. Our SoTP for BSE factorsRs 430/sh from CDSL and assigns 25x to Sep-19earnings (ex-CDSL) and works out to Rs 1,200 (22%upside from CMP).
Financial Summary (Consolidated) YE March (Rs mn) FY16 FY17 FY18E FY19E FY20E Net Revenues 4,248 5,172 4,169 4,632 5,160 EBITDA 672 969 542 787 955 APAT 1,795 2,414 2,308 2,469 2,708Diluted EPS (Rs) 33.4 44.9 42.9 45.9 50.3 P/B (x) 2.1 2.0 1.7 1.7 1.7 P/E (x) 29.5 22.0 23.0 21.5 19.6 EV / EBITDA (x) 27.9 9.1 15.8 8.5 4.9 RoE (%) 7.1 9.1 7.6 8.0 8.6 Cash/mkt cap (%) 47.9 57.5 56.8 59.2 61.9 Source: Company, HDFC sec Inst Research
* The Renaissance was a period in European history. It began inthe 1300s, during the late Middle Ages. It ended during the 1500s, when the modern era began. Renaissance means ‘rebirth’ in French.
INDUSTRY EXCHANGES
CMP (as on 28 Aug 2017) Rs 985
Target Price Rs 1,200 Nifty 9,913 Sensex 31,751
KEY STOCK DATA Bloomberg BSE IN
No. of Shares (mn) 54 MCap (Rs bn) / ($ mn) 53/828 6m avg traded value (Rs mn) 198
STOCK PERFORMANCE (%) 52 Week high / low Rs 1,200/887
3M 6M 12M Absolute (%) (6.6) 4.0 - Relative (%) (9.8) (5.9) -
0.00 8.72
23.22 68.06
SHAREHOLDING PATTERN (%) Promoters
FIs & Local MFs
FPIs
Public & Others Source : BSE
Amit Chandra [email protected] +91-22-6171-7345
Apurva Prasad [email protected] +91-22-6171-7327

BSE : INITIATING COVERAGE
Page | 2
Table of Contents Macro tailwinds: India, the fastest growing economy ........................................................................................... 3
Indian exchanges catching up with global peers .................................................................................................... 4
Increasing free float to improve turnover velocity ........................................................................................... 5
BSE: Cash market share stable .............................................................................................................................. 7
Transaction revenue : Vital for an exchange .......................................................................................................... 9
Steep hike in pricing for exclusively- listed stocks ............................................................................................ 9
Change in pricing structure to gain market share .......................................................................................... 10
Equity derivatives: Missed opportunity ............................................................................................................... 11
Currency derivatives: BSE gaining market share .................................................................................................. 13
Price hike across segments.................................................................................................................................. 14
Steep hike in listing fees: Reduces price gap with NSE ......................................................................................... 16
BSE StAR MF platform: Possible revenue driver .................................................................................................. 18
India INX: India’s global exchange ....................................................................................................................... 19
BSE: Fastest exchange in the world ..................................................................................................................... 20
Financial analysis ................................................................................................................................................ 21
CDSL divestment: Value unlocking ...................................................................................................................... 24
Valuation & outlook ............................................................................................................................................ 27
Key Risks ............................................................................................................................................................. 29

BSE : INITIATING COVERAGE
Page | 3
Macro tailwinds: India, the fastest growing economy The outlook for the Indian economy remains strong,
and a number of agencies estimate that it will grow at 7-8% (real GDP terms) over the next few years. India is expected to become the third largest economy in the world by 2030, with GDP approximately tripling to USD 7tn (10-year CAGR of 8.7%).
The strong growth outlook is driven by a number of factors, such as policy reforms like GST, focus on skill development, thrust on reviving manufacturing via the ‘Make in India’ initiative, focus on doubling agricultural income, and close monitoring of inflation, resulting in lower interest rates.
Demonetisation was a significant step towards making India a cashless economy. We expect demonetisation to lead to growth opportunities for exchanges in India, based on factors like (1) Allocation of a larger portion of household savings in productive financial assets (2) Adoption of digital payments will lead to greater participation in capital markets, owing to the seamless integration of payment and trading platforms and (3) Drop in interest rates will make capital markets more attractive.
India Is The Fastest Growing Economy Globally India To Become USD 7TN Plus Economy By 2030
Source: Economist Intelligence Unit, Oliver Wyman Report, HDFC sec Inst Research
Source: Oxford Economics, Oliver Wyman Report, HDFC sec Inst Research
Indian economy expected to grow at 7-8% (real GDP terms), reach USD 7TN by 2030E Bold policy reforms like GST, ‘Make in India’ and Demonetisation will drive growth for the Indian economy
2.2 2.43.2
7.4
0
2
4
6
8
2016E 2017E 2020E 2030E
Nominal GDP (US$ TN)US$
1.2 1.
7
0.9
2.0
2.1 2.
9
4.0
2.4
4.2
7.9
6.5
0.8
2.2
1.3
0.8
1.8 2.
4
1.9 2.2
3.5
5.4
7.4
0.01.02.03.04.05.06.07.08.09.0
Russ
ia
Euro
pe
Braz
il
UK
US
Hon
g Ko
ng
Sing
apor
e
Wor
ld
Asia
-Pac
Chin
a
Indi
a
Average GDP growth 2011-2015 Average GDP growth 2016-2020P%

BSE : INITIATING COVERAGE
Page | 4
Indian exchanges catching up with global peers Prominent exchanges in India like NSE and BSE lag
behind global peers in various parameters like MCap/GDP ratio, cash turnover velocity and free float etc. However, with the Indian economy growing at a swift pace, these criteria are expected to catch up gradually.
The Market Cap to GDP ratio is a determinant of where the market is likely to head in the long term. In India, market cap to GDP stands at 73%, slightly higher than the emerging markets’ average of 61%, but lower than that of the developed market average of 131%.
The BSE Market Cap to GDP is at 76% for FY17, slightly higher than the long-term average of 70%.
The cash turnover velocity for Indian markets (trading volume as a percentage of market capitalisation) has fallen significantly in 2011, after STT was charged on option premium rather than notional value, making the cash market less attractive. However, it has now stabilised at ~40%, and will follow an upward trend with improving economic growth and market activity.
We believe there is a clear case for growth in cash volumes based on the following factors, that are (1) Increasing retail participation (2) Huge inflows in MFs (3) Greater penetration of capital market products (4) Use of the mobile trading platform (5) Plans for divestment (6) Rising free float levels (7) Large number of upcoming IPOs and (8) Rising investor confidence.
Market Cap To GDP Ratio For Different Countries Cash Turnover Velocity For Different Countries
Source: The World Bank Group, Oliver Wyman, HDFC sec Inst Research
Source: The World Bank Group, Thomson Reuters DataStream, WFE, Oliver Wyman Report, HDFC sec Inst Research * China includes HK
Cash turnover velocity (cash turnover to market cap) is one of the lowest in India. Market Cap to GDP for India stands at 73%, slightly higher than that of the emerging market average of 61% Growth in trading volume will be led by rising free float, higher inflow in equities, more no of IPO’s etc.
73%
28%
75%
41%
129%
35% 30%
88% 89%
119%
89%
219%
140%
Indi
a
Braz
il
Chin
a
Indo
nesia
Mal
aysia
Mex
ico
Russ
ia
Thai
land
Aust
ralia
Japa
n
Kore
a
Sing
apor
e US
Emerging economies Developed economies
53%
102%
379%
28% 34% 40% 38%73%
126%159%
32%
266%
Indi
a
Braz
il
Chin
a …
Indo
nesia
Mal
aysia
Mex
ico
Russ
ia
Thai
land
Japa
n
Kore
a
Sing
apor
e US
Emerging Developed economiesMarket Cap to GDP average for developed countries is as high as 131%
Market Cap to GDP average for emerging economies is only 61%, huge scope for improvement

BSE : INITIATING COVERAGE
Page | 5
BSE Mcap To GDP Ratio (%) India’s Cash Turnover Velocity (NSE+BSE) (%)
Source: BSE, World Bank, HDFC sec Inst Research Source: BSE,NSE, HDFC sec Inst Research Increasing free float to improve turnover velocity
Indian companies have a high promoter holding structure, which leads to lower free float and inferior turnover velocity. However, after SEBI’s initiative to raise the minimum public shareholding to 25%, the promoters’ holding has witnessed a decline (47% in FY16 from 54% in FY10).
Indian listed companies’ free float has increased from ~37% in 2010 to ~46% in 2015, but is still below the levels of developed countries at 85-90%.
Retail investors constitute only ~13% of stock ownership in India. Number of Demat accounts in India is less than 10% of the number of bank accounts.
We believe, with the planned disinvestment of government stake in PSUs, greater number of IPOs, higher retail participation and rising institutional activity the free float level can increase further.
BSE Market Cap to GDP is at 76% for FY17, slightly higher than the long-term average of 70% Turnover velocity in cash segment declined sharply in FY10-14 due to increased popularity of options, currently stable at ~40% Higher free float will drive volumes and improve turnover velocity
47
72 67
107
46
82 83
68 6560
78
63
76
0
20
40
60
80
100
120
FY05
FY06
FY07
FY08
FY09
FY10
FY11
FY12
FY13
FY14
FY15
FY16
FY17
%
0%
10%
20%
30%
40%
50%
60%
70%
80%
90%
100%
FY05
FY06
FY07
FY08
FY09
FY10
FY11
FY12
FY13
FY14
FY15
FY16
FY17

BSE : INITIATING COVERAGE
Page | 6
Stock Ownership In India Free Float Across Major Global Exchanges
Source: BSE, HDFC sec Inst Research Source: Oliver Wyman Report , HDFC sec Inst Research
38 37
5743
30
6876
9376
95
46 47
83
46 43
6680
49
82 89
0
20
40
60
80
100
Indi
a (B
SE)
Indi
a (N
SE)
Braz
il (B
oves
pa)
Chin
a (S
henz
hen …
Mal
aysi
a (B
ursa
)
Hon
g Ko
ng S
E
Japa
n (J
apan
SE)
Sing
apor
e (S
GX)
UK
(LSE
)
US
(NYS
E)
2010 2015%
57% 54% 52% 51% 49% 49% 49% 47%
13% 16% 17% 18% 21% 22% 23% 27%
12% 13% 13% 13% 12% 12% 11% 13%18% 18% 19% 19% 18% 17% 17% 13%
0%10%20%30%40%50%60%70%80%90%
100%
FY09
FY10
FY11
FY12
FY13
FY14
FY15
FY16
Promoters FII DII Others (Incl. Retail)

BSE : INITIATING COVERAGE
Page | 7
BSE: Cash market share stable NSE has dominated the cash and derivative markets.
It commands a healthy market share of ~100% in the derivatives segment, and ~84% in the cash segment. BSE has been losing market share in the cash segment to NSE since 2006, but this has now stabilised in the last two to three years.
The primary reason for BSE losing market share in the cash segment was the absence of the derivatives (Stock Index F&O) segment on the exchange. This eventually led to the shift of cash volumes to NSE. Also, higher volumes in NSE lead to lower impact costs, and as rightly said, volume begets volume, making BSE a less attractive exchange. BSE also
lacked product innovation capabilities, management focus owing to legacy issues, and was unable to compete with NSE on the technology front.
In FY17, BSE had ~16% market share in the cash market (stable at this level for the last four years), as the above-mentioned problems have been more or less addressed. BSE has revamped its technology to become the fastest exchange in the world. Management increased focus on generating ways to increase transaction income. BSE has also terminated its efforts to develop the F&O market, where NSE commands a dominant position.
BSE Cash Market Share Has Stabilised BSE And NSE Cash ADTV
Source: BSE, NSE, HDFC sec Inst Research Source: BSE,NSE, HDFC sec Inst Research
45 63 78
141
113 17
0
141
113
109
112
178
172 20
4
2134
40
65
46
58
46
27 22 21
35 30
40
0
50
100
150
200
250
FY05
FY06
FY07
FY08
FY09
FY10
FY11
FY12
FY13
FY14
FY15
FY16
FY17
NSE BSERs Bn
BSE losing market share to NSE since 2006, have stabilized at ~16% in FY17 BSE was facing legacy issues, lacked on product innovation capabilities, had inferior technology as compared to NSE, which led to loss of market share BSE/NSE cash turnover increased at a CAGR of 5.5/13.2% over FY-05-17 respectively BSE ADTV has grown at a CAGR of 25% in the last three years vs 22% for NSE
BSE ADTV CAGR 25% over FY14-17 vs 22% for NSE
69%
65%
66%
69%
71%
74%
75% 81%
83%
84%
84%
85%
84%
31%
35%
34%
31%
29%
26%
25% 19%
17%
16%
16%
15%
16%
0%10%20%30%40%50%60%70%80%90%
100%
FY05
FY06
FY07
FY08
FY09
FY10
FY11
FY12
FY13
FY14
FY15
FY16
FY17
NSE BSE

BSE : INITIATING COVERAGE
Page | 8
Total cash turnover grew at a CAGR of 11.4% over FY-05 to FY-17. BSE/NSE cash turnover increased at a CAGR of 5.5/13.2% over FY-05 FY-17 respectively. In FY-17, cash turnover volumes stood at Rs 61tn, which is an all-time high.
It has been observed that the cash equity volume growth does not follow a secular uptrend, and it’s
better to look at long-term growth averages. The long-term growth average for cash equities in Indian markets is ~16%.
We expect total cash turnover to grow at a CAGR of 15% over FY17-20E. BSE turnover is expected to grow at 17% CAGR due to changed traffic structure (flat fee per trade) for A&B segment stocks.
Total Cash Turnover Is At All-time High (BSE+NSE) BSE Long-term Cash Turnover Growth Average
Source: BSE, NSE, HDFC sec Inst Research Source: BSE,NSE, HDFC sec Inst Research
Cash turnover volumes stood at an all-time high in FY17 Long-term growth average for cash equities in Indian markets is ~16%
17
2430
52
39
56
47
35 33 33
52 50
61
5
15
25
35
45
55
65
FY05
FY06
FY07
FY08
FY09
FY10
FY11
FY12
FY13
FY14
FY15
FY16
FY17
Rs tn
46%
21%
76%
-25%
43%
-15%-27%
-6%
2%
56%
-4%
22%
-40%
-20%
0%
20%
40%
60%
80%
100%
FY05
FY06
FY07
FY08
FY09
FY10
FY11
FY12
FY13
FY14
FY15
FY16
FY17
Cash Turnover growth YoY % Average growth %
Average growth rate of 15.8%

BSE : INITIATING COVERAGE
Page | 9
Transaction revenue : Vital for an exchange Transaction revenue comprises the bread and butter
for any exchange. It contributed 23.7% to BSE’s operational revenue and 33.3% of total revenue (ex-CDSL) in FY17. This is way below NSE, where transaction revenue constitutes ~73% of revenue from operations.
BSE’s transaction revenue improved significantly in FY17 (+122.7% YoY to Rs 1,224mn), primarily owing to rising cash volumes, stable market share, contribution from currency derivatives and significant contribution from exclusively-listed shares (XC, XD and XT category) on BSE.
Steep hike in pricing for exclusively- listed stocks
In Jan-16, BSE adopted a different pricing mechanism for exclusively-listed stocks. It increased transaction charges from Rs 27.5/mn to Rs 1000/mn, up 36x.
This led to a steep rise in revenue from exclusively-listed stocks in FY16 and FY17. For FY17, revenue from these stocks stood at Rs 612mn, ~51% of the transaction revenue.
In volume terms, these exclusive stocks contribute only 3.1% to total cash volumes. XC, XD and XT segments’ volumes were up 277.2% in FY17, and stood at Rs 306bn (ADTV of Rs 1.2bn). We believe volumes in this segment are a function of increased market activity, and BSE will continue to gain from this.
BSE’s Transaction Revenue Mix Of Transaction Revenue (%)
Source: BSE, HDFC sec Inst Research Source: BSE, HDFC sec Inst Research
Transaction revenue for BSE is ~33% of revenue, whereas its ~73% for NSE BSE hiked transaction charges for exclusive listed stocks by 36x Exclusive stocks contribute only 3.1% to total cash volumes but contribute ~51% to transaction revenue
376 317 294 505 550
1,224 1,294
1,558
1,832
-40%-20%0%20%40%60%80%100%120%140%
-
500
1,000
1,500
2,000
FY12
FY13
FY14
FY15
FY16
FY17
FY18
E
FY19
E
FY20
E
Transactrion Revenue (Rs mn) Growth YoY % - RHSRs mn
95 96 96 100
70
4433 30 28
28
5154
47 42
5 4 4 0 2 57
77
10 18
6 6 5
0%
20%
40%
60%
80%
100%
FY12
FY13
FY14
FY15
FY16
FY17
FY18
E
FY19
E
FY20
E
Cash (Non Exclusive) Cash (Non Exclusive)Derivatives INXStAR MF

BSE : INITIATING COVERAGE
Page | 10
Change in pricing structure to gain market share
BSE has changed the structure of its transaction charges for the equity cash segment from an ‘ad valorem’ basis to ‘per trade’ basis, effective 3-April-17. BSE charged Rs 1 per trade to entities with volumes less than 50k trades per month. This rate was valid only for four months, after which it was increased to Rs 1.50/trade in August-17.
We believe the structure was changed primarily to attract volumes from NSE, which charges on an ‘ad valorem’ basis (Rs 32.5/mn, 0.325 bps).
This has also attracted more block/bulk deals from competitors, and could eventually lead to market share gain.
By charging Rs 1/trade, BSE was losing out on traction revenue, and there was no significant increase in the number of trades. On this account, BSE decided to hike charges again to Rs 1.5/trade, effective Aug-17. These charges are still at ~10% discount to NSE at Rs 1.7/trade.
BSE Cash Segment Trading Volume (Rs bn) No Of Cash Trades (NSE And BSE)
Source: BSE, HDFC sec Inst Research Source: BSE,NSE, HDFC sec Inst Research
BSE changed its charge structure for A&B segment, now charging on ‘per trade’ basis vs. ‘ad valorem’ earlier This strategy is to gain market share and attract bulk/block deals BSE decided to hike the charges to Rs 1.5/trade (earlier Rs 1.0/trade), effective Aug-17
6,54
1
5,33
0
4,99
3 8,34
2
7,13
9 9,50
2
81
306
0
2,000
4,000
6,000
8,000
10,000
FY12
FY13
FY14
FY15
FY16
FY17
Vol A&B (Non Exclusive) Vol XC XD XT (Exclusive)
Rs bn
1,43
8
1,36
1
1,44
3
1,83
3
1,85
2
1,97
6
394 324 363
711412 392
0
500
1,000
1,500
2,000
2,500
3,000
FY12
FY13
FY14
FY15
FY16
FY17
BSE NSEmn

BSE : INITIATING COVERAGE
Page | 11
Realisations Per Cash Trade (Rs) Value Per Cash Trade (NSE And BSE)
Source: BSE, NSE, HDFC sec Inst Research Source: BSE,NSE, HDFC sec Inst Research
Equity derivatives: Missed opportunity The derivatives market has witnessed robust growth
in volumes since inception, led by options. Total turnover has grown at a CAGR of 29% over FY07-17. This growth has been led by Index Options and Stock Options, which have grown at a CAGR of 57% and 41% in the same period.
The derivatives segment is clearly dominated by NSE, with 100% market share in FY17. BSE ventured into the equity derivatives segment in 2000, but was unable to attract volumes from NSE.
BSE launched a Liquidity Enhancement Incentive Programme (LEIPS) in Sep-11, to provide self-sustaining liquidity in the derivatives segment. This continued for five years, after which it was withdrawn. During this period, BSE’s market share increased to 27% in FY15, but this was artificially created.
The bourse spent Rs 3.19bn on the LEIPS scheme in the last six years (FY12-17). This expense will not be incurred in FY18, and the bourse is now completely focussing on the international exchange set-up in Gift City.
BSE cash realisation is still at ~10% discount to that of NSE Value per trade for BSE has caught up with NSE in the last three years BSE has been a failure in Equity derivative segment, NSE commands 100% market share Tried to compete with NSE through LEIPS scheme and charging ~75% lower transaction fee, but didn’t succeed
0.9 0.90.8
0.7
1.0
1.41.3 1.3 1.3
1.5 1.51.7
0
0.2
0.4
0.6
0.8
1
1.2
1.4
1.6
1.8
FY12
FY13
FY14
FY15
FY16
FY17
BSE NSERs
17
17
14
12 18
25
20
20
19 24
23 26
0
5
10
15
20
25
30
FY12
FY13
FY14
FY15
FY16
FY17
BSE NSERs '000

BSE : INITIATING COVERAGE
Page | 12
Equity Derivative Market Share (%) Equity Derivative Market Growth
Source: BSE, NSE, HDFC sec Inst Research Source: BSE,NSE, HDFC sec Inst Research NSE Derivative Trading Volume Mix (%) NSE Transaction Revenue Mix (%)
Source: NSE, HDFC sec Inst Research Source: NSE, HDFC sec Inst Research
39 39 39 44 41 43
37 34 37 30 36 33
24 27 23 26 24 24
0%
20%
40%
60%
80%
100%
FY12 FY13 FY14 FY15 FY16 FY17
Futures Options Cash
Derivative market has registered a strong growth in the last 10 years, BSE has missed the opportunity NSE earns ~76% of its transaction revenue from Derivatives (~58 % of NSE revenue) Index options constitute the bulk of trades
100
99 98 100
100
100
97
81 81 73
94 100
0 1 2 0 0 0 3
19 19 276
0
0%10%20%30%40%50%60%70%80%90%
100%
FY06
FY07
FY08
FY09
FY10
FY11
FY12
FY13
FY14
FY15
FY16
FY17
NSE BSE
0100200300400500600700800900
1,000
FY06
FY07
FY08
FY09
FY10
FY11
FY12
FY13
FY14
FY15
FY16
FY17
NSE BSE Total Derivative MarketRs TN
72% 72% 73% 72% 76% 77%
13% 13% 13% 15% 12% 12%3% 6% 6% 6% 5% 6%11% 8% 8% 7% 7% 5%
0%
50%
100%
FY12 FY13 FY14 FY15 FY16 FY17
Index Options (Notional) Stock FuturesStock Options (Notional) Index Futures

BSE : INITIATING COVERAGE
Page | 13
Currency derivatives: BSE gaining market share BSE launched the currency derivatives segment in
Nov-2013 to gain market share in the derivatives segment. The exchange launched futures contracts in USD/INR, EUR/INR, GBP/INR and JPY/INR, and currency options only in USD/INR. USD/INR contributes more than 99% to volumes.
BSE’s currency turnover has witnessed robust growth since its launch and increased at a CAGR of 29% over FY15-17 to Rs 31.7tn.
Turnover declined sharply in FY14 and FY15, led by regulatory tightening by SEBI. To avoid speculation and currency depreciation, SEBI tightened exposure limits and increased trading margins.
This led to 22.1/16.4% fall in total currency turnover in FY14/15 respectively. Volumes recovered sharply in FY16 and FY17, led by the launch of currency options.
For BSE, currency options’ ADTV increased by 49% in FY17, while currency futures’ ADTV declined by 2.3%.
While currency volumes cracked in FY14, BSE started gaining market share from MSEI. Its current market share stands at 38%.
BSE’s market share gain was supported by new and improved trading technology, and low latency time, which attracted algo traders. Also, BSE charged fees that were ~75% lower than NSE to attract volumes.
Currently, revenue contribution from currency derivatives is very miniscule (~6% of transaction revenue and ~2% of total revenue ex-CDSL). We expect BSE currency trading volumes to grow at 10% CAGR over FY17-20E.
BSE has increased currency transaction charges over the last few quarters, and they currently stands at Rs 2.5/mn for currency futures and Rs 250/mn for currency options (charges on options premium). This will further boost revenues from currency derivatives.
Currency Derivatives Market Share (%) Currency Derivatives Market Growth
Source: BSE, NSE, MSEI, HDFC sec Inst Research Source: BSE,NSE, MSEI, HDFC sec Inst Research
0
20
40
60
80
100
FY12
FY13
FY14
FY15
FY16
FY17
NSE BSE MSEI Total Turnover
Rs TN
BSE has gained market share in currency derivative segment. Revenue from currency derivative trading is a very small part of transaction revenue (~6%) BSE has hiked the transaction fee for the segment by 6x, still at 75% discount to NSE
56 61 60 54 59 58
434
36 3844 39 3612 4 4
0%
20%
40%
60%
80%
100%
FY12
FY13
FY14
FY15
FY16
FY17
NSE BSE MSEI

BSE : INITIATING COVERAGE
Page | 14
Price hike across segments BSE has hiked transaction charges across segments,
which has provided a boost to its transaction revenues in FY17. BSE’s charges were much lower than that of NSE, and the price hikes were largely taken to rationalise the pricing differential. Even after the price hikes, BSE’s charges are at a steep discount to those of NSE.
As mentioned earlier, BSE increased pricing for exclusively-listed stocks by 36x, from Rs 27.5/mn to Rs 1000/mn.
There are around 2500 exclusive category stocks. These scrips have less than 5k shareholders and a
market cap lower than Rs 10bn. Of the total listed companies in BSE, ~43% are in this category.
In the currency derivatives segment, BSE has hiked charges by 6.3x in currency futures and 5.0x in currency options over the last two years.
Even then, BSE charges 77/38% less than NSE for currency futures and options respectively. We believe that after gaining market share, there is further scope for a price hike.
Price hikes in cash (exclusive segment) and currencies led to a steep increase in transaction revenue in FY17 (+122.7% YoY), and we expect it to increase by 14.4% CAGR over FY17-20E.
Comparison Of Transaction Charges For NSE And BSE Rs/mn BSE (Rs/mn) BSE charges in bps NSE (Rs/mn) NSE charges in bps Discount to NSE %
Cash Market (Non Exclusive)
Rs 1.5/trade up to 0.5mn trades
monthly NM 32.5 0.325
Considering earlier charges of Rs 27.5/mn
discount was 15% Equity Futures 5 0.050 19 0.190 -74% Equity Options 250 2.500 500 5.000 -50% Currency Futures 2.5 0.025 11 0.110 -77% Currency Options 250 2.500 400 4.000 -38% Source: BSE, NSE, HDFC sec Inst Research
BSE has lately realised that transaction fee is not a very critical parameter to attract volume BSE has taken price hike across segments to reduce the huge pricing gap to NSE

BSE : INITIATING COVERAGE
Page | 15
Price Hikes Taken In The BSE Currency Derivatives Segment Currency Derivative FY15 FY16 FY17 FY18
Futures Increased from NIL to Rs 0.2-0.4/mn
Increased to Rs 0.6/mn and further to
Rs 1.0/mn
Further Increased to Rs 1.2/mn and to Rs 1.8/mn
Increased to Rs 2.2/mn and finally stands at Rs 2.5/mn
Options Further Increased to Rs 50/mn and then to Rs
150/mn
Increased to Rs 200/mn and finally stands at Rs 250/mn
currently Source: BSE, HDFC sec Inst Research Price Hikes Taken In Currency Derivative Segment In A Phased Manner Date Currency Futures Rate
(Rs /mn) In bps Increase % Currency Options Rate (Rs /mn) In bps Increase %
Mar-15 0.4 0.004 Jun-15 0.6 0.006 50.0% Sep-15 0.8 0.008 33.3% Oct-16 1.0 0.010 25.0% Dec-16 1.2 0.012 20.0% 50 0.500 Feb-17 1.5 0.015 25.0% 100 1.000 100.0% Apr-17 1.8 0.018 20.0% 150 1.500 50.0% Jun-17 2.2 0.022 22.2% 200 2.000 33.3% Jul-17 2.5 0.025 13.6% 250 2.500 25.0% Time Increase (x) 6.3 X 5.0 X Source: BSE, HDFC sec Inst Research Slabs Rates For The Cash Segment (Effective Aug-17) Monthly Trade count Rs/trade 0-100K 1.50 100-300K 1.25 300-500K 1.00 500-2000K 0.75 More than 2000K 0.50 XC', 'XD', 'XT' and 'Z' (Exclusive Group) Rs 1000/mn (10bps)

BSE : INITIATING COVERAGE
Page | 16
Steep hike in listing fees: Reduces price gap with NSE BSE derives 37.2% of its revenue (ex-CDSL) from
listing fees. Listing fee is a recurring income, and has grown at a CAGR of 24.5% over FY12-17. The reason for the robust growth has been continuous price hikes taken by BSE in the last four years.
Listing fees were hiked by 100% for the base slab in FY15 and FY16. For the remaining slabs, listing fees were hiked by ~25-100% in FY15 and by ~5-20% in FY16.
In FY18, BSE further raised its listing fees by 25% for on the base slab. The price hike was as high as 50% for some of the slabs.
Most of the exclusive companies in BSE fall in the base slab, so the effective hike in listing revenue will be around 23% for FY18. We have not assumed a nominal 7-10% hike in listing fees for FY19-20E, which will be at par with NSE.
After the steep price hike in FY18, listing fee is still lower by ~10% as compared to NSE.
BSE Listing Revenue No Of Listed Companies In BSE
Source: BSE, NSE, MSEI, HDFC sec Inst Research Source: BSE,NSE, MSEI, HDFC sec Inst Research
BSE has hiked its listing fee by another 25% in FY18. This will boost the recurring listing revenue for BSE After the hike still it’s at 10% discount to NSE BSE has the highest no of listed companies in the world, stands at 5.8K for FY18 SEBI has ordered to delist ~200 shell companies thus the no of listed companies will come down in FY18-19
462 426 484
958
1,446 1,382
1,673 1,7631,897
0
10
20
30
40
50
60
0200400600800
1,0001,2001,4001,6001,8002,000
FY12
FY13
FY14
FY15
FY16
FY17
FY18
E
FY19
E
FY20
E
Listing Revenue % of revenue ex CDSL - RHSRs mn %
5,133 5,211
5,339
5,627
5,914 5,837
5,687 5,637 5,737
-3%-2%-1%0%1%2%3%4%5%6%
4,600
4,800
5,000
5,200
5,400
5,600
5,800
6,000
FY12
FY13
FY14
FY15
FY16
FY17
FY18
E
FY19
E
FY20
E
No of Listed Companies Growth YoY % - RHSNos. %

BSE : INITIATING COVERAGE
Page | 17
Listing Fee Comparison For NSE And BSE
Category BSE FY17 Listing Fee (Rs)
BSE FY18 Listing Fee (Rs)
Hike (%)
NSE Listing Fee (Rs)
Discount to NSE ( %)
Initial Listing Fee 20,000 20,000 0.0% 50,000 -60.0% Listed Capital (Paid up capital) Upto Rs 500 mn 200,000 250,000 25.0% 200,000 25.0% Above Rs 500 mn and upto Rs 1,000 mn 200,000 250,000 25.0% 255,000 -2.0%
Above Rs 1,000 mn and upto Rs 1,500 mn 200,000 300,000 50.0% 330,000 -9.1%
Above Rs 1,500 mn and upto Rs 2,000 mn 236,250 300,000 27.0% 330,000 -9.1%
Above Rs 2,000 mn and upto Rs 3,000 mn 303,750 375,000 23.5% 415,000 -9.6%
Above Rs 3,000 mn and upto Rs 4,000 mn 367,500 450,000 22.4% 510,000 -11.8%
Above Rs 4,000 mn and upto Rs 5,000 mn 487,500 600,000 23.1% 670,000 -10.4%
Above Rs 5,000 mn and upto Rs10,000 mn
487,500 + (X -5,000)/50*(3,188)
605,500 + (X -5,000)/50*(3,530)
675,000 + (X -5,000)/50*(4,150)
Above Rs 10,000 mn and upto Rs20,000 mn
806,250 + (X -10,000)/50*(3,469)
990,000 + (X -10,000)/50*(3,930) 1,100,000 + (X -
10,000)/50*(4,625)
Above Rs 20,000 mn and upto Rs30,000 mn
806,250 + (X -10,000)/50*(3,469)
10,00,000 + (X -10,000)/50*(4270)
1,125,000 + (X -10,000)/50*(5,025)
Above Rs 30,000 mn 806,250 + (X -10,000)/50*(3,469)
10,20,000 + (X -10,000)/50*(3910) 1,200,000 + (X -
10,000)/50*(4,600)
Source: BSE, NSE, HDFC sec Inst Research

BSE : INITIATING COVERAGE
Page | 18
BSE StAR MF platform: Possible revenue driver StAR MF is an online platform launched by BSE in
Dec-2009, after SEBI allowed stock exchanges to offer services for buying and selling mutual fund (MF) units. The platform allows mutual fund distributors, investment advisors etc. to purchase and redeem mutual fund units on behalf of their clients.
BSE StAR-MF platform witnessed increased acceptance owing to its user-friendly features. The number of orders processed increased to 6.5mn (+98% YoY) in FY17, with a total value of Rs 743bn (+68% YoY).
BSE StAR-MF platform has ~80% market share, and currently only 10% of mutual fund orders are processed electronically.
BSE was not charging any fee to the distributors for the use of the platform. Management has said that they want to monetise the effort, and will charge on a pay-per-use model.
BSE is planning to charge Rs 6 to Rs 30 per transaction that is routed through the platform. The exchange received initial resistance from the mutual fund industry, but BSE will start charging for transactions executed on the platform 2HFY18 onwards.
This could add Rs 70-80mn to the transaction revenue in FY18-19, considering the current run-rate and average realisation of Rs 10/transaction.
Orders Received On StAR MF Platform Value Of MF Trades Executed On StAR MF Platform
Source: BSE, HDFC sec Inst Research Source: BSE, HDFC sec Inst Research
BSE’s StAR MF platform has gained immense popularity and has ~80% market share The number of orders processed on the platform stood at 6.5mn (+98% YoY) in FY17, with a total value of Rs 743bn (+68% YoY) BSE will now monetise the effort, and will charge on a pay-per-use model
0.1 0.3 0.6
1.6
3.3
6.5
0%20%40%60%80%100%120%140%160%180%200%
0
1
2
3
4
5
6
7
FY12
FY13
FY14
FY15
FY16
FY17
Orders Received mn YoY% - RHSMn
9.95 41.31 55.95104.94
442.35
743.01
0%
50%
100%
150%
200%
250%
300%
350%
0
100
200
300
400
500
600
700
800
FY12
FY13
FY14
FY15
FY16
FY17
Value (Rs bn) YoY% - RHSRs bn

BSE : INITIATING COVERAGE
Page | 19
India INX: India’s global exchange BSE launched India’s first International Exchange
(INX) in Jan-17 at GIFT City in Gujarat. The objective this was to attract volumes from global exchanges like SGX and Hong Kong Stock Exchange (HKEX).
The features of INX are (1) 22 hours of trading (2) Best technology (response time of 4 microseconds vs. 60 microseconds in the Singapore exchange) (3) Low transaction cost (no STT, CTT, long-term capital gain tax, income tax for the first five years) (4) Access to all asset classes on a single platform (5) No foreign exchange risk (Transaction and settlement in USD) and (6) No transaction charges in the first year.
BSE has invested Rs 1.15bn in INX and ICC, and will invest another Rs 4bn over the next three years, which includes Rs 3bn net worth requirement for the
clearing corporation. The company will use the cash proceeds from the CDSL stake sale to fund the INX capex. The company is confident of witnessing a ramp-up in INX volumes, and views it as the next big opportunity. However, we believe it will take at least two to three years for the volume to ramp up.
BSE is currently not charging any transaction charges, but is planning to levy them from FY19. The company will charge USD0.2/contract (Rs13/trade) starting FY19. We have assumed the number of trades to increase to 50k/day, and INX will generate transaction revenue of Rs 163mn in FY19.
INX will be margin dilutive in FY18-19, and will break-even in FY20E.
INX Total Turnover (USD mn)
INX No Of Trades (Monthly Nos.)
Source: BSE, HDFC sec Inst Research Source: BSE, HDFC sec Inst Research
India INX is the global exchange of India, the company is very positive about the future of this exchange The prime objective is to attract volume from Hong Kong and Singapore BSE has invested Rs 1.15bn in INX and ICC, and will invest another Rs 4bn (received from CDSL stake sale) over the next three years The exchange is not charging anything now but will charge 20cents/trade from FY19 onwards
11 54 110
274
1,014 1,0661,199
0
200
400
600
800
1,000
1,200
1,400
Jan-
17
Feb-
17
Mar
-17
Apr-
17
May
-17
Jun-
17
Jul-1
7
US$mn
16
1118
7768 64
0102030405060708090
Jan-
17
Feb-
17
Mar
-17
Apr-
17
May
-17
Jun-
17
Jul-1
7
'000

BSE : INITIATING COVERAGE
Page | 20
BSE: Fastest exchange in the world BSE lagged in technological capabilities vis-a-vis the
competition, and was losing market share. Management lately realised the importance of technology, and invested in a complete tech revamp.
BSE entered into a strategic tie-up with Eurex in March-13, to deploy the latest Eurex trading system for various segments. This led to major changes in the technological offerings by BSE.
Initially, the response time of BSE was reduced from 300 milliseconds to 10 milliseconds. After additional changes, the response time was reduced to 6 microseconds. This made BSE the fastest exchange in the world, as the second fastest exchange was at 60 microseconds(BSE became ten times faster than the closest competitor).
Orders per second changed from 5k to 500k orders/second (100 times bigger and 1,600 times faster).
The current technological set-up is enough to handle 10x the current volumes. The technology spend has been completed for BSE, but INX will attract more spends.
Technology Spend As % Of Revenue
Source: BSE, HDFC sec Inst Research
New Product Offerings To Start Yielding Results In FY18-20
Business Revenue
Contribution (%)
Monetisation of the platform
likely by International Exchange 0% FY19 Mutual Fund Distribution(StAR MF) 0% FY18
SME Platform ~1% Started contribution
Bond Trading 0% FY19 Commodities 0% FY20 Source: BSE, HDFC sec Inst Research
BSE entered into a strategic tie-up with Eurex to upgrade its trading platform BSE has now become the fastest exchange in the world with a response time of 6 microseconds Current technological is enough to handle 10x the current volumes BSE has invested in a number of new platforms which will drive future revenue growth
693 717642 704
806
1,055 1,0631,158
1,238
0
5
10
15
20
25
30
0
200
400
600
800
1,000
1,200
1,400
FY12
FY13
FY14
FY15
FY16
FY17
FY18
E
FY19
E
FY20
E
Technology spend % of revenue - RHSMn %

BSE : INITIATING COVERAGE
Page | 21
Financial analysis
BSE has a diversified revenue stream, which can be broadly classified as (1) Revenue from securities’ services (51% of revenues ex-CDSL, CAGR of 9.1% over FY12-17) (2) Revenue from services to corporates (42% of revenue ex-CDSL, CAGR of 15.5% over FY12-17) and (3) Data dissemination revenue (7% of revenue, CAGR of 3.5 % over FY12-17).
Total revenue ex-CDSL has increased at a CAGR of 11% over the last five years, and at 27% over the last three years to Rs 3.71bn. We expect revenue ex-CDSL to increase at a CAGR of 11.6% over FY17-20E. Total revenue (including CDSL) increased at a CAGR of 10% over FY12-17 to Rs 5.17bn.
We expect transaction revenue to grow at a CAGR of Rs 14.4% over FY17-20E, led by a hike in transaction charges (for the non-exclusive segment and currency derivatives), monetisation of StAR MF platform, and revenue contribution from the INX exchange from FY19.
BSE offloaded its stake in CDSL (currently at 24%) in 1QFY18. CDSL, which contributed partly to the revenue from security services, will not be present in FY18. We expect revenue from security services (ex-CDSL) to increase at a CAGR of 12.1% over FY17-20E.
Transaction revenue will be 36% of revenue in FY20 vs 33% currently (ex-CDSL). Revenue contribution from security services will increase to 52% of revenue in FY20E vs 51% in FY17 (ex-CDSL).
Revenue from corporate services includes listing revenue, which is the largest source of recurring revenue for BSE (contributed 37.2% of revenue ex-CDSL) in FY17. With a 25% price hike taken in listing fees in FY18, we expect listing revenue to grow at a CAGR of 11.2% over FY17-20E.
BSE spent aggressively in the last three years for technology upgradation, BSE StAR MF and setting up of the India INX exchange. Expenses increased at a CAGR of 20.1% over FY14-17, including CDSL, and 23.9% over the same period ex-CDSL.
We believe BSE has incurred most of the planned expenses, and hereon we expect it to grow at a CAGR of ~6% over FY17-20E. With operating leverage, EBITDA margin will increase from 4.7% in FY17 to 18.5% in FY20E.
EBITDA (ex-CDSL) will grow at a CAGR of 76% over FY17-20E, led by margin expansion and lower base effect.
BSE contributed 25% of the profits to the Settlement Guarantee Fund (SGF) till FY17. In Aug-16, SEBI amended the regulation. As per the new amendment, BSE will no longer be required to transfer 25% of its profits to the SGF. It will continue making formula-based contributions to Core SGF (CGSF) in the future. The CGSF amount was Rs 2bn in FY17, and we do not expect further contributions to impact profits in FY18.
We expect PAT (ex-CDSL) to grow at a CAGR of 15% over FY17-20E. Including CDSL PAT, CAGR is only 4% over the same period.
Revenue ex-CDSL has increased at a CAGR of 27% over the last three years to Rs 3.71bn Transaction revenue to grow at a CAGR of Rs ~15% over FY17-20E EBITDA margin (ex CDSL) will increase from 4.7% in FY17 to 18.5% in FY20E No contribution to SGF and liquidity enhancement scheme will boost profits

BSE : INITIATING COVERAGE
Page | 22
BSE’s Revenue Segments And Assumptions Segments FY12 FY13 FY14 FY15 FY16 FY17 FY18E FY19E FY20E CAGR
FY12-17CAGR
FY14-17CAGR
FY17-20E Securities services Transaction Charges 376 317 294 505 550 1,224 1,294 1,558 1,832 26.6% 60.9% 14.4% Income from Depository Services 956 905 871 1,046 1,227 1,458 0 0 0 8.8% 18.8% NM Treasury Income on margin deposit 459 339 439 532 413 405 413 421 429 -2.5% -2.7% 2.0% Others 392 375 269 254 223 270 311 357 411 -7.2% 0.2% 15.0% Total (A) 2,183 1,936 1,872 2,337 2,413 3,357 2,017 2,336 2,672 9.0% 21.5% 1.4% Growth YoY % 11.3% -3.3% 24.8% 3.3% 39.1% 39.9% 15.8% 14.4% Securities services (ex CDSL) Transaction Charges 376 317 294 505 550 1,224 1,294 1,558 1,832 26.6% 60.9% 14.4% Treasury Income on margin deposit 459 339 439 532 413 405 413 421 429 -2.5% -2.7% 2.0% Others 392 375 269 254 223 270 311 357 411 -7.2% 0.2% 15.0% Total (B) 1,227 1,031 1,002 1,291 1,186 1,899 2,017 2,336 2,672 9.1% 23.8% 12.1% Growth YoY % 16.0% -2.8% 28.9% -8.1% 60.1% 6.2% 15.8% 14.4% Services to corporate Listing Fees 462 426 484 958 1,446 1,382 1,673 1,763 1,897 24.5% 41.9% 11.2% Book Building Software Charges 48 75 74 55 112 143 165 189 218 24.3% 24.4% 15.0% Others 252 78 33 41 53 44 48 53 58 -29.5% 9.7% 10.0% Total (C) 763 579 591 1,054 1,611 1,569 1,886 2,006 2,173 15.5% 38.4% 11.5% Growth YoY % 24.1% 2.1% 78.2% 52.9% -2.6% 20.2% 6.4% 8.4% Data Dissemination (D) 208 224 204 221 224 247 266 290 315 3.5% 6.5% 8.5% Growth YoY % 7.8% -8.8% 8.3% 1.4% 10.0% 8.0% 9.0% 8.5% Total revenue from Operations (A+C+D) 3,154 2,739 2,668 3,611 4,248 5,172 4,169 4,632 5,160 10.4% 24.7% -0.1%
Growth YoY % 13.1% -2.6% 35.4% 17.6% 21.8% 19.4% 11.1% 11.4% Total revenue from Operations (ex CDSL) (B+C+D) 2,198 1,834 1,797 2,566 3,021 3,714 4,169 4,632 5,160 11.1% 27.4% 11.6%
Growth YoY % 16.5% -2.0% 42.8% 17.7% 22.9% 12.2% 11.1% 11.4% Source: BSE, HDFC sec Inst Research

BSE : INITIATING COVERAGE
Page | 23
BSE Cost Analysis And EBITDA Expenses (Including CDSL) FY12 FY13 FY14 FY15 FY16 FY17 FY18E FY19E FY20E CAGR
FY12-17CAGR
FY14-17CAGR
FY17-20E Employee Expenses 749 772 854 999 1,074 1,415 1,209 1,297 1,445 13.6% 18.3% 0.7% Technology Expenses 693 717 642 704 806 1,055 1,063 1,158 1,238 8.8% 18.0% 5.5% Other operating Expenses 746 931 928 1,492 1,695 1,734 1,355 1,390 1,522 18.4% 23.2% -4.2% Total Expenses 2,188 2,421 2,424 3,194 3,576 4,204 3,627 3,845 4,206 13.9% 20.1% 0.0% Growth YoY % 10.6% 0.1% 31.8% 11.9% 17.6% 13.7% 6.0% 9.4%EDITDA (Including CDSL till FY17) 965 319 244 417 673 969 542 787 955 0.1% 58.3% -0.5% Margin % 30.6% 11.6% 9.2% 11.5% 15.8% 18.7% 13.0% 17.0% 18.5% Expenses (Excluding CDSL) FY13 FY14 FY15 FY16 FY17 FY18E FY19E FY20E CAGR
FY13-17CAGR
FY14-17CAGR
FY17-20E Employee Expenses 601 679 807 859 1,166 1,209 1,297 1,445 18.0% 19.7% 7.4% Technology + Other Operating Expenses 1,270 1,182 1,787 2,127 2,372 2,418 2,548 2,761 16.9% 26.1% 5.2%
Total Expenses(ex CDSL) 1,871 1,862 2,593 2,986 3,538 3,627 3,845 4,206 17.3% 23.9% 5.9% Growth YoY % -0.5% 39.3% 15.1% 18.5% 2.5% 6.0% 9.4%EBITDA (ex CDSL) -39 -83 -35 33 175 542 787 955 NM 76.2% Margin % -2.1% -4.6% -1.4% 1.1% 4.7% 13.0% 17.0% 18.5%Source: BSE, HDFC sec Inst Research

BSE : INITIATING COVERAGE
Page | 24
CDSL divestment: Value unlocking The Central Depository Services (India)
Limited (CDSL) is the second-largest depository in India, with 44% market share. CDSL provides depository services to all market participants like depository participants, corporates, market intermediaries and insurance companies.
BSE owned 51% stake in CDSL, but according to SEBI’s regulations, BSE was required to bring down its stake to less than 24%. BSE divested 26% of its stake in CDSL through OFS. The size of the IPO was Rs 5.24bn.BSE will receive ~77% of the proceeds (~Rs 4.03bn). Post the IPO, BSE will hold 24% stake in CDSL.
CDSL has 12.3mn demat accounts in FY17, and has grown at a CAGR of 10.2% over FY13-17. CDSL has been gaining market share from NSDL, which currently has 56% market share. CDSL’s market share has grown from 40% in FY13 to 44% in FY17. In terms of incremental demat accounts addition, CDSL has 60% share, which will help it to further increase market share.
CDSL derives revenues from Annual Issuer Charges/Transaction charges/IPO/Data Charges/ Others contributing 35/21/11/13/19% to revenue respectively. Revenue has grown at a CAGR of 13% over FY13-17, and currently stands at Rs 1.46bn (+18.8% in FY17)
In comparison, NSDL derives 51% of its revenue from transaction charges and 37% from custody fees, while the annual fee constitutes only 7% of revenues. NSDL charges Rs 4.5/debit transaction, while CDSL charges Rs 5.5/debit transaction.
CDSL operates at a healthy EBITDA margin with embedded non linearity, which led to healthy margin expansion (increased from 39.4% in FY13 to 54.4% in FY17). EBITDA grew at a CAGR of 22% over FY13-17. PAT for FY17 stands at Rs 8.57bn, with EPS of Rs 8.2. CDSL is more cost-efficient as compared to NSDL, and operates at an EBITDA margin of 54% vs NSDL’s margin of 39%.
CDSL has RoE of 16.1% in FY17, net cash of Rs 5.15bn (15% of market cap), and a dividend yield of 1.1%.
We expect CDSL revenue/EBITDA/PAT to increase at a CAGR of 19/23/17% over FY17-20E.
CDSL has a diversified revenue stream, with a high component of annuity revenue (AMC, 35.4% of revenue). Growth in market activity and higher number of IPOs will fuel transaction/IPO revenue (32.7% of revenue). Embedded non-linearity and low capital requirements will lead to margin expansion and higher return ratios. We believe this business will command a higher multiple, and we arrive at a fair value of Rs 430 assigning 35x to Sep-19 EPS.
BSE : INITIATING COVERAGE
Page | 25
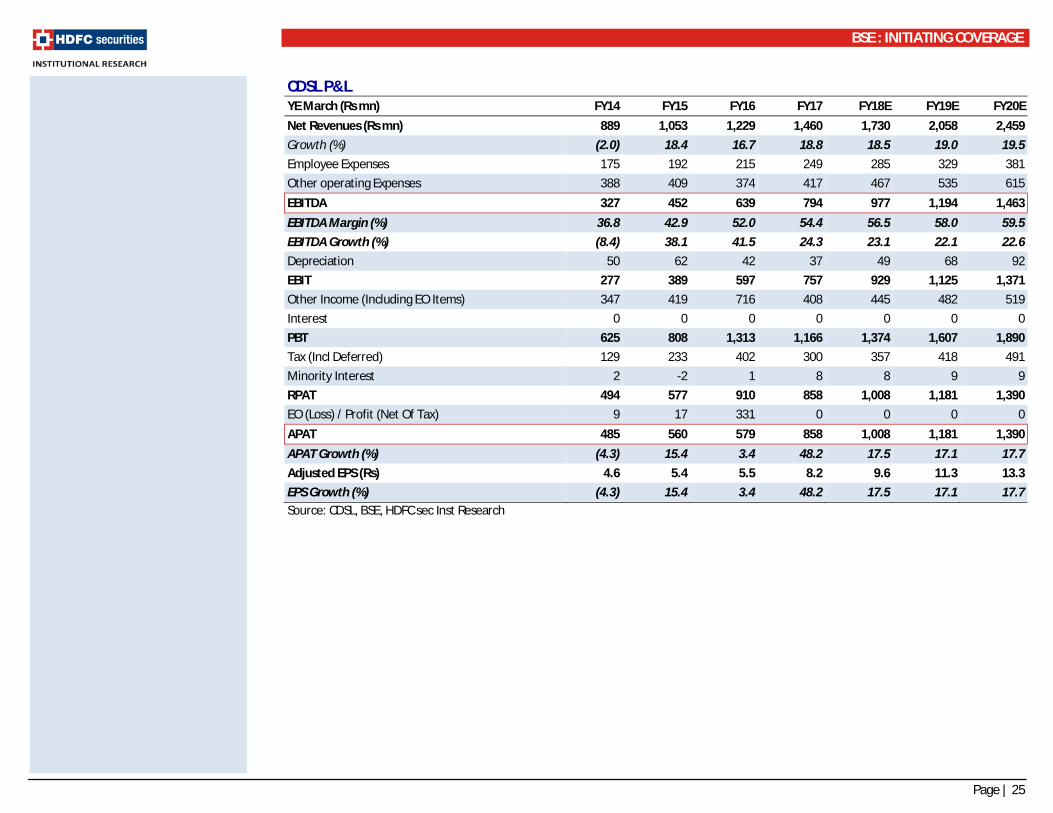
CDSL P&L YE March (Rs mn) FY14 FY15 FY16 FY17 FY18E FY19E FY20E Net Revenues (Rs mn) 889 1,053 1,229 1,460 1,730 2,058 2,459 Growth (%) (2.0) 18.4 16.7 18.8 18.5 19.0 19.5 Employee Expenses 175 192 215 249 285 329 381 Other operating Expenses 388 409 374 417 467 535 615 EBITDA 327 452 639 794 977 1,194 1,463 EBITDA Margin (%) 36.8 42.9 52.0 54.4 56.5 58.0 59.5 EBITDA Growth (%) (8.4) 38.1 41.5 24.3 23.1 22.1 22.6 Depreciation 50 62 42 37 49 68 92 EBIT 277 389 597 757 929 1,125 1,371 Other Income (Including EO Items) 347 419 716 408 445 482 519 Interest 0 0 0 0 0 0 0 PBT 625 808 1,313 1,166 1,374 1,607 1,890 Tax (Incl Deferred) 129 233 402 300 357 418 491 Minority Interest 2 -2 1 8 8 9 9 RPAT 494 577 910 858 1,008 1,181 1,390 EO (Loss) / Profit (Net Of Tax) 9 17 331 0 0 0 0 APAT 485 560 579 858 1,008 1,181 1,390 APAT Growth (%) (4.3) 15.4 3.4 48.2 17.5 17.1 17.7 Adjusted EPS (Rs) 4.6 5.4 5.5 8.2 9.6 11.3 13.3 EPS Growth (%) (4.3) 15.4 3.4 48.2 17.5 17.1 17.7 Source: CDSL, BSE, HDFC sec Inst Research

BSE : INITIATING COVERAGE
Page | 26
BSE Revenue And Growth (ex CDSL) EBITDA And EBITDA Margin To Improve Significantly
Source: BSE, HDFC sec Inst Research Source: BSE, HDFC sec Inst Research * FY18/19/20 EBITDA excludes CDSL
EBITDA And EBITDA Margin Ex CDSL Return Ratios To Improve Gradually
Source: BSE, HDFC sec Inst Research Source: BSE, HDFC sec Inst Research
1,834 1,797
2,5663,021
3,7144,169
4,6325,160
-20
-10
0
10
20
30
40
50
1,0001,5002,0002,5003,0003,5004,0004,5005,0005,500
FY13
FY14
FY15
FY16
FY17
FY18
E
FY19
E
FY20
E
Revenue (ex CDSL) Growth % - RHSRs mn %
319244
417
673
969
542
787
955
0.0
0.1
0.1
0.2
0.2
0
200
400
600
800
1,000
1,200
FY13
FY14
FY15
FY16
FY17
FY18
E
FY19
E
FY20
E
EBITDA (Including CDSL)EBITDA Margin (Incliding CDSL) - RHSRs mn %
-39 -83 -35
33175
542
787
955
-0.1
-0.1
0.0
0.1
0.1
0.2
0.2
-200
0
200
400
600
800
1,000
1,200
FY13
FY14
FY15
FY16
FY17
FY18
E
FY19
E
FY20
E
EBITDA (Ex CDSL) EBITDA Margin (ex CDSL) - RHSRs mn %
9.58.3
7.1 7.19.1
7.3 7.6 8.2
3.65.2
16.9
2.7
5.9
9.6
0.02.04.06.08.0
10.012.014.016.018.0
FY13
FY14
FY15
FY16
FY17
FY18
E
FY19
E
FY20
E
RoE % RoIC %%

BSE : INITIATING COVERAGE
Page | 27
Valuation & outlook We expect BSE’s (ex-CDSL) revenue/EBITDA/APAT to
increase at a CAGR of 12/76/15% respectively over FY17-20E. The EBITDA margin will expand from 4.7% in FY17 to 18.5% in FY20 (posted 15% margin in 1QFY18).
RoE for the business is only 9.1%, owing to high cash on the books (Rs 30bn ex SGF and clearing and settlement cash). Adjusting cash, RoIC stands at ~17% in FY17. ROE is likely to moderate in FY18E, given the investment in INX and stake sale in CDSL (16.1% RoE for FY17).
BSE has been constantly innovating and investing in technology, thus will remain a valuable franchise. We
see value based on (1) Embedded non-linearity, (2) Huge net cash (excluding SGF and clearing) of Rs 30bn (~Rs 567/sh, ~58% of MCap), (3) Negative core capital employed in the business (4) Value unlocking in higher margin CDSL and (5) High dividend yield of ~3%. BSE currently trades at 23.0x FY18E and 21.5x FY19E EPS (discount of ~2% to the global average).
We have valued BSE on a SOTP basis by assigning a fair value of Rs 430 to CDSL (~26% premium to CMP) and 25x to BSE’s core earnings (ex CDSL). We initiate coverage on BSE with a TP of Rs 1,200 (22% upside from CMP), which includes core BSE value at Rs 1,060 and CDSL stake value at Rs 140.
BSE SOTP Valuation CDSL Fair Value (Rs) (35x to Sep-19 EPS) 430 CDSL Target Mcap (Rs mn) 44,976 BSE stake in CDSL 24% Value of stake (Rs mn) 10,794 Taking 30% holding discount 7,556 Value /Share of CDSL 140 BSE Value (ex CDSL) (25x Sep 19 Earnings) 1,060 TP 1,200 Upside 22% Source: Company, HDFC sec Inst Research

BSE : INITIATING COVERAGE
Page | 28
Management Profile Name Designation Professional details
Ashishkumar Manilal Chauhan MD and CEO
With over 25 years of experience and Ashish is known as the father of modern financial derivatives market. He is one of the founders of NSE, where he worked from 1992 to 2000. He joined BSE in 2009 and prior to that he worked as the Group Chief information officer in Reliance Industries. He is an alumnus of IIT Bombay (Mechanical Engineering) and IIM Kolkata (PGDM).
Nayan Mehta Chief Financial Officer He is a C.A. and Cost and Works Accountant by qualification and has over 25 years of experience. He worked in NSE (AVP Finance), MCX (CFO) and CARE (Joint GM, Accounts) prior to joining BSE as a CFO in 2012.
Nehal Vora Chief Regulatory Officer
19+ years of experience in area of legal and compliance. Has worked with SEBI for 10 years and worked as a Director Law & Compliance at DSP Merrill Lynch Ltd.
Neeraj Kulshrestha Chief of Business Operations
25+ years of experience in capital markets, joined BSE in May-16. He heads the trading and listing business. Prior to BSE he worked with Morgan Stanley India as ED, he was with NSE managing operations and also worked as a CEO of India Index Services Ltd. and Dotex International Ltd. He completed his MBA from IIM Indore.
Kersi Tavadia Chief Information Officer
30+ years of experience in the area of Application Systems/IT Infrastructure development. Played an important role in transforming BSE into the fastest exchange. Prior to BSE he worked with Log-in Utility and Invest Smart Financial Services Ltd.
Source: Company, HDFC sec Inst Research
BSE board has approved reappointment of Ashish Chauhan as the CEO of the company for another five years (Nov-17 to Nov-22)

BSE : INITIATING COVERAGE
Page | 29
Valuation: Global exchanges
Country M-Cap Revenue
growth (2-yr CAGR)
EBITDA %
EPS growth (2-yr CAGR)
PEG (x)
Forward P/E (x) Forward P/B (x) EV/EBITDA (x) ROE (%)
(US$ bn) 1-yr fwd 2-yr fwd 1-yr fwd 2-yr fwd 1-yr fwd 2-yr fwd 1-yr
fwd 2-yr fwd
Emerging markets BSE (HDFC Sec estimates) India 0.81 11.7 13.0 18.5 1.2 23.0 21.5 1.7 1.7 15.8 8.5 7.6 8.0 MCX (HDFC Sec estimates) India 0.84 15.2 33.3 15.5 2.0 38.6 31.8 3.8 3.6 45.3 31.7 10.0 11.5 Bloomberg Consensus estimates BM&FBovespa SA Brazil 14.8 10.9 72.8 14.3 1.5 24.1 21.5 1.9 1.9 16.0 13.0 8.6 9.8 Bursa Malaysia Bhd Malaysia 1.3 3.4 59.2 3.6 6.7 24.8 24.0 6.5 6.4 11.2 10.9 27.0 27.7 Bolsa Mexicana Mexico 10.6 6.8 54.7 8.5 1.9 17.4 16.0 3.1 3.0 10.3 9.6 31.0 19.3 Multi Commodity Exchange India 0.8 40.4 34.0 26.5 0.8 32.2 22.5 3.4 3.2 39.6 21.2 15.0 15.5 BSE India 0.8 9.1 42.7 8.2 2.8 24.8 22.9 1.9 1.9 9.8 9.0 8.2 8.8 EM average 14.1 52.7 12.2 2.7 24.6 21.4 3.4 3.3 17.4 12.7 18.0 16.2 Developed markets CME Group USA 43.0 5.1 72.3 8.1 2.9 26.3 23.8 2.0 2.1 16.4 15.3 8.7 8.8 Hong Kong Exchanges Hong Kong 32.5 9.2 71.8 11.4 2.8 35.9 32.1 7.5 7.2 17.8 15.9 23.0 24.3 Intercontinental Exchange USA 38.5 5.4 64.0 12.3 1.6 22.2 19.5 2.4 2.3 14.8 13.6 12.1 13.1 Deutsche Boerse Germany 20.4 6.7 58.5 12.5 1.3 18.9 16.7 3.6 3.2 12.1 11.0 20.2 20.3 Nasdaq OMX USA 12.7 4.2 53.0 7.7 2.2 18.5 16.8 2.3 2.1 12.3 11.6 13.7 18.9 Japan Exchange Group Japan 9.4 2.8 61.0 2.2 10.6 23.9 23.8 3.7 3.6 14.2 14.0 15.1 14.7 Singapore Exchange Singapore 5.9 4.2 57.5 2.0 10.1 21.5 20.2 7.4 6.9 14.6 13.8 34.8 31.6 ASX Australia 8.3 4.6 75.7 5.0 4.5 23.5 22.4 2.7 2.6 15.6 14.9 11.9 12.3 CBOE Holdings USA 11.2 9.1 63.7 10.5 2.4 29.4 25.6 3.8 3.6 19.2 16.1 19.1 20.1 Hellenic Exchanges Greece 0.4 22.7 38.5 58.3 0.5 48.9 26.5 2.7 2.6 18.8 11.0 10.5 13.9 Developed markets average 7.4 61.6 13.0 3.9 26.9 22.7 3.8 3.6 15.6 13.7 16.9 17.8 Global average 10.8 57.1 12.6 3.3 25.8 22.1 3.6 3.4 16.5 13.2 17.4 17.0
Source: Bloomberg, HDFC sec Inst Research Note: 1-yr refers to FY18/CY17 & 2-yr FY19/CY18
Key Risks
Increased Competition from other exchanges, market share loss Regulatory delays Technology risks Delay in monetisation of investments in new platforms like StAR MF and India INX

BSE : INITIATING COVERAGE
Page | 30
Income Statement (Consolidated) YE March (Rs mn) FY16 FY17 FY18E FY19E FY20ENet Revenues (Rs mn) 4,248 5,172 4,169 4,632 5,160 Growth (%) 17.6 21.8 (19.4) 11.1 11.4 Employee Expenses 1,074 1,415 1,209 1,297 1,445 Technology Expenses 806 1,055 1,063 1,158 1,238 Other operating Expenses 1,695 1,734 1,355 1,390 1,522 EBITDA 672.4 968.7 542.0 787.5 954.7 EBITDA Margin (%) 15.8 18.7 13.0 17.0 18.5 EBITDA Growth (%) 61.2 44.1 (44.1) 45.3 21.2 Depreciation 537 540 459 510 568 EBIT 136 429 83 278 387 Other Income (Including EO Items) 1,987 2,627 2,509 2,464 2,591 Interest 3 10 10 10 10 PBT 2,119 3,047 2,583 2,732 2,968 Tax (Incl Deferred) 371 406 517 546 594 Minority Interest 442 445 0 0 0 Share of profit / (Loss) of associate 22 11 242 283 333 RPAT 1,329 2,206 2,308 2,469 2,708 EO (Loss) / Profit (Net Of Tax) (466) (208) 0 0 0 APAT 1,795 2,414 2,308 2,469 2,708 APAT Growth (%) (0.5) 34.4 (4.4) 7.0 9.7 Adjusted EPS (Rs) 33.4 44.9 42.9 45.9 50.3 EPS Growth (%) (0.5) 34.4 (4.4) 7.0 9.7 Source: Company, HDFC sec Inst Research
Balance Sheet (Consolidated) YE March (Rs mn) FY16 FY17 FY18E FY19E FY20E SOURCES OF FUNDS Share Capital - Equity 107 108 108 108 108 Reserves 25,122 26,516 30,243 30,823 31,438 Total Shareholders Funds 25,229 26,624 30,350 30,931 31,545 Settlement guarantee fund 1,761 2,045 2,045 2,045 2,045 Minority Interest 2,373 2,909 2,909 2,909 2,909 Total Debt 0 0 0 0 0 Net Deferred Taxes (Net) (26) (189) (189) (189) (189) Long Term Provisions & Others 81 88 71 79 88 TOTAL SOURCES OF FUNDS 29,418 31,477 35,186 35,775 36,398 APPLICATION OF FUNDS Net Block 1,559 1,644 1,686 1,732 1,784 CWIP 26 60 60 60 60 Goodwill 850 850 850 850 850 Investments 15 26 26 26 26 LT Loans & Advances & Others 4,425 3,440 2,918 3,243 3,612 Total Non-current Assets 6,876 6,020 5,540 5,910 6,332 Inventories 0 0 0 0 0 Debtors 472 687 514 571 636 Other Current Assets 901 740 584 649 722 Cash & Equivalents 34,126 44,194 44,412 46,270 48,343 Total Current Assets 35,500 45,621 45,510 47,490 49,701 Trading margin from members 4,780 4,776 5,364 6,055 6,870 Other Current Liabilities & Provns 8,177 15,389 10,499 11,571 12,765 Total Current Liabilities 12,958 20,164 15,864 17,626 19,635 Net Current Assets 22,542 25,457 29,646 29,864 30,066 TOTAL APPLICATION OF FUNDS 29,418 31,477 35,186 35,775 36,398 Source: Company, HDFC sec Inst Research

BSE : INITIATING COVERAGE
Page | 31
Cash Flow (Consolidated) YE March (Rs mn) FY16 FY17 FY18E FY19E FY20EReported PBT 2,119 3,047 2,583 2,732 2,968 Non-operating & EO items (1,472) (2,551) (2,509) (2,464) (2,591)Interest expenses 7 10 10 10 10 Depreciation 617 540 459 510 568 Working Capital Change (825) 7,981 (3,466) 1,324 1,510 Tax Paid (733) (406) (517) (546) (594)OPERATING CASH FLOW ( a ) (287) 8,620 (3,441) 1,565 1,871 Capex (621) (564) (500) (556) (619)Free cash flow (FCF) (909) 8,056 (3,941) 1,009 1,251 Investments 143 (11) 0 0 0 Non-operating Income 1,642 2,835 2,509 2,464 2,591 INVESTING CASH FLOW ( b ) 1,163 2,261 2,009 1,908 1,971 Debt Issuance/(Repaid) (17) 0 0 0 0 Interest Expenses (7) (10) (10) (10) (10)FCFE (933) 8,046 (3,951) 999 1,242 Share Capital Issuance/CDSL IPO proceeds (10) 0 3,160 0 0
Dividend (1,244) (1,506) (1,500) (1,605) (1,760)FINANCING CASH FLOW ( c ) (1,278) (1,516) 1,650 (1,614) (1,770)NET CASH FLOW (a+b+c) (402) 9,365 218 1,858 2,072 EO Items, Others (1,441) 703 0 0 0 Closing Cash & Equivalents 34,126 44,194 44,412 46,270 48,343 Source: Company, HDFC sec Inst Research
Key Ratios (Consolidated) FY16 FY17 FY18E FY19E FY20E PROFITABILITY (%) GPM 74.7 72.6 71.0 72.0 72.0 EBITDA Margin 15.8 18.7 13.0 17.0 18.5 APAT Margin 42.3 46.7 55.4 53.3 52.5 RoE 7.1 9.1 7.6 8.0 8.6 RoIC (or Core RoCE) 5.2 16.9 2.7 5.9 9.6 RoCE 6.2 8.0 6.9 7.0 7.5 EFFICIENCY Tax Rate (%) 17.5% 13.3% 20.0% 20.0% 20.0% Fixed Asset Turnover (x) 0.9 1.0 0.7 0.7 0.7 Inventory (days) 0 0 0 0 0 Debtors (days) 41 48 45 45 45 Other Current Assets (days) 77 52 51 51 51 Payables (days) 411 337 470 477 486 Other Current Liab & Provns (days) 703 1,086 919 912 903 Cash Conversion Cycle (days) (995) (1,322) (1,293) (1,293) (1,293) Debt/EBITDA (x) 0.0 0.0 0.0 0.0 0.0 Net D/E (x) -1.4 -1.7 -1.5 -1.5 -1.5 Interest Coverage (x) 41 45 9 29 40 PER SHARE DATA (Rs) EPS 33.4 44.9 42.9 45.9 50.3 CEPS 43.4 54.9 51.4 55.4 60.9 Dividend 23.2 28.0 27.9 29.8 32.7 Book Value 469.8 494.9 564.1 574.9 586.3 VALUATION P/E (x) 29.5 22.0 23.0 21.5 19.6 P/BV (x) 2.1 2.0 1.7 1.7 1.7 EV/EBITDA (x) 27.9 9.1 15.8 8.5 4.9 OCF/EV (%) (1.5) 97.9 (40.1) 23.3 40.2 FCF/EV (%) (4.8) 91.5 (45.9) 15.0 26.9 FCFE/Mkt Cap (%) (1.8) 15.2 (7.5) 1.9 2.3 Dividend Yield (%) 2.4 2.8 2.8 3.0 3.3 Source: Company, HDFC sec Inst Research

BSE : INITIATING COVERAGE
Page | 32
Rating Definitions BUY : Where the stock is expected to deliver more than 10% returns over the next 12-month period NEUTRAL : Where the stock is expected to deliver (-)10% to 10% returns over the next 12-month period SELL : Where the stock is expected to deliver less than (-)10% returns over the next 12-month period
Date CMP Reco Target29-Aug-17 985 BUY 1,200
800850900950
1,0001,0501,1001,1501,200
Feb-
17
Mar
-17
Apr-
17
May
-17
Jun-
17
Jul-1
7
Aug-
17
BSE TP
RECOMMENDATION HISTORY

BSE : INITIATING COVERAGE
Page | 33
Disclosure: We, Amit Chandra, MBA, & Apurva Prasad, MBA, authors and the names subscribed to this report, hereby certify that all of the views expressed in this research report accurately reflect our views about the subject issuer(s) or securities. HSL has no material adverse disciplinary history as on the date of publication of this report. We also certify that no part of our compensation was, is, or will be directly or indirectly related to the specific recommendation(s) or view(s) in this report. Research Analyst or his/her relative or HDFC Securities Ltd. does not have any financial interest in the subject company. Also Research Analyst or his relative or HDFC Securities Ltd. or its Associate may have beneficial ownership of 1% or more in the subject company at the end of the month immediately preceding the date of publication of the Research Report. Further Research Analyst or his relative or HDFC Securities Ltd. or its associate does not have any material conflict of interest. Any holding in stock –No HDFC Securities Limited (HSL) is a SEBI Registered Research Analyst having registration no. INH000002475. Disclaimer: This report has been prepared by HDFC Securities Ltd and is meant for sole use by the recipient and not for circulation. The information and opinions contained herein have been compiled or arrived at, based upon information obtained in good faith from sources believed to be reliable. Such information has not been independently verified and no guaranty, representation of warranty, express or implied, is made as to its accuracy, completeness or correctness. All such information and opinions are subject to change without notice. This document is for information purposes only. Descriptions of any company or companies or their securities mentioned herein are not intended to be complete and this document is not, and should not be construed as an offer or solicitation of an offer, to buy or sell any securities or other financial instruments. This report is not directed to, or intended for display, downloading, printing, reproducing or for distribution to or use by, any person or entity who is a citizen or resident or located in any locality, state, country or other jurisdiction where such distribution, publication, reproduction, availability or use would be contrary to law or regulation or what would subject HSL or its affiliates to any registration or licensing requirement within such jurisdiction. If this report is inadvertently send or has reached any individual in such country, especially, USA, the same may be ignored and brought to the attention of the sender. This document may not be reproduced, distributed or published for any purposes without prior written approval of HSL. Foreign currencies denominated securities, wherever mentioned, are subject to exchange rate fluctuations, which could have an adverse effect on their value or price, or the income derived from them. In addition, investors in securities such as ADRs, the values of which are influenced by foreign currencies effectively assume currency risk. It should not be considered to be taken as an offer to sell or a solicitation to buy any security. HSL may from time to time solicit from, or perform broking, or other services for, any company mentioned in this mail and/or its attachments. HSL and its affiliated company(ies), their directors and employees may; (a) from time to time, have a long or short position in, and buy or sell the securities of the company(ies) mentioned herein or (b) be engaged in any other transaction involving such securities and earn brokerage or other compensation or act as a market maker in the financial instruments of the company(ies) discussed herein or act as an advisor or lender/borrower to such company(ies) or may have any other potential conflict of interests with respect to any recommendation and other related information and opinions. HSL, its directors, analysts or employees do not take any responsibility, financial or otherwise, of the losses or the damages sustained due to the investments made or any action taken on basis of this report, including but not restricted to, fluctuation in the prices of shares and bonds, changes in the currency rates, diminution in the NAVs, reduction in the dividend or income, etc. HSL and other group companies, its directors, associates, employees may have various positions in any of the stocks, securities and financial instruments dealt in the report, or may make sell or purchase or other deals in these securities from time to time or may deal in other securities of the companies / organizations described in this report. HSL or its associates might have managed or co-managed public offering of securities for the subject company or might have been mandated by the subject company for any other assignment in the past twelve months. HSL or its associates might have received any compensation from the companies mentioned in the report during the period preceding twelve months from t date of this report for services in respect of managing or co-managing public offerings, corporate finance, investment banking or merchant banking, brokerage services or other advisory service in a merger or specific transaction in the normal course of business. HSL or its analysts did not receive any compensation or other benefits from the companies mentioned in the report or third party in connection with preparation of the research report. Accordingly, neither HSL nor Research Analysts have any material conflict of interest at the time of publication of this report. Compensation of our Research Analysts is not based on any specific merchant banking, investment banking or brokerage service transactions. HSL may have issued other reports that are inconsistent with and reach different conclusion from the information presented in this report. Research entity has not been engaged in market making activity for the subject company. Research analyst has not served as an officer, director or employee of the subject company. We have not received any compensation/benefits from the subject company or third party in connection with the Research Report. HDFC securities Limited, I Think Techno Campus, Building - B, "Alpha", Office Floor 8, Near Kanjurmarg Station, Opp. Crompton Greaves, Kanjurmarg (East), Mumbai 400 042 Phone: (022) 3075 3400 Fax: (022) 2496 5066 Compliance Officer: Binkle R. Oza Email: [email protected] Phone: (022) 3045 3600 HDFC Securities Limited, SEBI Reg. No.: NSE-INB/F/E 231109431, BSE-INB/F 011109437, AMFI Reg. No. ARN: 13549, PFRDA Reg. No. POP: 04102015, IRDA Corporate Agent License No.: HDF 2806925/HDF C000222657, SEBI Research Analyst Reg. No.: INH000002475, CIN - U67120MH2000PLC152193 Mutual Funds Investments are subject to market risk. Please read the offer and scheme related documents carefully before investing.

BSE : INITIATING COVERAGE
Page | 34
HDFC securities Institutional Equities Unit No. 1602, 16th Floor, Tower A, Peninsula Business Park, Senapati Bapat Marg, Lower Parel,Mumbai - 400 013 Board : +91-22-6171 7330 www.hdfcsec.com