Initiating Coverage | 15 June 2015 Solar · PDF file · 2015-06-16Demand for...
34
Explosive growth ahead Solar Industries Initiating Coverage | 15 June 2015 Sector: Capital Goods Amit Shah ([email protected]);+91 22 3029 5126 Satyam Agarwal ([email protected]);+91 22 3982 5410 Increasing contribution of high margin business Take off stage, with initial orders received Intensifying mining efforts
Transcript of Initiating Coverage | 15 June 2015 Solar · PDF file · 2015-06-16Demand for...

Explosive growth ahead
Solar Industries
Initiating Coverage | 15 June 2015
Sector: Capital Goods
Amit Shah ([email protected]);+91 22 3029 5126
Satyam Agarwal ([email protected]);+91 22 3982 5410
Increasing contribution of highmargin business
Take off stage, with initialorders received
Intensifying mining efforts

Solar Industries
15 June 2015 2
SOLAR INDUSTRIES: Explosive growth ahead
Summary ............................................................................................................. 3
Intensifying mining efforts to aid demand growth ................................................. 4
Well positioned; diversified product portfolio ....................................................... 9
Overseas business: Exploring new geographies ................................................... 13
Defense: Initial orders received .......................................................................... 17
Initiate coverage with Buy rating ........................................................................ 19
Company background ......................................................................................... 22
Annexure 1: Coal India Volumes at inflection point ............................................. 25
Financials and valuations .................................................................................... 31
Investors are advised to refer through disclosures made at the end of the Research Report.
Motilal Oswal research is available on www.motilaloswal.com/Institutional-Equities, Bloomberg, Thomson Reuters, Factset and S&P Capital.

Solar Industries
15 June 2015 3
Dynamite! Explosive growth ahead Structural growth drivers in place across businesses
n Domestic demand for explosives is likely to increase meaningfully, with ramp-up of coal production and pick up in infrastructure activities. As India’s largest manufacturer of industrial explosives, SOIL will be a key beneficiary.
n While visibility in the domestic business is improving, expansion into new geographies overseas and the fledgling defense business would drive the next phase of growth.
n We expect 18% CAGR in consolidated revenue till FY17, with improving margins. We initiate coverage, with a Buy rating.
Domestic business: Intensifying mining efforts to aid demand growth SOIL is the largest manufacturer of industrial explosives and initiating systems in India, with ~24% share (in volumes). Over FY09-15, explosives volume growth was constrained at just 3.4%, exactly mirroring the CAGR in coal production. We believe FY16 will be the turning point (with growth rates of 13.8%), given intense efforts to improve coal availability through (i) auction / transfer of de-allocated mines,(ii) attempts by Coal India to double production to 1b tons. We expect SOIL to witness volume CAGR of 17% during FY15-17, with possibilities of more meaningful ramp-up going forward.
Overseas business: Exploring new geographies SOIL currently exports explosives to 22 countries and has a dominant market share of 43%. The size of global explosives industry is ~USD10b, and there exists headroom to increase exports, given cost competitiveness. As the next logical step, SOIL set up manufacturing operations in key markets like Zambia, Nigeria and Turkey, with local partners; these are now being leveraged to export to nearby countries. We expect revenue CAGR of 20% during FY15-17 in overseas operations, largely led by commissioning of new manufacturing plants, exports to nearby countries and expansion into new geographies.
Defense: Take-off stage, with initial orders received SOIL forayed into the defense segment in FY11, and has positioned itself as a key supplier of HMX and propellants for the indigenous missile program. For SOIL, the defense business is now more predictable, given that initial orders for both the products have already being received. At optimum levels, we expect this segment to contribute ~INR7b to revenues, with EBITDA margin of ~20%.
Initiate coverage with Buy rating, Target Price INR4,100 (30x FY17E) We value SOIL at 30x FY17E EPS (earnings CAGR of 25% over FY15-17) to factor in the possibility of continued strong growth, with ramp-up in mining/infrastructure activities in India, increasing penetration overseas and also an inflexion point in defence revenues. The premium valuations are also justified given that optimum revenues for defence business stands at ~INR7b (possibly ~FY20), while revenues in FY17E are estimated at just INR1b; this translates into negligible profits for the business in FY17E versus possible EPS of INR45-50 at optimum revenue levels of INR7b.
Initiating Coverage | Sector: Capital Goods
Solar Industries CMP: INR3,542 TP: INR4,100 (+16%) Buy
BSE Sensex S&P CNX
26,587 8,014
Stock Info
Bloomberg SOIL IN
Equity Shares (m) 18.1
M.Cap. (INR b)/(USD b) 64.1/1.0
52-Week Range (INR) 3,890/1,800 1, 6, 12 Rel. Per (%) 7/26/85 Avg Val(INRm)/Vol‘000 17/9 Free float (%) 27.1
Financial Snapshot (INR Billion)
Y/E Mar 2015 2016E 2017E Net Sales 13.5 16.1 19.0 EBITDA 2.5 3.3 4.0 Adj PAT 1.1 1.3 1.6 EPS (INR) 85.9 113.6 136.2 EPS Gr. (%) 22.9 32.3 19.9 BV/Sh. (INR) 428.7 519.6 628.6 RoE (%) 20.0 21.9 21.7 RoCE (%) 19.0 19.4 21.2 P/E (x) 41.2 31.2 26.0 P/BV (x) 8.3 6.8 5.6
Shareholding Pattern (%)
As on Mar-15 Dec-14 Mar-14
Promoter 72.9 72.9 72.8
DII 17.8 18.1 18.1
FII 1.1 0.8 1.2 Others 8.2 8.2 8.0
Notes: FII incl. depository receipts
Stock Performance (1-year)

Solar Industries
15 June 2015 4
Intensifying mining efforts to aid demand growth FY16 the turning point for sustained growth in explosives demand
Demand for explosives is directly correlated to mining activity. During FY09-15, industry
volume growth was constrained at just 3.4%, exactly mirroring the CAGR in coal
production. Growth rates improved to 7.5% in FY15, supported by 6.7% increase in coal
production. We believe FY16 will be the turning point for explosives demand in India (with
growth rates of 13.8% YoY), given the intense efforts to improve coal availability by 2.5x
till FY20 through (i) auction/transfer of de-allocated mines, and (ii) attempts by Coal India
to double production to 1b tons by FY20. We expect SOIL to witness a robust volume CAGR
of 19% over FY15-17, with possibilities of a more meaningful upside as coal production
gets accelerated.
Revving up domestic mining efforts to support growth Demand for explosives is directly correlated to mining activity. The mining segment contributes ~85% of the explosives demand in India. Within mining, coal is the largest contributor, accounting for ~80% of the mining sector’s explosives usage. Over FY09-15, volume growth in the explosives industry was constrained at just 3.4%, exactly mirroring the CAGR in coal production. Volume growth rates improved to 7.5% in FY15, supported by 6.7% increase in coal production and 6% increase in cement demand. Over FY16-17, we expect explosives demand to grow at 14% CAGR. Growth could accelerate from FY18, given the efforts to increase domestic coal production by ~2.5x till FY20 and possibility of an accelerated pick-up in infrastructure capex. We would be watchful of such trends. FY16 will be the turning point for explosives demand in India n Intense efforts are underway to increase coal availability by 2.5x till FY20 (FY15
production at 604m tons) through (i) auction / transfer of 204 de-allocated mines (of which 101 round-1 mines have a production potential of 374m tons per annum), and (ii) attempts by Coal India to double production to 1b tons by FY20.
n We expect iron ore production to grow from 122m tons in FY15 to 157m tons in FY17, largely supported by (i) lifting of the mining ban in Goa, (ii) private miners securing necessary clearances in Karnataka, and (iii) increase in environment clearance limit of a few private mines in Odisha and re-opening of 18 mines in Odisha/ 12 mines in Jharkhand, post lease extension. Over the longer term, auction of 199 leases (across all minerals) will be an important trigger to increase production.
n Increased infrastructure and construction activities will lead to improved cement demand, again supporting increased limestone mining.
Coal: Attempt to increase production 2.5x by FY20
Iron ore: Expect production to increase from 122m tons
in FY15 to 157m tons in FY17
Cement demand a function of increased construction

Solar Industries
15 June 2015 5
Exhibit 1: Production trends (m tons) – improved mining efforts / construction activity visible from FY15
Source: MOSL, Company
Exhibit 2: Expect 14% CAGR in explosives demand till FY17 versus sluggish growth rates in FY13-14
Source: MOSL, Company
Exhibit 3: Explosives demand in mining sector to grow at 12% per year over FY16-17 versus muted CAGR of 3% during FY10-14 FY09 FY10 FY11 FY12 FY13 FY14 FY15 FY16E FY17E Production (m Tons)
Coal 493 515 524 535 556 566 604 674 744 Iron Ore 215 219 207 167 137 152 127 145 157 Cement 181 207 229 247 251 256 271 290 319 Explosives Required per m ton of ore production (assuming 1% increase in OB ratio pa) Coal 1,027 1,037 1,048 1,059 1,069 1,080 1,091 1,102 1,113 Iron Ore 190 192 194 196 198 200 202 204 206 Cement 158 159 161 163 164 166 168 169 171 Explosive Required for Mining (000 Tons) Coal 506 534 549 566 594 611 659 743 828 Iron Ore 41 42 40 33 27 30 26 30 32 Cement 29 33 37 40 41 42 45 49 55 Total 576 609 626 639 663 684 730 821 915
% YoY 5.8% 2.8% 2.1% 3.7% 3.2% 6.7% 12.5% 11.4%
Source: MOSL, Company
Expect SOIL to witness robust volume CAGR of 17% over FY15-17 vs 8% in FY13-15 We expect SOIL to witness robust volume CAGR of 17% over FY15-17, with possibilities of a more meaningful upside as coal production gets accelerated. This compares with the muted volume growth of 8% during FY13-15. During end-FY15, SOIL made two acquisitions, namely M/s Blastec (India) Pvt Ltd & M/s EmulTek Pvt Ltd for INR83m. This will increase the licensed capacity of bulk explosives by 55,000 tons and take the total capacity to 270,000 tons. These acquisitions should add ~18,000 tons (14% of FY15 bulk sales), supporting volumes. SOIL’s newly commissioned facility at Kothagudem (Andhra Pradesh) along with two new facilities at Barbil (Odisha) and Kota (Rajasthan) will also contribute significantly to the volume growth in FY16 / FY17. During FY09-15, SOIL’s market share in the domestic explosives market increased from 16% to ~24% and we expect the same to improve during FY17, led by commissioning of new bulk plants and also supported by a dominating presence in cartridges.
-
200
400
600
800
FY09
FY10
FY11
FY12
FY13
FY14
FY15
FY16
E
FY17
E
Coal Iron Ore Cement
0.6 0.6 0.5 0.7 0.8 0.8 0.8
1.0 1.1
3%-12%
33%
6% 4% 6%14% 14%
FY09
FY10
FY11
FY12
FY13
FY14
FY15
FY16
E
FY17
E
Explosives (m tons) % YoY

Solar Industries
15 June 2015 6
Exhibit 4: SOIL market share in explosives to increase (%)
Source: MOSL, Company
Exhibit 5: Expect SOIL’s volume growth at 17% in FY15-17E
Source: MOSL, Company
Increased urgency to ramp up coal production The government’s urgency towards addressing fuel availability challenges has been impressive, though initial gains in terms of incremental production will be realized with a time lag of 18-24 months. Domestic coal production in FY15 stood at 604m tons, while (1) coal mine auction (round-1, 101 coal blocks) is likely to improve availability by 374m tons per annum, and (2) Coal India has been indicated a target of 1b tons production by FY20 (near doubling from current levels). Supporting initiatives in terms of addressing evacuation bottlenecks and expediting environment and forest clearances have also witnessed initial progress. Still, execution remains the key and we would be watchful of the trends. Coal mine auction: Expect availability to power sector to increase ~200mtons from round-1 blocks
The Supreme Court (SC) judgment de-allocated 204 coal blocks. For operating mines, bidding was largely completed in February 2015 (annual production of ~43m tons) and another ~132m tons per annum of production capacity was allocated to the State sector (including CPSUs, etc). Classification of blocks and sequencing of auctioning: The comprehensive list of 204 coal blocks is the schedule I list. The ordinance has classified: n 42 operating coal blocks (geological resources of 3.7b tons) under schedule II, n 32 blocks at advanced stage of commissioning, with most clearances in place
(geological resources of 4.7b tons) are grouped under schedule III, and n 27 blocks have been transferred from schedule I to III. Based on the clearance granted for schedule II and III blocks, the total production potential stands at ~374m tons, comprising of: 82m tons from 42 operating coal blocks, 125m tons from 32 near-commissioning blocks, and ~166m tons from 27 blocks shifted from schedule I to III.
16.1
%
18.4
%
23.5
%
21.9
% 24.9
%
22.2
% 25.6
%
26.9
%
27.2
%
FY09
FY10
FY11
FY12
FY13
FY14
FY15
FY16
E
FY17
E
96,2
11
113,
345
127,
675
158,
162
189,
682
175,
765
221,
614
265,
000
304,
750
17.8
%
12.6
% 23.9
%
19.9
%
- 7.3
%
26.1
%
19.6
%
15.0
%
FY09
FY10
FY11
FY12
FY13
FY14
FY15
FY16
E
FY17
E
Tons % YoY
While Coal India’s 1b ton target by FY20 looks
ambitious, our detailed mine-wise analysis suggests
~10% CAGR in production over FY15-20 to ~780m tons
Please refer our Utilities/Metals sector
report dated 11 Dec 2014
#1

Solar Industries
15 June 2015 7
Exhibit 6: Summary of coal mine producing capacity (mtpa) in round-1 auction
Source: MOSL, Ministry of Coal
Exhibit 7: Coal mine capacity bifurcation on allotment and auctioning basis
Source: MOSL, Ministry of Coal
Coal India targets production of 1b tons by FY20
Coal India has been indicated a gross target to produce 1b tons of coal by FY20, which entails near doubling of the current production levels. The expected growth is to be supported by (i) brownfield as well as greenfield projects, (ii) completion of ‘New Railway Infrastructure Projects’, including completion of three critical railway lines,(iii) faster environment and forestry clearances, (iv) completion of rehabilitation &resettlement and speedier land acquisition, (v) improvement in law & order situation, and (vi) technology improvement in mining and related infrastructure. The government press release on the subject stated that of the 1b tons target, 908m tons are expected from identified projects. Also, Mahanadi Coalfields and South Eastern Coalfields are likely to produce 250m tons and 240m tons, respectively by FY20, and will be the largest contributors to the production increase. Exhibit 8: Coal India production to grow by 10% CAGR over FY15-20E
Source: MOSL, Company
Please refer to Annexure 1 for detailed analysis on Coal India’s volume growth
62
2 18
82
262
13 17
292
323 (63) 15 (4) 35 (34) 374 (101)
Pow
er
Stee
l
Non
re
gula
ted
Tota
l coa
l m
inin
g ca
paci
ty
Schedule II (no.of blocks) Schedule III (no. of blocks)
Auction49%
(62 blocks)Allotment51%
(23 blocks)26
7
280
291
306
324
342
360
378
403
430
431
436
453
461
494
534
576
646
717
781
FY01
FY02
FY03
FY04
FY05
FY06
FY07
FY08
FY09
FY10
FY11
FY12
FY13
FY14
FY15
E
FY16
E
FY17
E
FY18
E
FY19
E
FY20
EProduction (m ton)
Please refer our Coal India report dated 11 May 2015
#2

Solar Industries
15 June 2015 8
Streamlining MOEF clearances to expedite capacity augmentation
Exhibit 9: Several steps taken to streamline MOEF clearances to boost coal production Web portal system Online system for providing environment (from June 2014) and forest clearances (July 2014) Will allow monitoring on the entire process and adhering to the timeline of every step Delinking from wildlife impact assessment Delinking of forest clearances from wildlife impact assessments Relaxed norms for forest clearances Reduced forest cover requirements for compensatory afforestation from 50% to 33% More powers to Regional Empowered Committees to process forest clearances at regional levels Granted authority to states to approve forest clearance up to 100 acres versus12.5 acres earlier Forest Survey of India to launch new forest database; make it easier to base decisions on scientific data Boost mining / coal production Mining projects that have received environment clearance (EC)earlier need not apply for fresh EC while renewing the mining lease Group clearances for adjacent mines, rather than individual projects
94 clusters have been identified for Coal India; there would be only one public hearing for the identified cluster, instead of examining one mine at a time
Source: MOSL, Company
Ministry of Environment and Forests (MOEF) has
taken various measures to expedite clearances for
power and mining projects
#3#

Solar Industries
15 June 2015 9
Well positioned; diversified product portfolio Leadership position in a highly regulated market
Explosives market is highly consolidated, with top-6 companies accounting for 74% share. SOIL is the largest manufacturer of industrial explosives and initiating systems in India, with ~24% market share (FY15) in volume terms. Over the years, the company has expanded into all segments of explosives and also backward integrated into manufacturing raw materials. These strategic initiatives have supported market share gains, and have solidified the leadership position in a highly regulated market.
Manufacturing, trading and selling of explosives is a highly regulated industry, given the various approvals and licenses required, which acts as a key entry barrier. Another important success factor in bulk explosives is proximity to the customer. The market is highly consolidated, with top-6 companies accounting for 74% share. SOIL is the largest manufacturer of industrial explosives and initiating systems in India, with ~24% market share (in volumes). Over the years, the company has expanded into all segments of explosives including bulk, cartridges, detonators, detonating fuse, HMX, and propellants. It has also backward integrated into manufacturing raw materials like PentaerythritolTetranitrate (PETN – used in detonators), sodium nitrate, calcium nitrate, zinc nitrate, and stypnic acid. With a network of 16 bulk plants located within a radius of 50-60km of key mining regions, SOIL is strategically positioned.
Exhibit 10: SOIL has a dominant market share in industrial explosives in India (%)
Source: MOSL, Company
Exhibit 11: SOIL’s volume market share has increased meaningfully over the last six years
Source: PESO, MOSL
SOIL, 24%
Orica, 16%
IBP (IOC), 11%
Gulf Oil, 10%
Keltech Energies, 5
%
Premier Explosives,
5%
Others, 29%
16.1
% 18.4
%
23.5
%
21.9
% 24.9
%
22.2
% 24.0
%
FY09
FY10
FY11
FY12
FY13
FY14
FY15

Solar Industries
15 June 2015 10
Exhibit 12: SOIL has a dominating share in most segments of the explosives market Units FY09 FY10 FY11 FY12 FY13 FY14 Indian Explosives market - Bulk Tons 343,018 389,826 359,943 483,828 495,946 521,419 - Cartridge Tons 254,808 225,615 183,534 238,193 267,275 269,999 - Detonator m Units 610 698 724 971 992 1,032 - Detonator Fuse m Units 334 391 285 371 634 428 SOIL Volumes - Bulk Tons 55,000 57,857 79,980 94,962 114,326 106,988 - Cartridge Tons 41,211 55,488 47,695 63,200 75,356 68,776 - Detonator m Units 71 103 108 118 141 130 - Detonator Fuse m Units 27 29 59 67 47 52 SOIL Market Share (%) 16.1% 18.4% 23.5% 21.9% 24.9% 22.2% - Bulk 16.0% 14.8% 22.2% 19.6% 23.1% 20.5% - Cartridge 16.2% 24.6% 26.0% 26.5% 28.2% 25.5% - Detonator 11.6% 14.8% 14.9% 12.2% 14.2% 12.6% - Detonator Fuse 8.1% 7.5% 20.7% 18.1% 7.4% 12.1%
Source: MOSL, Company, PESO
Exhibit 13: SOIL’s licensed capacity in India Units Capacity Details Bulk Explosives Tons 219,240 At 16 locations in 8 states, near to mines (50-60kms) Cartridge Explosives Tons 74,655 Largest manufacturing facility in world at single location Detonators m Units 190 Manufacturing at Chakdoh (Mah) and Sawanga (Mah) Detonating Fuse m Metres 75 Manufacturing at Chakdoh (Mah) Cast Boosters tons 1,500 Manufacturing at Chakdoh (Mah) PETN tons 1,650 Manufacturing at Chakdoh (Mah) HMX tons 50 Manufacturing at Chakdoh (Mah) Propellants Nos 2,500 Manufacturing at Chakdoh (Mah)
Source: MOSL, Company
Exhibit 14: Revenue composition (INR M)
FY11 FY12 FY13 FY14 FY15
Coal India 1,792 2,661 3,334 3,793 4,377 SCCL 467 725 866 243 1,090 Institutional & trade 2,519 3,612 4,476 4,389 5,036 Exports 748 658 896 1,199 607 Nigeria 709 743 1,074 1,488 1,543 Turkey 96 197 166 484 781 Zambia 145 692 614 356 1,037 AN High seas 753 1,030 598 87 - Others - - 110 125 101 Total 7,229 10,317 12,133 12,164 14,572
Source: MOSL, Company
Competition restricted by need for several licenses and approvals
Manufacturing an industrial explosive is strictly regulated - a number of approvals and licenses are required. Also, the manufacturing, marketing, transportation and consumption are governed by various directives. These regulations act as a strong entry barrier for any new entrant.
#1

Solar Industries
15 June 2015 11
Industrial explosives: Key licenses and approvals required n Industrial license from Department of Industrial Policy and Promotion,
Government of India. n Clearance from Home Ministry. n Clearance from Intelligence Bureau regarding the location’s safety and Directors
antecedant. n NoC from District Magistrate after clearance by Police, PWD and Gram
Panchayat. n License from Chief Controller of Explosives, Government of India. n Directorate General of Mines Safety’s permission is necessary for underground
gassy mines. Exhibit 15: Total number of approved manufacturers for selling explosives Product No of approved manufacturers / suppliers Nitrate mixture 37 Detonating fuse 23 Cast Booster 15 Detonators 14 Safety fuse 3 Micro Cord 1
Source: MOSL, Industry
Exhibit 16: Installed capacity and year-wise utilization of explosive manufacturing plants in India Product Units Installed capacity FY09 FY10 FY11 FY12 FY13 FY14 Gun Powder Tons 1,596 908 828 689 711 578 549 Cartridges Tons 580,387 254,808 225,615 183,534 238,193 267,275 269,999 Site mixed Tons 1,350,385 343,019 389,826 359,944 483,828 495,946 521,419 Booster & PETN Tons 16,419 3,206 4,449 2,574 5,063 5,657 6,186 Safety fuse M Metres 268 132 123 77 81 77 75 Detonating fuse M Metres 576 334 391 285 371 634 428 Detonators M Nos 974 610 698 724 971 992 1032
Source: MOSL, Industry
Proximity to mines an important entry barrier
SOIL has 20 bulk explosive plants in mineral-rich states like Maharashtra, Jharkhand, Chhattisgarh, Odisha, etc. One of the key success factors in bulk explosives is proximity to mines, as the mixture is pumped into the bulk delivery system (pump trucks) and sensitizers are added at the mine site just before charging into hole. Logistics costs and delivery time are critical and also important entry barriers. Exhibit 17: SOIL has a network of 20 bulk plants spread across strategic locations States Nos Key Clients Maharashtra 4 WCL, SCCL MP 3 NCL, Reliance Power (Sasan) Chattisgarh 3 SECL. Jindal Power, Sharda Energy, Lafarge, Adani Jharkhand 2 Tisco, CCL, BCCL Orissa 3 MCL, Tisco Andhra 2 SCCL Rajasthan 2 Hind Zinc, Jindal Saw WB 1 ECL
Source: MOSL, Company
In all, there are 48 firms that have valid licenses to
manufacture various types of explosives needed for
civil/defense purposes
#2

Solar Industries
15 June 2015 12
Control over raw material sourcing and backward integration The key raw material for manufacturing industrial explosives is ammonium nitrate (AN), contributing to ~70% of the consumption. SOIL procures most of the AN domestically from Rashtriya Chemicals and Fertilizers, Gujarat Narmada Fertilizer Corporation and Deepak Fertilizers. Balance raw material required like PETN, sodium nitrate, calcium nitrate, zinc nitrate, and stypnic acid are manufactured in-house. This enables SOIL to enjoy healthier margins than competitors.
#3

Solar Industries
15 June 2015 13
Overseas business: Exploring new geographies SOIL has a dominant 43% market share in explosive exports
SOIL currently exports explosives to 22 countries and has a dominant market share of 43% in explosive exports from India. Size of the global explosives industry is estimated at ~USD10b and there exists meaningful headroom to increase exports, given the Indian cost competitiveness. As the next logical step, the company set up manufacturing operations in key markets like Zambia, Nigeria and Turkey, with local partners. These manufacturing bases are now being leveraged to export to nearby countries. We expect revenue CAGR of 20% during FY15-17 in overseas operations, largely led by commissioning of new manufacturing plants in Zambia and Turkey, exports to nearby countries and expansion into new geographies.
Exports: SOIL has dominant 43% market share Explosives exports from India were INR2.8b in FY14, having grown at a CAGR of 16% since FY09. The size of the global explosives industry is estimated at ~USD10b, and there exists meaningful headroom to increase exports, given the Indian cost competitiveness. SOIL commenced explosives exports in FY04 to various countries in Africa, South East Asia and Middle East. Currently, it supplies to 22 countries and enjoys a dominant market share of 43% in exports. SOIL’s export revenue was INR1.2b in FY14, and declined to INR607m in FY15, particularly due to headwinds to global mining capex. During FY16, the management expects exports to reach a normative run-rate.
Exhibit 18: Global industrial explosives market (USD10b)
Source: MOSL, Company
Exhibit 19: SOIL’s export trend; decline in FY15 is due to headwinds to global mining capex
Source: MOSL, Company
Exhibit 20: Explosives exports / imports from India; SOIL has dominant market share Units FY09 FY10 FY11 FY12 FY13 FY14 Exports INR b 1.3 1.6 1.8 2.2 2.0 2.8 Imports INR b 0.3 0.6 0.4 0.4 0.5 0.9 SOIL Market Share % 55% 39% 41% 30% 44% 43%
Source: MOSL, Company
Expanding overseas presence by setting up manufacturing operations As the next logical step to exports, SOIL set up manufacturing operations in key markets with large demand potential. It ventured into overseas geographies in FY11 (in Zambia) by partnering with local trading companies to have the required licenses, post which it has been setting up explosives manufacturing capacities.
North America, 25
%
Australia, 16%
China, 13%LatAm, 12%
SE Asia, 7%
Africa, 7%
Russia, 5%
East Europe, 5%
West Europe, 5%
India, 5%
722 612
748 658
896
1,199
607
167%
-15%22%
-12%36% 34%
-49%
FY09 FY10 FY11 FY12 FY13 FY14 FY15
Exports (INR M) % YoY

Solar Industries
15 June 2015 14
Currently, SOIL has manufacturing operations in three countries: Zambia, Nigeria and Turkey. Recently, it commenced sales to nearby countries like Tanzania and Mozambique, leveraging the manufacturing base in these regions. n Zambia is ranked as the world’s sixth largest producer of copper, generating
4.4% of the western world’s production. Also, the country is land locked and shares borders with eight countries, including Zimbabwe, Tanzania, Namibia, Botswana, Angolaand Malawi.
n Mining production in Turkey in 2013 was sizable at USD12.8b. Also, there exist large unexplored reserves.
n In Nigeria, SOIL’s local partner, Nigachem Nigeria controlled the explosives market, with a share of over 80%.
Exhibit 21: SOIL’s overseas operations Stake % Product Capacity (Tons) Expansion (Tons) Zambia 65% Bulk 10,000 10,000
Cartridge 5,000
Nigeria 55% Bulk 2,000
Cartridge 5,000
Turkey 75% ANFO 40,000 Bulk 2,500 Cartridge 5,000 Detonators 6m Units
Source: MOSL, Company Exhibit 22: Financial performance of overseas operations (INR m) FY11 FY12 FY13 FY14 Revenues Zambia 148 692 614 356 Nigeria 718 743 1,074 1,488 Turkey 96 197 166 484 Total 962 1,631 1,854 2,328 Net Profit Zambia 18 146 53 (4) Nigeria 109 85 186 247 Turkey 3 (2) (1) 13 Total 130 229 238 256
Source: Annual Reports

Solar Industries
15 June 2015 15
Exhibit 23: Africa –richly endowed with mineral resources
Source: Report ‘Mining in Africa towards 2020’ by KPMG
44% revenue increase in FY15, led by new manufacturing facilities for cartridge explosives n Towards the end of FY14, SOIL commissioned its 5k-ton cartridge explosives
plant and detonators assembly plant at Zambia. This has opened up possibilities to export to nearby countries, including Tanzania. The geography and product diversification has enabled the company to offset the sharp decline in bulk volume sales in Zambia, with the drop in copper prices.
n Even in Turkey, SOIL commissioned a cartridge explosive plant (5,000 tons), ANFO plant (40,000 tons) and detonators plant (6m units) in FY14, leading to increased volumes during FY15. Also, SOIL is working on a 2.5k-ton expansion of bulk explosives facility, to be commissioned in early FY16.
n In Nigeria, SOIL’s local partner, Nigachem Nigeria was the dominant manufacturer of explosives in the country, with a market share of 80%+. Over the past few quarters, there have been few new licenses granted, impacting the opportunity pie and margins.
n We expect revenues from overseas operations to improve from INR3.4b in FY15 to INR4.2b in FY16, and INR4.7b in FY17– 18% CAGR over FY15-17. This is largely led by commissioning of new facilities in Zambia and Turkey, exports to nearby countries and expansion into new geographies.

Solar Industries
15 June 2015 16
Exhibit 24: Growth rates in overseas operations to be led by tapping new geographies (INR m)
Source: MOSL, Company
Exhibit 25: Currency headwinds in most countries have impacted reported financials (% YoY)
Source: PESO
962 1,631 1,854
2,328
3,361
4,403 4,873
70%
14%26%
44%
31%
11%
FY11 FY12 FY13 FY14 FY15 FY16E FY17E
Overseas % YoY
-10%
0%
10%
20%
30%
4QFY
10
2QFY
11
4QFY
11
2QFY
12
4QFY
12
2QFY
13
4QFY
13
2QFY
14
4QFY
14
2QFY
15
4QFY
15
NGN/$ TRY/$ ZMK/$

Solar Industries
15 June 2015 17
Defense: Initial orders received Should drive next phase of growth
SOIL forayed into the defense segment in FY11, and has positioned itself as a key supplier of HMX and propellants for the indigenous missile program. For SOIL, the defense business is now more predictable, given that both the Pinaka rocket and Akash missiles have been already inducted and initial trial orders are being received by SOIL. At optimum levels, we expect this segment to contribute ~INR7b to revenues, with EBITDA margin of ~20%.
SOIL forayed into the defense segment in FY11 by leveraging on its expertise of handling hazardous chemicals and economies of scale. India has an ambitious ongoing indigenous missile development program, and SOIL will be a key player supplying HMX and propellants. There has been significant mismatch between supply and demand of these products due to which government entities have explored private vendors. Of the initially targeted INR2.2b to set up production capacity of 50 tons of HMX and 10,000 propellants, SOIL has already incurred capex of INR1.8b to commission capacity for 50 tons of HMX and 2,500 propellants. The company intends to spend INR500m in capex in FY16, to increase the HMX capacity to 100 tons and propellants to 10,000 nos. n HMX: SOIL is the only Indian company manufacturing HMX and the country has
been importing its entire requirements till date. It commissioned a capacity of 50 tons, which will be gradually expanded to 100 tons. SOIL has already supplied a small order quantity to Terminal Ballistics Research Laboratory (TBRL), Chandigarh and Bharat Dynamics Limited. The company has also received enquiries for HMX from ordnance factory, Khamaria, for approximately 10 tons.
n Propellants: Propellants are used in all missiles, and SOIL will initially focus on the Pinaka rockets and Akash missiles. There is significant demand-supply mismatch, with demand potential of 17k-20k pieces by FY17, and current domestic manufacturing at sub-1,500 pieces. SOIL has set up a manufacturing facility with a capacity of 2,500 pieces, which will be eventually ramped up to 10k pieces. SOIL has participated in limited tenders floated by Ordnance Factory, Chanda for supply of 500 pieces of Pinaka, and another tender for supply of 300 pieces for Akash missiles. The management recently stated that the Pinaka order has been delayed and is now likely to be executed in FY17E.
Possible revenues of INR7b at optimum capacity utilization n The management expects INR500m revenues from defense in FY16 (from the
initial orders expected), increasing to INR1b in FY17. At optimum capacity utilization levels (over the next 3-4 years), we estimate possible revenues at INR7b. At average realization of INR10m/ton, HMX can contribute INR1b-1.2b.At an average of INR0.6m-0.7m/piece, propellants can contribute INR6b-6.5b.
n We expect defense revenues to improve from INR500m in FY16 to INR1b in FY17; optimum levels should be achieved in FY19/20.

Solar Industries
15 June 2015 18
Exhibit 26: Defense capacity (tons)
FY15 FY17E FY19E
Propellants 2,500 10,000 10,000 HMX 20 50 100 Capex Cumulative (INR B) 1.8 2.2 2.4
Source: MOSL, Company
Indian defense: At a pivotal point n In pursuance of its declared policy of encouraging the indigenous defense
industry, the government has taken a series of vital decisions: (i) Several critical projects moved to ‘Buy and Make’ (Indian) category,(ii) Few large projects reserved exclusively for private sector,(iii) Defense licensing process streamlined. Over the last twelve months, the Defense Acquisition Council has cleared proposals for INR2.3t and the pace has been impressive.
n Defense indigenization is a decadal opportunity for private players, which we believe will be able to target USD15b-20b of contracts of an estimated USD150b to be awarded over the next five years. Still, the benefits will take time to be reflected in the financials, as actual project awards will be a long drawn process.
Exhibit 27: Indian defense – ‘Make in India’ is a strong resolve; several steps in the offing, with key government decisions
Source: MOSL, Company, Company
Please refer our detailed report “India Defence”
in January 2015

Solar Industries
15 June 2015 19
Initiate coverage with Buy rating SOTP valuation of INR4,100 implies 16% upside
We value SOIL at 30x FY17E EPS (earnings CAGR of 25% over FY15-17) to factor in the possibility of continued strong growth, with ramp-up in mining / infrastructure activities in India, increasing penetration overseas and also an inflexion point in defence revenues. The premium valuations are also justified given that optimum revenues for defence business stand at ~INR7b (possibly ~FY20), while revenues in FY17E are estimated at just INR1b; this translates into negligible profits for the business in FY17E versus possible EPS of INR45-50 at optimum revenue levels of INR7b.
Expect consolidated revenue CAGR of 18% till FY17 We expect consolidated revenue to increase from INR13.5b in FY15 to INR19b in FY17, a CAGR of 18%. This would be led by (i) 18% CAGR in domestic production (including exports), (ii) 20% CAGR in overseas revenues (from manufacturing facilities in Zambia, Nigeria and Turkey, penetration into more geographies), and (iii) INR1b of defense revenues in FY17. During FY06-14, SOIL reported revenue CAGR of 17% on the back of increased market share from 16% to 22% in the domestic explosives market and setting up overseas manufacturing facilities. EBITDA margins to improve to 20.9% in FY17E vs 18.8% in FY15 We expect consolidated EBITDA margins to improve to 20.9% in FY17 (vs 18.8% in FY15), supported by improved margins in domestic explosives / defense and also product mix change towards cartridges in overseas business. Over FY09-15, SOIL has witnessed margin expansion from 14.3% to 18.8%, largely on the back of operating leverage and increased contribution of overseas business. RoE impacted by investments of INR1.8b in defense; set to improve SOIL’s RoE declined from 29% in FY12 to 21.6% in FY15, largely impacted by investments of INR1.8b towards setting up the manufacturing plant for defense. We expect RoE to improve to 24% in FY16 / FY17 and RoE to reach near the previous high of 26-27% in FY19/20 as the defense business starts operating at optimum revenue levels.

Solar Industries
15 June 2015 20
Initiate with Buy rating, target price of INR4,100 n Demand for explosives is directly correlated to mining activity. Coal mining
accounts for ~70% of the explosive usage in India. During FY09-14, industry volume growth was constrained at just 3.4%, exactly mirroring the CAGR in coal production. Growth rate improved to 7.5% in FY15, supported by 6.7% increase in coal production. We believe FY16 will be the turning point for explosives demand in India (with growth rates of 13.8% YoY), given the intense efforts to improve coal availability by 2.5x till FY20 through (i) auction/transfer of de-allocated mines, and (ii) attempts by Coal India to double production to 1b tons by FY20. We expect SOIL to witness a robust volume CAGR of 17% over FY15-17, with possibilities of a more meaningful upside as coal production accelerates.
n Overseas business also presents interesting growth possibilities. SOIL is set to penetrate several unexplored regions in Africa, East Europe and Central Asia. It has set up manufacturing facilities in Zambia, Nigeria and Turkey, and the business model has seen initial successes.
n Defense also presents interesting possibilities, and given the scale economies / early mover advantage, SOIL is in a sweet spot to capitalize on the strong government resolve to indigenize production. Reported earnings till FY17E do not adequately capture the potential upside, as we model revenues of INR1b versus optimum levels of INR7b in FY19/20, given the initial ramp-up period. Given the higher depreciation, the profit contribution of the business in FY17 would be negligible. We estimate that at optimum revenue levels of INR7b in FY19/20, the business can report EPS of INR45-50.
n We value SOIL at 30x FY17E EPS (earnings CAGR of 25% over FY15-17) to factor in the possibility of continued strong growth, with ramp-up in mining / infrastructure activities in India, increasing penetration overseas and also an inflexion point in defence revenues. The premium valuations are also justified given that optimum revenues for defence business stands at ~INR7b (possibly ~FY20), while revenues in FY17E are estimated at just INR1b; this translates into negligible profits for the business in FY17E versus possible EPS of INR45-50 at optimum revenue levels of INR7b. The defense business for SOIL is now more predictable, given that both Pinaka and Akash have been already inducted and initial trial orders are being received. Buy.
Key triggers n Pick-up in mining / infrastructure activities n Increased order intake and execution from defense n Success in tapping nearby countries for overseas business Key risks n Continued sluggishness in domestic mining and infrastructure activities. n Lower commodity prices globally have impacted the visibility of mining efforts,
particularly in high cost regions. Continued uncertainty can impact overseas revenues.
n Explosives industry is prone to accidents and also regulatory risks.

Solar Industries
15 June 2015 21
Exhibit 28: Operating metrics
FY09 FY10 FY11 FY12 FY13 FY14 FY15 FY16E FY17E
Cartridge Revenues (INR M) 1,722 2,117 2,065 3,053 3,941 3,970 4,686 4,500 5,279 Volume (tons) 41,211 55,488 47,695 63,200 75,356 68,776 84,898 90,000 103,500 Rln per MT 41,778 38,150 43,302 48,307 52,298 57,725 55,192 50,000 51,000 Bulk Revenues (INR M) 1,559 1,520 2,018 2,822 3,832 3,703 4,976 6,115 7,173 Volume (tons) 55,000 57,857 79,980 94,962 114,326 106,988 136,716 175,000 201,250 Rln per MT 28,349 26,276 25,226 29,717 33,518 34,613 36,399 34,943 35,642 Detonators Revenues (INR M) 941 1,034 1,095 1,428 1,490 1,554 1,269 1,413 1,612 Volume (m pieces) 71 103 108 118 141 130 126 130 143 Rln per piece 13 10 10 12 11 12 10 11 11 Detonating Fuse Revenues (INR M) 160 156 262 377 287 361 229 330 381 Volume (m mtrs) 27 29 59 67 47 52 47 60 66 Rln per Mtrs 6 5 4 6 6 7 5 6 6 Defense - - - - - - - 500 1,000 Other operating income and income from scrap - 41 95 - 118 161 55 61 67 Trading activity 798 1,033 753 997 599 87 - - - Overseas revenues - - 950 1,630 1,864 2,329 3,353 4,403 4,873 Consolidated Revenues 5,180 5,901 7,238 10,307 12,131 12,166 14,568 17,321 20,384 Domestic Revenues (Excl Trading /Def, Incl Exports) 4,382 4,827 5,440 7,680 9,550 9,589 11,160 12,858 15,444
% YoY 10.1% 12.7% 41.2% 24.3% 0.4% 16.4% 15.2% 20.1%
EBIDTA Margins 14.3% 15.4% 18.0% 17.7% 16.3% 17.9% 18.8% 20.3% 20.9% Standalone 8.7% 8.9% 12.9% 11.8% 11.2% 13.6% 15.3% 15.3% 16.1% Subsidiaries 49.8% 53.4% 36.7% 35.1% 35.9% 35.1% 29.2% 32.6% 33.6%
Source: MOSL, Company

Solar Industries
15 June 2015 22
Company background SOIL is India’s leading explosives manufacturer, having a licensed capacity of 290k tons of bulk and cartridge explosives across 20 manufacturing locations within India. It also has manufacturing units across Nigeria and Zambia to cater to African markets. Its Turkey plant caters to growth opportunities from CIS nations. After establishing itself in manufacturing of explosives for civilian purposes, SOIL has also diversified into manufacturing of propellants used across defense applications. Apart from state-owned entities like Coal India, ONGC, SAIL, Border Roads Organization, NHPC, and other government regulated mining/exploration agencies, SOIL’s customers include Vedanta Group, Aditya Birla Group, and Tata Steel, Reliance, JSPL, etc which are among the largest entities from India engaged in mining. SOIL’s subsidiary, Economic Explosives also has pre-qualifications to bid for contracts for supplying explosives to several state-owned entities engaged in mining. The benefit of two entities having mandatory pre-qualifications with state-owned entities is increased chances of winning. Typically, contracts for supplying explosives are awarded to a cluster of seven entities at the price quoted by the lowest bidder. SOIL also has operations in Africa and Turkey. Its manufacturing plant in Zambia has an installed capacity to manufacture 10,000 tons of bulk explosives. Typically, SOIL launches the first round of business expansion in a new geography by appointing traders, who work as business associates. They are responsible for marketing and sales, and for dealing with regulatory authorities. SOIL’s role in African and CIS operations is restricted to manufacturing, administration and financial control over its overseas subsidiaries. Currently, SOIL exports to 22 countries and plans to increase this number to 50 countries. In defense, SOIL has mandatory pre-qualifications to supply propellants and HMX for Akash and Pinaka missiles. Currently, it has the capacity to manufacture 2,500 propellants, which it intends to increase to 10,000.
Exhibit 29: Cartridge explosives manufactured by SOIL

Solar Industries
15 June 2015 23
Exhibit 30: Detonating cords manufactured by SOIL
Source: MOSL, Company
Exhibit 31: Detonating fuses manufactured by SOIL
Source: MOSL, Company
Exhibit 32: Cast boosters manufactured by SOIL
Source: MOSL, Company
Exhibit 33: SOIL milestones
Source: Industry, MOSL
1996
Started production of explosives with a license capacity of 6,000 MT
1998
Commenced production of Detonators
2000
Started plants in Waidhan for production of bulk explosives
2001
Imported first Cartridge manufacturing machine from USA
1984
Commenced business as an Trader in Explosives
2002-05
• Established another bulk explosive
unit in Chandrapur with 7,750 MT
capacity
• Introduced Cast boosters and PETN in
the product portfolio
• Started exporting and slowly gained
acceptance in International market
2007-14
• Expands domestic operations
to 20 locations
• Starts exporting to 22 countries
• Manufacturing units in Zambia,
Nigeria & Turkey
• Expansion in Zambia
• Sets up manufacturing facilities
of HMX & Propellant
2006
Initial public offer; gets listed

Solar Industries
15 June 2015 24
Exhibit 34: SOIL’s manufacturing footprint in India Plant location State Chakdoh Maharashtra Chandrapur Maharashtra Jharsuguda Maharashtra Umrer Maharashtra Ramgarh Jharkhand Dhanbad Jharkhand Barughuttu Jharkhand Waidhan Madhya Pradesh Waidhan Madhya Pradesh Korba Chhattisgarh Manendragarh Chhattisgarh Talcher Orissa Jharsuguda Orissa Bhilwara Rajasthan Kota Rajasthan Asansol West Bengal Karimnagar Andhra Pradesh Kothagudem Telangana Barbil Orissa
Source: MOSL, Company
Exhibit 35: Holding structure of SOIL
Source: Company, MOSL

Solar Industries
15 June 2015 25
Annexure 1: Coal India Volumes at inflection point Evacuation is key; MCL, SECL & CCL main drivers
n While COAL’s 1b ton target by FY20 looks ambitious, our detailed major mine-wise analysis suggests ~10% CAGR in production over FY15-20 to ~780m tons.
n Evacuation is the key impediment to growth. Given environment clearance (EC) for ~830m tons and ~38 years of reserve life, we believe ramping up will not be a major issue.
n Three critical rail lines would support ~300m tons of evacuation; hence, the progress there remains critical. While the government is targeting to complete two of these lines by 2016, we are not as optimistic. Ministry activity around line development is, however, encouraging.
n We expect phase-1 of Tori-Shivpuri (North Karnapura) and Jarsuguda-Barpalli (IB valley) projects to be commissioned during FY17. This will boost production growth to 12-13% in FY18 and FY19.
Production capacity not a constraint COAL’s production witnessed a CAGR of just 1.7% over FY10-14 versus 5.9% over FY06-10. Clearance-related matters, land-related issues and evacuation have been the key impediments to opening new projects, thereby limiting production capabilities. However, we note that production capacity is actually not a big issue for COAL, which has extractable reserves of 18.9b tons and total resources of 63.7b tons. Based on FY15 production of 495m tons, the mine life is 38years. Exhibit 36: COAL’s production life is 38 years on reserve number (m tons)
Resources Reserves FY15 Mine
Coal Field Proved Indicated Inferred Total Proved Probable Total Prodn Life (yrs)* SECL 7,766 893 1,128 9,787 2,323 1,238 3,561 128 28 MCL 11,588 2,028 - 13,616 3,874 3,700 7,574 121 62 NCL 3,284 196 - 3,480 1,878 13 1,891 72 26 WCL 4,024 1,355 95 5,474 427 741 1,168 41 28 CCL 9,876 1,743 18 11,637 966 2,276 3,242 56 58 BCCL 5,868 1,039 117 7,024 315 183 499 35 14 ECL 8,592 2,162 1,599 12,352 763 115 878 41 22 NEC 308 15 11 334 50 1 51 1 51 Total 51,306 9,431 2,967 63,704 10,595 8,268 18,863 495 38
*Reserves (excl resource) dividend by FY15 production Source: MOSL, Company Our analysis indicates that despite a slump in production, the capacity has continued to increase. Some of the large coal blocks identified for ramp-up in production include Magadh-Amrapalli mines (rated capacity: 32m tons), Siarmal/Garjanbahal/Talabira mines (70m tons), Gopalji/Bharatpur (50m tons) and Basundhara/Kusmunda mine (65m tons). COAL has environment clearance for ~830m tons and consent to operate of ~630m production across its coalfields as of March 2015. Thus, the capacity is 30% higher than its FY15 production of 495m tons.
Please refer our Coal India report dated 11 May 2015
Current mining capacity is 30% higher than FY15
Solar Industries
15 June 2015 26
Exhibit 37: COAL has consent to operate for 630m tons, while EC is available for 830m tons Subsidiary No of. PR Cap. EC Cap. Prod. FY15
Mines (mt) (mt) (mt)
ECL 104 50 94 40 BCCL 53 41 80 35 CCL 67 101 112 56 NCL 10 75 97 72 WCL 79 63 97 41 SECL 86 119 152 128 MCL 26 179 197 121 NEC 4 1 1 1 Coal 429 629 828 494
Source: MOSL, Company Evacuation bottleneck is the primary reason for COAL’s lower volumes, in our view. While production grew 7.2% YoY (or by 33m tons) in FY15, dispatch growth was just 3.8% YoY (18m tons). Dispatches were equal to or higher than production till FY10, which has never been the case over FY10-15 (except for FY13); this has increased inventory build-up at COAL. Inventory accretion over FY07-15 was 14m tons. In the past, COAL had announced schemes to offer coal to consumers on “as is where is” basis, with evacuation being the consumers’ responsibility. This is further reinforced by a recent government move to remove restriction on e-auctions in 2HFY15. Despite government attempts to allot higher coal under fuel supply agreements (FSA), mainly to power, the actual lifting was lower; this led to build-up of inventory. As a large part of coal under e-auction moves through road, the ban was lifted to liquidate inventory. Exhibit 38: Inventory accretion/depletion YoY (m tons)
Source: MOSL, Company
Dispatches through rail, which witnessed a CAGR of 5% over FY06-15, remained muted in FY14/15. Volumes through merry-go-round (MGR) also remained flat over FY10-15. Of the incremental volumes over FY06-15, the share of roads was ~40% and railways’ share was 57%. The construction of connecting lines to large mine has been sizably delayed, limiting volume growth.
17.6
24.3
26.2
14.5
9.3
8.6
30.8
7.3
18.1
17.6
18.5
24.4
27.4
1.2
4.5
17.4
7.8
33.2
42.346.3 46.6
62.069.1 71.9
61.250.9
55.8
FY07 FY08 FY09 FY10 FY11 FY12 FY13 FY14 FY15
Disp Gr (mt) Prodn Gr (mt) Inventory (m tons)
Evacuation bottlenecks result in inventory build-up,
e-auction helps in liquidation of inventory

Solar Industries
15 June 2015 27
Exhibit 39: Evacuation through railways, MGR remain muted (m tons) Mode FY06 FY07 FY08 FY09 FY10 FY11 FY12 FY13 FY14 FY15 CAGR, % Rail 166 181 189 192 210 216 229 251 259 255 4.9%
Gr (% YoY)
9% 5% 2% 10% 3% 6% 10% 3% -2%
Share (%) 50% 52% 50% 48% 51% 51% 53% 54% 55% 52%
MGR 81 79 81 83 87 84 79 89 89 90 1.2% Gr (% YoY)
-2% 3% 2% 5% -3% -5% 12% 0% 1%
Share (%) 24% 23% 22% 21% 21% 20% 18% 19% 19% 18%
Road 74 78 91 113 106 112 113 116 113 132 6.7% Gr (% YoY)
6% 18% 24% -7% 6% 1% 2% -2% 17%
Share (%) 22% 22% 24% 28% 25% 27% 26% 25% 24% 27%
Others* 13 13 13 13 13 12 11 11 11 11 -1.4% Gr (% YoY)
1% 2% -1% -4% -7% -4% -5% -1% 8%
Share (%) 4% 4% 4% 3% 3% 3% 3% 2% 2% 2%
Total 333 350 375 401 415 423 433 466 471 488 4.4%
Source: MOSL, Company
Easing of evacuation will drive dispatches The Indian Railways has identified 31 projects to ramp up domestic coal production; of these, three are critical. Among the subsidiaries, CCL is likely to benefit the most with 12 evacuation projects. The critical projects are Tori-Shivpur-Kathautia (T-S-K; 93km in Jharkhand), Jharsuguda-Barpalli-Sardega (J-B-S; 53km in Odisha), and Bhupdevpur-Korichapar-Dharamjaigarh (B-K-D; 180km in Chhattisgarh); these projects have the potential to evacuate ~300m tons of coal per year. These projects remain integral to COAL’s target to reach production of 1b tons by 2020. The progress on these lines has been rather slow and the T-S section is expected by June 2017, while the J-S line is expected by June 2016.
Exhibit 40: Timeline for key railway line projects
As at
Feb-15 As at
Feb-14 Remarks
Tori-Shivpur-Kathautia Jun-17 Jun-16 Revised TDC too looks difficult
Jharsuguda-Sardega Jun-16 Jun-16 Milestone-based progress indicates delays; however, state government focus is positive
Bhupdeopur-Baroud
Sep-16 TDC not specified; even Stage I clearance is pending Piparwar (Siding)
Jun-14 No TDC; project facing severe law and order issues
Koderma-Hazaribagh Oct-13 Oct-13 Not commissioned yet
Hazaribagh-Barkakhana Sep-14 Sep-14 - do -
Barkakhana-Ranchi Dec-15 Dec-15
Source: MOSL, Company Admittedly, past progress on the lines has been anemic. This is evident from the fact that the clearance process for the Shivpuri-Kathotia (S-K) section is yet to begin; the Tori-Shivpuri (T-S) section has received 55% of land, but in patches. We note that 52m tons of production is linked to the T-S-K corridor for CCL till FY20. Progress on the J-B-S section is better, and the Ministry of Coal (MoC) is pushing the state government to expedite the B-D-K section. We believe phase-1 (single line) of T-S and J-B-S will be ready by the end of FY17, accelerating volume growth in FY18-19.
We believe that phase-1 (single line) of T-S and J-B-S will be ready by the end of FY17, which will accelerate volume growth in FY18-19

Solar Industries
15 June 2015 28
Exhibit 41: Lackluster progress on critical rail lines Project Coal field Coal TDC Milestones/Remarks Issues (Feb 2015) Issues (Feb 2014)
eva.
(mt)
Tori-Shivpur -Kathautia 44km long at capex of INR15.8b
North Karanpura CCL (JH)
60 Jun-17
TDC subject to land availability by Sep 2014. Relaxation of night-time restriction received. Stage-II FC received in June 2013.
Physical possession of 55% of land. Land is small and non-continuous. Frequent change in ownership. Contracts threatening legal actions
- Delay in actual land availability free of all clerances. - Security provision - Release of forest (197Ha) and govt. (109Ha) land
Shivpur -Kathautia
North Karanpura CCL (JH)
- Identification of land pending - Require 1300 acres of land - Target three yrs after land availability
- Identification of land pending - Stage-I to be filed
Jharsuguda- Sardega 52km long at capex of INR16b
IB Valley MCL (OD)
60 Jun-16 Stage-II FC received
- Private land acquisition - Tree felling and sight clearance - Shifting of power transmission lines
- Stage-II by July 14 - Forest land and tree cutting by Nov 2014 - Power line shift by Aug 2014
Bhupdeopur- Baroud
Mand- Raigarh SECL (CH)
- Stage-I FC to be filed - Land to be handed over - Target 2-3 years
- Land by Sep 2014 - FC by Sep 2014
Piparwar (Siding) 30km at INR900m
CCL (JH) 25 NA
- Law and order problem - Law and order problem
Ashoka (Siding) 13km at INR1.3b
CCL (JH) 12-15 Jun-15
Koderma –Hazaribagh 67km at INR3b
CCL (JH)
Oct-13
- Important for coal evacuation from Hazaribagh-Banadag siding
Hazaribagh – Barkakhana 57km
Sep-14
Barkakhana-Ranchi 65kms
CCL (JH)
Dec-15
Critical
Source: MOSL, Company
Volumes to grow at a robust 10% CAGR The MoC has set an ambitious target for COAL to double its production by 2020. The target for FY20 is worked out at 931m tons. The increase in production will largely be from three key subsidiaries—MCL, SECL and CCL. Together, these subsidiaries are likely to contribute 337m tons of the total increase of 433m tons—a contribution of 78%. Among these subsidiaries, the key delta is targeted from CCL (85m tons) over FY15-20 on FY15 production base of 55m tons. Doubling of production is targeted at MCL and SECL (~120m tons each). We have analyzed mine-wise contribution for each of the three subsidiaries and conclude that while the 1b ton production target appears ambitious, volume growth is likely to be robust. We forecast volumes of 780m tons by FY20—a CAGR of 10% versus 2.8% over FY10-15. The major mines from the three subsidiaries would account for ~280m tons; of this, EC is available for 182m tons, while FC is not available. Land availability remains sparse and 4-5 ongoing projects have sizable land requirement. We have assumed incremental production from these mines based on
Though the MoC’s target of 1b ton looks ambitious, we
believe it is possible to achieve 10% CAGR in
deliveries over five years to 780m tons by FY20
Solar Industries
15 June 2015 29
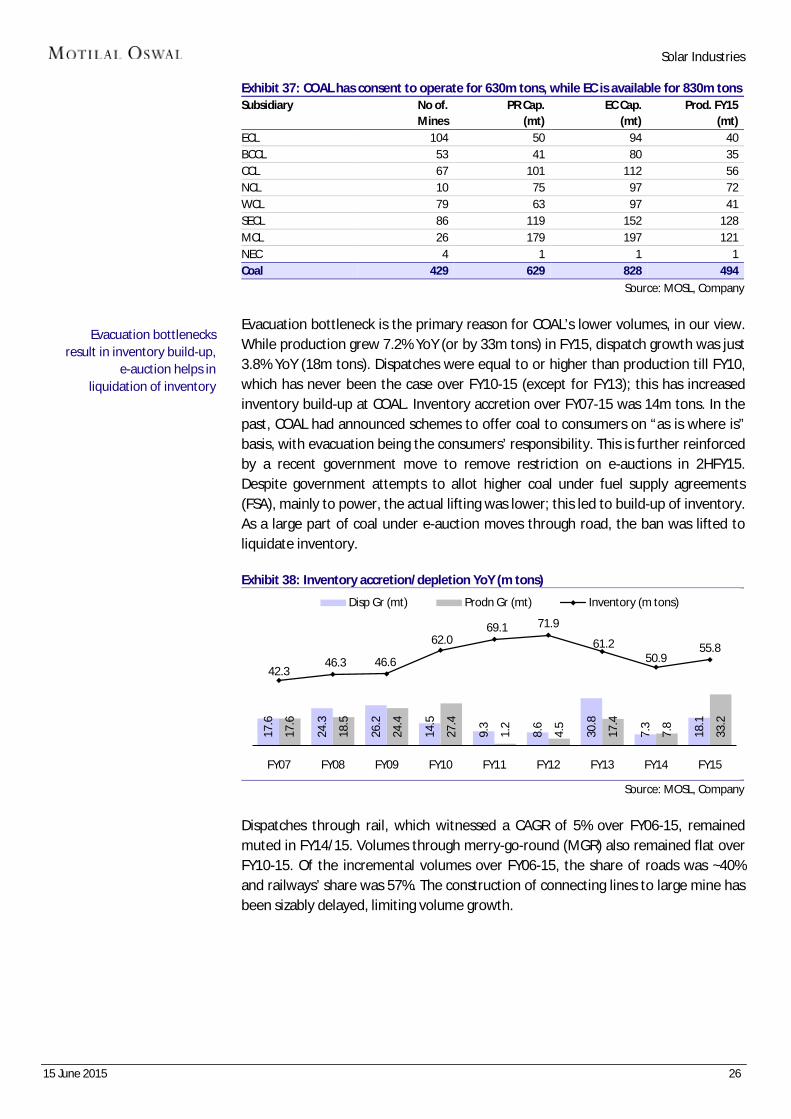
a discount approach at 140m tons or 50% of target. We are confident about our volume estimate, while continued push by the Central government remains the key to achieving the targets/higher production.
Exhibit 42: Key mines that would contribute ~300m tons over FY15-20 (m tons)
Mine Coal field Subsidiary Rated GF Prod.
Guidance MOSL Est EC
Cap. BF FY17E FY20E FY17E FY20E Avail. FC Land avai. Evacuation
Gopalprasad Talcher MCL 15.0 GF 0 15.0 0 7.5 0
0%
Siarmal IB MCL 40.0 GF 0 10.0 0 5.0 0
0% Jharsuguda Barpali rail line Garjanbahal IB MCL 10.0 GF 0 10.0 0 7.5 10
0% Jharsuguda Barpali rail line
Talabira IB MCL 20.0 GF 0 10.0 0 2.5 0
0%
Gopalji Talcher MCL 30.0 GF 0 7.0 0 1.8 0
0%
Bharatpur Talcher MCL 20.0 BF 19.0 20.0 14.3 15.0 20
68% Angul Kalinga Connectivity Ananta Talcher MCL 15.0 BF 14.5 20.0 13.3 16.0 20
0% Talcher Station 3rd line
Kulda IB MCL 15.0 BF 12.3 15.0 9.2 11.3 10
38%
Kaniha Talcher MCL 10.0 BF 10.0 14.0 10.0 14.0 10
87%
Hingula Talcher MCL 15.0 BF 8.8 12.0 8.8 12.0 12
57% Double siding
Gevra Korba SECL
BF 45.0 70.0 39.6 61.6 40
NA As per current EC, evacuation only by Rail
Kusmunda Korba SECL
BF 27.0 50.0 23.8 44.0 19
NA As per current EC, evacuation only by Rail
Pelma Mand Raigarh
SECL
GF 5.0 10.0 1.3 2.5 0
1812Ha req.
Bhupdeopur-Raigarh-Mand line
RAI Mand Raigarh
SECL
GF 0.0 15.0 0.0 3.8 0
NA Bhupdeopur-Raigarh-Mand line
Chhal Mand Raigarh
SECL
GF 0.0 6.0 0.0 1.5 0
NA Bhupdeopur-Raigarh-Mand line
Madannagar Mand Raigarh
SECL
GF 0.0 12.0 0.0 3.0 0
NA Bhupdeopur-Raigarh-Mand line
Amrapali
CCL 12.0 GF 7.0 12.0 4.0 5.3 12 No 239Ha req. Tori-Shivpur-Kathutia rail line Magadh
CCL 20.0 GF 5.0 20.0 1.3 5.0 20 No 568Ha req. Tori-Shivpur-Kathutia rail line
Sanghamitra
CCL 20.0 GF 0.0 12.5 0.0 3.1 0 No NA Tori-Shivpur-Kathutia rail line Pachra
CCL 15.0 GF 0.0 15.0 0.0 3.8 0 No NA Tori-Shivpur-Kathutia rail line
Ashoka
CCL 30.0 BF 14.0 30.0 11.5 20.0 10 No 70Ha req.
Source: MOSL, Company
Brownfield mines can aid volume growth of ~110m tons We note that brownfield expansion/mines can aid volumes of ~110m tons at the three subsidiaries. Greenfield project’s contribution to production growth is pegged at ~82m tons. This provides further confidence in COAL’s volume growth ramp-up. We believe production growth can surprise positively, but for timely commissioning of rail lines. This is because mines in IB valley are particularly easy, with lower strip ratio. For CCL too, the Magadh-Amrapalli mines already have EC of 30m+ tons and production ramp-up is stuck due to evacuation infrastructure.

Solar Industries
15 June 2015 30
Exhibit 43: MCL production ramp-up – COAL est.
Source: MOSL, Ministry of Coal
Exhibit 44: MCL production ramp-up – MOSL est.
Source: MOSL, Ministry of Coal
Exhibit 45: SECL production ramp-up – COAL est.
Source: MOSL, Ministry of Coal
Exhibit 46: SECL production ramp-up – MOSL est.
Source: MOSL, Ministry of Coal
Exhibit 47: CCL production ramp-up – COAL est.
Source: MOSL, Ministry of Coal
Exhibit 48: CCL production ramp-up – MOSL est.
Source: MOSL, Ministry of Coal
121
77
52 250
Prod. FY15 - mt BF GF Prod. FY20 - mt
121
6124 206
Prod. FY15 - mt BF GF Prod. FY20 - mt
128
67
55 250
Prod. FY15 - mt BF GF Prod. FY20 - mt
128
5117 197
Prod. FY15 - mt BF GF Prod. FY20 - mt
569
72 137
Prod. FY15 - mt BF GF Prod. FY20 - mt
56 3
40 93
Prod. FY15 - mt BF GF Prod. FY20 - mt

Solar Industries
15 June 2015 31
Financials and valuations
Income Statement
(INR Million) Y/E March 2010 2011 2012 2013 2014 2015 2016E 2017E Total Revenues 5,574 6,809 9,676 11,218 11,330 13,519 16,125 18,963 Change (%) 14.3 22.1 42.1 15.9 1.0 19 19 18 Raw Materials 3,278 3,724 5,608 6,501 5,908 7,687 8,976 10,552 Staff Cost 218 313 442 556 673 798 925 1,027 Other Expenses 1,218 1,543 1,915 2,329 2,719 2,494 2,954 3,423 EBITDA 860 1,228 1,710 1,833 2,030 2,540 3,270 3,962 % of Total Revenues 15.4 18.0 17.7 16.3 17.9 19 20 21 Other Income 260 252 236 142 112 79 104 114 Depreciation 78 77 128 170 219 315 336 377 Interest 134 123 236 183 179 179 213 274 Exceptional Items 0 0 44 100 100 100 0 0 PBT 908 1,281 1,540 1,522 1,644 2,026 2,824 3,425 Tax 322 451 425 257 349 463 634 786 Rate (%) 35.5 35.2 27.6 16.9 21.2 23 22 23 Adjusted PAT 586 756 1,047 1,243 1,264 1,554 2,056 2,465 Minority Interest 0 74 102 101 111 89 135 173 Reported PAT 586 756 1,012 1,163 1,184 1,474 2,056 2,465 Change (%) 32.7 29.0 33.9 14.9 1.8 24 39 20 Adj. Stand Alone PAT 313 503 603 738 818 1,059 1,344 1,645 Change (%) 24.0 60.9 19.8 22.5 10.9 29 27 22
Balance Sheet
(INR Million) Y/E March 2010 2011 2012 2013 2014 2015 2016E 2017E Share Capital 173 173 173 181 181 181 181 181 Reserves 2,479 2,987 3,873 5,546 6,435 7,578 9,223 11,195 Net Worth 2,652 3,160 4,046 5,727 6,616 7,759 9,404 11,376 Minority Intetest 1 275 378 405 381 471 606 779 Loans 1,077 1,616 2,964 3,721 4,837 3,465 5,200 4,850 Deferred Tax Liability 142 169 196 207 270 444 444 444 Capital Employed 3,872 5,220 7,584 10,060 12,103 12,139 15,653 17,449
Gross Fixed Assets 1,513 2,396 3,398 4,408 5,796 6,922 8,060 9,010 Less: Depreciation 366 442 570 740 959 1,273 1,610 1,986 Net Fixed Assets 1,148 1,954 2,828 3,668 4,838 5,649 6,451 7,024 Capital WIP 208 292 503 606 810 810 781 781 Investments 104 123 113 489 252 374 101 101 Goodwill 0 33 48 57 71 0 0 0 Curr. Assets 3,901 4,209 5,501 6,260 7,554 7,059 9,852 11,481 Inventory 380 592 1,286 1,361 1,528 1,649 2,210 2,502 Debtors 898 944 1,393 1,559 1,853 1,913 2,146 2,808 Cash & Bank Balance 940 596 630 922 1,330 373 1,608 2,015 Loans & Advances 1,684 2,077 2,192 2,417 2,842 3,125 3,888 4,157
Current Liab. & Prov. 1,530 1,197 1,256 1,020 1,422 1,753 1,532 1,939 Creditors & other current liab. 1,530 1,197 1,256 1,020 1,422 1,753 1,532 1,939 Net Current Assets 2,371 3,013 4,245 5,240 6,132 5,306 8,320 9,542 Misc Expenses 40 0 0 0 0 0 0 0 Application of Funds 3,872 5,413 7,737 10,060 12,103 12,139 15,653 17,449 E: MOSL Estimates

Solar Industries
15 June 2015 32
Financials and valuations
Ratios Y/E March 2010 2011 2012 2013 2014 2015 2016E 2017E
Basic (INR)
Adj EPS 33.8 43.6 60.4 68.7 69.9 85.9 113.6 136.2 Cash EPS 38.4 48.1 65.8 73.6 77.5 98.8 132.2 157.0 Book Value 153.1 182.4 233.6 316.4 365.6 428.7 519.6 628.6 DPS 7.0 8.0 10.0 11.0 11.5 13.5 18.9 22.6 Payout (incl. Div. Tax.) 24.2 21.4 19.4 18.7 19.3 19.0 20.0 20.0
Valuation (x)
P/E
21.5 41.2 31.2 26.0
Cash P/E
19.4 35.8 26.8 22.6 EV/EBITDA
15.1 26.5 20.7 16.9
EV/Sales
2.7 5.0 4.2 3.5 Price/Book Value
4.1 8.3 6.8 5.6
Dividend Yield (%)
0.8 0.4 0.5 0.6
Profitability Ratios (%)
RoE 22.1 23.9 25.0 20.3 17.9 19.0 21.9 21.7 RoCE 26.9 26.9 24.0 17.9 15.9 19.0 19.4 21.2
Turnover Ratios
Debtors (Days) 59 51 53 51 60 52 49 54 Inventory (Days) 25 32 48 44 49 45 50 48 Creditors. (Days) 100 64 47 33 46 47 35 37 Asset Turnover (x) 1.4 1.3 1.3 1.1 0.9 1.1 1.0 1.1
Leverage Ratio
Debt/Equity (x) 0.1 0.3 0.6 0.5 0.5 0.4 0.4 0.2
Cash Flow Statement
(INR Million) Y/E March 2013 2014 2015 2016E 2017E PBT before EO Items
1,522 1,644 2,026 2,824 3,425
Add : Depreciation
170 219 315 336 377 Interest
183 179 179 213 274
Less : Direct Taxes Paid
-257 -349 -463 -634 -786 (Inc)/Dec in WC
-858 -484 -131 -1,779 -815
CF from Operations 760 1,209 1,925 962 2,474
(Inc)/Dec in FA
-1,112 -1,593 -1,125 -1,110 -950 Invest. in liquid assets
277 64 38 273 0
CF from Investments -835 -1,529 -1,087 -837 -950
(Inc)/Dec in Debt
749 1,116 -1,372 1,735 -350 Less : Interest Paid
-183 -179 -179 -213 -274
Dividend Paid
-199 -208 -245 -411 -493 CF from Fin. Activity 367 729 -1,795 1,111 -1,117
Inc/Dec of Cash 291 409 -957 1,236 407 Add: Beginning Balance
630 922 1,330 373 1,609
Closing Balance 922 1,330 373 1,609 2,015 E: MOSL Estimates

Solar Industries
15 June 2015 33
N O T E S

Solar Industries
15 June 2015 34
Disclosures This document has been prepared by Motilal Oswal Securities Limited (hereinafter referred to as Most) to provide information about the company(ies) and/sector(s), if any, covered in the report and may be distributed by it and/or its affiliated company(ies). This report is for personal information of the selected recipient/s and does not construe to be any investment, legal or taxation advice to you. This research report does not constitute an offer, invitation or inducement to invest in securities or other investments and Motilal Oswal Securities Limited (hereinafter referred as MOSt) is not soliciting any action based upon it. This report is not for public distribution and has been furnished to you solely for your general information and should not be reproduced or redistributed to any other person in any form. This report does not constitute a personal recommendation or take into account the particular investment objectives, financial situations, or needs of individual clients. Before acting on any advice or recommendation in this material, investors should consider whether it is suitable for their particular circumstances and, if necessary, seek professional advice. The price and value of the investments referred to in this material and the income from them may go down as well as up, and investors may realize losses on any investments. Past performance is not a guide for future performance, future returns are not guaranteed and a loss of original capital may occur.
MOSt and its affiliates are a full-service, integrated investment banking, investment management, brokerage and financing group. We and our affiliates have investment banking and other business relationships with a some companies covered by our Research Department. Our research professionals may provide input into our investment banking and other business selection processes. Investors should assume that MOSt and/or its affiliates are seeking or will seek investment banking or other business from the company or companies that are the subject of this material and that the research professionals who were involved in preparing this material may educate investors on investments in such business. The research professionals responsible for the preparation of this document may interact with trading desk personnel, sales personnel and other parties for the purpose of gathering, applying and interpreting information. Our research professionals are paid on the profitability of MOSt which may include earnings from investment banking and other business.
MOSt generally prohibits its analysts, persons reporting to analysts, and members of their households from maintaining a financial interest in the securities or derivatives of any companies that the analysts cover. Additionally, MOSt generally prohibits its analysts and persons reporting to analysts from serving as an officer, director, or advisory board member of any companies that the analysts cover. Our salespeople, traders, and other professionals or affiliates may provide oral or written market commentary or trading strategies to our clients that reflect opinions that are contrary to the opinions expressed herein, and our proprietary trading and investing businesses may make investment decisions that are inconsistent with the recommendations expressed herein. In reviewing these materials, you should be aware that any or all of the foregoing among other things, may give rise to real or potential conflicts of interest. MOSt and its affiliated company(ies), their directors and employees and their relatives may; (a) from time to time, have a long or short position in, act as principal in, and buy or sell the securities or derivatives thereof of companies mentioned herein. (b) be engaged in any other transaction involving such securities and earn brokerage or other compensation or act as a market maker in the financial instruments of the company(ies) discussed herein or act as an advisor or lender/borrower to such company(ies) or may have any other potential conflict of interests with respect to any recommendation and other related information and opinions.; however the same shall have no bearing whatsoever on the specific recommendations made by the analyst(s), as the recommendations made by the analyst(s) are completely independent of the views of the affiliates of MOSt even though there might exist an inherent conflict of interest in some of the stocks mentioned in the research report Reports based on technical and derivative analysis center on studying charts company's price movement, outstanding positions and trading volume, as opposed to focusing on a company's fundamentals and, as such, may not match with a report on a company's fundamental analysis. In addition MOST has different business segments / Divisions with independent research separated by Chinese walls catering to different set of customers having various objectives, risk profiles, investment horizon, etc, and therefore may at times have different contrary views on stocks sectors and markets.
Unauthorized disclosure, use, dissemination or copying (either whole or partial) of this information, is prohibited. The person accessing this information specifically agrees to exempt MOSt or any of its affiliates or employees from, any and all responsibility/liability arising from such misuse and agrees not to hold MOSt or any of its affiliates or employees responsible for any such misuse and further agrees to hold MOSt or any of its affiliates or employees free and harmless from all losses, costs, damages, expenses that may be suffered by the person accessing this information due to any errors and delays. The information contained herein is based on publicly available data or other sources believed to be reliable. Any statements contained in this report attributed to a third party represent MOSt’s interpretation of the data, information and/or opinions provided by that third party either publicly or through a subscription service, and such use and interpretation have not been reviewed by the third party. This Report is not intended to be a complete statement or summary of the securities, markets or developments referred to in the document. While we would endeavor to update the information herein on reasonable basis, MOSt and/or its affiliates are under no obligation to update the information. Also there may be regulatory, compliance, or other reasons that may prevent MOSt and/or its affiliates from doing so. MOSt or any of its affiliates or employees shall not be in any way responsible and liable for any loss or damage that may arise to any person from any inadvertent error in the information contained in this report. MOSt or any of its affiliates or employees do not provide, at any time, any express or implied warranty of any kind, regarding any matter pertaining to this report, including without limitation the implied warranties of merchantability, fitness for a particular purpose, and non-infringement. The recipients of this report should rely on their own investigations.
This report is intended for distribution to institutional investors. Recipients who are not institutional investors should seek advice of their independent financial advisor prior to taking any investment decision based on this report or for any necessary explanation of its contents.
Most and it’s associates may have managed or co-managed public offering of securities, may have received compensation for investment banking or merchant banking or brokerage services, may have received any compensation for products or services other than investment banking or merchant banking or brokerage services from the subject company in the past 12 months. Most and it’s associates have not received any compensation or other benefits from the subject company or third party in connection with the research report. Subject Company may have been a client of Most or its associates during twelve months preceding the date of distribution of the research report
MOSt and/or its affiliates and/or employees may have interests/positions, financial or otherwise of over 1 % at the end of the month immediately preceding the date of publication of the research in the securities mentioned in this report. To enhance transparency, MOSt has incorporated a Disclosure of Interest Statement in this document. This should, however, not be treated as endorsement of the views expressed in the report.
Motilal Oswal Securities Limited is registered as a Research Analyst under SEBI (Research Analyst) Regulations, 2014. SEBI Reg. No. INH000000412
There are no material disciplinary action that been taken by any regulatory authority impacting equity research analysis activities
Analyst Certification The views expressed in this research report accurately reflect the personal views of the analyst(s) about the subject securities or issues, and no part of the compensation of the research analyst(s) was, is, or will be directly or indirectly related to the specific recommendations and views expressed by research analyst(s) in this report. The research analysts, strategists, or research associates principally responsible for preparation of MOSt research receive compensation based upon various factors, including quality of research, investor client feedback, stock picking, competitive factors and firm revenues
Disclosure of Interest Statement SOLAR INDUSTRIES INDIA § Analyst ownership of the stock No § Served as an officer, director or employee No
A graph of daily closing prices of securities is available at www.nseindia.com and http://economictimes.indiatimes.com/markets/stocks/stock-quotes
Regional Disclosures (outside India) This report is not directed or intended for distribution to or use by any person or entity resident in a state, country or any jurisdiction, where such distribution, publication, availability or use would be contrary to law, regulation or which would subject MOSt & its group companies to registration or licensing requirements within such jurisdictions.
For U.S. Motilal Oswal Securities Limited (MOSL) is not a registered broker - dealer under the U.S. Securities Exchange Act of 1934, as amended (the"1934 act") and under applicable state laws in the United States. In addition MOSL is not a registered investment adviser under the U.S. Investment Advisers Act of 1940, as amended (the "Advisers Act" and together with the 1934 Act, the "Acts), and under applicable state laws in the United States. Accordingly, in the absence of specific exemption under the Acts, any brokerage and investment services provided by MOSL, including the products and services described herein are not available to or intended for U.S. persons.
This report is intended for distribution only to "Major Institutional Investors" as defined by Rule 15a-6(b)(4) of the Exchange Act and interpretations thereof by SEC (henceforth referred to as "major institutional investors"). This document must not be acted on or relied on by persons who are not major institutional investors. Any investment or investment activity to which this document relates is only available to major institutional investors and will be engaged in only with major institutional investors. In reliance on the exemption from registration provided by Rule 15a-6 of the U.S. Securities Exchange Act of 1934, as amended (the "Exchange Act") and interpretations thereof by the U.S. Securities and Exchange Commission ("SEC") in order to conduct business with Institutional Investors based in the U.S., MOSL has entered into a chaperoning agreement with a U.S. registered broker-dealer, Motilal Oswal Securities International Private Limited. ("MOSIPL"). Any business interaction pursuant to this report will have to be executed within the provisions of this chaperoning agreement.
The Research Analysts contributing to the report may not be registered /qualified as research analyst with FINRA. Such research analyst may not be associated persons of the U.S. registered broker-dealer, MOSIPL, and therefore, may not be subject to NASD rule 2711 and NYSE Rule 472 restrictions on communication with a subject company, public appearances and trading securities held by a research analyst account.
For Singapore Motilal Oswal Capital Markets Singapore Pte Limited is acting as an exempt financial advisor under section 23(1)(f) of the Financial Advisers Act(FAA) read with regulation 17(1)(d) of the Financial Advisors Regulations and is a subsidiary of Motilal Oswal Securities Limited in India. This research is distributed in Singapore by Motilal Oswal Capital Markets Singapore Pte Limited and it is only directed in Singapore to accredited investors, as defined in the Financial Advisers Regulations and the Securities and Futures Act (Chapter 289), as amended from time to time. In respect of any matter arising from or in connection with the research you could contact the following representatives of Motilal Oswal Capital Markets Singapore Pte Limited: Anosh Koppikar Kadambari Balachandran Email : [email protected] Email : [email protected] Contact : (+65)68189232 Contact : (+65) 68189233 / 65249115 Office Address : 21 (Suite 31),16 Collyer Quay,Singapore 04931
Motilal Oswal Securities Ltd
Motilal Oswal Tower, Level 9, Sayani Road, Prabhadevi, Mumbai 400 025 Phone: +91 22 3982 5500 E-mail: [email protected]