INITIAL TIME OF CONCENTRATION - SanDiegoCounty.gov · Initial Time of Concentration for a 0.1-, 1-,...
16
INITIAL TIME OF CONCENTRATION ANALYSIS OF PARAMETERS Developed as part of the basis for the revision to the County of San Diego Hydrology Manual, this report provides background for the method of determining the Initial Time of Concentration in Section Three. Principal Author Joe Hill June 2002
Transcript of INITIAL TIME OF CONCENTRATION - SanDiegoCounty.gov · Initial Time of Concentration for a 0.1-, 1-,...
INITIAL TIME OF CONCENTRATION ANALYSIS OF PARAMETERS
Developed as part of the basis for the revision to the County of San Diego
Hydrology Manual, this report provides background for the method of determining the Initial Time of Concentration in Section Three.
Principal Author Joe Hill
June 2002
OBJECTIVE Review the computational procedures used in the Initial Time of Concentration (Ti) portion of the hydrologic design process and consider the effect of the key input parameters. A document prepared in 1991 that evaluates the Rational Method1, is referenced for background information. The Land Use Element categories (Table 3-1 in the Manual, page 2 in this report) provide the basis for the hydrology studies. Tables I through VI relate the Land Use Elements to the Ti computational process. Columns 1 through 9 in Tables I through VI are described: Column Description
1 Typical Land Use Elements from General Plans 2 Dwelling Units per Acre 3 Area of an individual lot, using 0.9 factor, considering 10% of the area
is used for public purposes such as streets. 4 The square root of the area, giving the length of a square lot. 5 The low value of C from Table 3-1* 6 The high value of C from Table 3-1* 7 Ti using the low C (FAA Equation)* 8 Ti using the high C (FAA Equation)* 9 Velocity in Feet/Second, computed using the high value of C (shorter
time) Each Table is for a specific slope, starting on 0.5% and continuing to 10%. Tables IA through VIA are the same, except that a column “Selected Length” has been inserted and used for computing the Ti . Table VII provides the Kirpich formula time for the same input variables used in the preceding Tables. * Table IX provides T values for specific C values. This table was independently developed by Rick Engineering.
1

Table 3-1
RUNOFF COEFFICIENTS FOR URBAN AREAS
Land Use Runoff Coefficient “C”
Soil Type
NRCS Elements County Elements % IMPER. A B C D
Undisturbed Natural Terrain Permanent Open Space 0* 0.20 0.25 0.30 0.35 Low Residential, 1.0 DU/A or less 10 0.27 0.32 0.36 0.41 Low Residential, 2.0 DU/A or less 20 0.34 0.38 0.42 0.46 Low Residential, 2.9 DU/A or less 25 0.38 0.41 0.45 0.49 Medium Density Residential Residential, 4.3 DU/A or less 30 0.41 0.45 0.48 0.52 Medium Density Residential Residential, 7.3 DU/A or less 40 0.48 0.51 0.54 0.57 Medium Density Residential Residential, 10.9 DU/A or less 45 0.52 0.54 0.57 0.60 Medium Density Residential Residential, 14.5 DU/A or less 50 0.55 0.58 0.60 0.63 High Density Residential Residential, 24.0 DU/A or less 65 0.66 0.67 0.69 0.71 High Density Residential Residential, 43.0 DU/A or less 80 0.76 0.77 0.78 0.79 Commercial/Industrial Neighborhood Commercial 80 0.76 0.77 0.78 0.79Commercial/Industrial General Commercial 85 0.80 0.80 0.81 0.82Commercial/Industrial Office Professional/Commercial 90 0.83 0.84 0.84 0.85Commercial/Industrial Limited Industrial 90 0.83 0.84 0.84 0.85Commercial/Industrial General Industrial 95 0.87 0.87 0.87 .087
*The values associated with 0% impervious may be used for direct calculation of the runoff coefficient as described in Section 3.1.2 (representing the pervious runoff coefficient, Cp, for the soil type), or for areas that will remain undisturbed in perpetuity. Justification must be given that the area will remain natural forever (e.g., the area is located in Cleveland National Forest). DU/A = dwelling units per acre NRCS = National Resources Conservation Service
2
DISCUSSION The information in the preceding tables provides a relationship between the Land Use Elements, the related C values from Table 3-1 and the Initial Time of Concentration computed with the FAA equation. The Kirpich equation provides a comparison. The effect of various physical characteristics or the initial hydrology is discussed below. The discussion is based on county flood control studies conducted in the 1990’s.
1. “Ponding” Effect – The runoff volume from short duration rain is an important consideration in evaluating the effects of intense but limited time duration rain. For instance, the 6-hour precipitation along the coastal urban area is typically three inches or less. The intensity for a 6-minute duration is 7.03 inches per hour. The depth for this 6-minute (0.1 hour) time is 0.7 inch. Of this 0.7 inch depth of rain, some would infiltrate (not much in a high density urban area), a significant amount would be stored in overland flow and some would be stored in ponds that include planters, swimming pools, grass areas, etc. In addition, water is stored in concentrated flow in gutters, down spouts, etc.
Now, consider a typical single-family medium density 6000-square-foot lot. If half of the rain were stored in an area that is 10% of the lot area, the added depth from the 6-minute rain would be ½ x 0.7 x 10 = 3.5 inches. Since the floor level of a slab is typically 12 inches above grade, the potential for significant flood damage from water ponded in a low spot is minimal. Therefore the time for the T used for intensity is 6 minutes.
2. Sheet Flow Velocity and Length – The tables have been expanded to include
Velocity and Length of travel during a 6-minute time. The Velocity is computed by dividing the Length by the Ti for the High C value, giving an indication of the travel time related to the computed Ti. A slow velocity is expected since the depths are small; the relative roughness high, non-uniformity in the form of cracks, potholes, obstructions, etc. and the intense rain would create extensive turbulence and energy loss. In addition, the momentum of the vertically falling rain must be converted to the horizontal flow momentum. The last column gives the distance that water would flow during a 6-minute time at the velocity in the previous column.
In Tables IA through VIA, a Selected Length provides a better basis for the maximum length of overland flow. An evaluation of the sheet flow conditions in the various Land Use Elements indicates that the maximum distance that sheet flow will exist is between 50 and 100 feet. Mc Cuen2 gives the length for kinetic wave sheet flow at 50 to 100 feet and states that the FAA equation was developed from airfield drainage data and applies where overland flow dominates. Since overland flow over relatively flat distances is more subject of disturbance from minor irregularities, the maximum lengths are shorter.
3

An estimate of the sheet flow characteristics can be made using the Manning Equation. The Corps of Engineers manual on hydrology HEC-1 includes a section on overland flow. The Manning N values are high because of high relative roughness. Table VII provides an analysis of typical flow conditions for the same parameters used in the previous tables. The velocities in Table VIII compare reasonably well with the velocities in Tables IA through VIA to indicate general agreement. An estimate of the unit flow (cubic feet per second per foot of width) from a 6-minute rain provides a comparison with the unit flows in Table VIII. The computed flow for a 100-foot length: q = C x I x A = C x 7.03 (inches per hour) x 100/43560 q = 0.016 C Values for values of C are given in Table VII. They are comparable with the flows from the Manning Equation listed in this table.
3. Unreasonable Downstream Effects – The initial area may be 0.1 acre in area (100 feet by 44 feet). The Initial Time of Concentration can affect the flow at a downstream part of the drainage basin to an excessive degree. For instance, the Initial Time of Concentration for a 0.1-, 1-, or 10-acre area may be computed at 20 minutes or more (see Table I). Flow in a pipe may be 10 to 20 feet per second with a travel time of 5000 feet / (15 feet per second x 60 second per foot) = 5.5 minutes. Obviously, the initial time of concentration can unduly effect the time of concentration further downstream. With a basin area of 600 acres and a C value of 0.6 and a P6 value of 3, the flows would be computed as follows:
With Ti = 25 minutes, the intensity for Tc = 30 is 2.5 and Q = 900 With Ti = 4.5 minutes, the intensity for Tc = 10 is 5.0 and Q = 1800 This variation in flow is unreasonable, and the Initial Time of Concentration needs to limit to avoid this type of variation.
4
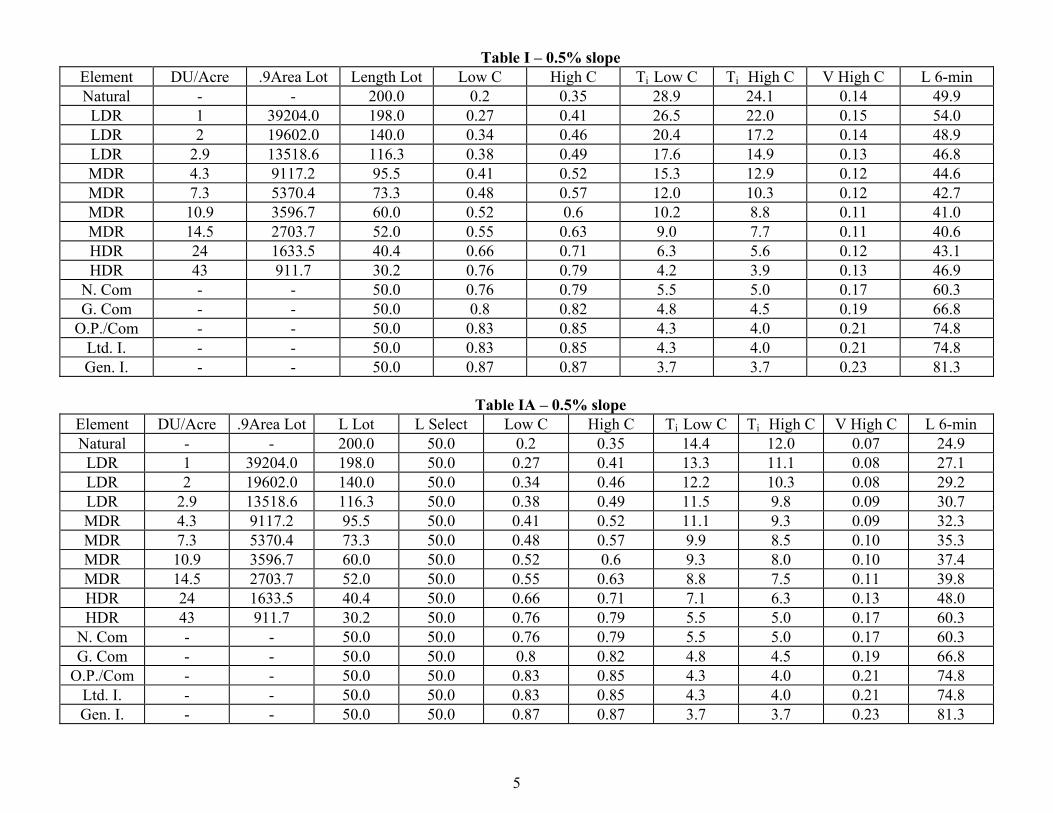
Table I – 0.5% slope Element DU/Acre .9Area Lot Length Lot Low C High C Ti Low C Ti High C V High C L 6-min Natural - - 200.0 0.2 0.35 28.9 24.1 0.14 49.9
LDR 1 39204.0 198.0 0.27 0.41 26.5 22.0 0.15 54.0LDR 2 19602.0 140.0 0.34 0.46 20.4 17.2 0.14 48.9LDR 2.9 13518.6 116.3 0.38 0.49 17.6 14.9 0.13 46.8MDR 4.3 9117.2 95.5 0.41 0.52 15.3 12.9 0.12 44.6MDR 7.3 5370.4 73.3 0.48 0.57 12.0 10.3 0.12 42.7MDR 10.9 3596.7 60.0 0.52 0.6 10.2 8.8 0.11 41.0MDR 14.5 2703.7 52.0 0.55 0.63 9.0 7.7 0.11 40.6HDR 24 1633.5 40.4 0.66 0.71 6.3 5.6 0.12 43.1HDR 43 911.7 30.2 0.76 0.79 4.2 3.9 0.13 46.9
N. Com - - 50.0 0.76 0.79 5.5 5.0 0.17 60.3G. Com - - 50.0 0.8 0.82 4.8 4.5 0.19 66.8
O.P./Com - - 50.0 0.83 0.85 4.3 4.0 0.21 74.8Ltd. I. - - 50.0 0.83 0.85 4.3 4.0 0.21 74.8Gen. I. - - 50.0 0.87 0.87 3.7 3.7 0.23 81.3
Table IA – 0.5% slope
Element DU/Acre .9Area Lot L Lot L Select Low C High C Ti Low C Ti High C V High C L 6-min Natural - - 200.0 50.0 0.2 0.35 14.4 12.0 0.07 24.9
LDR 1 39204.0 198.0 50.0 0.27 0.41 13.3 11.1 0.08 27.1LDR 2 19602.0 140.0 50.0 0.34 0.46 12.2 10.3 0.08 29.2LDR 2.9 13518.6 116.3 50.0 0.38 0.49 11.5 9.8 0.09 30.7MDR 4.3 9117.2 95.5 50.0 0.41 0.52 11.1 9.3 0.09 32.3MDR 7.3 5370.4 73.3 50.0 0.48 0.57 9.9 8.5 0.10 35.3MDR 10.9 3596.7 60.0 50.0 0.52 0.6 9.3 8.0 0.10 37.4MDR 14.5 2703.7 52.0 50.0 0.55 0.63 8.8 7.5 0.11 39.8HDR 24 1633.5 40.4 50.0 0.66 0.71 7.1 6.3 0.13 48.0HDR 43 911.7 30.2 50.0 0.76 0.79 5.5 5.0 0.17 60.3
N. Com - - 50.0 50.0 0.76 0.79 5.5 5.0 0.17 60.3G. Com - - 50.0 50.0 0.8 0.82 4.8 4.5 0.19 66.8
O.P./Com - - 50.0 50.0 0.83 0.85 4.3 4.0 0.21 74.8Ltd. I. - - 50.0 50.0 0.83 0.85 4.3 4.0 0.21 74.8Gen. I. - - 50.0 50.0 0.87 0.87 3.7 3.7 0.23 81.3
5
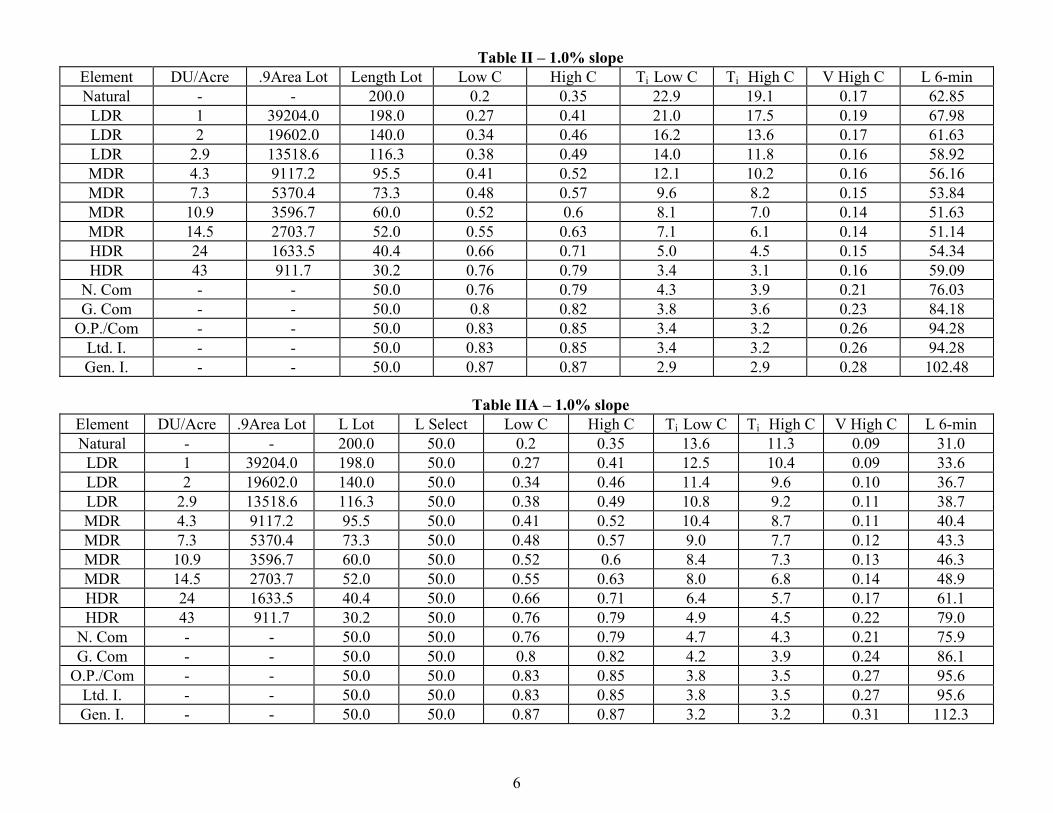
Table II – 1.0% slope Element DU/Acre .9Area Lot Length Lot Low C High C Ti Low C Ti High C V High C L 6-min Natural - - 200.0 0.2 0.35 22.9 19.1 0.17 62.85
LDR 1 39204.0 198.0 0.27 0.41 21.0 17.5 0.19 67.98LDR 2 19602.0 140.0 0.34 0.46 16.2 13.6 0.17 61.63LDR 2.9 13518.6 116.3 0.38 0.49 14.0 11.8 0.16 58.92MDR 4.3 9117.2 95.5 0.41 0.52 12.1 10.2 0.16 56.16MDR 7.3 5370.4 73.3 0.48 0.57 9.6 8.2 0.15 53.84MDR 10.9 3596.7 60.0 0.52 0.6 8.1 7.0 0.14 51.63MDR 14.5 2703.7 52.0 0.55 0.63 7.1 6.1 0.14 51.14HDR 24 1633.5 40.4 0.66 0.71 5.0 4.5 0.15 54.34HDR 43 911.7 30.2 0.76 0.79 3.4 3.1 0.16 59.09
N. Com - - 50.0 0.76 0.79 4.3 3.9 0.21 76.03G. Com - - 50.0 0.8 0.82 3.8 3.6 0.23 84.18
O.P./Com - - 50.0 0.83 0.85 3.4 3.2 0.26 94.28Ltd. I. - - 50.0 0.83 0.85 3.4 3.2 0.26 94.28Gen. I. - - 50.0 0.87 0.87 2.9 2.9 0.28 102.48
Table IIA – 1.0% slope
Element DU/Acre .9Area Lot L Lot L Select Low C High C Ti Low C Ti High C V High C L 6-min Natural - - 200.0 50.0 0.2 0.35 13.6 11.3 0.09 31.0
LDR 1 39204.0 198.0 50.0 0.27 0.41 12.5 10.4 0.09 33.6LDR 2 19602.0 140.0 50.0 0.34 0.46 11.4 9.6 0.10 36.7LDR 2.9 13518.6 116.3 50.0 0.38 0.49 10.8 9.2 0.11 38.7MDR 4.3 9117.2 95.5 50.0 0.41 0.52 10.4 8.7 0.11 40.4MDR 7.3 5370.4 73.3 50.0 0.48 0.57 9.0 7.7 0.12 43.3MDR 10.9 3596.7 60.0 50.0 0.52 0.6 8.4 7.3 0.13 46.3MDR 14.5 2703.7 52.0 50.0 0.55 0.63 8.0 6.8 0.14 48.9HDR 24 1633.5 40.4 50.0 0.66 0.71 6.4 5.7 0.17 61.1HDR 43 911.7 30.2 50.0 0.76 0.79 4.9 4.5 0.22 79.0
N. Com - - 50.0 50.0 0.76 0.79 4.7 4.3 0.21 75.9G. Com - - 50.0 50.0 0.8 0.82 4.2 3.9 0.24 86.1
O.P./Com - - 50.0 50.0 0.83 0.85 3.8 3.5 0.27 95.6Ltd. I. - - 50.0 50.0 0.83 0.85 3.8 3.5 0.27 95.6Gen. I. - - 50.0 50.0 0.87 0.87 3.2 3.2 0.31 112.3
6
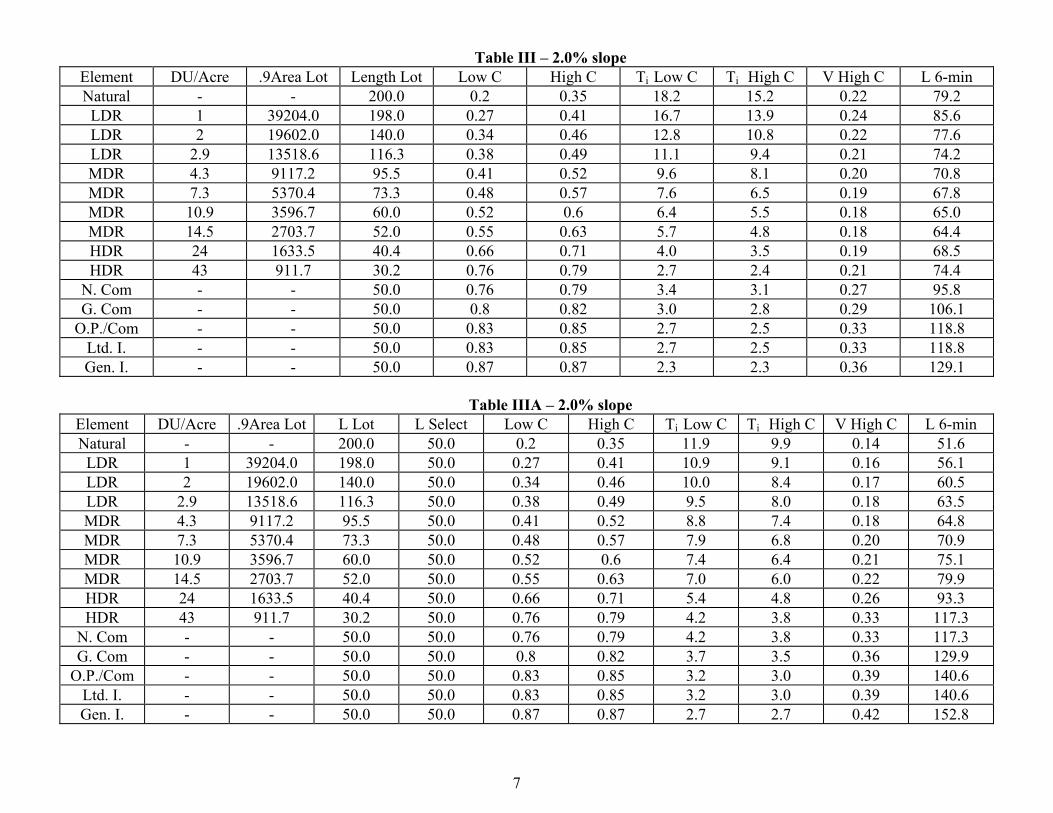
Table III – 2.0% slope Element DU/Acre .9Area Lot Length Lot Low C High C Ti Low C Ti High C V High C L 6-min Natural - - 200.0 0.2 0.35 18.2 15.2 0.22 79.2
LDR 1 39204.0 198.0 0.27 0.41 16.7 13.9 0.24 85.6LDR 2 19602.0 140.0 0.34 0.46 12.8 10.8 0.22 77.6LDR 2.9 13518.6 116.3 0.38 0.49 11.1 9.4 0.21 74.2MDR 4.3 9117.2 95.5 0.41 0.52 9.6 8.1 0.20 70.8MDR 7.3 5370.4 73.3 0.48 0.57 7.6 6.5 0.19 67.8MDR 10.9 3596.7 60.0 0.52 0.6 6.4 5.5 0.18 65.0MDR 14.5 2703.7 52.0 0.55 0.63 5.7 4.8 0.18 64.4HDR 24 1633.5 40.4 0.66 0.71 4.0 3.5 0.19 68.5HDR 43 911.7 30.2 0.76 0.79 2.7 2.4 0.21 74.4
N. Com - - 50.0 0.76 0.79 3.4 3.1 0.27 95.8G. Com - - 50.0 0.8 0.82 3.0 2.8 0.29 106.1
O.P./Com - - 50.0 0.83 0.85 2.7 2.5 0.33 118.8Ltd. I. - - 50.0 0.83 0.85 2.7 2.5 0.33 118.8Gen. I. - - 50.0 0.87 0.87 2.3 2.3 0.36 129.1
Table IIIA – 2.0% slope
Element DU/Acre .9Area Lot L Lot L Select Low C High C Ti Low C Ti High C V High C L 6-min Natural - - 200.0 50.0 0.2 0.35 11.9 9.9 0.14 51.6
LDR 1 39204.0 198.0 50.0 0.27 0.41 10.9 9.1 0.16 56.1LDR 2 19602.0 140.0 50.0 0.34 0.46 10.0 8.4 0.17 60.5LDR 2.9 13518.6 116.3 50.0 0.38 0.49 9.5 8.0 0.18 63.5MDR 4.3 9117.2 95.5 50.0 0.41 0.52 8.8 7.4 0.18 64.8MDR 7.3 5370.4 73.3 50.0 0.48 0.57 7.9 6.8 0.20 70.9MDR 10.9 3596.7 60.0 50.0 0.52 0.6 7.4 6.4 0.21 75.1MDR 14.5 2703.7 52.0 50.0 0.55 0.63 7.0 6.0 0.22 79.9HDR 24 1633.5 40.4 50.0 0.66 0.71 5.4 4.8 0.26 93.3HDR 43 911.7 30.2 50.0 0.76 0.79 4.2 3.8 0.33 117.3
N. Com - - 50.0 50.0 0.76 0.79 4.2 3.8 0.33 117.3G. Com - - 50.0 50.0 0.8 0.82 3.7 3.5 0.36 129.9
O.P./Com - - 50.0 50.0 0.83 0.85 3.2 3.0 0.39 140.6Ltd. I. - - 50.0 50.0 0.83 0.85 3.2 3.0 0.39 140.6Gen. I. - - 50.0 50.0 0.87 0.87 2.7 2.7 0.42 152.8
7
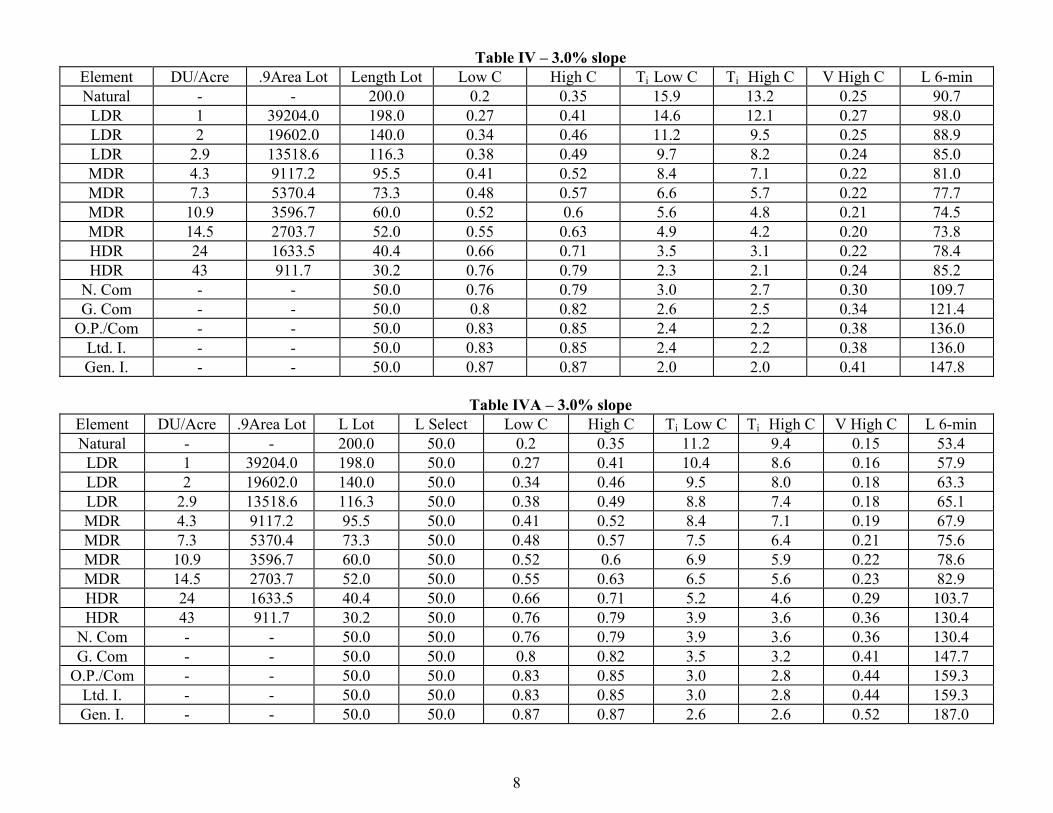
Table IV – 3.0% slope Element DU/Acre .9Area Lot Length Lot Low C High C Ti Low C Ti High C V High C L 6-min Natural - - 200.0 0.2 0.35 15.9 13.2 0.25 90.7
LDR 1 39204.0 198.0 0.27 0.41 14.6 12.1 0.27 98.0LDR 2 19602.0 140.0 0.34 0.46 11.2 9.5 0.25 88.9LDR 2.9 13518.6 116.3 0.38 0.49 9.7 8.2 0.24 85.0MDR 4.3 9117.2 95.5 0.41 0.52 8.4 7.1 0.22 81.0MDR 7.3 5370.4 73.3 0.48 0.57 6.6 5.7 0.22 77.7MDR 10.9 3596.7 60.0 0.52 0.6 5.6 4.8 0.21 74.5MDR 14.5 2703.7 52.0 0.55 0.63 4.9 4.2 0.20 73.8HDR 24 1633.5 40.4 0.66 0.71 3.5 3.1 0.22 78.4HDR 43 911.7 30.2 0.76 0.79 2.3 2.1 0.24 85.2
N. Com - - 50.0 0.76 0.79 3.0 2.7 0.30 109.7G. Com - - 50.0 0.8 0.82 2.6 2.5 0.34 121.4
O.P./Com - - 50.0 0.83 0.85 2.4 2.2 0.38 136.0Ltd. I. - - 50.0 0.83 0.85 2.4 2.2 0.38 136.0Gen. I. - - 50.0 0.87 0.87 2.0 2.0 0.41 147.8
Table IVA – 3.0% slope
Element DU/Acre .9Area Lot L Lot L Select Low C High C Ti Low C Ti High C V High C L 6-min Natural - - 200.0 50.0 0.2 0.35 11.2 9.4 0.15 53.4
LDR 1 39204.0 198.0 50.0 0.27 0.41 10.4 8.6 0.16 57.9LDR 2 19602.0 140.0 50.0 0.34 0.46 9.5 8.0 0.18 63.3LDR 2.9 13518.6 116.3 50.0 0.38 0.49 8.8 7.4 0.18 65.1MDR 4.3 9117.2 95.5 50.0 0.41 0.52 8.4 7.1 0.19 67.9MDR 7.3 5370.4 73.3 50.0 0.48 0.57 7.5 6.4 0.21 75.6MDR 10.9 3596.7 60.0 50.0 0.52 0.6 6.9 5.9 0.22 78.6MDR 14.5 2703.7 52.0 50.0 0.55 0.63 6.5 5.6 0.23 82.9HDR 24 1633.5 40.4 50.0 0.66 0.71 5.2 4.6 0.29 103.7HDR 43 911.7 30.2 50.0 0.76 0.79 3.9 3.6 0.36 130.4
N. Com - - 50.0 50.0 0.76 0.79 3.9 3.6 0.36 130.4G. Com - - 50.0 50.0 0.8 0.82 3.5 3.2 0.41 147.7
O.P./Com - - 50.0 50.0 0.83 0.85 3.0 2.8 0.44 159.3Ltd. I. - - 50.0 50.0 0.83 0.85 3.0 2.8 0.44 159.3Gen. I. - - 50.0 50.0 0.87 0.87 2.6 2.6 0.52 187.0
8

Table V – 5.0% slope Element DU/Acre .9Area Lot Length Lot Low C High C Ti Low C Ti High C V High C L 6-min Natural - - 200.0 0.2 0.35 13.4 11.2 0.30 107.5
LDR 1 39204.0 198.0 0.27 0.41 12.3 10.2 0.32 116.2LDR 2 19602.0 140.0 0.34 0.46 9.5 8.0 0.29 105.4LDR 2.9 13518.6 116.3 0.38 0.49 8.2 6.9 0.28 100.8MDR 4.3 9117.2 95.5 0.41 0.52 7.1 6.0 0.27 96.0MDR 7.3 5370.4 73.3 0.48 0.57 5.6 4.8 0.26 92.1MDR 10.9 3596.7 60.0 0.52 0.6 4.7 4.1 0.25 88.3MDR 14.5 2703.7 52.0 0.55 0.63 4.2 3.6 0.24 87.5HDR 24 1633.5 40.4 0.66 0.71 2.9 2.6 0.26 92.9HDR 43 911.7 30.2 0.76 0.79 2.0 1.8 0.28 101.0
N. Com - - 50.0 0.76 0.79 2.5 2.3 0.36 130.0G. Com - - 50.0 0.8 0.82 2.2 2.1 0.40 143.9
O.P./Com - - 50.0 0.83 0.85 2.0 1.9 0.45 161.2Ltd. I. - - 50.0 0.83 0.85 2.0 1.9 0.45 161.2Gen. I. - - 50.0 0.87 0.87 1.7 1.7 0.49 175.2
Table VA – 5.0% slope
Element DU/Acre .9Area Lot L Lot L Select Low C High C Ti Low C Ti High C V High C L 6-min Natural - - 200.0 50.0 0.2 0.35 9.5 7.9 0.21 76.0
LDR 1 39204.0 198.0 50.0 0.27 0.41 8.7 7.3 0.23 82.6LDR 2 19602.0 140.0 50.0 0.34 0.46 8.0 6.7 0.25 89.1LDR 2.9 13518.6 116.3 50.0 0.38 0.49 7.6 6.4 0.26 93.4MDR 4.3 9117.2 95.5 50.0 0.41 0.52 7.3 6.1 0.27 98.3MDR 7.3 5370.4 73.3 50.0 0.48 0.57 6.5 5.6 0.30 107.5MDR 10.9 3596.7 60.0 50.0 0.52 0.6 6.1 5.3 0.32 114.0MDR 14.5 2703.7 52.0 50.0 0.55 0.63 5.8 4.9 0.34 121.3HDR 24 1633.5 40.4 50.0 0.66 0.71 4.5 4.0 0.40 142.5HDR 43 911.7 30.2 50.0 0.76 0.79 3.5 3.2 0.50 179.2
N. Com - - 50.0 50.0 0.76 0.79 3.5 3.2 0.50 179.2G. Com - - 50.0 50.0 0.8 0.82 3.0 2.8 0.54 193.1
O.P./Com - - 50.0 50.0 0.83 0.85 2.7 2.5 0.60 216.3Ltd. I. - - 50.0 50.0 0.83 0.85 2.7 2.5 0.60 216.3Gen. I. - - 50.0 50.0 0.87 0.87 2.3 2.3 0.65 235.1
9
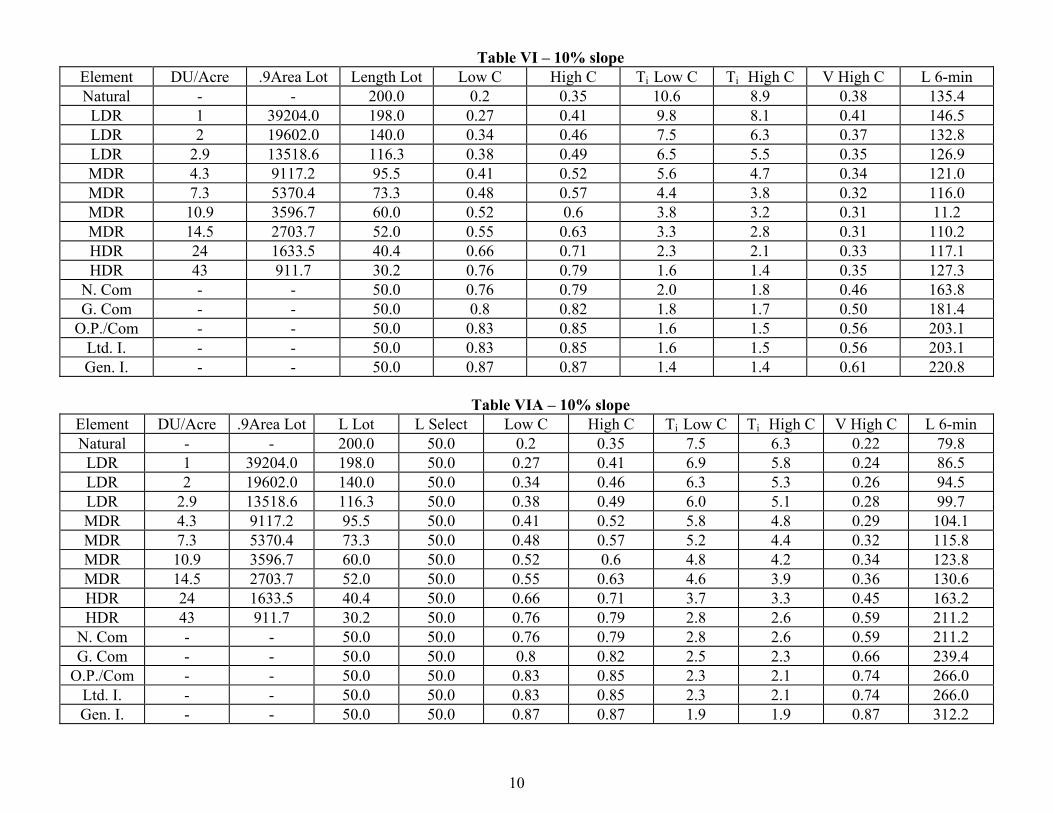
Table VI – 10% slope Element DU/Acre .9Area Lot Length Lot Low C High C Ti Low C Ti High C V High C L 6-min Natural - - 200.0 0.2 0.35 10.6 8.9 0.38 135.4
LDR 1 39204.0 198.0 0.27 0.41 9.8 8.1 0.41 146.5LDR 2 19602.0 140.0 0.34 0.46 7.5 6.3 0.37 132.8LDR 2.9 13518.6 116.3 0.38 0.49 6.5 5.5 0.35 126.9MDR 4.3 9117.2 95.5 0.41 0.52 5.6 4.7 0.34 121.0MDR 7.3 5370.4 73.3 0.48 0.57 4.4 3.8 0.32 116.0MDR 10.9 3596.7 60.0 0.52 0.6 3.8 3.2 0.31 11.2MDR 14.5 2703.7 52.0 0.55 0.63 3.3 2.8 0.31 110.2HDR 24 1633.5 40.4 0.66 0.71 2.3 2.1 0.33 117.1HDR 43 911.7 30.2 0.76 0.79 1.6 1.4 0.35 127.3
N. Com - - 50.0 0.76 0.79 2.0 1.8 0.46 163.8G. Com - - 50.0 0.8 0.82 1.8 1.7 0.50 181.4
O.P./Com - - 50.0 0.83 0.85 1.6 1.5 0.56 203.1Ltd. I. - - 50.0 0.83 0.85 1.6 1.5 0.56 203.1Gen. I. - - 50.0 0.87 0.87 1.4 1.4 0.61 220.8
Table VIA – 10% slope
Element DU/Acre .9Area Lot L Lot L Select Low C High C Ti Low C Ti High C V High C L 6-min Natural - - 200.0 50.0 0.2 0.35 7.5 6.3 0.22 79.8
LDR 1 39204.0 198.0 50.0 0.27 0.41 6.9 5.8 0.24 86.5LDR 2 19602.0 140.0 50.0 0.34 0.46 6.3 5.3 0.26 94.5LDR 2.9 13518.6 116.3 50.0 0.38 0.49 6.0 5.1 0.28 99.7MDR 4.3 9117.2 95.5 50.0 0.41 0.52 5.8 4.8 0.29 104.1MDR 7.3 5370.4 73.3 50.0 0.48 0.57 5.2 4.4 0.32 115.8MDR 10.9 3596.7 60.0 50.0 0.52 0.6 4.8 4.2 0.34 123.8MDR 14.5 2703.7 52.0 50.0 0.55 0.63 4.6 3.9 0.36 130.6HDR 24 1633.5 40.4 50.0 0.66 0.71 3.7 3.3 0.45 163.2HDR 43 911.7 30.2 50.0 0.76 0.79 2.8 2.6 0.59 211.2
N. Com - - 50.0 50.0 0.76 0.79 2.8 2.6 0.59 211.2G. Com - - 50.0 50.0 0.8 0.82 2.5 2.3 0.66 239.4
O.P./Com - - 50.0 50.0 0.83 0.85 2.3 2.1 0.74 266.0Ltd. I. 50.0 - - 50.0 0.83 0.85 2.3 2.1 0.74 266.0Gen. I. - - 50.0 50.0 0.87 0.87 1.9 1.9 0.87 312.2
10
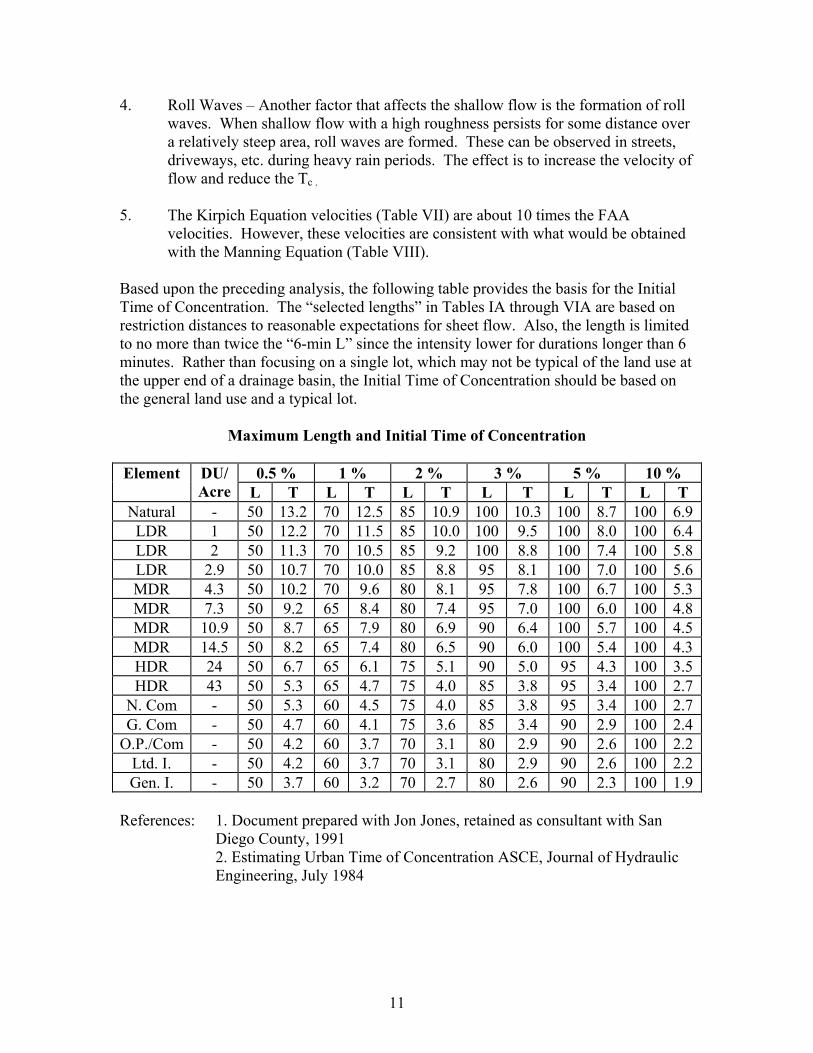
4. Roll Waves – Another factor that affects the shallow flow is the formation of roll waves. When shallow flow with a high roughness persists for some distance over a relatively steep area, roll waves are formed. These can be observed in streets, driveways, etc. during heavy rain periods. The effect is to increase the velocity of flow and reduce the Tc .
5. The Kirpich Equation velocities (Table VII) are about 10 times the FAA
velocities. However, these velocities are consistent with what would be obtained with the Manning Equation (Table VIII).
Based upon the preceding analysis, the following table provides the basis for the Initial Time of Concentration. The “selected lengths” in Tables IA through VIA are based on restriction distances to reasonable expectations for sheet flow. Also, the length is limited to no more than twice the “6-min L” since the intensity lower for durations longer than 6 minutes. Rather than focusing on a single lot, which may not be typical of the land use at the upper end of a drainage basin, the Initial Time of Concentration should be based on the general land use and a typical lot.
Maximum Length and Initial Time of Concentration
0.5 % 1 % 2 % 3 % 5 % 10 % Element DU/ Acre L T L T L T L T L T L T
Natural - 50 13.2 70 12.5 85 10.9 100 10.3 100 8.7 100 6.9 LDR 1 50 12.2 70 11.5 85 10.0 100 9.5 100 8.0 100 6.4 LDR 2 50 11.3 70 10.5 85 9.2 100 8.8 100 7.4 100 5.8 LDR 2.9 50 10.7 70 10.0 85 8.8 95 8.1 100 7.0 100 5.6 MDR 4.3 50 10.2 70 9.6 80 8.1 95 7.8 100 6.7 100 5.3 MDR 7.3 50 9.2 65 8.4 80 7.4 95 7.0 100 6.0 100 4.8 MDR 10.9 50 8.7 65 7.9 80 6.9 90 6.4 100 5.7 100 4.5 MDR 14.5 50 8.2 65 7.4 80 6.5 90 6.0 100 5.4 100 4.3 HDR 24 50 6.7 65 6.1 75 5.1 90 5.0 95 4.3 100 3.5 HDR 43 50 5.3 65 4.7 75 4.0 85 3.8 95 3.4 100 2.7
N. Com - 50 5.3 60 4.5 75 4.0 85 3.8 95 3.4 100 2.7 G. Com - 50 4.7 60 4.1 75 3.6 85 3.4 90 2.9 100 2.4
O.P./Com - 50 4.2 60 3.7 70 3.1 80 2.9 90 2.6 100 2.2 Ltd. I. - 50 4.2 60 3.7 70 3.1 80 2.9 90 2.6 100 2.2 Gen. I. - 50 3.7 60 3.2 70 2.7 80 2.6 90 2.3 100 1.9
References: 1. Document prepared with Jon Jones, retained as consultant with San
Diego County, 1991 2. Estimating Urban Time of Concentration ASCE, Journal of Hydraulic
Engineering, July 1984
11
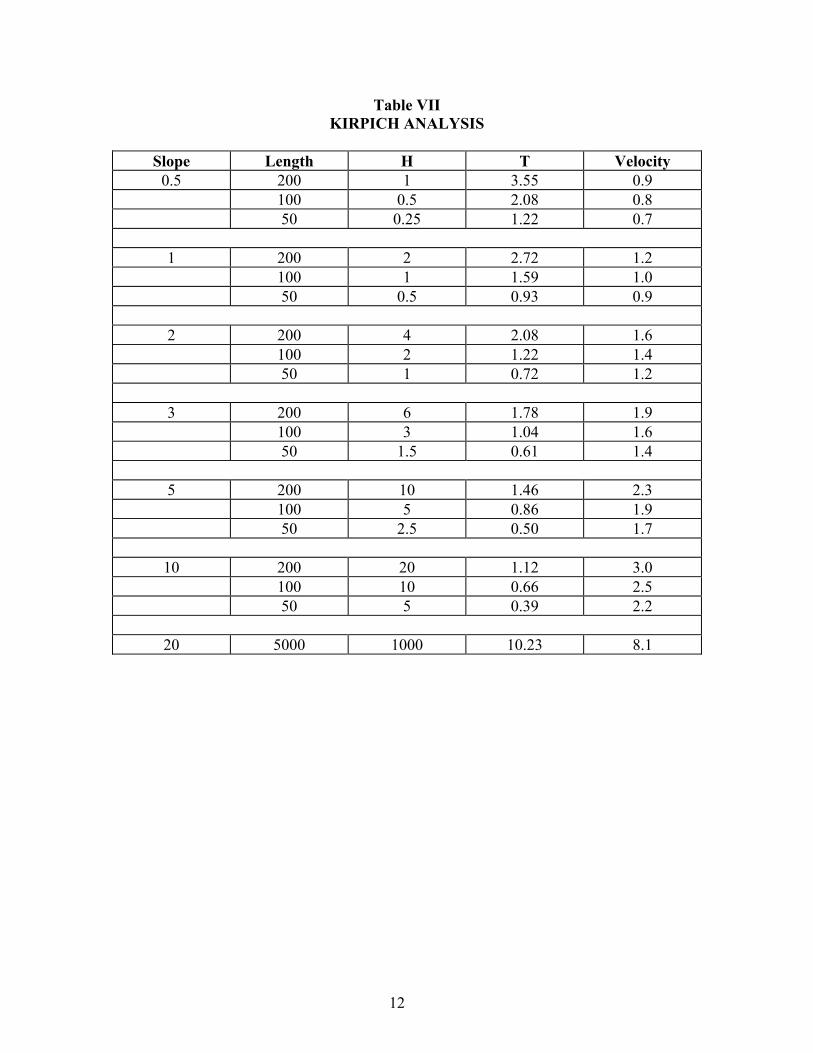
Table VII KIRPICH ANALYSIS
Slope Length H T Velocity
0.5 200 1 3.55 0.9 100 0.5 2.08 0.8 50 0.25 1.22 0.7
1 200 2 2.72 1.2 100 1 1.59 1.0 50 0.5 0.93 0.9
2 200 4 2.08 1.6 100 2 1.22 1.4 50 1 0.72 1.2
3 200 6 1.78 1.9 100 3 1.04 1.6 50 1.5 0.61 1.4
5 200 10 1.46 2.3 100 5 0.86 1.9 50 2.5 0.50 1.7
10 200 20 1.12 3.0
100 10 0.66 2.5 50 5 0.39 2.2
20 5000 1000 10.23 8.1
12

Table VIII OVERLAND FLOW*
Over Pavement Lawns N = 0.15 N = 0.10 N = 0.10 N = 0.10 N = 0.10 N = 0.20 N = 0.20
S %
Depth 0.25” 0.25” 0.3” 0.5” 0.7” 0.5” 1.5”
0.5 Velocity 0.053 0.080 0.090 0.126 0.158 0.063 0.131
C
q
Unit Flow 0.0011 0.0017 0.0022 0.0053 0.0092 0.0026 0.0164 0.2 0.0032
1 Velocity 0.0750 0.1125 0.1271 0.1786 0.2235 0.0893 0.1858 Unit Flow
0.0016 0.0023 0.0032 0.0074 0.0130 0.0037 0.0232
0.3 0.0048
2
Velocity 0.1061 0.1591 0.1797 0.2526 0.3161 0.1263 0.26270.4 0.0064
Unit Flow 0.0022 0.0033 0.0045 0.0105 0.0184 0.0053 0.0328
0.5 0.0080
3 Velocity 0.1299 0.1949 0.2201 0.3093 0.3871 0.1547 0.3217Unit Flow 0.0027 0.0041 0.0055 0.0129 0.0226 0.0064 0.0402
0.6 0.0096
5
Velocity 0.1677 0.2516 0.2841 0.3994 0.4998 0.1997 0.4154
0.7 0.0112
Unit Flow 0.0035 0.0052 0.0071 0.0166 0.0292 0.0083 0.0519
0.8 0.0128
10 Velocity 0.2372 0.3558 0.4018 0.5648 0.7068 0.2824 0.5874 Unit Flow
0.0049 0.0074 0.0100 0.0235 0.0412 0.0118 0.0734
0.87 0.0139
* Reference: Corps of Engineers HEC-1 Users Manual, shallow sheet flow over one foot wide section, Unit Runoff q =CIA, Tc = 6 minutes, I = 7.03.
13

Table IX Soil Type D 0.5% 1% 2% 3% 5% 10%
Element DU/Acre C L T L T L T L T L T L T Natural - 0.35 50 12.0 70 11.3 85 9.9 100 9.4 100 7.9 100 6.3
LDR 1 0.41 50 11.1 70 10.4 85 9.1 100 8.6 100 7.3 100 5.8LDR 2 0.46 50 10.3 70 9.6 85 8.4 100 8.0 100 6.7 100 5.3LDR 2.9 0.49 50 9.8 70 9.2 85 8.0 95 7.4 100 6.4 100 5.1MDR 4.3 0.52 50 9.3 70 8.7 80 7.4 95 7.1 100 6.1 100 4.8MDR 7.3 0.57 50 8.5 65 7.7 80 6.8 95 6.4 100 5.6 100 4.4MDR 10.9 0.6 50 8.0 65 7.3 80 6.4 90 5.9 100 5.3 100 4.2MDR 14.5 0.63 50 7.5 65 6.8 80 6.0 90 5.6 100 4.9 100 3.9HDR 24 0.71 50 6.3 65 5.7 75 4.8 90 4.6 95 4.0 100 3.3HDR 43 0.79 50 5.0 65 4.5 75 3.8 85 3.6 95 3.2 100 2.6
N. Com - 0.79 50 5.0 60 4.3 75 3.8 85 3.6 95 3.2 100 2.6G. Com - 0.82 50 4.5 60 3.9 75 3.5 85 3.2 90 2.8 100 2.3
O.P./Com - 0.85 50 4.0 60 3.5 70 3.0 80 2.8 90 2.5 100 2.1Ltd. I - 0.85 50 4.0 60 3.5 70 3.0 80 2.8 90 2.5 100 2.1Gen. I - 0.87 50 3.7 60 3.2 70 2.7 80 2.6 90 2.3 100 1.9
Soil Type C 0.5% 1% 2% 3% 5% 10% Element DU/Acre C L T L T L T L T L T L T Natural - 0.3 50 12.8 70 12.0 85 10.5 100 10.0 100 8.4 100 6.7
LDR 1 0.36 50 11.9 70 11.1 85 9.7 100 9.2 100 7.8 100 6.2LDR 2 0.42 50 10.9 70 10.2 85 9.0 100 8.5 100 7.2 100 5.7LDR 2.9 0.45 50 10.4 70 9.8 85 8.6 95 7.9 100 6.8 100 5.4MDR 4.3 0.48 50 9.9 70 9.3 80 7.9 95 7.5 100 6.5 100 5.2MDR 7.3 0.54 50 9.0 65 8.1 80 7.2 95 6.8 100 5.9 100 4.7MDR 10.9 0.57 50 8.5 65 7.7 80 6.8 90 6.3 100 5.6 100 4.4MDR 14.5 0.6 50 8.0 65 7.3 80 6.4 90 5.9 100 5.3 100 4.2HDR 24 0.69 50 6.6 65 5.9 75 5.1 90 4.9 95 4.2 100 3.4HDR 43 0.78 50 5.1 65 4.6 75 4.0 85 3.7 95 3.3 100 2.7
N. Com - 0.78 50 5.1 60 4.5 75 4.0 85 3.7 95 3.3 100 2.7G. Com - 0.81 50 4.7 60 4.0 75 3.6 85 3.3 90 2.9 100 2.4
O.P./Com - 0.84 50 4.2 60 3.6 70 3.1 80 2.9 90 2.6 100 2.2Ltd. I - 0.84 50 4.2 60 3.6 70 3.1 80 2.9 90 2.6 100 2.2Gen. I - 0.87 50 3.7 60 3.2 70 2.7 80 2.6 90 2.3 100 1.9
14

Soil Type B 0.5% 1% 2% 3% 5% 10% Element DU/Acre C L T L T L T L T L T L T Natural - 0.25 50 13.6 70 12.8 85 11.2 100 10.6 100 8.9 100 7.1
LDR 1 0.32 50 12.5 70 11.7 85 10.3 100 9.7 100 8.2 100 6.5LDR 2 0.38 50 11.5 70 10.8 85 9.5 100 9.0 100 7.6 100 6.0LDR 2.9 0.41 50 11.1 70 10.4 85 9.1 95 8.4 100 7.3 100 5.8MDR 4.3 0.45 50 10.4 70 9.8 80 8.3 95 7.9 100 6.8 100 5.4MDR 7.3 0.51 50 9.5 65 8.6 80 7.5 95 7.2 100 6.2 100 4.9MDR 10.9 0.54 50 9.0 65 8.1 80 7.2 90 6.6 100 5.9 100 4.7MDR 14.5 0.58 50 8.3 65 7.5 80 6.6 90 6.2 100 5.5 100 4.3HDR 24 0.67 50 6.9 65 6.2 75 5.3 90 5.1 95 4.4 100 3.6HDR 43 0.77 50 5.3 65 4.8 75 4.1 85 3.8 95 3.4 100 2.8
N. Com - 0.77 50 5.3 60 4.6 75 4.1 85 3.8 95 3.4 100 2.8G. Com - 0.8 50 4.8 60 4.2 75 3.7 85 3.5 90 3.0 100 2.5
O.P./Com - 0.84 50 4.2 60 3.6 70 3.1 80 2.9 90 2.6 100 2.2Ltd. I - 0.84 50 4.2 60 3.6 70 3.1 80 2.9 90 2.6 100 2.2Gen. I - 0.87 50 3.7 60 3.2 70 2.7 80 2.6 90 2.3 100 1.9
Soil Type A 0.5% 1% 2% 3% 5% 10% Element DU/Acre C L T L T L T L T L T L T Natural - 0.2 50 14.4 70 13.6 85 11.9 100 11.2 100 9.5 100 7.5
LDR 1 0.27 50 13.3 70 12.5 85 10.9 100 10.4 100 8.7 100 6.9LDR 2 0.34 50 12.2 70 11.4 85 10.0 100 9.5 100 8.0 100 6.3LDR 2.9 0.38 50 11.5 70 10.8 85 9.5 95 8.8 100 7.6 100 6.0MDR 4.3 0.41 50 11.1 70 10.4 80 8.8 95 8.4 100 7.3 100 5.8MDR 7.3 0.48 50 9.9 65 9.0 80 7.9 95 7.5 100 6.5 100 5.2MDR 10.9 0.52 50 9.3 65 8.4 80 7.4 90 6.9 100 6.1 100 4.8MDR 14.5 0.55 50 8.8 65 8.0 80 7.0 90 6.5 100 5.8 100 4.6HDR 24 0.66 50 7.1 65 6.4 75 5.4 90 5.2 95 4.5 100 3.7HDR 43 0.76 50 5.5 65 4.9 75 4.2 85 3.9 95 3.5 100 2.8
N. Com - 0.76 50 5.5 60 4.7 75 4.2 85 3.9 95 3.5 100 2.8G. Com - 0.8 50 4.8 60 4.2 75 3.7 85 3.5 90 3.0 100 2.5
O.P./Com - 0.83 50 4.3 60 3.8 70 3.2 80 3.0 90 2.7 100 2.3Ltd. I - 0.83 50 4.3 60 3.8 70 3.2 80 3.0 90 2.7 100 2.3Gen. I - 0.87 50 3.7 60 3.2 70 2.7 80 2.6 90 2.3 100 1.9
15