
Initial Standardized Canister System Evaluation · Josh Jarrell, Robby Joseph, ... (ISF) or...
112
Fuel Cycle Research & Development Initial Standardized Canister System Evaluation Prepared for US Department of Energy Nuclear Fuels Storage and Transportation Planning Project Josh Jarrell, Robby Joseph, Rob Howard, Richard Hale, Gordon Petersen, Blake Wilkerson Oak Ridge National Laboratory Jeff Fortner, Argonne National Laboratory Elena Kalinina, Sandia National Laboratories September 2015 FCRD-NFST-2014-000084 Rev. 1 ORNL/LTR-2014/330
Transcript of Initial Standardized Canister System Evaluation · Josh Jarrell, Robby Joseph, ... (ISF) or...

Fuel Cycle Research & Development
Initial Standardized Canister System Evaluation
Prepared for US Department of Energy
Nuclear Fuels Storage and Transportation
Planning Project
Josh Jarrell, Robby Joseph, Rob Howard,
Richard Hale, Gordon Petersen, Blake Wilkerson
Oak Ridge National Laboratory
Jeff Fortner,
Argonne National Laboratory
Elena Kalinina,
Sandia National Laboratories
September 2015 FCRD-NFST-2014-000084 Rev. 1
ORNL/LTR-2014/330
Oak Ridge National Laboratory is a multi-program laboratory managed and operated by UT-Battelle, LLC for the
U.S. Department of Energy under contract DE-AC05-00OR22725.
DISCLAIMER
This information was prepared as an account of work sponsored by an
agency of the U.S. Government. Neither the U.S. Government nor any
agency thereof, nor any of their employees, makes any warranty,
expressed or implied, or assumes any legal liability or responsibility for
the accuracy, completeness, or usefulness, of any information, apparatus,
product, or process disclosed, or represents that its use would not infringe
privately owned rights. References herein to any specific commercial
product, process, or service by trade name, trade mark, manufacturer, or
otherwise, does not necessarily constitute or imply its endorsement,
recommendation, or favoring by the U.S. Government or any agency
thereof. The views and opinions of authors expressed herein do not
necessarily state or reflect those of the U.S. Government or any agency
thereof.
It should be noted that this is a technical report that does not take into
account the contractual limitations under the Standard Contract (10 CFR
Part 961). Under the provisions of the Standard Contract, DOE does not
consider spent fuel in canisters to be an acceptable waste form, absent a
mutually agreed to contract modification.

Initial Standardized Canister System Evaluation September 2015 iii
HISTORY OF CHANGE
Rev. 0 Initial Issuance on 08-29-2014.
Rev. 1 Revised to incorporated comments from
Department of Energy.

Initial Standardized Canister System Evaluation iv September 2015
EXECUTIVE SUMMARY
This report documents an initial evaluation of integrating standardized canisters into the nuclear waste
management system, which is an intermediate step in the quantitative assessment of standardization. This is a technical report that does not take into account the contractual limitations under the Standard
Contract (10 CFR Part 961) that DOE has in place with nuclear utilities. Under the Standard Contract,
DOE is obligated to accept only bare UNF. Acceptance of canistered UNF would require a mutual
agreement to modify the contract. This report reflects research and development efforts to explore
technical concepts which could support future decision making by DOE. No inferences should be drawn
from this report regarding future actions by DOE.
The evaluation focuses on scenarios in which standardized canisters designed for storage, transportation,
and disposal are loaded at reactors before being stored onsite or shipped to an interim storage facility
(ISF) or repository. Other strategies, such as shipment of bare fuel to an ISF and using standardized
canisters for storage and subsequent transportation and disposal from that point forward, will be evaluated
in future studies. This report highlights preliminary observations, identifies needed information moving
forward, and guides future evaluation work. No observations in this report should be considered final,
as additional system model logic verification, data verification, and collection are ongoing and will
impact these observations.
The larger standardization assessment is a multi-year undertaking with a goal to fully understand the
impacts of integrating standardized canister systems into the waste management system. At its
conclusion, the standardization assessment will quantify the relative impacts (cost, operational, etc.) on
the nuclear waste management system if standardization strategies are selected before disposal
requirements are known. These impacts will be quantified whether the standardization strategies are
determined to be compatible or incompatible with the final repository concept. Standardization options
are of significant interest in the context of the Administration’s Strategy for the Management and
Disposal of Used Nuclear Fuel and High-Level Radioactive Waste (Strategy) (Ref. 1), which includes a
consent-based siting process. A consent-based siting process keeps all generic repository concepts as
potential options. Because the repository site and design is not yet determined, it is important to quantify
and understand how changing canister-related options may impact the waste management system. This
initial evaluation report details how initial (i.e., near-term) standardization strategies (including no
standardization) might be impacted by the ultimate determination of waste package1 (WP) size.
The most prominent observation from this initial evaluation is that there are significant data collection
and verification needs in order to draw the necessary conclusions from future evaluations. Experience and
data on loading small (4 pressurized water reactor [PWR], 12 PWR, or 21 PWR assemblies) capacity
canister systems are limited. Therefore, the assumptions related to at-reactor loading in this report have a
great deal of uncertainty. To address this need, DOE released a statement of work (SOW) to quantify at-
reactor impacts and identify potential impact mitigation measures. Another data area with a great deal of
uncertainty is the repackaging of spent nuclear fuel (SNF) stored in welded canisters (e.g., dual-purpose
canisters [DPCs]). In this report, the cost/operational estimates for a repackaging facility are based on the
Nuclear Fuels Storage and Transportation Planning Project (NFST) Fiscal Year (FY)12 System
Architecture report (Ref. 2). Since that report, DOE has collected addition information on repackaging
large DPCs (Refs. 3 and 4). This information will be used in future analyses.
There are a number of strategy specific observations. These observations are based on relatively rough
cost estimates specifically related to at-reactor loading of smaller standardized canisters as well as stand-
1 In this evaluation, a standardized canister and the waste package-compatible canister are assumed to be the same physical
canister; the canister would be placed in a storage overpack to become part of the storage system or be placed in a waste
package overpack to become part of the engineered barrier system in a geologic repository.

Initial Standardized Canister System Evaluation September 2015 v
alone repackaging of non-dual-purpose canisters and do not take into account system costs and benefits
that are not readily quantifiable. One observation is that 4 PWR canisters are the most expensive and most
challenging option from an operations perspective if they are loaded at reactors using the current canister
loading approaches. Based on current assumptions, if a WP size is determined to be 4 PWR, system
analysis tools calculate that loading larger storage and transportation canisters at reactors and repackaging
the fuel into smaller containers later would be more cost effective than loading smaller canisters at
reactors. The logistical challenges associated with managing (storing, transporting, etc.) up to eight times
more canisters than the current dual-purpose canister (DPC) strategy also must be considered. This
observation is highly dependent on the assumptions for at-reactor loading operations, as well as the
repackaging assumptions.
Another observation is that, under the assumptions for this initial evaluation, relative system costs2 for the
12 PWR, 21 PWR, and current DPC strategies are fairly equivalent for any given WP size. The 12 PWR
canisters have some advantages since they may accommodate a broader range of disposal options without
additional repackaging. However, the wait-and-see approach (i.e., continuing to load DPCs until the WP
is determined) shows similar cost estimates and would avoid impacting utility operations until additional
repository details are known.
None of the standardization strategies examined significantly enhances the ability to remove SNF from
shutdown reactors. The opening of an ISF has a greater impact on the ability to remove all of the SNF
from a shutdown reactor site. However, if higher acceptance rates and/or acceptance priorities designed to
clear shutdown sites as soon as possible were assumed, there is a potential for standardized canisters to be
able to clear sites faster due to their ability to address time dependent transportation limitations (some
DPCs are not immediately transportable due to thermal and dose constraints). It may be useful to examine
scenarios with higher acceptance rates or different acceptance priorities to explore this possibility.
The last significant observation from this initial evaluation, in which all fuel is canistered before it is
shipped from the reactors, is that the addition of an ISF to the system does not change the relative impacts
of standardization. In the canister-only scenarios that were evaluated in this assessment, the benefits of an
ISF are generally separate from those of standardization. However, this initial evaluation did not address
the acceptance of bare fuel from the reactor sites, which is only an option if there is a destination (i.e., an
ISF) for the SNF.
It should again be noted that under the Standard Contract (10 CFR 961.11), DOE is obligated to accept
only bare used nuclear fuel. Acceptance of canistered used nuclear fuel would require an amendment to
the Standard Contract.
The larger standardization assessment will quantify the potential system benefits of standardization that
are not considered in this initial evaluation. In order to accurately quantify these benefits and to gain
confidence in the evaluation observations, the following questions need to be addressed.
How accurate are the at-reactor loading costs and times for small canisters and how sensitive are
the observations to these costs and times?
How accurate are the capital costs for small canisters and how sensitive are the observations to
uncertainties in the capital costs?
Are the multi-canister concepts used in this evaluation realistic? Are there other concepts that
should be evaluated?
2 The relative system rough order of magnitude (ROM) costs in this evaluation include at-reactor, interim storage, repackaging,
and transportation costs. They do not include any repository costs (with the exception of the repackaging facility) nor do
they include other system costs such as licensing, implementation, etc.
Initial Standardized Canister System Evaluation vi September 2015
What are the cost and operational impacts of repackaging standardized canisters (e.g., 12 PWR,
21 PWR) into smaller (e.g., 4 PWR) canisters?
Along with improved confidence in evaluation parameters, the following scenarios will be explored in the
next evaluation:
Bare fuel movement from reactors to an ISF
Accelerated acceptance rates and alternative acceptance priorities
Disposal assuming different repository design concepts for different geologic media
Additional scenarios related to those analyzed in this evaluation

Initial Standardized Canister System Evaluation September 2015 vii
CONTENTS
EXECUTIVE SUMMARY ......................................................................................................................... iv
FIGURES ..................................................................................................................................................... ix
TABLES ..................................................................................................................................................... xv
ACRONYMS ............................................................................................................................................ xvii
1. INTRODUCTION ................................................................................................................................. 1
1.1 Background and Motivation ........................................................................................................ 1
1.2 Strategy, Response to Outcome, and Scenario Definitions ......................................................... 3
2. STRATEGIES AND SCENARIOS ...................................................................................................... 4
2.1 Status Quo Strategies .................................................................................................................. 4
2.2 Standardized Canister Strategies ................................................................................................. 4 2.2.1 Canister system capacity and type ................................................................................. 5 2.2.2 Location and timing of canister loading operations ....................................................... 6
2.3 Assembly Access Strategies ........................................................................................................ 7
2.4 Strategy Evaluation using Scenario Analyses ............................................................................. 7
3. ASSUMPTIONS AND INPUT SELECTIONS .................................................................................... 9
3.1 Reference Scenario Assumptions and Selections ...................................................................... 10 3.1.1 All canister systems are feasible .................................................................................. 10 3.1.2 Reference spent fuel generation projections ................................................................ 10 3.1.3 Reference system spent fuel acceptance assumptions .................................................. 10 3.1.4 Reference storage and transportation assumptions ...................................................... 11 3.1.5 Reference ISF assumptions .......................................................................................... 11 3.1.6 Reference repository assumptions ................................................................................ 12
3.2 Scenario Assumption Variations ............................................................................................... 12 3.2.1 Responses to outcomes based on repository compatibility .......................................... 12 3.2.2 Schedule variations ...................................................................................................... 12 3.2.3 Other variations ............................................................................................................ 13
4. SCENARIO DESCRIPTIONS ............................................................................................................ 13
4.1 Status Quo Major Class ............................................................................................................. 14 4.1.1 Status Quo Class 1 (Reference) .................................................................................... 14 4.1.2 Status Quo Class 2 (Reference with ISF) ..................................................................... 14 4.1.3 Status Quo Class 3 ....................................................................................................... 15 4.1.4 Status Quo Class 4 ....................................................................................................... 15
4.2 Standardized Canister Major Class ........................................................................................... 16 4.2.1 Standardized Canister Class 1 ...................................................................................... 16 4.2.2 Standardized Canister Class 2 ...................................................................................... 16 4.2.3 Standardized Canister Class 3 ...................................................................................... 17 4.2.4 Standardized Canister Class 4 ...................................................................................... 17 4.2.5 Standardized Canister Class 5 ...................................................................................... 18 4.2.6 Standardized Canister Class 6 ...................................................................................... 18
Initial Standardized Canister System Evaluation viii September 2015
5. SCENARIO RESULTS ....................................................................................................................... 19
5.1 Complete System Results and Analysis .................................................................................... 31 5.1.1 Complete system logistics analysis .............................................................................. 31 5.1.2 Complete system ROM cost estimates ......................................................................... 32
5.2 At-reactor Results and Analysis ................................................................................................ 39 5.2.1 At-reactor logistics analysis ......................................................................................... 39 5.2.2 At-reactor ROM cost estimates .................................................................................... 43
5.3 ISF Results and Analysis........................................................................................................... 51 5.3.1 ISF logistics analysis .................................................................................................... 51 5.3.2 ISF ROM cost estimates ............................................................................................... 55
5.4 Repackaging Results and Analysis ........................................................................................... 58 5.4.1 Repackaging logistics analysis ..................................................................................... 58 5.4.2 Repackaging ROM cost estimates................................................................................ 63
5.5 Transportation Results and Analysis ......................................................................................... 64 5.5.1 Transportation logistics analysis .................................................................................. 64 5.5.2 Transportation ROM cost estimates ............................................................................. 69
5.6 Qualitative Scenario Discussion ................................................................................................ 72
6. PRELIMINARY OBSERVATIONS ................................................................................................... 72
7. FUTURE ACTIVITIES ....................................................................................................................... 73
8. REFERENCES .................................................................................................................................... 74
Appendix A: Total Canisters in Storage At-Reactors By Year for Various Scenarios ............................... 77
Appendix B: At-Reactor ROM Cost Breakdown........................................................................................ 84
Appendix C: Input Data Assumptions ........................................................................................................ 91

Initial Standardized Canister System Evaluation September 2015 ix
FIGURES
Figure 1. Three main system strategies and their potential responses to outcomes. ..................................... 8
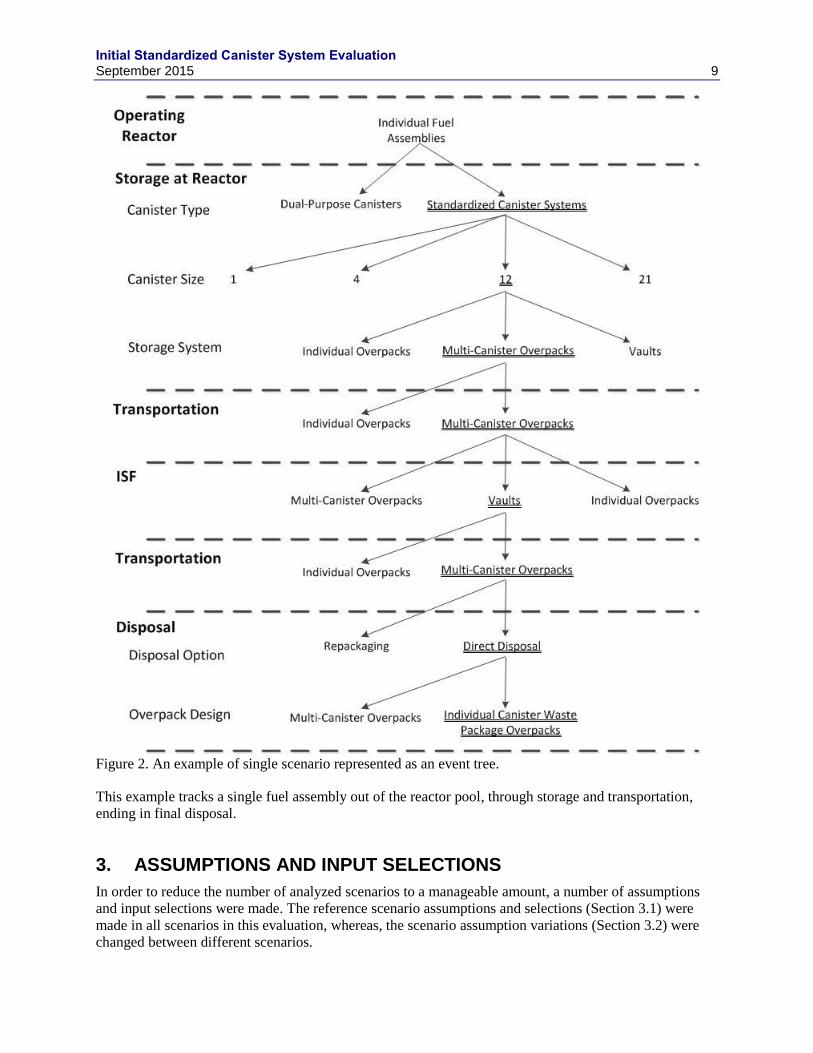
Figure 2. An example of single scenario represented as an event tree.......................................................... 9
Figure 3. Total ROM cost of different initial canister loading strategies for disposing of a 4 PWR
canister with an ISF (scenario IDs: 5, 12, 15, 19, and 23). ......................................................... 32
Figure 4. Total ROM cost of different initial canister loading strategies for disposing of a 4 PWR
canister without an ISF (scenario IDs: 1, 9, 30, 34, and 38). ...................................................... 33
Figure 5. Total ROM cost of different initial canister loading strategies for disposing of a 12
PWR canister with an ISF (scenario IDs: 6, 13, 20, and 24). ..................................................... 34
Figure 6. Total ROM cost of different initial canister loading strategies for disposing of a 12
PWR canister without an ISF (scenario IDs: 2, 10, 31, 35, and 39). .......................................... 34
Figure 7. Total ROM cost of different initial canister loading strategies for disposing of a 21
PWR canister with an ISF (scenario IDs: 7, 14, 17, 21, and 25). ............................................... 35
Figure 8. Total ROM cost of different initial canister loading strategies for disposing of a 21
PWR canister without an ISF (scenario IDs: 3, 11, 32, 36, and 40). .......................................... 36
Figure 9. Total ROM cost of different initial canister loading strategies for disposing of a 37
PWR canister with an ISF (scenario IDs: 8, 18, 22, and 26). ..................................................... 37
Figure 10. Total ROM cost of different initial canister loading strategies for disposing of a 37
PWR canister without an ISF (scenario IDs: 4, 33, 37, and 41). ................................................ 37
Figure 11. Total ROM costs for scenarios in which the WP size is assumed to be known in 2030
or 2036 (scenario IDs: 17, 45, 21, 46, 19, 47, 23, and 48). ........................................................ 38
Figure 12. Total ROM costs for scenarios in which the WP size is assumed to be known in 2036
or 2040 (scenario IDs: 17, 49, 21, 50, 19, 51, 23, and 52). ........................................................ 39
Figure 13. The maximum number of canisters loaded at any operating reactor in a given year for
scenarios with correct initial canister size (initial guess = WP size) with an ISF
(scenario IDs: 4, 30, 35, and 40). ................................................................................................ 41
Figure 14. The maximum number of canisters loaded at any operating reactor site in a given year
for scenarios with correct initial canister size (initial guess = WP size) without an ISF
(scenario IDs: 4, 30, 35, and 40). ................................................................................................ 41
Figure 15. The maximum number of canisters loaded at any operating reactor site in a given year
when disposing of a 21 PWR canister with an ISF as a function of initial canister
loading strategies (scenario IDs: 7, 14, 17, 21, and 25). ............................................................ 42
Figure 16. The maximum number of canisters loaded at any operating reactor site in a given year
when disposing of a 21 PWR canister without an ISF as a function of initial canister
loading strategies (scenario IDs: 3, 10, 31, 35, and 39). ............................................................. 42
Figure 17. Breakdown of at-reactor ROM costs into other costs and capital costs for disposing of
a 4 PWR WP using different initial canister loading strategies with an ISF (scenario
IDs: 5, 12, 15, 19, and 23). ........................................................................................................ 44
Figure 18. Breakdown of at-reactor ROM costs into other costs and capital costs for disposing of
a 4 PWR WP using different initial canister loading strategies without an ISF (scenario
IDs: 1, 9, 30, 34, and 38). ........................................................................................................... 44

Initial Standardized Canister System Evaluation x September 2015
Figure 19. Total at-reactor other ROM costs versus the total number of shutdown reactor years. ............. 45
Figure 20. Breakdown of the at-reactor other ROM costs for the status quo scenario loading 21
PWR WP-compatible canisters in 2036 with an ISF (scenario ID: 14). ..................................... 46
Figure 21. Breakdown of the at-reactor other ROM costs for the status quo scenario loading 21
PWR WP-compatible canisters in 2036 without an ISF (scenario ID: 11). ................................ 46
Figure 22. Breakdown of the at-reactor other ROM costs for the 4 PWR standardized canister
loading strategy beginning in 2025 when the WP size is also 4 PWR with an ISF
(scenario ID: 15). ........................................................................................................................ 47
Figure 23. Breakdown of the at-reactor other ROM costs for the 4 PWR standardized canister
loading strategy beginning in 2025 when the WP size is also 4 PWR without an ISF
(scenario ID: 30). ........................................................................................................................ 47
Figure 24. Breakdown of at-reactor other ROM costs and capital ROM costs for the status quo
scenario that begins loading WP-compatible 21 PWR canisters in 2036 with an ISF
(scenario ID: 14). ........................................................................................................................ 48
Figure 25. Breakdown of at-reactor other ROM costs and capital ROM costs for the status quo
scenario that begins loading WP-compatible 21 PWR canisters in 2036 without an ISF
(scenario ID: 11). ........................................................................................................................ 49
Figure 26. Breakdown of at-reactor other ROM costs and capital ROM costs for the 4 PWR
standardized canister loading strategy beginning in 2025 when the WP size is also 4
PWR with an ISF (scenario ID: 15). ........................................................................................... 50
Figure 27. Breakdown of at-reactor other ROM costs and capital ROM costs for the 4 PWR
standardized canister loading strategy beginning in 2025 when the WP size is also 4
PWR without an ISF (scenario ID: 30). ...................................................................................... 50
Figure 28. ISF receipt bays as a function of disposal WP size in the status quo scenario and in the
status quo scenario when a WP is loaded in 2036 (scenario IDs: 5, 6, 7, 8, 12, 13, and
14). .............................................................................................................................................. 51
Figure 29. The maximum number of casks in storage at the ISF using different initial canister
loading strategies when the final WP size is determined to be a 4 PWR (scenario IDs:
5, 12, 15, 19, and 23). ................................................................................................................ 52
Figure 30. The maximum number of casks in storage at the ISF using different initial canister
loading strategies when the final WP size is determined to be a 12 PWR (scenario IDs:
6, 13, 16, 20, and 24). ................................................................................................................. 53
Figure 31. The maximum number of casks in storage at the ISF using different initial canister
loading strategies when the final WP size is determined to be a 21 PWR (scenario IDs:
7, 14, 17, 21, and 25). ................................................................................................................. 53
Figure 32. The maximum number of casks in storage at the ISF using different initial canister
loading strategies when the final WP size is determined to be a 37 PWR (scenario IDs:
8, 18, 22, and 26). ....................................................................................................................... 54
Figure 33. The maximum number of casks in storage at the ISF as a function of initial canister
selection strategy when the WP size is determined to be 4 PWR (orange), 12 PWR
(blue), 21 PWR (green), 37 PWR (red) (scenario IDs: 5, 6, 7, 8, 12, 13, 14, 15, 16, 17,
18, 19, 20, 21, 22, 23, 24, 25, and 26). ....................................................................................... 54
Figure 34. The total ROM cost of the ISF using different initial canister loading strategies when
the final WP size is determined to be a 4 PWR (scenario IDs: 5, 12, 15, 19, and 23)................ 55

Initial Standardized Canister System Evaluation September 2015 xi
Figure 35. The total ROM cost of the ISF using different initial canister loading strategies when
the final WP size is determined to be a 12 PWR (scenario IDs: 6, 13, 16, 20, and 24). ............. 56
Figure 36. The total ROM cost of the ISF using different initial canister loading strategies when
the final WP size is determined to be a 21 PWR (scenario IDs: 7, 14, 17, 21, and 25). ............. 56
Figure 37. The total ROM cost of the ISF using different initial canister loading strategies when
the final WP size is determined to be a 37 PWR (scenario IDs: 8, 18, 22, and 26).................... 57
Figure 38. The total ROM cost of the ISF as a function of initial canister selection strategy when
the WP size is determined to be 4 PWR (orange), 12 PWR (blue), 21 PWR (green), 37
PWR (red) (scenario IDs: 5, 6, 7, 8, 12, 13, 14, 15, 16, 17, 18, 19, 20, 21, 22, 23, 24,
25, and 26). ................................................................................................................................. 57
Figure 39. The ISF ROM cost as a function of maximum casks in storage at an ISF, where each
symbol represents a final WP size (e.g., 4 PWR WP, 12 PWR WP) (scenario IDs: 5, 6,
7, 8, 12, 13, 14, 15, 16, 17, 18, 19, 20, 21, 22, 23, 24, 25, and 26). ........................................... 58
Figure 40. Cubic meters of LLW using different initial canister loading strategies when the WP
size is determined to be a 4 PWR (scenario IDs: 5, 12, 15, 19, and 23). .................................... 59
Figure 41. Number of canisters to waste using different initial canister loading strategies when the
WP size is determined to be a 4 PWR (scenario IDs: 5, 12, 15, 19, and 23). ............................. 59
Figure 42. Cubic meters of LLW using different initial canister loading strategies when the WP
size is determined to be a 12 PWR (scenario IDs: 6, 13, 16, 20, and 24). .................................. 60
Figure 43. Number of canisters to waste using different initial canister loading strategies when the
WP size is determined to be a 12 PWR (scenario IDs: 6, 13, 16, 20, and 24). ........................... 60
Figure 44. Cubic meters of LLW using different initial canister loading strategies when the WP
size is determined to be a 21 PWR (scenario IDs: 7, 14, 17, 21, and 25). .................................. 61
Figure 45. Number of canisters to waste using different initial canister loading strategies when the
WP size is determined to be a 21 PWR (scenario IDs: 7, 14, 17, 21, and 25). ........................... 61
Figure 46. Cubic meters of LLW using different initial canister loading strategies with different
the WP sizes (scenario IDs: 5, 6, 7, 12, 13, 14, 15, 16, 17, 19, 20, 21, 23, 24, and 25). ............ 62
Figure 47. Number of canisters to waste using different initial canister loading strategies with
different the WP sizes (scenario IDs: 5, 6, 7, 12, 13, 14, 15, 16, 17, 19, 20, 21, 23, 24,
and 25). ....................................................................................................................................... 62
Figure 48. Repackaging ROM costs as a function of initial canister selection strategy when the
WP size is determined to be 4 PWR (orange), 12 PWR (blue), 21 PWR (green)
(scenario IDs: 5, 6, 7, 12, 13, 14, 15, 16, 17, 19, 20, 21, 23, 24, and 25). .................................. 64
Figure 49. Cask miles for scenarios with correct initial canister size (initial guess = WP size) with
an ISF (scenario IDs: 8, 15, 20, and 25). .................................................................................... 65
Figure 50. Cask miles for scenarios with correct initial canister size (initial guess = WP size)
without an ISF (scenario IDs: 4, 30, 35, and 40). ....................................................................... 65
Figure 51. Cask miles when disposing of a 12 PWR WP using different initial canister loading
strategies with an ISF (scenario IDs: 6, 12, 16, 20, and and 24). ............................................... 66
Figure 52. Cask miles when disposing of a 12 PWR WP using different initial canister loading
strategies without an ISF (scenario IDs: 2, 10, 31, 35, and 39). ................................................. 66
Initial Standardized Canister System Evaluation xii September 2015
Figure 53. Consist miles for scenarios with correct initial canister size (initial guess = WP size)
with ISF (scenario IDs: 8, 15, 20, and 25). ................................................................................. 67
Figure 54. Consist miles for scenarios with correct initial canister size (initial guess = WP size)
without ISF (scenario IDs: 4, 30, 35, and 40). ............................................................................ 67
Figure 55. Consist miles when disposing of a 12 PWR WP using different initial canister loading
strategies with an ISF (scenario IDs: 6, 12, 16, 20, and 24). ...................................................... 68
Figure 56. Consist miles when disposing of a 12 PWR WP using different initial canister loading
strategies without an ISF (scenario IDs: 2, 10, 31, 35, and 39). ................................................. 68
Figure 57. Comparing transportation ROM cost for scenarios with correct initial canister size
(initial guess = WP size) with an ISF (scenario IDs: 8, 15, 20, and 25). .................................... 69
Figure 58. Comparing transportation ROM cost for scenarios with correct initial canister size
(initial guess = WP size) without an ISF (scenario IDs: 4, 30, 35, and 40). ............................... 70
Figure 59. Transportation ROM costs when disposing of a 12 PWR WP using different initial
canister loading strategies with an ISF (scenario IDs: 6, 12, 16, 20, and 24). ............................ 70
Figure 60. Transportation ROM costs when disposing of a 12 PWR WP using different initial
canister loading strategies without an ISF (scenario IDs: 2, 10, 31, 35, and 39). ....................... 71
Figure 61. Operational Transportation ROM costs as a function of cask miles for all scenarios. .............. 71
Figure A-1. Total canisters in storage at reactors for a scenario when 21-sized WPs begin being
loaded at reactors in 2036 and where no ISF is incorporated into the system in 2025
(scenario ID: 11). ........................................................................................................................ 77
Figure A-2. Total canisters in storage at reactors for a scenario when 21-sized WPs begin being
loaded at reactors in 2036 and where an ISF is incorporated into the system (scenario
ID: 14)......................................................................................................................................... 77
Figure A-3. Total canisters in storage at reactors for a scenario when 21 PWR standardized
canisters begin being loaded at reactors in 2025 and a 4 PWR WP is selected in 2036
and where an ISF is incorporated into the system in 2025 (scenario ID: 23). ............................ 78
Figure A-4. Total canisters in storage at reactors for a scenario when 21 PWR standardized
canisters begin being loaded at reactors in 2025 and a 12 PWR WP is selected in 2036
and where an ISF is incorporated into the system in 2025 (scenario ID: 24). ............................ 78
Figure A-5. Total canisters in storage at reactors for a scenario when 21 PWR standardized
canisters begin being loaded at reactors in 2025 and a 21 PWR WP is confirmed in
2036 and where an ISF is incorporated into the system in 2025 (scenario ID: 25). ................... 79
Figure A-6. Total canisters in storage at reactors for a scenario when 21 PWR standardized
canisters begin being loaded at reactors in 2025 and a 37 PWR WP is selected in 2036
and where an ISF is incorporated into the system in 2025 (scenario ID: 26). ............................ 79
Figure A-7. Total canisters in storage at reactors for a scenario when 4 PWR standardized
canisters begin being loaded at reactors in 2025 and a 21 PWR WP is selected in 2036
and where an ISF is incorporated into the system in 2025 (scenario ID: 17). ............................ 80
Figure A-8. Total canisters in storage at reactors for a scenario when 12 PWR standardized
canisters begin being loaded at reactors in 2025 and a 21 PWR WP is selected in 2036
and where an ISF is incorporated into the system in 2025 (scenario ID: 21). ............................ 80

Initial Standardized Canister System Evaluation September 2015 xiii
Figure B-1. At-reactor ROM cost for different starting canisters disposing in 21 WP with an ISF
(scenario IDs: 7, 14, 17, 21, and25). ........................................................................................... 84
Figure B-2. At-reactor ROM cost for different starting canisters disposing in 21 WP without an
ISF (scenario IDs: 3, 11, 32, 36, and 40). ................................................................................... 84
Figure B-3. At-reactor ROM cost for different starting canisters disposing in 12 WP with an ISF
(scenario IDs: 6, 13, 16, 20, and 24). .......................................................................................... 85
Figure B-4. At-reactor ROM cost for different starting canisters disposing in 12 WP without an
ISF (scenario IDs: 2, 10, 31, 35, and 39). ................................................................................... 85
Initial Standardized Canister System Evaluation xiv September 2015
THIS PAGE IS INTENTIONALLY LEFT BLANK
Initial Standardized Canister System Evaluation September 2015 xv
TABLES
Table 1. Overpack capacity as a function of canister size. ......................................................................... 11
Table 2. The ROM cost estimates for each scenario. .................................................................................. 20
Table 3. The logistics metrics for each scenario. ........................................................................................ 24
Table 4. A description of each column in Table 2 and Table 3. ................................................................. 27
Table 5. Reference table for each scenario and its assumptions. ................................................................ 29
Table 6. Number of canisters loaded at reactors for scenarios with an ISF in which the initial
canister size was compatible with the repository........................................................................ 40
Table 7. Minimum and maximum number of shutdown reactor years as a function of ISF start
date. ............................................................................................................................................ 43
Table 8. Number of opening bays at the repackaging facility as a function of initial canister
loading strategy ........................................................................................................................... 63
Table 9. Number of closing bays as a function of WP size ........................................................................ 63
Table A-1. Maximum number of canisters in storage at reactors for each scenario. .................................. 81
Table B-1. Detailed at-reactor costs ($B) for each scenario. ...................................................................... 86
Table C-1. General reference data used in this evaluation. ......................................................................... 91
Table C-2. Evaluation-specific data used in this evaluation. ...................................................................... 93
Initial Standardized Canister System Evaluation xvi September 2015
THIS PAGE IS INTENTIONALLY LEFT BLANK
Initial Standardized Canister System Evaluation September 2015 xvii
ACRONYMS
BWR boiling water reactor
DOE US Department of Energy
DPC dual-purpose canister
FCRD Fuel Cycle Research and Development
FY fiscal year
ISF interim storage facility
ISFSI independent spent fuel storage installation
LLW low-level radioactive waste
MDO management and disposal organization
MTHM metric tons of heavy metal
MRS monitored retrievable storage
NFST Nuclear Fuels Storage and Transportation Planning Project
OFF oldest fuel first
PWR pressurized water reactor
ROM rough order of magnitude
SNF spent nuclear fuel
TAD Transportation, Aging, and Disposal
TSL-CALVIN Transportation Storage Logistics- CRWMS (Civilian Radioactive Waste Management
System) Analysis and Logistics Visually Interactive
WP waste package
YFF youngest fuel first

Initial Standardized Canister System Evaluation xviii September 2015
THIS PAGE IS INTENTIONALLY LEFT BLANK
Initial Standardized Canister System Evaluation September 2015 1
INITIAL STANDARDIZED CANISTER SYSTEM EVALUATION
1. INTRODUCTION
This report details the fiscal year (FY) 2014 initial standardized canister system evaluation. It fulfills the
Level 2 Milestone M2FT-14OR0904022 in the Standardization Assessment work package,
FT-14OR090402. This paper reflects research and development efforts to explore technical concepts
which could support future decision making by DOE. No inferences should be drawn from this paper
regarding future actions by DOE.
The Nuclear Fuels Storage and Transportation Planning Project (NFST) of the US Department of Energy
(DOE) Office of Nuclear Energy (NE) has initiated a quantitative assessment of waste management
system strategies. The assessment will analyze the current utility status quo approach (large dual-purpose
canisters [DPCs] optimized for each utility’s near-term storage needs), along with alternatives such as
adopting standardized spent nuclear fuel (SNF) canister systems. It should again be noted that under the
Standard Contract (10 CFR 961.11), DOE is obligated to accept only bare used nuclear fuel. Acceptance
of canistered used nuclear fuel would require an amendment to the Standard Contract. This assessment
does not take into account the contractual limitations under the Standard Contract that DOE has in place
with nuclear utilities (10 CFR Part 961). Under the Standard Contract, DOE is obligated to accept only
bare UNF. Acceptance of canistered UNF would require a mutual agreement to modify the contract.
The assessment will analyze how different standardized canister strategies would work with future
contingencies. Each strategy/response pairing or scenario will be quantitatively evaluated using defined
metrics. At its conclusion, this assessment will provide information on the implications of introducing
standardized canister systems into the waste management system.
This report presents the initial evaluation of several scenarios. The results from this initial report will
inform decisions on the scope of future evaluations. It provides a better understanding of which scenarios
should be explored in more detail and indicates areas where additional information is needed.
This standardized canister system assessment is focused on providing research and development to
address the fundamental question: “Is this worth doing?”
If the standardized canister assessments answer the “Is this worth doing?” question in the affirmative,
then the next question will be “How could these strategies be implemented?” To clarify, this assessment
is focused on the question of the value of standardized canister systems. Implementation of standardized
canister systems is an issue only described in this assessment as assumptions related to specific scenarios
(e.g., standardized canisters will be loaded at operating reactors. The question “How will these scenarios
be implemented?” is beyond the scope of this assessment.
1.1 Background and Motivation
Currently, nuclear utilities make site-specific determinations on how to manage their SNF. For dry
storage, most utilities are using high-capacity canisters (those able to hold 32 pressurized water reactor
[PWR] assemblies or 68 boiling water reactor [BWR] assemblies) and some are beginning to use the
latest “ultra-high-capacity” canisters (those able to hold 37 PWR or 87/89 BWR assemblies). Key factors
in utility decision-making relative to cask design selection include worker dose, operational impacts of
fuel loading, and cost.
Most utilities are using DPC systems that could also be used to transport SNF off-site, though the high-
capacity DPCs may have to remain in on-site storage for many years before these loaded canisters are

Initial Standardized Canister System Evaluation 2 September 2015
below the thermal and dose limits required for transportation. In addition to transportability requirements,
any loaded canisters that will be disposed of will need to meet repository constraints. An example is
emplacement thermal limits, which may require significant aging times, perhaps fifty years or more after
reactor discharge (Ref. 5) to ensure the thermal loads are compatible with repository design concepts.
DOE is actively evaluating the feasibility of direct DPC disposal.
Repackaging DPCs, if required for a particular geologic disposal concept, would result in a significant
increase in overall system fuel handling operations and associated costs as well as additional worker dose
compared with direct DPC disposal. Unloaded DPCs that are no longer being used as part of the system
would have to be properly managed and may have to be disposed (most likely as low-level radioactive
waste [LLW]), resulting in additional system cost that could be avoided if the SNF could initially be
loaded into a disposable canister. However, it should also be recognized that use of smaller, disposable
canisters may introduce certain additional system costs, e.g. those associated with an increased number of
canisters and handling operations. Hence, a systematic assessment of the potential benefits and drawbacks
of various approaches is important to inform any future decisions.
The idea of a canister system capable of storage, transportation, and disposal without repackaging has
been developed and discussed for many years. The past work considered the Transportation, Aging, and
Disposal (TAD) canister system and the Multi-Purpose Canister system developed to be compatible with
a repository in volcanic tuff (Refs. 6 and 7). The potential benefits of this type of system include the
following:
Reduced overall system cost3
Increased flexibility and/or reduced sensitivity to future decisions and changes to waste
management requirements
Simplified handling and licensing at an interim storage, repackaging, or reprocessing facility
and/or repository (Ref. 8)
Simplified transportation hardware and operations
Simplified interim storage facility (ISF)4 design and operations
Reduced uncertainties associated with waste acceptance and system performance
Minimized amount of repackaging
Reduced handling of individual SNF assemblies, leading to reduced probability of assembly
mishandling or drops, as well as reduced concerns related to fuel condition following extended
storage and transportation
Though there are potential benefits, there are two outstanding issues in regards to standardization.
1. Because a repository has not been selected, there are no site-specific disposal requirements5 for the
waste package (WP).
3 The NWPA Section 111(b)(4) established the Nuclear Waste Fund, composed of payments made by the generators and owners
of high-level radioactive waste and spent nuclear fuel, that will ensure that the costs of carrying out activities relating to the
disposal of such waste and spent fuel will be borne by the persons responsible for generating such waste and spent fuel.
Thus the potential for reducing overall system costs may provide an incentive to adopting changes to the current status quo. 4 The terms “Interim Storage Facility” (ISF) and “Consolidated Interim Storage Facility” (CISF) are used interchangeably in this
report. Both refer to an away-from-reactor storage facility. 5 The term “requirement” is used only in the context of this evaluation and is not intended to establish formal design or regulatory
requirements.

Initial Standardized Canister System Evaluation September 2015 3
2. Any change in canister design has the potential to impact utility operations if these new canisters are
loaded at operating reactor sites.
The motivation behind this assessment is to better understand and quantify the impacts of incorporating
SNF canister standardization into the waste management system to provide a basis for future policy
decisions. The major attributes that will be quantified are system-wide cost benefits and operational
impacts such as timeframes and doses. While it is true that there are no repository-specific disposal
requirements, it is not clear that the status quo of continuing to load large DPCs is the most effective
strategy for the entire nuclear waste management system. This assessment will quantify the impacts of
continuing with the status quo versus adopting standardized canister systems at some point in the nuclear
waste management system. It will analyze the impacts of choosing to load larger canisters and then
having to repackage into smaller canisters as well as the opposite scenario where small canisters are
initially loaded but at some point it is determined that larger canisters can be used for disposal.
Besides the lack of site-specific disposability requirements, the other major issue is the potential
operational and financial impact of loading smaller capacity canisters at power plant sites. The nuclear
utilities have a finite time interval to perform dry storage loading campaigns between refueling outages,
and loading lower-capacity canisters is expected to negatively impact the amount of SNF that could be
loaded in a given interval. As part of this standardization assessment, the time available for canister
loading at reactor sites, the durations of loading operations, and the potential durations of loading lower-
capacity canisters will all be researched. NFST realizes that this issue is of significant interest to the
utilities and, as such, plans to engage industry to look at advanced and innovative techniques in regards to
loading, drying, welding, etc.
Successful conclusion of this assessment will lay the groundwork for providing a basis for potential future
policy decisions in regards to standardization and integration in the waste management system. This
assessment will likely be composed of multiple evaluations, the first of which is presented in this report.
Each evaluation will inform future evaluations and identify areas where more information is needed.
1.2 Strategy, Response to Outcome, and Scenario Definitions
The focus of this assessment is an evaluation of waste management system strategies that include both the
current utility status quo approach (large DPCs optimized for each utility’s near-term storage needs) and
alternatives that include adopting some form of standardized SNF canister which may improve overall
system operation.6 A primary analytic objective will be to determine the response of each standardized
canister strategy to future contingencies that differ significantly from the planning basis underlying the
strategy.
An important objective of the use of standardized SNF canisters is to avoid the possible need to cut open
and dispose of a large number of welded canisters (i.e., DPCs) that might turn out to be incompatible7
with the characteristics of the repository site that is selected. Therefore, this potential incompatibility is
the primary focus of this initial evaluation. This assessment does not try to answer the question of why
certain contingencies may occur; instead, it focuses on the impacts on the system as a whole if those
contingencies do occur and on identifying significant differences among strategies with respect to those
impacts. This fiscal year 2014 (FY14) work specifically looks at the reactor, ISF, repackaging facility,
and transportation impacts. The repository impacts will be assessed in future work. For purposes of this
6 Potential standardization of overpacks for transportation or storage of SNF canisters is not the focus of this evaluation. Vendors
are already working on this possibility for their own canisters, and if a standardized canister system of some sort proves to
be desirable, then the appropriate overpacks would be designed as part of the system. 7 “Incompatible” is defined to include non-technical concerns such as a possible requirement that for disposal in a particular
geologic medium, large DPCs or standardized canister systems would have to be stored for a longer period than is deemed
acceptable.
Initial Standardized Canister System Evaluation 4 September 2015
initial FY14 evaluation, the impacts considered will be those that might result from incompatibilities
related to the capacity and size of the canisters.
2. STRATEGIES AND SCENARIOS
In this evaluation and the larger standardization assessment, the following terms have specific meanings.
A “strategy” is a relatively near-term (within the next 10–15 years) policy decision to either implement or
not implement a specific plan for standardized canister systems (e.g., begin loading smaller standardized
canister systems at reactor sites). A “response to outcome” is a course of action to be taken after a
particular outcome becomes known, such as the definition of disposal requirements following a
determination of the geologic medium. A “scenario” consists of both the strategy and response to
outcome and includes assumptions on how both of these would be implemented. Strategies are different
initial conditions for the system (system start), whereas scenarios encompass the entire time period of the
system, including initial/boundary conditions (system start to finish) for an assumed outcome and
response to that outcome.
This assessment considers three strategies: (1) a status quo strategy that continues use of DPC systems
with no actions taken to increase the likelihood that DPCs can be used for storage, transportation, and
disposal; (2) a standardized canister strategy initially focused on canister capacity options to facilitate
future disposal; and (3) an assembly access strategy to keep fuel assemblies more accessible for later
loading into waste-package-compatible canisters once the disposal requirements are determined. In this
evaluation, the status quo strategy (1) and the standardized canister strategy (2) are analyzed.
Each of these strategies and their associated options are described in the following sub-sections. Not all
combinations and permutations of the options are evaluated in this report. An initial set of strategies has
been selected to determine the types and bounds of impacts that can be expected. These have been marked
with an asterisk. Additional strategies will be defined and evaluated as needed based on this initial
evaluation.
One assumption that is underlying this evaluation (and the larger standardization assessment) in regards to
disposal of canisters is that smaller canisters are compatible for disposal with more geologies than larger
canisters. This assumption is discussed in References 5 and 9.
2.1 Status Quo Strategies
The current utility-planning status quo strategy will be used as a basis for comparison with
standardization alternatives. This strategy is characterized by the following:
Continued trend toward higher burnups, larger/higher heat-load DPCs, and higher capacity
canisters
No federal action to promote standardization of any kind
The status quo strategy involves continuation of trends in the use of DPCs for at-reactor storage.
2.2 Standardized Canister Strategies
Standardized canister strategies are defined by selecting from the following options: (1) a choice of a
standardized canister system, (2) a choice of location for standardized canister loading, and (3) a choice of
Strategies marked with an asterisk are the initial focus of this evaluation.

Initial Standardized Canister System Evaluation September 2015 5
when the standardized canister is loaded. This evaluation will focus on strategies involving early adoption
of a single standardized canister system at reactor sites.
There are many options for the type of canister system, the location to load the canister system, and the
timing to begin those loading operations. The major options are listed in this section and those marked
with an asterisk are the focus of this initial evaluation. The selected strategies give a range of options for
standardized canister systems and will help determine appropriate, additional strategies as the larger
standardization assessment moves forward.
2.2.1 Canister system capacity and type
The options for the standardized canister strategies consist of differently sized welded and/or bolted
canister systems with different capacities. The capacities selected for this evaluation are based on past
studies (Refs. 10 and 11), though additional capacities are possible. For further clarification, each strategy
will consist of only a single standardized canister design (e.g., 4 PWR/9 BWR, 12 PWR/32 BWR).
However, once a repository is known, the strategy will transition to a repository-compatible design (see
additional details in Section 2.4). Canister sizes that may be considered include:
1 PWR/2 BWR canister
Loaded, stored, and transported individually
Loaded in a multi-canister cask for storage and transportation8
4 PWR/9 BWR canister
Loaded, stored, and transported individually
Loaded in a multi-canister cask for storage and transportation*
12 PWR/32 BWR canister
Loaded, stored, and transported individually
Loaded in a multi-canister cask for storage (not transportation)*
21 PWR/44 BWR canister*
32 PWR/68 BWR canister
37 PWR/89 BWR canister*
Some options related to the largest capacity above, which may be explored in later studies, involve
standardizing DPC systems (the canister and/or overpack) with an objective of improving operational
efficiencies and/or feasibility related to loading, storage, and/or transportation, as well as potential direct
disposal possibilities. Some potential options are identified below.
Addition of standardized post-closure criticality control features to enhance the likelihood that the
DPCs will remain sub-critical
Specification of loading configurations for DPCs that will mitigate potential thermal
incompatibility with transportation requirements or future repository design concepts
Transition to a bolted-lid, smaller capacity, standard DPC. This could stop the growth of an
inventory of large, welded DPCs that might have to be cut open and disposed of so that the
contained SNF can be repackaged into disposal-compatible containers
8 A multi-canister cask concept allows multiple canisters to be loaded into a single cask to simplify cask operations, storage, and
transportation. The individual canisters would be readily accessible for future canister movements.
Initial Standardized Canister System Evaluation 6 September 2015
2.2.2 Location and timing of canister loading operations
There are three potential options for the location to load canisters and each location has options for the
timing to begin loading operations.
At reactors9
Starting as soon as possible*
After shutdown
After disposal package characteristics are known
At an ISF
When acceptance starts
After disposal package characteristics are known
At the repository.
To simplify the comparison of strategies, it is assumed that purpose-built WPs loaded at the repository
will use a standardized inner canister with a disposal overpack, even though the storage and transportation
capabilities of the standardized canister system may not be used10
.
9 It should be noted that in this evaluation all canisters, regardless of size, are assumed to be loaded using current utility
procedures (i.e., no parallel operations or optimizations are assumed for smaller canister loading operations). 10 In this evaluation, a standardized canister and the waste package-compatible canister are assumed to be the same physical
canister; the canister would be placed in a storage overpack to become part of the storage system or be placed in a waste
package overpack to become part of the engineered barrier system in a geologic repository
Initial Standardized Canister System Evaluation September 2015 7
2.3 Assembly Access Strategies
Assembly access strategies are defined as shifting to bare fuel11
storage and transportation. This strategy
could involve bolted, bare fuel transportation casks to move the assemblies from the reactor pools to an
ISF, or it could involve individual assembly vault storage at reactor sites.
There are numerous options for this strategy, including the following:
Size and capacity of casks
Assembly storage system at reactors or an ISF
Pool
Vault
Bolted canister
Timing of loading and implementation
Load bolted casks/vaults as soon as casks/vaults are available
Load bolted casks once storage facility is operational
Load bolted casks/vaults after reactor shutdown
This strategy is outside the scope of this initial evaluation and will be examined in future work. Many of
these options are being considered as part of other NFST systems analysis work activities and those
results will help guide the most appropriate strategies and scenarios related to bare fuel options.
2.4 Strategy Evaluation using Scenario Analyses
Most strategies12
include the assumption that once the characteristics of a repository site are known, the
corresponding WP requirements are defined, and the compatible standardized canister systems are
available, SNF being unloaded from reactor spent fuel pools will be placed into repository-compatible
standardized canister systems, as illustrated in Figure 1. It is also assumed that the legacy canistered SNF
will be repackaged into such standardized canister systems at the repository if needed. To clarify, only the
direct disposal of all existing DPCs results in no repackaging. Even if standardized canister systems were
implemented today and are compatible with eventual disposal, the existing DPCs (~3,500 by 2025 (Ref.
2)) would need to be repackaged if they could not be directly disposed.
11 Bare fuel references non-canistered assemblies that can be loaded into a transportation cask with the intent of removing those
assemblies in the near future (generally no welding or cutting would be required). 12 The eight strategy/response to outcome scenarios that do not migrate to WP-compatible canisters once the repository becomes
known are the reference scenarios (see Section 5.1.1 and Section 4.1.2).

Initial Standardized Canister System Evaluation 8 September 2015
Figure 1. Three main system strategies and their potential responses to outcomes.
In Figure 1, the arrows in orange (Status Quo) and blue (Standardized Canister) are the focus of this
initial FY14 evaluation. This figure does not show all options of a given scenario, but it does illustrate the
high-level, near-term strategies evaluated in this initial evaluation. The red arrows show only shifts in
policy (e.g., moving from loading DPCs to loading standardized canister systems) not actual repackaging
operations of single assemblies. The need to repackage is indicated by the yellow star.
The selected strategy options will be analyzed using a set of scenarios that describe alternative possible
evolutions of the waste management system (Section 3.2). However, all scenarios are based on the
reference set of assumptions described below (Section 3.1). Sensitivity cases to test the impacts of
variations in these assumptions will be evaluated as needed.
These scenarios include a large number of branching decision points, as illustrated in Figure 2. Note that
timing of each branching selection varies (i.e. the ISF could begin accepting SNF in 2025, 2030, or any
other time). This leads to an almost unlimited number of potential scenarios.
Initial Standardized Canister System Evaluation September 2015 9
Figure 2. An example of single scenario represented as an event tree.
This example tracks a single fuel assembly out of the reactor pool, through storage and transportation,
ending in final disposal.
3. ASSUMPTIONS AND INPUT SELECTIONS
In order to reduce the number of analyzed scenarios to a manageable amount, a number of assumptions
and input selections were made. The reference scenario assumptions and selections (Section 3.1) were
made in all scenarios in this evaluation, whereas, the scenario assumption variations (Section 3.2) were
changed between different scenarios.

Initial Standardized Canister System Evaluation 10 September 2015
A detailed list of input data selections is available in Appendix C.
3.1 Reference Scenario Assumptions and Selections
As mentioned above, there are a number of assumptions selections that were held constant for all
strategies and comparison scenarios. These may be reevaluated in the future with the help of sensitivity
studies to quantify their system impacts.
3.1.1 All canister systems are feasible
This assumes that regardless of the number, size, or capacity of a canister system, the cask manufacturers
and vendors are able to produce the needed canisters. As part of this assumption, it is assumed that
material is available and that vendors have the capability to increase production to meet demand.
3.1.2 Reference spent fuel generation projections
The reference NFST SNF fuel projections are selected for all strategies and scenarios (Ref. 12). The
reference inventory projection assumes that no new reactors are constructed and operated. The inventory
used for all scenarios in this evaluation includes the SNF discharged from the 18 shutdown reactors13
and
the 100 currently operating reactors. Ninety-eight of the 100 currently operating reactors are assumed to
have one 20 year life extension and will be decommissioned after 60 years of operations. The remaining
reactors (Vermont Yankee and Oyster Creek) have utility-announced early shutdown dates of 2014 and
2019, respectively. This reference projection can be revised as needed in future analyses to take into
account additional early shutdowns and new builds.
3.1.3 Reference system spent fuel acceptance assumptions
A system acceptance rate of 3,000 metric tons of heavy metal (MTHM) and a youngest fuel first (YFF)
acceptance/ oldest fuel first (OFF) allocation are selected for all strategies and scenarios. All SNF is
accepted in canisters (DPCs or standardized canisters). The nine existing shutdown reactor sites are de-
inventoried first over a ramp-up of five years.14
After that time, the SNF is allocated with an OFF
procedure and accepted with a YFF procedure. Allocation priority determines which reactor sites ship and
how much is shipped from each site in a given year. Acceptance refers to what SNF is actually shipped by
the utility and accepted by the waste management system in any year. Allocation priority is controlled by
the Standard Contract. An OFF allocation is used to determine the amount of SNF (MTHM) that will be
accepted when SNF is transported away from reactor sites. A YFF, minimum 5-year out-of-reactor (YFF-
5) fuel prioritization is used to determine the number of fuel assemblies transported within the allocated
MTHM amount for each reactor site. It is assumed that reactor operators would prefer to transfer younger
SNF from the spent fuel pools first and leave the generally older SNF in dry storage. This would increase
the available capacity in the spent fuel pools and reduce or eliminate the need to transfer additional SNF
to dry storage. This assumption is consistent with the reference system spent fuel acceptance assumption
used in previous systems studies (Ref. 2). As concluded in Reference 2, acceptance priority assumptions
can have a significant influence on the transportation system and the sizing of facilities. The NFST is
evaluating the implications of other acceptance strategies outside of this standardization assessment, and
those results may be evaluated with respect to standardization in future evaluations.
13 SNF at Fort St. Vrain and INL is not included because the sites are owned and operated by DOE. 14 The nine existing shutdown sites are Big Rock Point, Haddam Neck, Humboldt Bay, LaCrosse, Maine Yankee, Rancho Seco,
Trojan, Yankee Rowe, and Zion.
Initial Standardized Canister System Evaluation September 2015 11
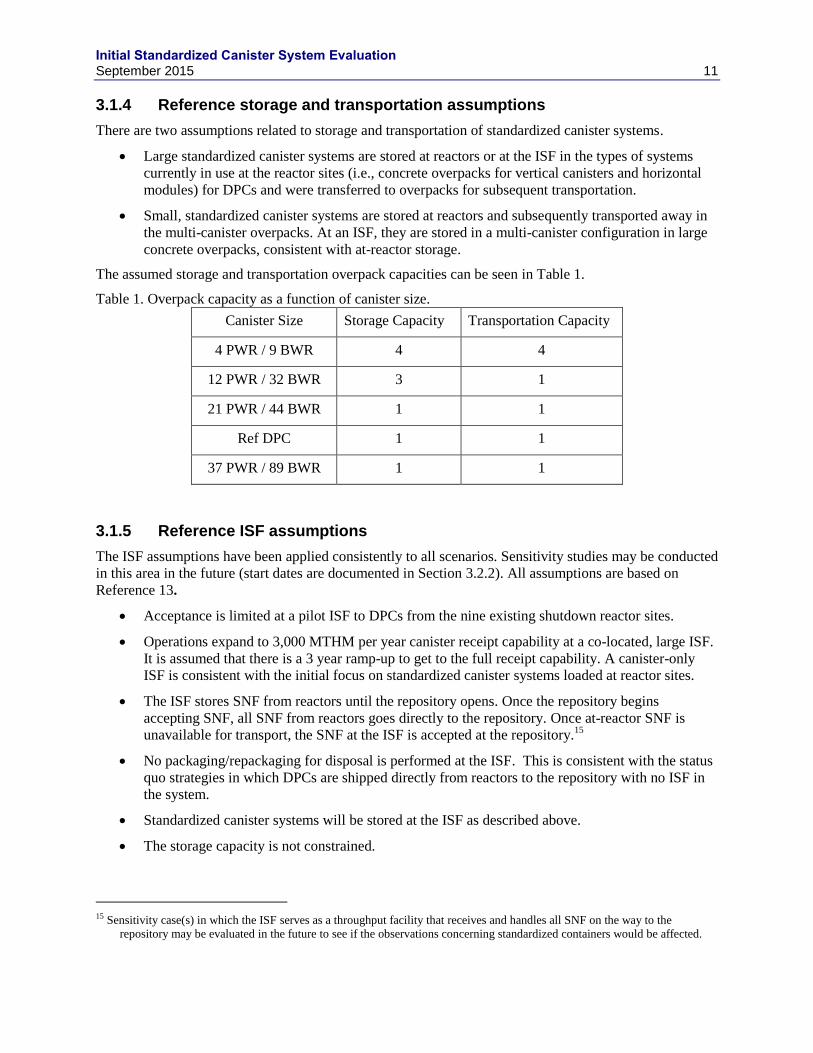
3.1.4 Reference storage and transportation assumptions
There are two assumptions related to storage and transportation of standardized canister systems.
Large standardized canister systems are stored at reactors or at the ISF in the types of systems
currently in use at the reactor sites (i.e., concrete overpacks for vertical canisters and horizontal
modules) for DPCs and were transferred to overpacks for subsequent transportation.
Small, standardized canister systems are stored at reactors and subsequently transported away in
the multi-canister overpacks. At an ISF, they are stored in a multi-canister configuration in large
concrete overpacks, consistent with at-reactor storage.
The assumed storage and transportation overpack capacities can be seen in Table 1.
Table 1. Overpack capacity as a function of canister size.
Canister Size Storage Capacity Transportation Capacity
4 PWR / 9 BWR 4 4
12 PWR / 32 BWR 3 1
21 PWR / 44 BWR 1 1
Ref DPC 1 1
37 PWR / 89 BWR 1 1
3.1.5 Reference ISF assumptions
The ISF assumptions have been applied consistently to all scenarios. Sensitivity studies may be conducted
in this area in the future (start dates are documented in Section 3.2.2). All assumptions are based on
Reference 13.
Acceptance is limited at a pilot ISF to DPCs from the nine existing shutdown reactor sites.
Operations expand to 3,000 MTHM per year canister receipt capability at a co-located, large ISF.
It is assumed that there is a 3 year ramp-up to get to the full receipt capability. A canister-only
ISF is consistent with the initial focus on standardized canister systems loaded at reactor sites.
The ISF stores SNF from reactors until the repository opens. Once the repository begins
accepting SNF, all SNF from reactors goes directly to the repository. Once at-reactor SNF is
unavailable for transport, the SNF at the ISF is accepted at the repository.15
No packaging/repackaging for disposal is performed at the ISF. This is consistent with the status
quo strategies in which DPCs are shipped directly from reactors to the repository with no ISF in
the system.
Standardized canister systems will be stored at the ISF as described above.
The storage capacity is not constrained.
15 Sensitivity case(s) in which the ISF serves as a throughput facility that receives and handles all SNF on the way to the
repository may be evaluated in the future to see if the observations concerning standardized containers would be affected.

Initial Standardized Canister System Evaluation 12 September 2015
3.1.6 Reference repository assumptions
There is 3,000-MTHM/year receipt and emplacement (assuming no ramp-up for this analysis).
The surface storage capacity for canistered SNF and for WPs prior to emplacement is not
constrained.
All packaging/repackaging for disposal is performed at the repository.
If the 37 PWR standardized canister design is assumed to be disposable, all legacy DPCs are also
assumed to be disposable.
No capacity limits for final disposition are specified.
3.2 Scenario Assumption Variations
Along with the reference assumptions and selections, the following assumptions were varied.
3.2.1 Responses to outcomes based on repository compatibility
Scenarios were constructed by combining each strategy with a response to outcome (based on repository
compatibility). Then the scenarios were analyzed using the reference scenario assumptions described
above. Possible responses to outcome based on repository compatibility are described below.
No change (compatible case): A base case in which it is determined, at the time that the
repository site/design characteristics were known, that the standardized canister system/DPC used
in the strategy was directly disposable in the repository. In this case, the standardized canister
systems/DPCs were loaded at the repository into suitable disposal overpacks.
Change to smaller canister or change to larger canister (incompatible case): A contingent case in
which it is determined, at the time that the repository site/design characteristics were assumed to
become known, that the optimal WP capacity or size was not consistent with the capacity or size
of the canister used in the strategy. As described in Section 2.4, at that time all future SNF was
loaded into repository-compatible standardized canister systems. The already-canistered SNF will
be dispositioned depending on the specific case.
If the strategy involves larger standardized canister systems or DPCs and the repository is
determined to be incompatible with a large capacity canisters, the already-loaded
standardized canister systems/DPCs would be reopened at the repository, the contents loaded
into disposal packages, and the canisters disposed of as LLW. Since the 4P/9B standardized
canister system is expected to be compatible with the most restrictive disposal environments
under consideration, those standardized canister systems are assumed to be disposable
without repackaging.
If the repository is determined to be compatible with the larger standardized canister systems,
the small, standardized canister systems would not be repackaged. Instead, the loaded smaller
canisters would be disposed of in multi-canister disposal overpacks.16
3.2.2 Schedule variations
These dates are based on the Administration’s Strategy (Ref. 1) where applicable.
16 Note that if the source of incompatibility with the site were not the size or capacity of the canisters but the effects of the
specific site geochemistry on the internals (esp. postclosure criticality control measures), the small canisters may require
repackaging as well.
Initial Standardized Canister System Evaluation September 2015 13
ISF accepts DPCs from shutdown reactors – 2021
ISF accepts DPCs/standardized canister systems at large scale17
– 2025
Standardized canister systems available – 2025
Repository sited – 2026
Disposability of canisters known with high confidence – 2036
Repository opens – 2048
The reference date (2036) for determination of the repository WP size is based on past engineering
experience. While the repository is sited in 2026, it will take some time to more fully characterize the
repository to determine the appropriate WP capacity. Assuming the repository license is granted in 2042,
the application would need to be submitted in the 2038 time frame. It is assumed that two years prior to
submittal, the design specifications would be selected (and locked down) to prepare the application,
including the specifications on the WP size.
All strategies are based on the reference dates listed above. However, to test the sensitivity of the results
to changes in those dates, several combinations of changes for the various events have been identified.
The intent is to start with the smallest set of schedule contingencies. This would provide important
insights and would avoid the multiplication of scenario evaluations. In future evaluations, additional
scenarios will be defined and evaluated if the initial analyses indicate that further refinement is needed.
3.2.3 Other variations
In future evaluations, other variations to the reference scenario assumptions may be considered, including
addition of bare fuel receipt and perhaps bare fuel storage capabilities at the ISF, as well as loading of
standardized canister systems at the ISF. Alternative receipt priority approaches to determine effects on
different strategies might also be examined.
4. SCENARIO DESCRIPTIONS
As noted in Section 1.2, scenarios consist of an initial strategy (i.e., size of canister to load), an outcome
(i.e., WP size), and a response to outcome (i.e., immediately switch to waste-package-compatible
canister). Scenarios include assumptions on when and where they would be implemented. Scenarios
encompass the entire time period of the system, including initial/boundary conditions (system start to
finish) for an assumed outcome and the response to that outcome. In this initial evaluation, 52 scenarios
were analyzed to (1) identify areas for more refined future study, (2) identify areas where input
information could be improved/confirmed, and (3) provide insight into impacts related to near-term
implementation of standardized canister systems.
All scenarios in the initial system evaluation have the same SNF generation projection (Section 3.1.2) and
the same acceptance priority for shipment from utility sites (Section 3.1.3). All scenarios assume a 3,000
MTHM annual throughput at system steady state operation (Sections 3.1.5 and 3.1.6). If needed, the
repackaging facility is assumed to be at the repository (Section 3.1.6).
Relevant waste management system future end states (outcomes) are represented by a geologic repository
design that can handle a specific capacity WP (in terms of number of SNF assemblies). Representative
17 Assumes a 3-year ramp-up to 3,000 MTHM/year steady state.
Initial Standardized Canister System Evaluation 14 September 2015
WP capacities are chosen based on recent research on disposal concepts in the US (Refs. 5 and 9). The
standardized canister system sizes considered in this evaluation match WP capacities:
Small: 4 PWR / 9 BWR (Ref. 11)
Medium: 12 PWR / 32 BWR (Ref. 11)
Large: 21 PWR / 44 BWR (Ref. 10)
Largest: 37 PWR / 89 BWR (Largest currently-licensed DPC design)
For small 4 PWR-sized canisters, a multicanister overpack with a capacity of four canisters is assumed to
be used for both storage and transportation (Ref. 11). For medium canisters, a multicanister overpack with
a capacity of three canisters is assumed to be used for storage only, but not for transportation (Ref. 11).
SNF in DPCs or standardized canisters that is not compatible with the final repository design is
repackaged into repository-compatible WPs at repository repackaging facilities (Section 3.1.6).
In this section, the scenarios are divided into two major classes based on the scenario’s initial strategy:
status quo and standardization. These are subdivided into multiple classes based on both the outcome and
the waste management system architecture implementation assumptions (i.e., with or without an ISF).
4.1 Status Quo Major Class
All scenarios in the status quo major class include the status quo strategy, which continues use of DPC
systems with no actions taken to increase the likelihood that DPCs can be used for storage, transportation,
and disposal. There are 14 scenarios in the status quo major class. This major class was selected to
provide a baseline for comparison to scenarios where standardized canister systems were introduced early
in the waste management system. This status quo strategy is consistent with the utilities’ current loading
decisions (i.e. load large DPCs).
4.1.1 Status Quo Class 1 (Reference)
This class contains the following assumptions and input selections:
All reactors load all SNF into DPCs, regardless of WP size or timing of when the WP size is
known.
The waste management system architecture implementation does not include an ISF.
The WP size is known in 2036 (not relevant for this class) and the repository begins accepting
SNF in 2048.
In this class, the outcome (size of WP) is varied, but the response to the outcome is to continue loading
DPCs. Four scenarios were analyzed in this class.
1. The WP size is 4 PWR.
2. The WP size is 12 PWR.
3. The WP size is 21 PWR.
4. All DPCs are determined to be disposable.
4.1.2 Status Quo Class 2 (Reference with ISF)
This class contains the following assumptions and input selections:
All reactors load all SNF into DPCs, regardless of WP size or timing of when the WP size is
known.
Initial Standardized Canister System Evaluation September 2015 15
The waste management system architecture implementation includes a pilot ISF that accepts
DPCs from the existing shutdown sites from 2021–2025, with a full-scale ISF that begins
accepting DPCs in 2025.
The WP size is known in 2036 (not relevant for this class) and the repository begins accepting
SNF in 2048.
In this class, the outcome (size of WP) is varied, but the response to the outcome is to continue loading
DPCs regardless of the size of the WP. Four scenarios were analyzed in this class.
5. The WP size is 4 PWR.
6. The WP size is 12 PWR.
7. The WP size is 21 PWR.
8. All DPCs are determined to be disposable.
4.1.3 Status Quo Class 3
This class is similar to status quo class 1 (Section 4.1.1), but the response to outcome is different.
This class contains the following assumptions and input selections:
All reactors load SNF into DPCs until the WP capacity is determined. At that point, the reactors
begin loading WP-compatible canisters.
The waste management system architecture implementation does not include an ISF.
The WP size is known in 2036 and the repository begins accepting SNF in 2048.
In this class, the outcome (size of WP) is varied and the response to the outcome is to begin loading WP-
compatible canisters once the WP capacity is determined. Three scenarios were analyzed in this class.
9. The WP size is 4 PWR.
10. The WP size is 12 PWR.
11. The WP size is 21 PWR.
4.1.4 Status Quo Class 4
This class is similar to status quo class 3 (Section 4.1.3), except that an ISF was added to the system.
This class contains the following assumptions and input selections:
All reactors load SNF into DPCs until the WP size is determined. At that point, the reactors begin
loading WP-compatible canisters.
The waste management system architecture implementation includes a pilot ISF that accepts
DPCs from the existing shutdown sites from 2021–2025, with a full-scale ISF that begins
accepting DPCs in 2025.
The WP size is known in 2036 and the repository begins accepting SNF in 2048.
In this class, the outcome (size of WP) is varied and the response to the outcome is to begin loading WP-
compatible canisters once the WP capacity is determined. Three scenarios were analyzed in this class.
12. The WP size is 4 PWR.
13. The WP size is 12 PWR.
14. The WP size is 21 PWR.

Initial Standardized Canister System Evaluation 16 September 2015
4.2 Standardized Canister Major Class
All scenarios in the standardized canister major class implement the standardized canister strategy. This
implies that all reactors begin loading a standardized canister system before the disposal requirements are
known (either 2025 or 2030 in all scenarios). This major class was selected to provide variations on the
different standardized canister system options. These scenarios include implementation of a specific-
capacity standardized canister system early in the waste management system.
4.2.1 Standardized Canister Class 1
This class contains the following assumptions and input selections:
All reactors load SNF into DPCs until 2025, when the standardized canister systems become
available. At that point, reactors begin loading the standardized canister systems.
A pilot ISF accepts DPCs from 2021–2025 from the existing shutdown sites, and a full-scale ISF
begins accepting DPCs in 2025.
The WP capacity is known in 2036, and the repository begins accepting SNF in 2048.
In this class, the strategy (initial standardized canister size loaded in 2025) is varied, the outcome (size of
WP) is varied, and the response to the outcome is to begin loading WP-compatible canisters once the WP
is determined. Twelve scenarios were analyzed in this class.
15. The initial standardization canister strategy is 4 PWR (2025). The WP size is 4 PWR (2036).
16. The initial standardization canister strategy is 4 PWR (2025). The WP size is 12 PWR (2036).
17. The initial standardization canister strategy is 4 PWR (2025). The WP size is 21 PWR (2036).
18. The initial standardization canister strategy is 4 PWR (2025). The WP size is 37 PWR (2036).
19. The initial standardization canister strategy is 12 PWR (2025). The WP size is 4 PWR (2036).
20. The initial standardization canister strategy is 12 PWR (2025). The WP size is 12 PWR (2036).
21. The initial standardization canister strategy is 12 PWR (2025). The WP size is 21 PWR (2036).
22. The initial standardization canister strategy is 12 PWR (2025). The WP size is 37 PWR (2036).
23. The initial standardization canister strategy is 21 PWR (2025). The WP size is 4 PWR (2036).
24. The initial standardization canister strategy is 21 PWR (2025). The WP size is 12 PWR (2036).
25. The initial standardization canister strategy is 21 PWR (2025). The WP size is 21 PWR (2036).
26. The initial standardization canister strategy is 21 PWR (2025). The WP size is 37 PWR (2036).
4.2.2 Standardized Canister Class 2
This class is similar to the standardized canister class 1 (Section 4.2.1), but the ISF is assumed to be
delayed by five years.
This class contains the following assumptions and input selections:
All reactors load SNF into DPCs until 2025 when the standardized canister systems become
available. At that point, the reactors begin loading the standardized canister systems.
A pilot ISF accepts DPCs from 2026–2030 from the existing shutdown sites, and a full-scale ISF
begins accepting DPCs in 2030.
The WP size is known in 2036, and the repository begins accepting SNF in 2048.
Initial Standardized Canister System Evaluation September 2015 17
In this class, the strategy (initial standardized canister size loaded in 2025) is varied, the outcome (size of
WP) is varied, and the response to the outcome is to begin loading WP-compatible canisters once the WP
is determined. Three scenarios were analyzed in this class.
27. The initial standardization canister strategy is 4 PWR (2025). The WP size is 4 PWR (2036).
28. The initial standardization canister strategy is 12 PWR (2025). The WP size is 12 PWR (2036).
29. The initial standardization canister strategy is 21 PWR (2025). The WP size is 21 PWR (2036).
4.2.3 Standardized Canister Class 3
This class is similar to the standardized canister class 1 (Section 4.2.1), but there is no ISF in the system.
This class contains the following assumption and input selections:
All reactors load SNF into DPCs until 2025, when the standardized canister systems are available.
At that point, reactors begin loading the standardized canister systems.
The waste management system architecture implementation does not include an ISF.
The WP size is known in 2036, and the repository begins accepting SNF in 2048.
In this class, the strategy (initial standardized canister size loaded in 2025) is varied, the outcome (size of
WP) is varied, and the response to the outcome is to begin loading WP-compatible canisters once the WP
is determined. Twelve scenarios were analyzed in this class.
30. The initial standardization canister strategy is 4 PWR (2025). The WP size is 4 PWR (2036).
31. The initial standardization canister strategy is 4 PWR (2025). The WP size is 12 PWR (2036).
32. The initial standardization canister strategy is 4 PWR (2025). The WP size is 21 PWR (2036).
33. The initial standardization canister strategy is 4 PWR (2025). The WP size is 37 PWR (2036).
34. The initial standardization canister strategy is 12 PWR (2025). The WP size is 4 PWR (2036).
35. The initial standardization canister strategy is 12 PWR (2025). The WP size is 12 PWR (2036).
36. The initial standardization canister strategy is 12 PWR (2025). The WP size is 21 PWR (2036).
37. The initial standardization canister strategy is 12 PWR (2025). The WP size is 37 PWR (2036).
38. The initial standardization canister strategy is 21 PWR (2025). The WP size is 4 PWR (2036).
39. The initial standardization canister strategy is 21 PWR (2025). The WP size is 12 PWR (2036).
40. The initial standardization canister strategy is 21 PWR (2025). The WP size is 21 PWR (2036).
41. The initial standardization canister strategy is 21 PWR (2025). The WP size is 37 PWR (2036).
4.2.4 Standardized Canister Class 4
This class is similar to the standardized canister class 2 (Section 4.2.2). The ISF and the standardized
canister system are both assumed to be delayed by five years.
This class contains the following assumptions and input selections:
All reactors load SNF into DPCs until 2030 when the standardized canister systems become
available. At that point, the reactors begin loading the standardized canister systems.
A pilot ISF accepts DPCs from 2026–2030 from the existing shutdown sites, and a full-scale ISF
begins accepting DPCs in 2030.
Initial Standardized Canister System Evaluation 18 September 2015
The WP size is known in 2036 and the repository begins accepting SNF in 2048.
In this class, the strategy (initial standardized canister size loaded in 2030) is varied, the outcome (size of
WP) is varied, and the response to the outcome is to begin loading WP-compatible canisters once the WP
is determined. Three scenarios were analyzed in this class.
42. The initial standardization canister strategy is 4 PWR (2030). The WP size is 4 PWR (2036).
43. The initial standardization canister strategy is 12 PWR (2030). The WP size is 12 PWR (2036).
44. The initial standardization canister strategy is 21 PWR (2030). The WP size is 21 PWR (2036).
4.2.5 Standardized Canister Class 5
This class is similar to the standardized canister class 1 (Section 4.2.1), but the WP is assumed to be
known and the repository is assumed to be complete six years earlier.
This class contains the following assumptions and input selections:
All reactors load SNF into DPCs until 2025, when the standardized canister systems become
available. At that point, the reactors begin loading the standardized canister systems.
A pilot ISF accepts DPCs from 2021–2025 from the existing shutdown sites, and a full-scale ISF
begins accepting DPCs in 2025.
The WP size is known in 2030, and the repository begins accepting SNF in 2042.
In this class, the strategy (initial standardized canister size loaded in 2025) is varied, the outcome (size of
WP) is varied, and the response to the outcome is to begin loading WP-compatible canisters once the WP
is determined. Four scenarios were analyzed in this class.
45. The initial standardization canister strategy is 4 PWR (2025). The WP size is 21 PWR (2030).
46. The initial standardization canister strategy is 12 PWR (2025). The WP size is 21 PWR (2030).
47. The initial standardization canister strategy is 12 PWR (2025). The WP size is 4 PWR (2030).
48. The initial standardization canister strategy is 21 PWR (2025). The WP size is 4 PWR (2030).
4.2.6 Standardized Canister Class 6
This class is similar to the standardized canister class 1 (Section 4.2.1), but the WP is assumed to be
known and the repository is assumed to be complete four years later.
This class contains the following assumptions and input selections:
All reactors load SNF into DPCs until 2025, when the standardized canister systems become
available. At that point, the reactors begin loading the standardized canister systems.
A pilot ISF accepts DPCs from 2021–2025 from the existing shutdown sites, and a full-scale ISF
begins accepting DPCs in 2025.
The WP size is known in 2040, and the repository begins accepting SNF in 2052.
In this class, the strategy (initial standardized canister size loaded in 2025) is varied, the outcome (size of
WP) is varied, and the response to the outcome is to begin loading WP-compatible canisters once the WP
is determined. Four scenarios were analyzed in this class.
49. The initial standardization canister strategy is 4 PWR (2025). The WP size is 21 PWR (2040).
50. The initial standardization canister strategy is 12 PWR (2025). The WP size is 21 PWR (2040).
Initial Standardized Canister System Evaluation September 2015 19
51. The initial standardization canister strategy is 12 PWR (2025). The WP size is 4 PWR (2040).
52. The initial standardization canister strategy is 21 PWR (2025). The WP size is 4 PWR (2040).
5. SCENARIO RESULTS
This is the initial evaluation of the impact of incorporating standardized canisters into the waste
management system. Therefore, one of the primary purposes of this evaluation is to understand results in
the context of the system computational model inputs, boundary conditions, and assumptions. In several
instances, the results were unexpected and will lead to a more critical evaluation of the data and cost
inputs to ensure that appropriate values are used in future evaluations. Cost information is provided to
show how management strategies and responses to outcomes affect relative costs. Application of the
rough order of magnitude (ROM) cost results beyond this purpose should be avoided for several reasons.
1) Simplified assumptions are used in this evaluation and in describing the alternative SNF
management strategies.
2) Significant portions of the input data assumptions related to standardized canisters (e.g., at-
reactor costs, ISF design concepts) are based on limited or no operational or design experience18
.
3) Key factors such as waste management system costs for siting, characterization, and licensing for
repository facilities are not included.
4) Costs associated with delay in the waste management program, which are potentially greater for
some concepts than others, are not included.
5) All metrics are tabulated from 2020 forward.
The high-level results of the scenarios are presented in Table 2 and Table 3. Table 2 shows the ROM cost
metrics for each scenario and Table 3 shows the logistics metrics for each scenario. Table 4 gives a
description of each column for Table 2 and Table 3. Table 5 provides a quick reference for the
assumptions for each scenario.
Throughout this report, different colors are used to represent groups of scenarios based on the WP size:
4 PWR WP size: orange
12 PWR WP size: light blue
21 PWR WP size: green
37 PWR (or DPC) WP size: red
This color system is used in Table 2, Table 3, Table 5, and Appendix A and Appendix B, as well as in
various figures throughout the report.
18 Specifically, the cost to load any size canister (4 PWR through 37 PWR) is assumed to be the same. This is because all at-
reactor loading operations, regardless of canister size, are assumed to be performed in same manner (i.e., serially). Future
evaluations will evaluate the benefits of different loading operations.
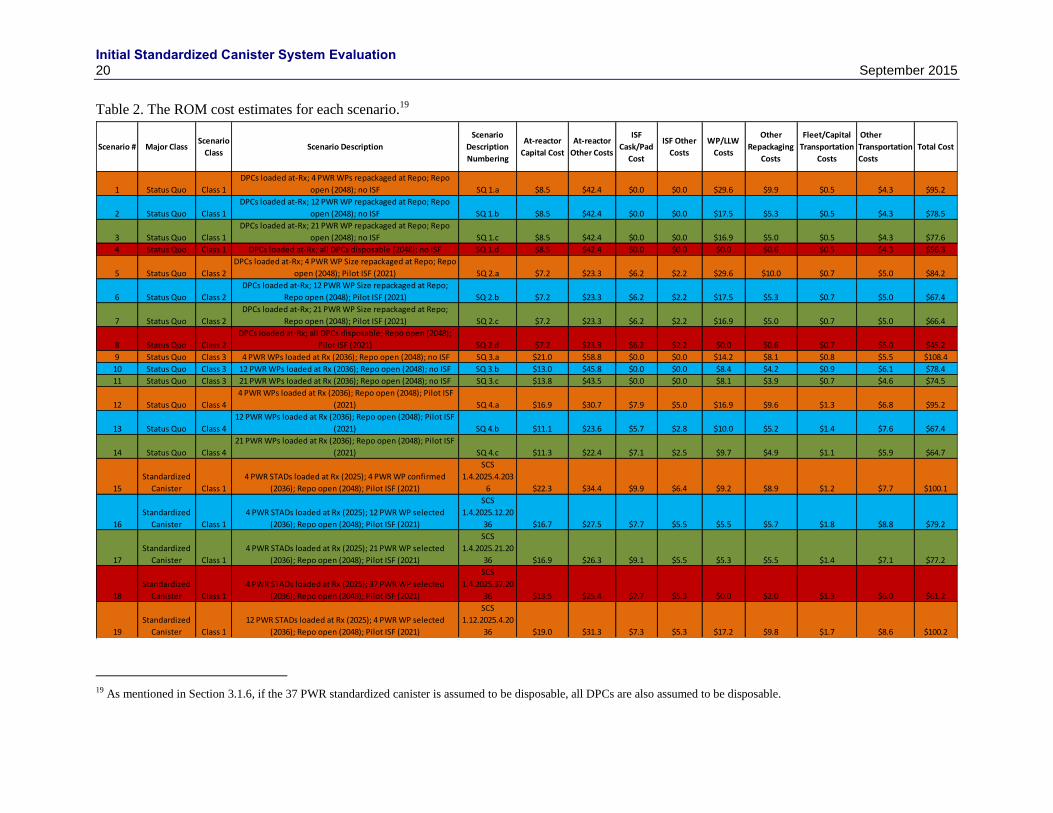
Initial Standardized Canister System Evaluation 20 September 2015
Table 2. The ROM cost estimates for each scenario.19
19 As mentioned in Section 3.1.6, if the 37 PWR standardized canister is assumed to be disposable, all DPCs are also assumed to be disposable.
Scenario # Major ClassScenario
ClassScenario Description
Scenario
Description
Numbering
At-reactor
Capital Cost
At-reactor
Other Costs
ISF
Cask/Pad
Cost
ISF Other
Costs
WP/LLW
Costs
Other
Repackaging
Costs
Fleet/Capital
Transportation
Costs
Other
Transportation
Costs
Total Cost
1 Status Quo Class 1
DPCs loaded at-Rx; 4 PWR WPs repackaged at Repo; Repo
open (2048); no ISF SQ 1.a $8.5 $42.4 $0.0 $0.0 $29.6 $9.9 $0.5 $4.3 $95.2
2 Status Quo Class 1
DPCs loaded at-Rx; 12 PWR WP repackaged at Repo; Repo
open (2048); no ISF SQ 1.b $8.5 $42.4 $0.0 $0.0 $17.5 $5.3 $0.5 $4.3 $78.5
3 Status Quo Class 1
DPCs loaded at-Rx; 21 PWR WP repackaged at Repo; Repo
open (2048); no ISF SQ 1.c $8.5 $42.4 $0.0 $0.0 $16.9 $5.0 $0.5 $4.3 $77.6
4 Status Quo Class 1 DPCs loaded at-Rx; all DPCs disposable (2048); no ISF SQ 1.d $8.5 $42.4 $0.0 $0.0 $0.0 $0.6 $0.5 $4.3 $56.3
5 Status Quo Class 2
DPCs loaded at-Rx; 4 PWR WP Size repackaged at Repo; Repo
open (2048); Pilot ISF (2021) SQ 2.a $7.2 $23.3 $6.2 $2.2 $29.6 $10.0 $0.7 $5.0 $84.2
6 Status Quo Class 2
DPCs loaded at-Rx; 12 PWR WP Size repackaged at Repo;
Repo open (2048); Pilot ISF (2021) SQ 2.b $7.2 $23.3 $6.2 $2.2 $17.5 $5.3 $0.7 $5.0 $67.4
7 Status Quo Class 2
DPCs loaded at-Rx; 21 PWR WP Size repackaged at Repo;
Repo open (2048); Pilot ISF (2021) SQ 2.c $7.2 $23.3 $6.2 $2.2 $16.9 $5.0 $0.7 $5.0 $66.4
8 Status Quo Class 2
DPCs loaded at-Rx; all DPCs disposable; Repo open (2048);
Pilot ISF (2021) SQ 2.d $7.2 $23.3 $6.2 $2.2 $0.0 $0.6 $0.7 $5.0 $45.2
9 Status Quo Class 3 4 PWR WPs loaded at Rx (2036); Repo open (2048); no ISF SQ 3.a $21.0 $58.8 $0.0 $0.0 $14.2 $8.1 $0.8 $5.5 $108.4
10 Status Quo Class 3 12 PWR WPs loaded at Rx (2036); Repo open (2048); no ISF SQ 3.b $13.0 $45.8 $0.0 $0.0 $8.4 $4.2 $0.9 $6.1 $78.4
11 Status Quo Class 3 21 PWR WPs loaded at Rx (2036); Repo open (2048); no ISF SQ 3.c $13.8 $43.5 $0.0 $0.0 $8.1 $3.9 $0.7 $4.6 $74.5
12 Status Quo Class 4
4 PWR WPs loaded at Rx (2036); Repo open (2048); Pilot ISF
(2021) SQ 4.a $16.9 $30.7 $7.9 $5.0 $16.9 $9.6 $1.3 $6.8 $95.2
13 Status Quo Class 4
12 PWR WPs loaded at Rx (2036); Repo open (2048); Pilot ISF
(2021) SQ 4.b $11.1 $23.6 $5.7 $2.8 $10.0 $5.2 $1.4 $7.6 $67.4
14 Status Quo Class 4
21 PWR WPs loaded at Rx (2036); Repo open (2048); Pilot ISF
(2021) SQ 4.c $11.3 $22.4 $7.1 $2.5 $9.7 $4.9 $1.1 $5.9 $64.7
15
Standardized
Canister Class 1
4 PWR STADs loaded at Rx (2025); 4 PWR WP confirmed
(2036); Repo open (2048); Pilot ISF (2021)
SCS
1.4.2025.4.203
6 $22.3 $34.4 $9.9 $6.4 $9.2 $8.9 $1.2 $7.7 $100.1
16
Standardized
Canister Class 1
4 PWR STADs loaded at Rx (2025); 12 PWR WP selected
(2036); Repo open (2048); Pilot ISF (2021)
SCS
1.4.2025.12.20
36 $16.7 $27.5 $7.7 $5.5 $5.5 $5.7 $1.8 $8.8 $79.2
17
Standardized
Canister Class 1
4 PWR STADs loaded at Rx (2025); 21 PWR WP selected
(2036); Repo open (2048); Pilot ISF (2021)
SCS
1.4.2025.21.20
36 $16.9 $26.3 $9.1 $5.5 $5.3 $5.5 $1.4 $7.1 $77.2
18
Standardized
Canister Class 1
4 PWR STADs loaded at Rx (2025); 37 PWR WP selected
(2036); Repo open (2048); Pilot ISF (2021)
SCS
1.4.2025.37.20
36 $13.5 $25.4 $7.7 $5.3 $0.0 $2.0 $1.3 $6.0 $61.2
19
Standardized
Canister Class 1
12 PWR STADs loaded at Rx (2025); 4 PWR WP selected
(2036); Repo open (2048); Pilot ISF (2021)
SCS
1.12.2025.4.20
36 $19.0 $31.3 $7.3 $5.3 $17.2 $9.8 $1.7 $8.6 $100.2

Initial Standardized Canister System Evaluation September 2015 21
Table 2. The ROM cost estimates for each scenario (Continued)
Scenario # Major ClassScenario
ClassScenario Description
Scenario
Description
Numbering
At-reactor
Capital Cost
At-reactor
Other Costs
ISF
Cask/Pad
Cost
ISF Other
Costs
WP/LLW
Costs
Other
Repackaging
Costs
Fleet/Capital
Transportation
Costs
Other
Transportation
Costs
Total Cost
20
Standardized
Canister Class 1
12 PWR STADs loaded at Rx (2025); 12 PWR WP confirmed
(2036); Repo open (2048); Pilot ISF (2021)
SCS
1.12.2025.12.2
036 $13.2 $24.4 $5.0 $3.2 $5.5 $4.6 $1.4 $8.8 $66.1
21
Standardized
Canister Class 1
12 PWR STADs loaded at Rx (2025); 21 PWR WP selected
(2036); Repo open (2048); Pilot ISF (2021)
SCS
1.12.2025.21.2
036 $13.5 $23.2 $6.4 $3.2 $5.3 $4.4 $1.6 $7.7 $65.1
22
Standardized
Canister Class 1
12 PWR STADs loaded at Rx (2025); 37 PWR WP selected
(2036); Repo open (2048); Pilot ISF (2021)
SCS
1.12.2025.37.2
036 $10.1 $22.3 $5.0 $2.9 $0.0 $0.9 $1.4 $6.6 $49.2
23
Standardized
Canister Class 1
21 PWR STADs loaded at Rx (2025); 4 PWR WP selected
(2036); Repo open (2048); Pilot ISF (2021)
SCS
1.21.2025.4.20
36 $19.0 $30.7 $9.0 $5.1 $17.2 $9.7 $1.5 $7.4 $99.5
24
Standardized
Canister Class 1
21 PWR STADs loaded at Rx (2025); 12 PWR WP selected
(2036); Repo open (2048); Pilot ISF (2021)
SCS
1.21.2025.12.2
036 $13.3 $23.8 $6.7 $3.0 $10.1 $5.2 $1.6 $8.2 $71.9
25
Standardized
Canister Class 1
21 PWR STADs loaded at Rx (2025); 21 PWR WP confirmed
(2036); Repo open (2048); Pilot ISF (2021)
SCS
1.21.2025.21.2
036 $13.4 $22.6 $8.1 $2.6 $5.3 $4.3 $1.0 $6.1 $63.4
26
Standardized
Canister Class 1
21 PWR STADs loaded at Rx (2025); 37 PWR WP selected
(2036); Repo open (2048); Pilot ISF (2021)
SCS
1.21.2025.37.2
036 $8.5 $21.5 $5.1 $2.0 $0.0 $0.6 $0.8 $4.5 $42.9
27
Standardized
Canister Class 2
4 PWR STADs loaded at Rx (2025); 4 PWR WP confirmed
(2036); Repo open (2048); Pilot ISF (2026)
SCS
2.4.2025.4.203
6 $22.9 $40.9 $7.7 $5.6 $9.2 $8.9 $1.2 $7.5 $104.0
28
Standardized
Canister Class 2
12 PWR STADs loaded at Rx (2025); 12 PWR WP confirmed
(2036); Repo open (2048); Pilot ISF (2026)
SCS
2.12.2025.12.2
036 $13.5 $29.1 $4.0 $2.8 $5.4 $4.6 $1.4 $8.6 $69.5
29
Standardized
Canister Class 2
21 PWR STADs loaded at Rx (2025); 21 PWR WP confirmed
(2036); Repo open (2048); Pilot ISF (2026)
SCS
2.21.2025.21.2
036 $13.9 $27.1 $6.3 $2.4 $5.3 $4.3 $1.0 $6.1 $66.2
30
Standardized
Canister Class 3
4 PWR STADs loaded at Rx (2025); 4 PWR WP confirmed
(2036); Repo open (2048); no ISF
SCS
3.4.2025.4.203
6 $25.1 $63.8 $0.0 $0.0 $9.2 $7.2 $0.9 $6.0 $112.3
31
Standardized
Canister Class 3
4 PWR STADs loaded at Rx (2025); 12 PWR WP selected
(2036); Repo open (2048); no ISF
SCS
3.4.2025.12.20
36 $17.0 $50.8 $0.0 $0.0 $5.4 $4.5 $1.0 $6.7 $85.4
32
Standardized
Canister Class 3
4 PWR STADs loaded at Rx (2025); 21 PWR WP selected
(2036); Repo open (2048); no ISF
SCS
3.4.2025.21.20
36 $17.9 $48.5 $0.0 $0.0 $5.3 $4.2 $0.8 $5.2 $81.8
33
Standardized
Canister Class 3
4 PWR STADs loaded at Rx (2025); 37 PWR WP selected
(2036); Repo open (2048); no ISF
SCS
3.4.2025.37.20
36 $13.1 $46.8 $0.0 $0.0 $0.0 $1.4 $0.7 $4.1 $66.1
34
Standardized
Canister Class 3
12 PWR STADs loaded at Rx (2025); 4 PWR WP selected
(2036); Repo open (2048); no ISF
SCS
3.12.2025.4.20
36 $22.5 $59.6 $0.0 $0.0 $14.2 $8.1 $1.0 $6.3 $111.7
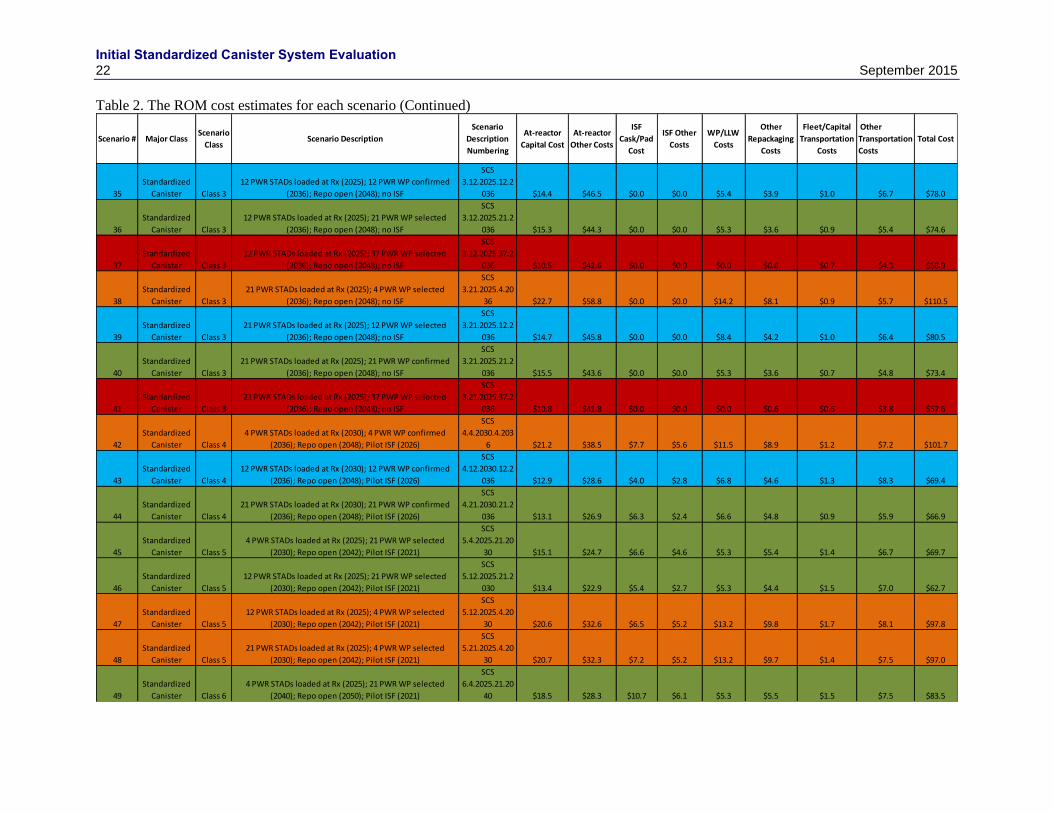
Initial Standardized Canister System Evaluation 22 September 2015
Table 2. The ROM cost estimates for each scenario (Continued)
Scenario # Major ClassScenario
ClassScenario Description
Scenario
Description
Numbering
At-reactor
Capital Cost
At-reactor
Other Costs
ISF
Cask/Pad
Cost
ISF Other
Costs
WP/LLW
Costs
Other
Repackaging
Costs
Fleet/Capital
Transportation
Costs
Other
Transportation
Costs
Total Cost
35
Standardized
Canister Class 3
12 PWR STADs loaded at Rx (2025); 12 PWR WP confirmed
(2036); Repo open (2048); no ISF
SCS
3.12.2025.12.2
036 $14.4 $46.5 $0.0 $0.0 $5.4 $3.9 $1.0 $6.7 $78.0
36
Standardized
Canister Class 3
12 PWR STADs loaded at Rx (2025); 21 PWR WP selected
(2036); Repo open (2048); no ISF
SCS
3.12.2025.21.2
036 $15.3 $44.3 $0.0 $0.0 $5.3 $3.6 $0.9 $5.4 $74.6
37
Standardized
Canister Class 3
12 PWR STADs loaded at Rx (2025); 37 PWR WP selected
(2036); Repo open (2048); no ISF
SCS
3.12.2025.37.2
036 $10.5 $42.6 $0.0 $0.0 $0.0 $0.8 $0.7 $4.3 $58.9
38
Standardized
Canister Class 3
21 PWR STADs loaded at Rx (2025); 4 PWR WP selected
(2036); Repo open (2048); no ISF
SCS
3.21.2025.4.20
36 $22.7 $58.8 $0.0 $0.0 $14.2 $8.1 $0.9 $5.7 $110.5
39
Standardized
Canister Class 3
21 PWR STADs loaded at Rx (2025); 12 PWR WP selected
(2036); Repo open (2048); no ISF
SCS
3.21.2025.12.2
036 $14.7 $45.8 $0.0 $0.0 $8.4 $4.2 $1.0 $6.4 $80.5
40
Standardized
Canister Class 3
21 PWR STADs loaded at Rx (2025); 21 PWR WP confirmed
(2036); Repo open (2048); no ISF
SCS
3.21.2025.21.2
036 $15.5 $43.6 $0.0 $0.0 $5.3 $3.6 $0.7 $4.8 $73.4
41
Standardized
Canister Class 3
21 PWR STADs loaded at Rx (2025); 37 PWR WP selected
(2036); Repo open (2048); no ISF
SCS
3.21.2025.37.2
036 $10.8 $41.8 $0.0 $0.0 $0.0 $0.6 $0.6 $3.8 $57.6
42
Standardized
Canister Class 4
4 PWR STADs loaded at Rx (2030); 4 PWR WP confirmed
(2036); Repo open (2048); Pilot ISF (2026)
SCS
4.4.2030.4.203
6 $21.2 $38.5 $7.7 $5.6 $11.5 $8.9 $1.2 $7.2 $101.7
43
Standardized
Canister Class 4
12 PWR STADs loaded at Rx (2030); 12 PWR WP confirmed
(2036); Repo open (2048); Pilot ISF (2026)
SCS
4.12.2030.12.2
036 $12.9 $28.6 $4.0 $2.8 $6.8 $4.6 $1.3 $8.3 $69.4
44
Standardized
Canister Class 4
21 PWR STADs loaded at Rx (2030); 21 PWR WP confirmed
(2036); Repo open (2048); Pilot ISF (2026)
SCS
4.21.2030.21.2
036 $13.1 $26.9 $6.3 $2.4 $6.6 $4.8 $0.9 $5.9 $66.9
45
Standardized
Canister Class 5
4 PWR STADs loaded at Rx (2025); 21 PWR WP selected
(2030); Repo open (2042); Pilot ISF (2021)
SCS
5.4.2025.21.20
30 $15.1 $24.7 $6.6 $4.6 $5.3 $5.4 $1.4 $6.7 $69.7
46
Standardized
Canister Class 5
12 PWR STADs loaded at Rx (2025); 21 PWR WP selected
(2030); Repo open (2042); Pilot ISF (2021)
SCS
5.12.2025.21.2
030 $13.4 $22.9 $5.4 $2.7 $5.3 $4.4 $1.5 $7.0 $62.7
47
Standardized
Canister Class 5
12 PWR STADs loaded at Rx (2025); 4 PWR WP selected
(2030); Repo open (2042); Pilot ISF (2021)
SCS
5.12.2025.4.20
30 $20.6 $32.6 $6.5 $5.2 $13.2 $9.8 $1.7 $8.1 $97.8
48
Standardized
Canister Class 5
21 PWR STADs loaded at Rx (2025); 4 PWR WP selected
(2030); Repo open (2042); Pilot ISF (2021)
SCS
5.21.2025.4.20
30 $20.7 $32.3 $7.2 $5.2 $13.2 $9.7 $1.4 $7.5 $97.0
49
Standardized
Canister Class 6
4 PWR STADs loaded at Rx (2025); 21 PWR WP selected
(2040); Repo open (2050); Pilot ISF (2021)
SCS
6.4.2025.21.20
40 $18.5 $28.3 $10.7 $6.1 $5.3 $5.5 $1.5 $7.5 $83.5

Initial Standardized Canister System Evaluation September 2015 23
Table 2. The ROM cost estimates for each scenario (Continued)
Scenario # Major ClassScenario
ClassScenario Description
Scenario
Description
Numbering
At-reactor
Capital Cost
At-reactor
Other Costs
ISF
Cask/Pad
Cost
ISF Other
Costs
WP/LLW
Costs
Other
Repackaging
Costs
Fleet/Capital
Transportation
Costs
Other
Transportation
Costs
Total Cost
50
Standardized
Canister Class 6
12 PWR STADs loaded at Rx (2025); 21 PWR WP selected
(2040); Repo open (2050); Pilot ISF (2021)
SCS
6.12.2025.21.2
040 $13.4 $23.4 $7.0 $3.4 $5.3 $4.4 $1.7 $8.2 $67.0
51
Standardized
Canister Class 6
12 PWR STADs loaded at Rx (2025); 4 PWR WP selected
(2040); Repo open (2050); Pilot ISF (2021)
SCS
6.12.2025.4.20
40 $17.5 $29.5 $7.7 $5.1 $20.8 $9.8 $1.8 $8.9 $101.1
52
Standardized
Canister Class 6
21 PWR STADs loaded at Rx (2025); 4 PWR WP selected
(2040); Repo open (2050); Pilot ISF (2021)
SCS
6.21.2025.4.20
40 $17.4 $28.7 $10.0 $4.8 $20.7 $9.7 $1.5 $7.3 $100.0
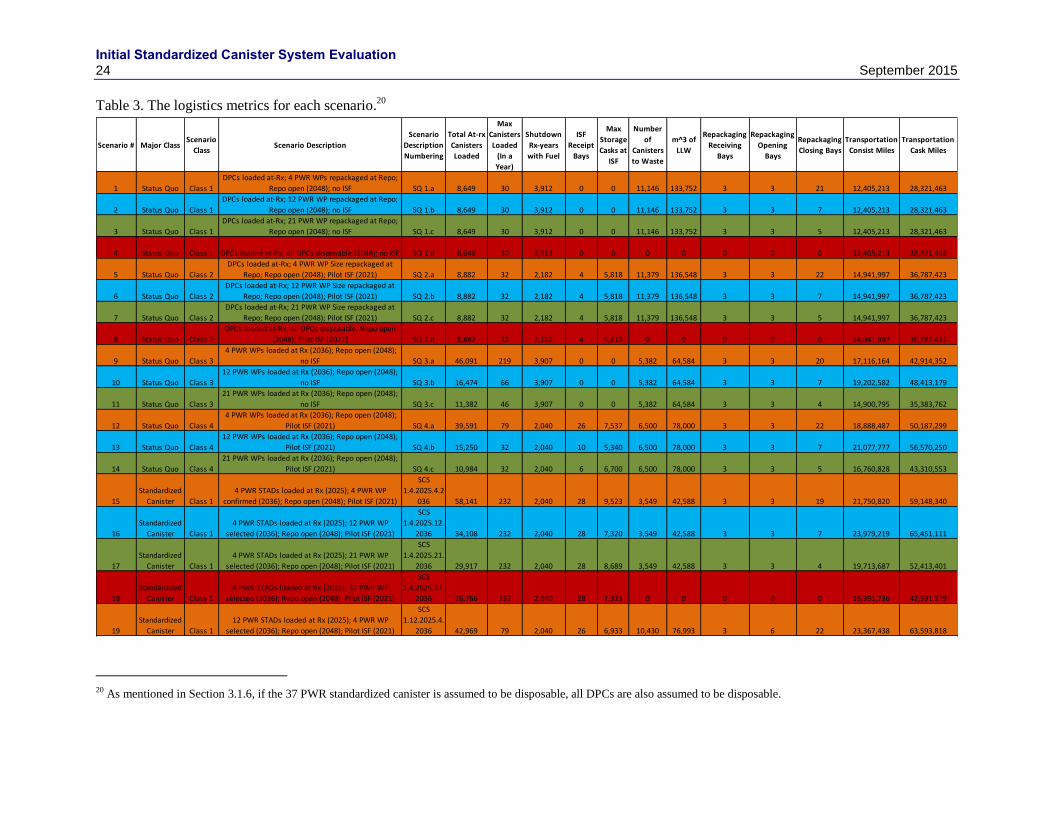
Initial Standardized Canister System Evaluation 24 September 2015
Table 3. The logistics metrics for each scenario.20
20 As mentioned in Section 3.1.6, if the 37 PWR standardized canister is assumed to be disposable, all DPCs are also assumed to be disposable.
Scenario # Major ClassScenario
ClassScenario Description
Scenario
Description
Numbering
Total At-rx
Canisters
Loaded
Max
Canisters
Loaded
(In a
Year)
Shutdown
Rx-years
with Fuel
ISF
Receipt
Bays
Max
Storage
Casks at
ISF
Number
of
Canisters
to Waste
m^3 of
LLW
Repackaging
Receiving
Bays
Repackaging
Opening
Bays
Repackaging
Closing Bays
Transportation
Consist Miles
Transportation
Cask Miles
1 Status Quo Class 1
DPCs loaded at-Rx; 4 PWR WPs repackaged at Repo;
Repo open (2048); no ISF SQ 1.a 8,649 30 3,912 0 0 11,146 133,752 3 3 21 12,405,213 28,321,463
2 Status Quo Class 1
DPCs loaded at-Rx; 12 PWR WP repackaged at Repo;
Repo open (2048); no ISF SQ 1.b 8,649 30 3,912 0 0 11,146 133,752 3 3 7 12,405,213 28,321,463
3 Status Quo Class 1
DPCs loaded at-Rx; 21 PWR WP repackaged at Repo;
Repo open (2048); no ISF SQ 1.c 8,649 30 3,912 0 0 11,146 133,752 3 3 5 12,405,213 28,321,463
4 Status Quo Class 1 DPCs loaded at-Rx; all DPCs disposable (2048); no ISF SQ 1.d 8,649 30 3,912 0 0 0 0 0 0 0 12,405,213 28,321,463
5 Status Quo Class 2
DPCs loaded at-Rx; 4 PWR WP Size repackaged at
Repo; Repo open (2048); Pilot ISF (2021) SQ 2.a 8,882 32 2,182 4 5,818 11,379 136,548 3 3 22 14,941,997 36,787,423
6 Status Quo Class 2
DPCs loaded at-Rx; 12 PWR WP Size repackaged at
Repo; Repo open (2048); Pilot ISF (2021) SQ 2.b 8,882 32 2,182 4 5,818 11,379 136,548 3 3 7 14,941,997 36,787,423
7 Status Quo Class 2
DPCs loaded at-Rx; 21 PWR WP Size repackaged at
Repo; Repo open (2048); Pilot ISF (2021) SQ 2.c 8,882 32 2,182 4 5,818 11,379 136,548 3 3 5 14,941,997 36,787,423
8 Status Quo Class 2
DPCs loaded at-Rx; all DPCs disposable; Repo open
(2048); Pilot ISF (2021) SQ 2.d 8,882 32 2,182 4 5,818 0 0 0 0 0 14,941,997 36,787,423
9 Status Quo Class 3
4 PWR WPs loaded at Rx (2036); Repo open (2048);
no ISF SQ 3.a 46,091 219 3,907 0 0 5,382 64,584 3 3 20 17,116,164 42,914,352
10 Status Quo Class 3
12 PWR WPs loaded at Rx (2036); Repo open (2048);
no ISF SQ 3.b 16,474 66 3,907 0 0 5,382 64,584 3 3 7 19,202,582 48,413,179
11 Status Quo Class 3
21 PWR WPs loaded at Rx (2036); Repo open (2048);
no ISF SQ 3.c 11,382 46 3,907 0 0 5,382 64,584 3 3 4 14,900,795 35,383,762
12 Status Quo Class 4
4 PWR WPs loaded at Rx (2036); Repo open (2048);
Pilot ISF (2021) SQ 4.a 39,591 79 2,040 26 7,537 6,500 78,000 3 3 22 18,888,487 50,187,299
13 Status Quo Class 4
12 PWR WPs loaded at Rx (2036); Repo open (2048);
Pilot ISF (2021) SQ 4.b 15,250 32 2,040 10 5,340 6,500 78,000 3 3 7 21,077,777 56,570,250
14 Status Quo Class 4
21 PWR WPs loaded at Rx (2036); Repo open (2048);
Pilot ISF (2021) SQ 4.c 10,984 32 2,040 6 6,700 6,500 78,000 3 3 5 16,760,828 43,310,553
15
Standardized
Canister Class 1
4 PWR STADs loaded at Rx (2025); 4 PWR WP
confirmed (2036); Repo open (2048); Pilot ISF (2021)
SCS
1.4.2025.4.2
036 58,141 232 2,040 28 9,523 3,549 42,588 3 3 19 21,750,820 59,148,340
16
Standardized
Canister Class 1
4 PWR STADs loaded at Rx (2025); 12 PWR WP
selected (2036); Repo open (2048); Pilot ISF (2021)
SCS
1.4.2025.12.
2036 34,108 232 2,040 28 7,320 3,549 42,588 3 3 7 23,979,219 65,451,111
17
Standardized
Canister Class 1
4 PWR STADs loaded at Rx (2025); 21 PWR WP
selected (2036); Repo open (2048); Pilot ISF (2021)
SCS
1.4.2025.21.
2036 29,917 232 2,040 28 8,689 3,549 42,588 3 3 4 19,713,687 52,413,401
18
Standardized
Canister Class 1
4 PWR STADs loaded at Rx (2025); 37 PWR WP
selected (2036); Repo open (2048); Pilot ISF (2021)
SCS
1.4.2025.37.
2036 26,766 232 2,040 28 7,323 0 0 0 0 0 16,391,736 42,591,379
19
Standardized
Canister Class 1
12 PWR STADs loaded at Rx (2025); 4 PWR WP
selected (2036); Repo open (2048); Pilot ISF (2021)
SCS
1.12.2025.4.
2036 42,969 79 2,040 26 6,933 10,430 76,993 3 6 22 23,367,438 63,593,818

Initial Standardized Canister System Evaluation September 2015 25
Table 3. The logistics metrics for each scenario (Continued)
Scenario # Major ClassScenario
ClassScenario Description
Scenario
Description
Numbering
Total At-rx
Canisters
Loaded
Max
Canisters
Loaded
(In a
Year)
Shutdown
Rx-years
with Fuel
ISF
Receipt
Bays
Max
Storage
Casks at
ISF
Number
of
Canisters
to Waste
m^3 of
LLW
Repackaging
Receiving
Bays
Repackaging
Opening
Bays
Repackaging
Closing Bays
Transportation
Consist Miles
Transportation
Cask Miles
20
Standardized
Canister Class 1
12 PWR STADs loaded at Rx (2025); 12 PWR WP
confirmed (2036); Repo open (2048); Pilot ISF (2021)
SCS
1.12.2025.1
2.2036 18,994 70 2,040 10 4,735 3,549 42,588 3 3 7 25,454,047 69,877,602
21
Standardized
Canister Class 1
12 PWR STADs loaded at Rx (2025); 21 PWR WP
selected (2036); Repo open (2048); Pilot ISF (2021)
SCS
1.12.2025.2
1.2036 14,812 70 2,040 10 6,096 3,549 42,588 3 3 4 21,258,626 56,855,260
22
Standardized
Canister Class 1
12 PWR STADs loaded at Rx (2025); 37 PWR WP
selected (2036); Repo open (2048); Pilot ISF (2021)
SCS
1.12.2025.3
7.2036 11,671 70 2,040 10 4,733 0 0 0 0 0 17,936,605 47,061,972
23
Standardized
Canister Class 1
21 PWR STADs loaded at Rx (2025); 4 PWR WP
selected (2036); Repo open (2048); Pilot ISF (2021)
SCS
1.21.2025.4.
2036 40,399 80 2,040 26 8,566 7,891 94,692 3 4 22 20,366,283 54,593,013
24
Standardized
Canister Class 1
21 PWR STADs loaded at Rx (2025); 12 PWR WP
selected (2036); Repo open (2048); Pilot ISF (2021)
SCS
1.21.2025.1
2.2036 16,444 48 2,040 10 6,368 7,891 94,692 3 4 7 22,502,128 60,881,711
25
Standardized
Canister Class 1
21 PWR STADs loaded at Rx (2025); 21 PWR WP
confirmed (2036); Repo open (2048); Pilot ISF (2021)
SCS
1.21.2025.2
1.2036 12,264 48 2,040 6 7,734 3,549 42,588 3 3 4 18,185,936 47,859,641
26
Standardized
Canister Class 1
21 PWR STADs loaded at Rx (2025); 37 PWR WP
selected (2036); Repo open (2048); Pilot ISF (2021)
SCS
1.21.2025.3
7.2036 7,522 24 2,040 4 4,765 0 0 0 0 0 12,935,611 31,976,441
27
Standardized
Canister Class 2
4 PWR STADs loaded at Rx (2025); 4 PWR WP
confirmed (2036); Repo open (2048); Pilot ISF (2026)
SCS
2.4.2025.4.2
036 58,141 232 2,415 28 7,356 3,549 42,588 3 3 19 21,000,523 56,515,624
28
Standardized
Canister Class 2
12 PWR STADs loaded at Rx (2025); 12 PWR WP
confirmed (2036); Repo open (2048); Pilot ISF (2026)
SCS
2.12.2025.1
2.2036 18,994 70 2,415 10 3,768 3,549 42,588 3 3 7 24,444,490 66,334,979
29
Standardized
Canister Class 2
21 PWR STADs loaded at Rx (2025); 21 PWR WP
confirmed (2036); Repo open (2048); Pilot ISF (2026)
SCS
2.21.2025.2
1.2036 12,264 33 2,415 6 6,014 3,549 42,588 3 3 4 17,657,205 45,563,874
30
Standardized
Canister Class 3
4 PWR STADs loaded at Rx (2025); 4 PWR WP
confirmed (2036); Repo open (2048); no ISF
SCS
3.4.2025.4.2
036 58,141 237 3,873 0 0 3,549 42,588 3 3 18 18,611,827 47,723,228
31
Standardized
Canister Class 3
4 PWR STADs loaded at Rx (2025); 12 PWR WP
selected (2036); Repo open (2048); no ISF
SCS
3.4.2025.12.
2036 28,378 85 3,873 0 0 3,549 42,588 3 3 6 20,609,851 53,209,960
32
Standardized
Canister Class 3
4 PWR STADs loaded at Rx (2025); 21 PWR WP
selected (2036); Repo open (2048); no ISF
SCS
3.4.2025.21.
2036 23,263 85 3,873 0 0 3,549 42,588 3 3 4 16,410,449 40,123,329
33
Standardized
Canister Class 3
4 PWR STADs loaded at Rx (2025); 37 PWR WP
selected (2036); Repo open (2048); no ISF
SCS
3.4.2025.37.
2036 19,347 85 3,873 0 0 0 0 0 0 0 13,063,975 30,051,813
34
Standardized
Canister Class 3
12 PWR STADs loaded at Rx (2025); 4 PWR WP
selected (2036); Repo open (2048); no ISF
SCS
3.12.2025.4.
2036 48,697 237 3,873 0 0 7,869 64,188 3 4 20 19,263,005 49,415,432
35
Standardized
Canister Class 3
12 PWR STADs loaded at Rx (2025); 12 PWR WP
confirmed (2036); Repo open (2048); no ISF
SCS
3.12.2025.1
2.2036 18,994 71 3,873 0 0 3,549 42,588 3 3 6 21,188,266 54,874,632
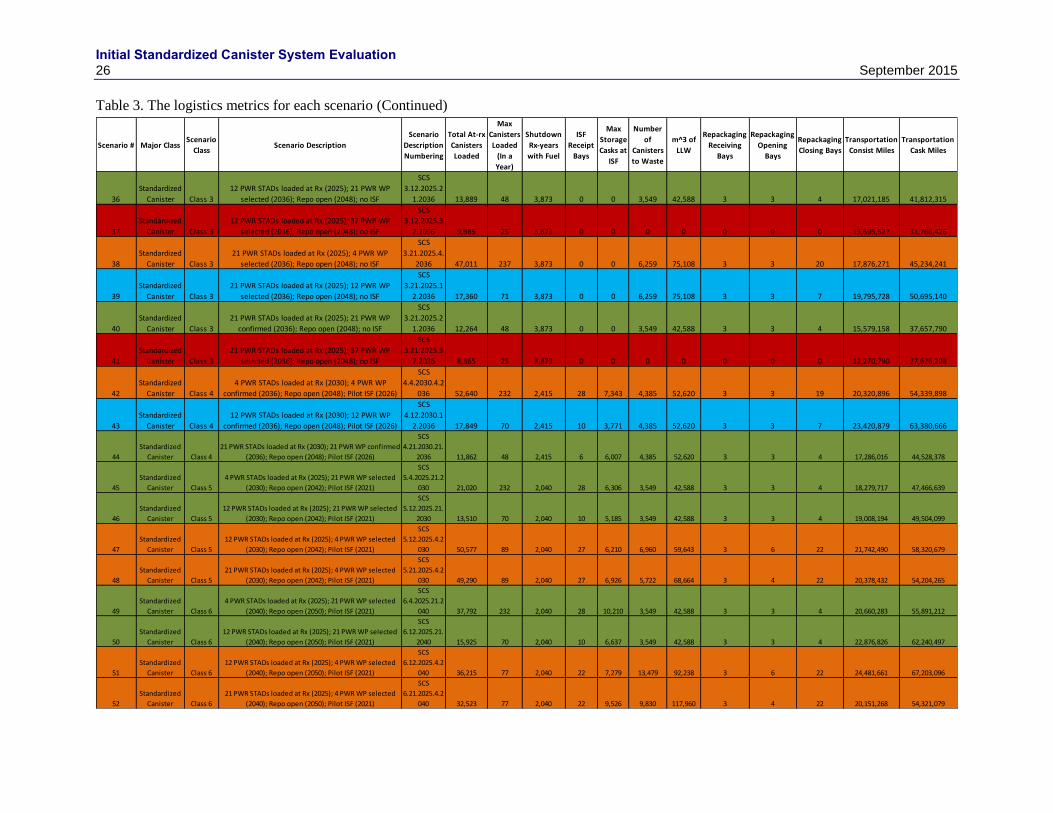
Initial Standardized Canister System Evaluation 26 September 2015
Table 3. The logistics metrics for each scenario (Continued)
Scenario # Major ClassScenario
ClassScenario Description
Scenario
Description
Numbering
Total At-rx
Canisters
Loaded
Max
Canisters
Loaded
(In a
Year)
Shutdown
Rx-years
with Fuel
ISF
Receipt
Bays
Max
Storage
Casks at
ISF
Number
of
Canisters
to Waste
m^3 of
LLW
Repackaging
Receiving
Bays
Repackaging
Opening
Bays
Repackaging
Closing Bays
Transportation
Consist Miles
Transportation
Cask Miles
36
Standardized
Canister Class 3
12 PWR STADs loaded at Rx (2025); 21 PWR WP
selected (2036); Repo open (2048); no ISF
SCS
3.12.2025.2
1.2036 13,889 48 3,873 0 0 3,549 42,588 3 3 4 17,021,185 41,812,315
37
Standardized
Canister Class 3
12 PWR STADs loaded at Rx (2025); 37 PWR WP
selected (2036); Repo open (2048); no ISF
SCS
3.12.2025.3
7.2036 9,985 25 3,873 0 0 0 0 0 0 0 13,695,527 31,768,426
38
Standardized
Canister Class 3
21 PWR STADs loaded at Rx (2025); 4 PWR WP
selected (2036); Repo open (2048); no ISF
SCS
3.21.2025.4.
2036 47,011 237 3,873 0 0 6,259 75,108 3 3 20 17,876,271 45,234,241
39
Standardized
Canister Class 3
21 PWR STADs loaded at Rx (2025); 12 PWR WP
selected (2036); Repo open (2048); no ISF
SCS
3.21.2025.1
2.2036 17,360 71 3,873 0 0 6,259 75,108 3 3 7 19,795,728 50,695,140
40
Standardized
Canister Class 3
21 PWR STADs loaded at Rx (2025); 21 PWR WP
confirmed (2036); Repo open (2048); no ISF
SCS
3.21.2025.2
1.2036 12,264 48 3,873 0 0 3,549 42,588 3 3 4 15,579,158 37,657,790
41
Standardized
Canister Class 3
21 PWR STADs loaded at Rx (2025); 37 PWR WP
selected (2036); Repo open (2048); no ISF
SCS
3.21.2025.3
7.2036 8,365 25 3,873 0 0 0 0 0 0 0 12,270,790 27,626,208
42
Standardized
Canister Class 4
4 PWR STADs loaded at Rx (2030); 4 PWR WP
confirmed (2036); Repo open (2048); Pilot ISF (2026)
SCS
4.4.2030.4.2
036 52,640 232 2,415 28 7,343 4,385 52,620 3 3 19 20,320,896 54,339,898
43
Standardized
Canister Class 4
12 PWR STADs loaded at Rx (2030); 12 PWR WP
confirmed (2036); Repo open (2048); Pilot ISF (2026)
SCS
4.12.2030.1
2.2036 17,849 70 2,415 10 3,771 4,385 52,620 3 3 7 23,420,879 63,380,666
44
Standardized
Canister Class 4
21 PWR STADs loaded at Rx (2030); 21 PWR WP confirmed
(2036); Repo open (2048); Pilot ISF (2026)
SCS
4.21.2030.21.
2036 11,862 48 2,415 6 6,007 4,385 52,620 3 3 4 17,286,016 44,528,378
45
Standardized
Canister Class 5
4 PWR STADs loaded at Rx (2025); 21 PWR WP selected
(2030); Repo open (2042); Pilot ISF (2021)
SCS
5.4.2025.21.2
030 21,020 232 2,040 28 6,306 3,549 42,588 3 3 4 18,279,717 47,466,639
46
Standardized
Canister Class 5
12 PWR STADs loaded at Rx (2025); 21 PWR WP selected
(2030); Repo open (2042); Pilot ISF (2021)
SCS
5.12.2025.21.
2030 13,510 70 2,040 10 5,185 3,549 42,588 3 3 4 19,008,194 49,504,099
47
Standardized
Canister Class 5
12 PWR STADs loaded at Rx (2025); 4 PWR WP selected
(2030); Repo open (2042); Pilot ISF (2021)
SCS
5.12.2025.4.2
030 50,577 89 2,040 27 6,210 6,960 59,643 3 6 22 21,742,490 58,320,679
48
Standardized
Canister Class 5
21 PWR STADs loaded at Rx (2025); 4 PWR WP selected
(2030); Repo open (2042); Pilot ISF (2021)
SCS
5.21.2025.4.2
030 49,290 89 2,040 27 6,926 5,722 68,664 3 4 22 20,378,432 54,204,265
49
Standardized
Canister Class 6
4 PWR STADs loaded at Rx (2025); 21 PWR WP selected
(2040); Repo open (2050); Pilot ISF (2021)
SCS
6.4.2025.21.2
040 37,792 232 2,040 28 10,210 3,549 42,588 3 3 4 20,660,283 55,891,212
50
Standardized
Canister Class 6
12 PWR STADs loaded at Rx (2025); 21 PWR WP selected
(2040); Repo open (2050); Pilot ISF (2021)
SCS
6.12.2025.21.
2040 15,925 70 2,040 10 6,637 3,549 42,588 3 3 4 22,876,826 62,240,497
51
Standardized
Canister Class 6
12 PWR STADs loaded at Rx (2025); 4 PWR WP selected
(2040); Repo open (2050); Pilot ISF (2021)
SCS
6.12.2025.4.2
040 36,215 77 2,040 22 7,279 13,479 92,238 3 6 22 24,481,661 67,203,096
52
Standardized
Canister Class 6
21 PWR STADs loaded at Rx (2025); 4 PWR WP selected
(2040); Repo open (2050); Pilot ISF (2021)
SCS
6.21.2025.4.2
040 32,523 77 2,040 22 9,526 9,830 117,960 3 4 22 20,151,268 54,321,079

Initial Standardized Canister System Evaluation September 2015 27
Table 4. A description of each column in Table 2 and Table 3.
Scenario # The scenario number (1–52) as described in Section 4
Major Class The major class of the scenario that is either “status quo” or
“standardized canister”—as described in Section 4
Scenario Class The scenario class, including the common assumptions described in
Section 4
Scenario Description A brief description of a scenario containing the initial standardized
canister loading strategy, the initial standardized canister system
procurement date, the WP canisters, and the date when the WP size will
be known
Scenario Description
Number
Shorthand information in alpha-numeric form about the scenario,
including the initial standardized canister loading strategy, the initial
standardized canister system procurement date, the WP canisters, and the
date when the WP size will be known
At-reactor Capital Cost The capital costs at all reactors, including the cost to purchase
standardized canisters, DPCs, and associated storage overpacks, as well
as costs associated with building additional independent spent fuel
storage installations (ISFSIs) after 2020
At-reactor Other Costs Operational costs at the reactor, including ISFSI maintenance and
monitoring costs, as well as loading/unloading costs (i.e., [1] loading
from a pool into dry storage, [2] loading directly into a canister/cask for
off-site shipment from a pool, and [3] loading from dry storage for
off-site shipment)
ISF Cask/Pad Cost The cask/pad costs at an ISF, including storage overpacks and associated
concrete pad costs
ISF Other Costs Other ISF costs, including cask/canister handling bays,
loading/unloading, and other operational costs
WP/LLW Costs The cost of disposing of the LLW generated from various equipment and
canisters, as well as the cost to purchase WP-compatible canisters
Other Repackaging Costs All other costs associated with repackaging, such as cutting, loading,
unloading, etc.
Fleet/Capital
Transportation Costs
Costs accumulated during the purchase of the cask, the buffer, and the
escort railcars, as well as cask trailers, escort trucks, and transportation
overpacks
Other Transportation Costs The costs associated with transportation other than the fleet and capital
transportation cost, specifically the operational and maintenance costs
Total At-Rx Canisters
Loaded
The sum of all the canisters loaded at reactors

Initial Standardized Canister System Evaluation 28 September 2015
Max Canisters Loaded in a
Year
The maximum number of canisters loaded at a single operating reactor
site in a given year
Shutdown Rx-Years with
SNF
The cumulative number of years that any reactor has SNF on site post-
shutdown
ISF Cask/Canister
Handling Bays
The required number of bays at the ISF for receiving and shipping casks
Max Storage Casks at ISF The maximum number of casks in storage at the ISF at any time
Number of Canisters to
Waste
The number of canisters that must be disposed of as waste due to
repackaging
m^3 of LLW Cubic meters of the LLW generated by repackaging used DPCs and
standardized canisters that cannot be used for disposal
Repackaging Receiving
Bays
Number of bays needed at the repackaging facility to receive the
incoming casks
Repackaging Opening
Bays
Number of bays needed at the repackaging facility to open the received
canisters
Repackaging Closing Bays Number of bays needed at the repackaging facility to close the WP-
compatible canisters
Transportation Consist
Miles
The sum of the total distance all consists travel. A consist may include
multiple cask cars, multiple buffer cars, and multiple locomotives, along
with other cars
Transportation Cask Miles The sum of the total distance that all casks travel

Initial Standardized Canister System Evaluation September 2015 29
Table 5. Reference table for each scenario and its assumptions.21
21 As mentioned in Section 3.1.6, if the 37 PWR standardized canister is assumed to be disposable, all DPCs are also assumed to be disposable.
Class CodeOnly
DPC
DPC
to
2024
DPC
to
2029
DPC
to
2035
Standardized
Canister
2025 - 2035
Standardized
Canister
2025 - 2029
Standardized
Canister
2025 - 2039
Standardized
Canister
2030 - 2035
WP
2030+
WP
2036+
WP
2040+None
2021
to
2025
2026
to
2030
2025+ 2030+ 2042 2048 2052 4 PWR 12 PWR 21 PWR4
PWR
12
PWR
21
PWR
37
PWRDPC
SQ1.a x x x x
SQ1.b x x x x
SQ1.c x x x x
SQ1.d x x x x
SQ2.a x x x x x
SQ2.b x x x x x
SQ2.c x x x x x
SQ2.d x x x x x
SQ3.a x x x x x
SQ3.b x x x x x
SQ3.c x x x x x
SQ4.a x x x x x x
SQ4.b x x x x x x
SQ4.c x x x x x x
SCS 1.4.2025.4.2036 x x x x x x x x
SCS 1.4.2025.12.2036 x x x x x x x x
SCS 1.4.2025.21.2036 x x x x x x x x
SCS 1.4.2025.37.2036 x x x x x x x x x
SCS 1.12.2025.4.2036 x x x x x x x x
SCS 1.12.2025.12.2036 x x x x x x x x
SCS 1.12.2025.21.2036 x x x x x x x x
SCS 1.12.2025.37.2036 x x x x x x x x x
SCS 1.21.2025.4.2036 x x x x x x x x
SCS 1.21.2025.12.2036 x x x x x x x x
SCS 1.21.2025.21.2036 x x x x x x x x
SCS 1.21.2025.37.2036 x x x x x x x x x
SCS 2.4.2025.4.2036 x x x x x x x x
SCS 2.12.202512.2036 x x x x x x x x
SCS 2.21.2025.21.2036 x x x x x x x x
SCS 3.4.2025.4.2036 x x x x x x x
SCS 3.4.2025.12.2036 x x x x x x x
SCS 3.4.2025.21.2036 x x x x x x x
SCS 3.4.2025.37.2036 x x x x x x x x
SCS 3.12.2025.4.2036 x x x x x x x
SCS 3.12.2025.12.2036 x x x x x x x
SCS 3.12.2025.21.2036 x x x x x x x
SCS 3.12.2025.37.2036 x x x x x x x x
SCS 3.21.2025.4.2036 x x x x x x x
SCS 3.21.2025.12.2036 x x x x x x x
SCS 3.21.2025.21.2036 x x x x x x x
SCS 3.21.2025.37.2036 x x x x x x x x
SC Class 2
SC Class 3
SQ Class 1
SQ Class 2
SQ Class 3
SQ Class 4
SC Class 1
Waste Package SizeAt-reactor
Pilot Interim Storage
Facilty
Interim Storage
Facilty Repository
Initial Standardization
Canister Size
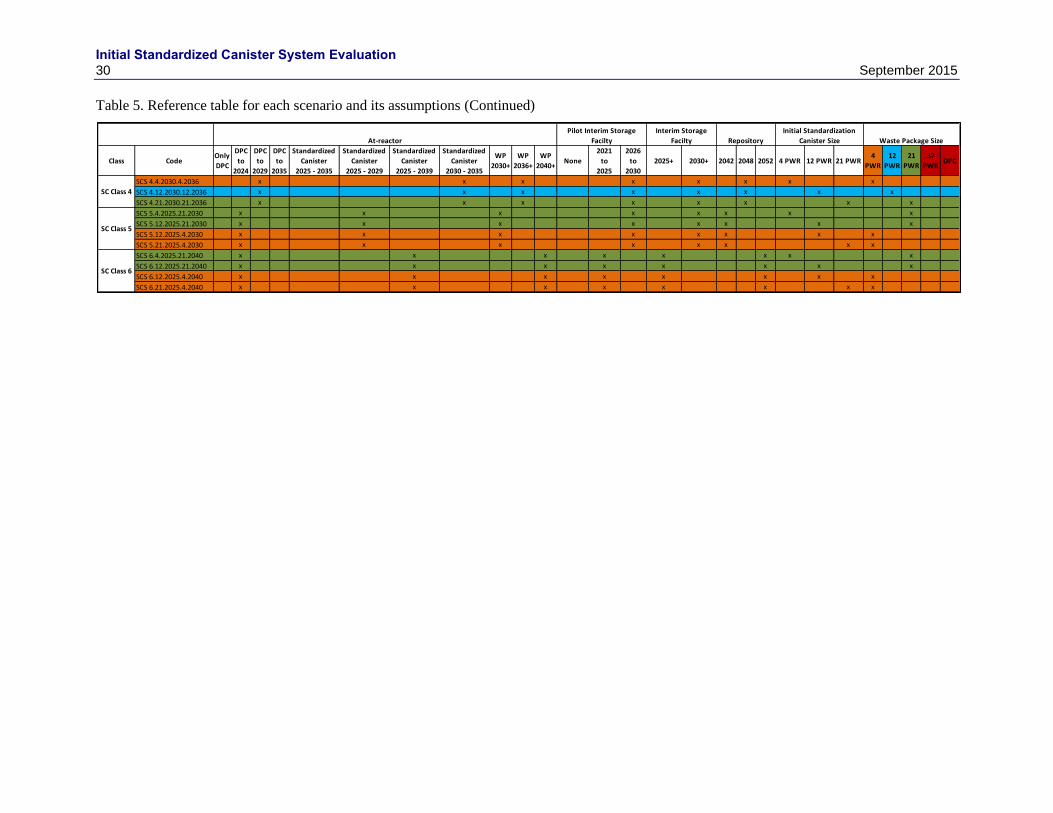
Initial Standardized Canister System Evaluation 30 September 2015
Table 5. Reference table for each scenario and its assumptions (Continued)
Class CodeOnly
DPC
DPC
to
2024
DPC
to
2029
DPC
to
2035
Standardized
Canister
2025 - 2035
Standardized
Canister
2025 - 2029
Standardized
Canister
2025 - 2039
Standardized
Canister
2030 - 2035
WP
2030+
WP
2036+
WP
2040+None
2021
to
2025
2026
to
2030
2025+ 2030+ 2042 2048 2052 4 PWR 12 PWR 21 PWR4
PWR
12
PWR
21
PWR
37
PWRDPC
SCS 4.4.2030.4.2036 x x x x x x x x
SCS 4.12.2030.12.2036 x x x x x x x x
SCS 4.21.2030.21.2036 x x x x x x x x
SCS 5.4.2025.21.2030 x x x x x x x x
SCS 5.12.2025.21.2030 x x x x x x x x
SCS 5.12.2025.4.2030 x x x x x x x x
SCS 5.21.2025.4.2030 x x x x x x x x
SCS 6.4.2025.21.2040 x x x x x x x x
SCS 6.12.2025.21.2040 x x x x x x x x
SCS 6.12.2025.4.2040 x x x x x x x x
SCS 6.21.2025.4.2040 x x x x x x x x
SC Class 4
SC Class 5
SC Class 6
Waste Package SizeAt-reactor
Pilot Interim Storage
Facilty
Interim Storage
Facilty Repository
Initial Standardization
Canister Size
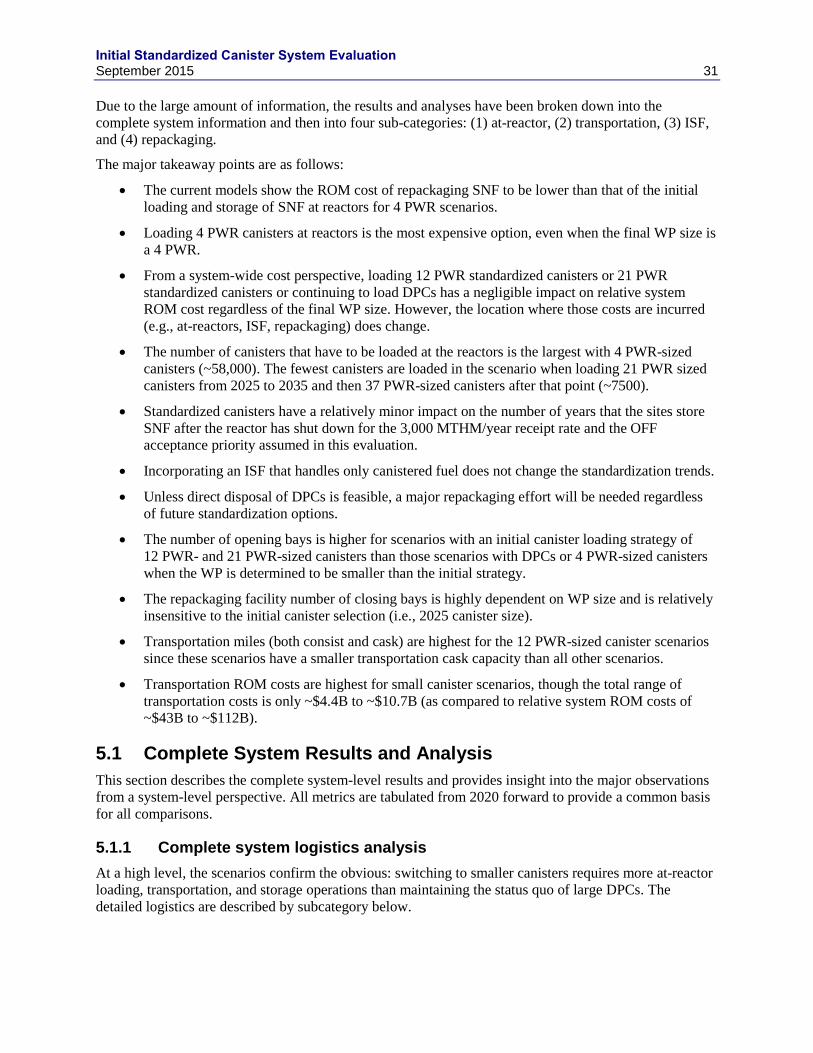
Initial Standardized Canister System Evaluation September 2015 31
Due to the large amount of information, the results and analyses have been broken down into the
complete system information and then into four sub-categories: (1) at-reactor, (2) transportation, (3) ISF,
and (4) repackaging.
The major takeaway points are as follows:
The current models show the ROM cost of repackaging SNF to be lower than that of the initial
loading and storage of SNF at reactors for 4 PWR scenarios.
Loading 4 PWR canisters at reactors is the most expensive option, even when the final WP size is
a 4 PWR.
From a system-wide cost perspective, loading 12 PWR standardized canisters or 21 PWR
standardized canisters or continuing to load DPCs has a negligible impact on relative system
ROM cost regardless of the final WP size. However, the location where those costs are incurred
(e.g., at-reactors, ISF, repackaging) does change.
The number of canisters that have to be loaded at the reactors is the largest with 4 PWR-sized
canisters (~58,000). The fewest canisters are loaded in the scenario when loading 21 PWR sized
canisters from 2025 to 2035 and then 37 PWR-sized canisters after that point (~7500).
Standardized canisters have a relatively minor impact on the number of years that the sites store
SNF after the reactor has shut down for the 3,000 MTHM/year receipt rate and the OFF
acceptance priority assumed in this evaluation.
Incorporating an ISF that handles only canistered fuel does not change the standardization trends.
Unless direct disposal of DPCs is feasible, a major repackaging effort will be needed regardless
of future standardization options.
The number of opening bays is higher for scenarios with an initial canister loading strategy of
12 PWR- and 21 PWR-sized canisters than those scenarios with DPCs or 4 PWR-sized canisters
when the WP is determined to be smaller than the initial strategy.
The repackaging facility number of closing bays is highly dependent on WP size and is relatively
insensitive to the initial canister selection (i.e., 2025 canister size).
Transportation miles (both consist and cask) are highest for the 12 PWR-sized canister scenarios
since these scenarios have a smaller transportation cask capacity than all other scenarios.
Transportation ROM costs are highest for small canister scenarios, though the total range of
transportation costs is only ~$4.4B to ~$10.7B (as compared to relative system ROM costs of
~$43B to ~$112B).
5.1 Complete System Results and Analysis
This section describes the complete system-level results and provides insight into the major observations
from a system-level perspective. All metrics are tabulated from 2020 forward to provide a common basis
for all comparisons.
5.1.1 Complete system logistics analysis
At a high level, the scenarios confirm the obvious: switching to smaller canisters requires more at-reactor
loading, transportation, and storage operations than maintaining the status quo of large DPCs. The
detailed logistics are described by subcategory below.
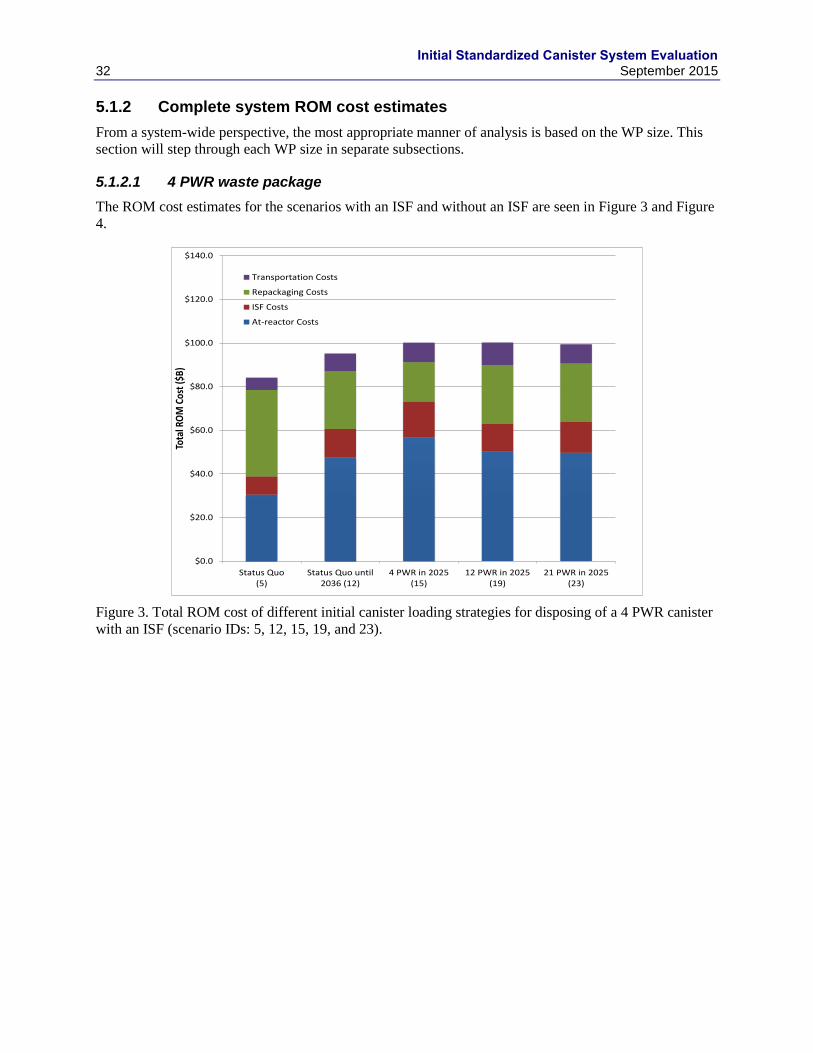
Initial Standardized Canister System Evaluation 32 September 2015
5.1.2 Complete system ROM cost estimates
From a system-wide perspective, the most appropriate manner of analysis is based on the WP size. This
section will step through each WP size in separate subsections.
5.1.2.1 4 PWR waste package
The ROM cost estimates for the scenarios with an ISF and without an ISF are seen in Figure 3 and Figure
4.
Figure 3. Total ROM cost of different initial canister loading strategies for disposing of a 4 PWR canister
with an ISF (scenario IDs: 5, 12, 15, 19, and 23).
$0.0
$20.0
$40.0
$60.0
$80.0
$100.0
$120.0
$140.0
Status Quo(5)
Status Quo until2036 (12)
4 PWR in 2025(15)
12 PWR in 2025(19)
21 PWR in 2025(23)
Tota
l RO
M C
ost (
$B)
Transportation Costs
Repackaging Costs
ISF Costs
At-reactor Costs
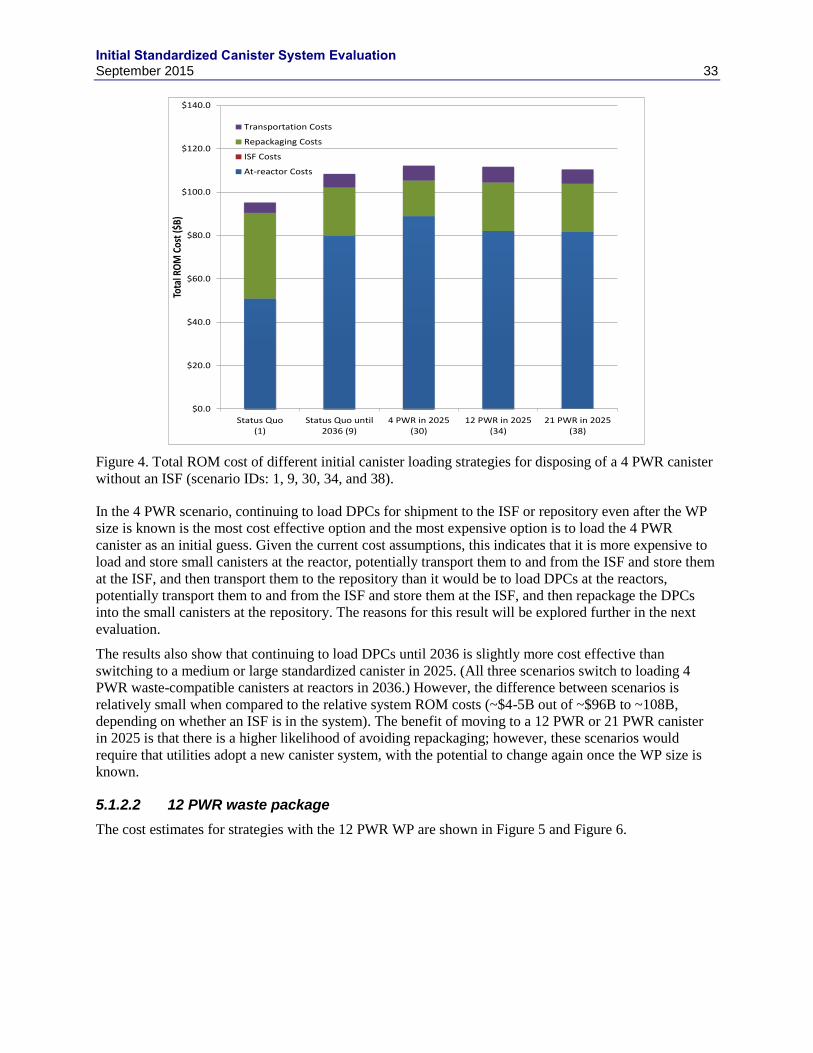
Initial Standardized Canister System Evaluation September 2015 33
Figure 4. Total ROM cost of different initial canister loading strategies for disposing of a 4 PWR canister
without an ISF (scenario IDs: 1, 9, 30, 34, and 38).
In the 4 PWR scenario, continuing to load DPCs for shipment to the ISF or repository even after the WP
size is known is the most cost effective option and the most expensive option is to load the 4 PWR
canister as an initial guess. Given the current cost assumptions, this indicates that it is more expensive to
load and store small canisters at the reactor, potentially transport them to and from the ISF and store them
at the ISF, and then transport them to the repository than it would be to load DPCs at the reactors,
potentially transport them to and from the ISF and store them at the ISF, and then repackage the DPCs
into the small canisters at the repository. The reasons for this result will be explored further in the next
evaluation.
The results also show that continuing to load DPCs until 2036 is slightly more cost effective than
switching to a medium or large standardized canister in 2025. (All three scenarios switch to loading 4
PWR waste-compatible canisters at reactors in 2036.) However, the difference between scenarios is
relatively small when compared to the relative system ROM costs (~$4-5B out of ~$96B to ~108B,
depending on whether an ISF is in the system). The benefit of moving to a 12 PWR or 21 PWR canister
in 2025 is that there is a higher likelihood of avoiding repackaging; however, these scenarios would
require that utilities adopt a new canister system, with the potential to change again once the WP size is
known.
5.1.2.2 12 PWR waste package
The cost estimates for strategies with the 12 PWR WP are shown in Figure 5 and Figure 6.
$0.0
$20.0
$40.0
$60.0
$80.0
$100.0
$120.0
$140.0
Status Quo(1)
Status Quo until2036 (9)
4 PWR in 2025(30)
12 PWR in 2025(34)
21 PWR in 2025(38)
Tota
l RO
M C
ost (
$B)
Transportation Costs
Repackaging Costs
ISF Costs
At-reactor Costs
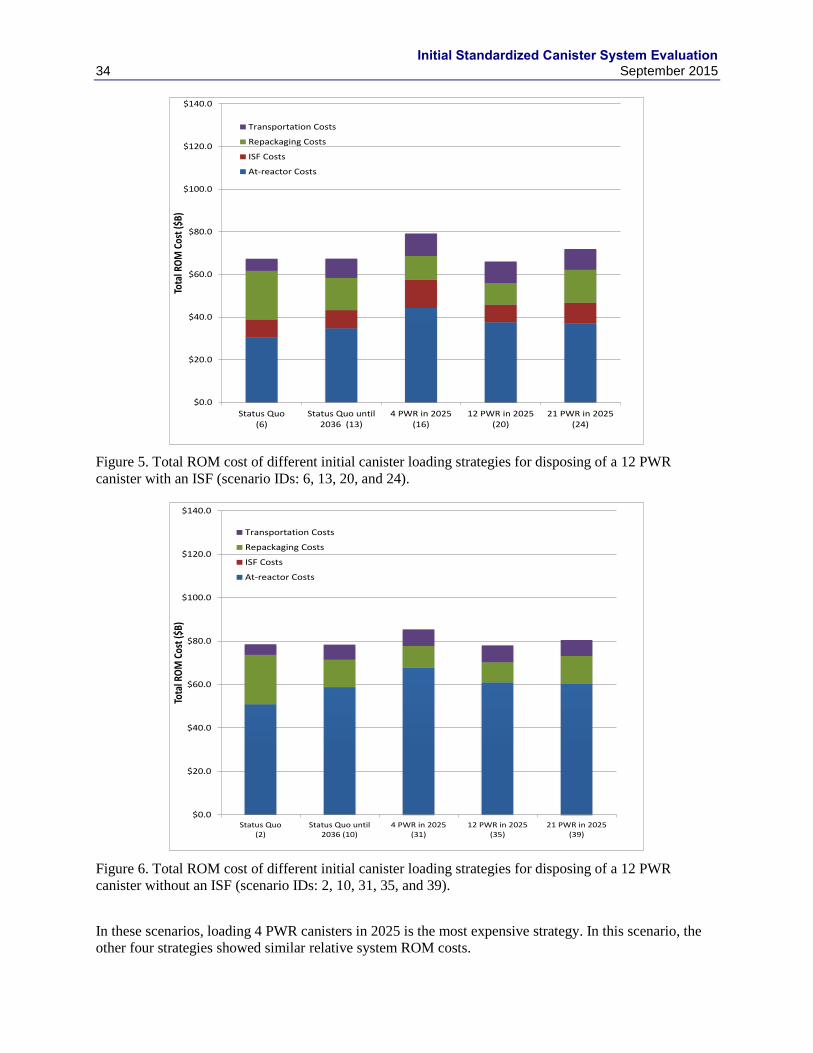
Initial Standardized Canister System Evaluation 34 September 2015
Figure 5. Total ROM cost of different initial canister loading strategies for disposing of a 12 PWR
canister with an ISF (scenario IDs: 6, 13, 20, and 24).
Figure 6. Total ROM cost of different initial canister loading strategies for disposing of a 12 PWR
canister without an ISF (scenario IDs: 2, 10, 31, 35, and 39).
In these scenarios, loading 4 PWR canisters in 2025 is the most expensive strategy. In this scenario, the
other four strategies showed similar relative system ROM costs.
$0.0
$20.0
$40.0
$60.0
$80.0
$100.0
$120.0
$140.0
Status Quo(6)
Status Quo until2036 (13)
4 PWR in 2025(16)
12 PWR in 2025(20)
21 PWR in 2025(24)
Tota
l RO
M C
ost (
$B)
Transportation Costs
Repackaging Costs
ISF Costs
At-reactor Costs
$0.0
$20.0
$40.0
$60.0
$80.0
$100.0
$120.0
$140.0
Status Quo(2)
Status Quo until2036 (10)
4 PWR in 2025(31)
12 PWR in 2025(35)
21 PWR in 2025(39)
Tota
l RO
M C
ost (
$B)
Transportation Costs
Repackaging Costs
ISF Costs
At-reactor Costs
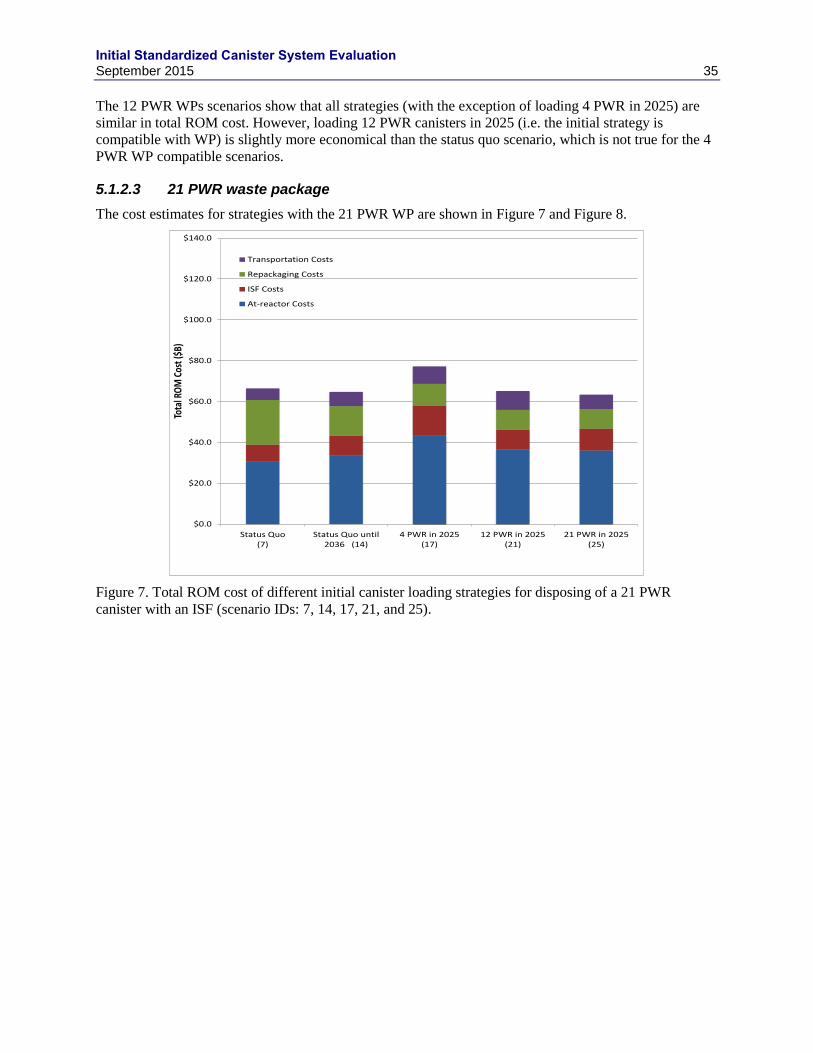
Initial Standardized Canister System Evaluation September 2015 35
The 12 PWR WPs scenarios show that all strategies (with the exception of loading 4 PWR in 2025) are
similar in total ROM cost. However, loading 12 PWR canisters in 2025 (i.e. the initial strategy is
compatible with WP) is slightly more economical than the status quo scenario, which is not true for the 4
PWR WP compatible scenarios.
5.1.2.3 21 PWR waste package
The cost estimates for strategies with the 21 PWR WP are shown in Figure 7 and Figure 8.
Figure 7. Total ROM cost of different initial canister loading strategies for disposing of a 21 PWR
canister with an ISF (scenario IDs: 7, 14, 17, 21, and 25).
$0.0
$20.0
$40.0
$60.0
$80.0
$100.0
$120.0
$140.0
Status Quo(7)
Status Quo until2036 (14)
4 PWR in 2025(17)
12 PWR in 2025(21)
21 PWR in 2025(25)
Tota
l RO
M C
ost (
$B)
Transportation Costs
Repackaging Costs
ISF Costs
At-reactor Costs

Initial Standardized Canister System Evaluation 36 September 2015
Figure 8. Total ROM cost of different initial canister loading strategies for disposing of a 21 PWR
canister without an ISF (scenario IDs: 3, 11, 32, 36, and 40).
The figures illustrates that the 12 PWR, 21 PWR, and status quo with changing to the 21 PWR WP-
compatible canister in 2036 are fairly equivalent from a relative system ROM cost perspective. Again the
12 PWR scenario would have the most flexibility, but the status quo scenario that changes to a 21 PWR
WP-compatible canister in 2036 would also be an attractive option.
5.1.2.4 37 PWR waste package (all DPCs are disposable)
In this scenario, maintaining the status quo, loading 12 PWR canisters, and loading 21 PWR canisters are
fairly equivalent from a ROM cost perspective, as illustrated in Figure 9 and Figure 10.
$0.0
$20.0
$40.0
$60.0
$80.0
$100.0
$120.0
$140.0
Status Quo(3)
Status Quo until2036 (11)
4 PWR in 2025(32)
12 PWR in 2025(36)
21 PWR in 2025(40)
Tota
l RO
M C
ost (
$B)
Transportation Costs
Repackaging Costs
ISF Costs
At-reactor Costs
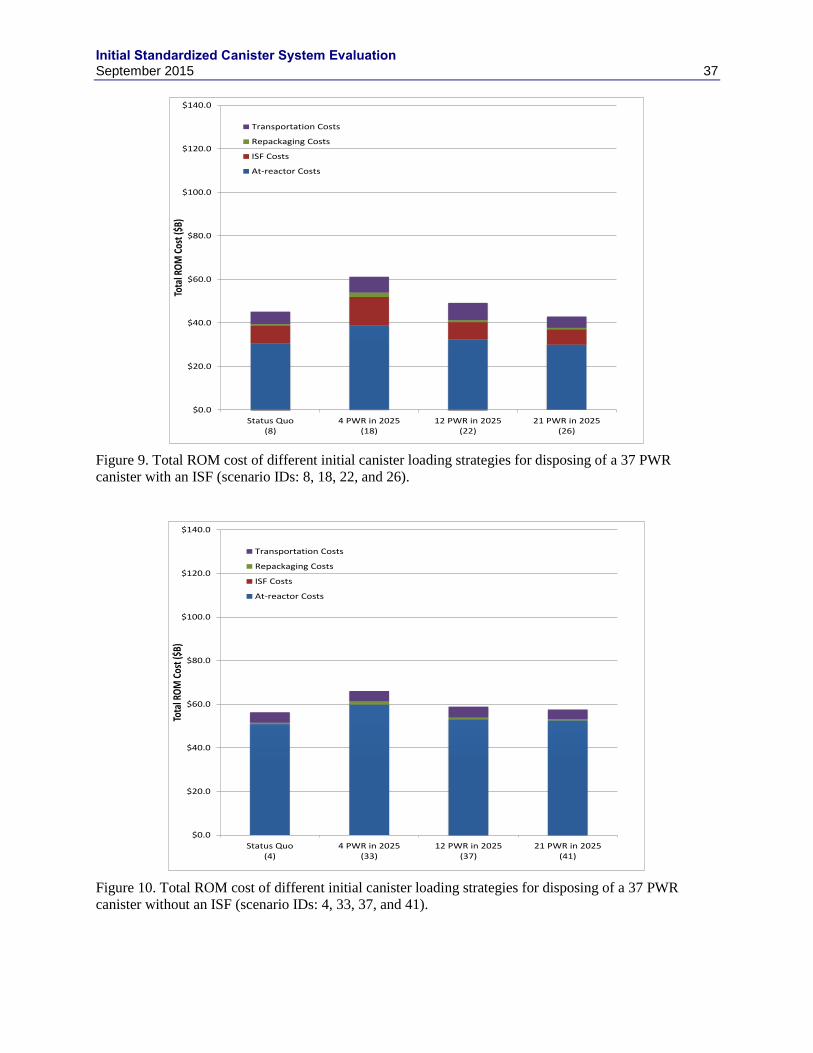
Initial Standardized Canister System Evaluation September 2015 37
Figure 9. Total ROM cost of different initial canister loading strategies for disposing of a 37 PWR
canister with an ISF (scenario IDs: 8, 18, 22, and 26).
Figure 10. Total ROM cost of different initial canister loading strategies for disposing of a 37 PWR
canister without an ISF (scenario IDs: 4, 33, 37, and 41).
$0.0
$20.0
$40.0
$60.0
$80.0
$100.0
$120.0
$140.0
Status Quo(8)
4 PWR in 2025(18)
12 PWR in 2025(22)
21 PWR in 2025(26)
Tota
l RO
M C
ost (
$B)
Transportation Costs
Repackaging Costs
ISF Costs
At-reactor Costs
$0.0
$20.0
$40.0
$60.0
$80.0
$100.0
$120.0
$140.0
Status Quo(4)
4 PWR in 2025(33)
12 PWR in 2025(37)
21 PWR in 2025(41)
Tota
l RO
M C
ost (
$B)
Transportation Costs
Repackaging Costs
ISF Costs
At-reactor Costs
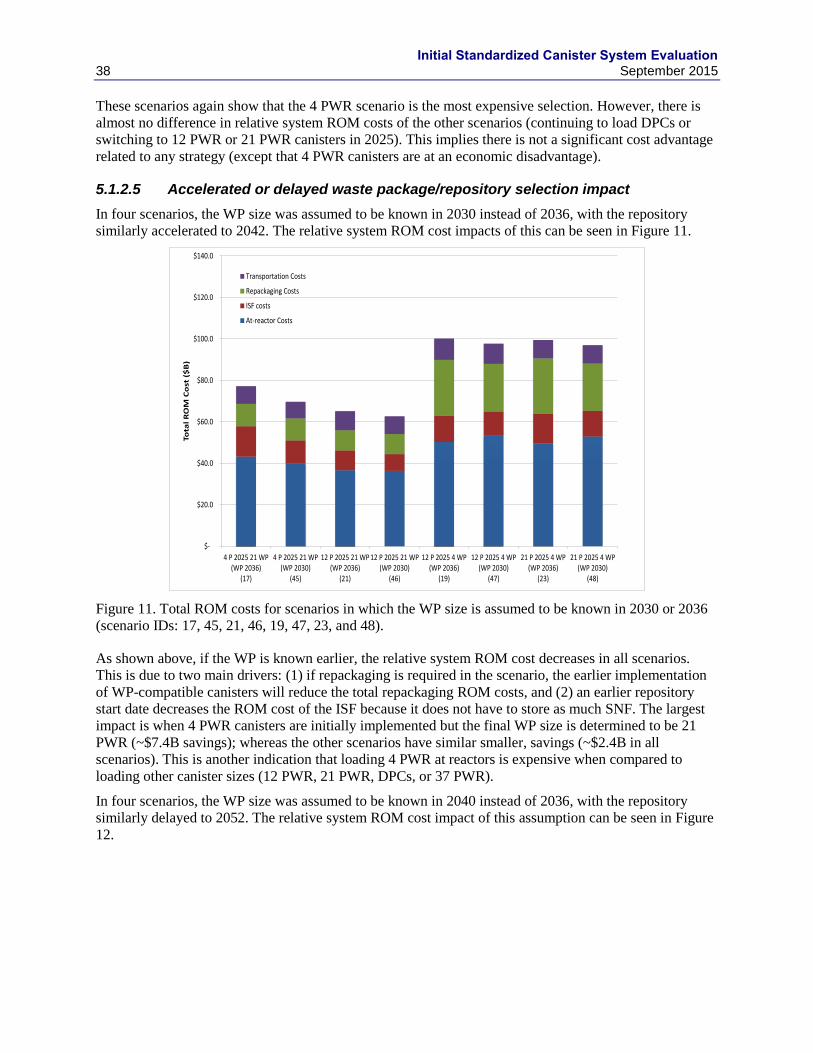
Initial Standardized Canister System Evaluation 38 September 2015
These scenarios again show that the 4 PWR scenario is the most expensive selection. However, there is
almost no difference in relative system ROM costs of the other scenarios (continuing to load DPCs or
switching to 12 PWR or 21 PWR canisters in 2025). This implies there is not a significant cost advantage
related to any strategy (except that 4 PWR canisters are at an economic disadvantage).
5.1.2.5 Accelerated or delayed waste package/repository selection impact
In four scenarios, the WP size was assumed to be known in 2030 instead of 2036, with the repository
similarly accelerated to 2042. The relative system ROM cost impacts of this can be seen in Figure 11.
Figure 11. Total ROM costs for scenarios in which the WP size is assumed to be known in 2030 or 2036
(scenario IDs: 17, 45, 21, 46, 19, 47, 23, and 48).
As shown above, if the WP is known earlier, the relative system ROM cost decreases in all scenarios.
This is due to two main drivers: (1) if repackaging is required in the scenario, the earlier implementation
of WP-compatible canisters will reduce the total repackaging ROM costs, and (2) an earlier repository
start date decreases the ROM cost of the ISF because it does not have to store as much SNF. The largest
impact is when 4 PWR canisters are initially implemented but the final WP size is determined to be 21
PWR (~$7.4B savings); whereas the other scenarios have similar smaller, savings (~$2.4B in all
scenarios). This is another indication that loading 4 PWR at reactors is expensive when compared to
loading other canister sizes (12 PWR, 21 PWR, DPCs, or 37 PWR).
In four scenarios, the WP size was assumed to be known in 2040 instead of 2036, with the repository
similarly delayed to 2052. The relative system ROM cost impact of this assumption can be seen in Figure
12.
$-
$20.0
$40.0
$60.0
$80.0
$100.0
$120.0
$140.0
4 P 2025 21 WP(WP 2036)
(17)
4 P 2025 21 WP(WP 2030)
(45)
12 P 2025 21 WP(WP 2036)
(21)
12 P 2025 21 WP(WP 2030)
(46)
12 P 2025 4 WP(WP 2036)
(19)
12 P 2025 4 WP(WP 2030)
(47)
21 P 2025 4 WP(WP 2036)
(23)
21 P 2025 4 WP(WP 2030)
(48)
To
tal
RO
M C
ost
($
B)
Transportation Costs
Repackaging Costs
ISF costs
At-reactor Costs

Initial Standardized Canister System Evaluation September 2015 39
Figure 12. Total ROM costs for scenarios in which the WP size is assumed to be known in 2036 or 2040
(scenario IDs: 17, 49, 21, 50, 19, 51, 23, and 52).
As shown above, if the WP is known later, the relative system ROM cost increases in all scenarios.
Similar to the accelerated repository scenarios, this is due to two main drivers: (1) if repackaging is
required in the scenario, the later implementation of WP-compatible canisters will increase the total
repackaging ROM costs, and (2) a later repository start date increases the ROM cost of the ISF because it
has to store more SNF. However, because this evaluation shows that it is more expensive to load small, 4
PWR canisters, the delay in loading small canisters, even if they were the appropriate WP size, actually
decreases at-reactor ROM costs for the scenarios that begin with larger canister sizes. The largest impact
is when 4 PWR canisters are initially implemented and the final WP is larger (~$6.2B increase); whereas
the other scenarios have negligible impacts (~$0.6–1.7B).
5.2 At-reactor Results and Analysis
The at-reactor results are broken down into the logistics analysis and the ROM cost estimates.
5.2.1 At-reactor logistics analysis
5.2.1.1 Total canisters loaded at reactors
One of the objectives of the larger standardization assessment is to quantify the impacts of standardized
canister systems on nuclear power plant operations. The specific metric that will be studied is the number
of heavy-load-handling operations. As part of this evaluation, this is assumed to be directly proportional
to the total number of canisters loaded at reactors. If future advanced/innovative operational concepts are
developed in regards to different sized canisters, this metric will need to be updated accordingly.
As expected, the scenarios that involve loading 4 PWR canisters either initially (2025 or 2030) or once
the WP size is known have the most canisters loaded. The maximum number of canisters loaded at
reactors is 58,141 in scenario 15. In this scenario, 4 PWR canisters are loaded initially, the ISF start date
is delayed until 2030, and 4 PWR waste-compatible canisters are loaded in 2036. Interestingly, because a
$-
$20.0
$40.0
$60.0
$80.0
$100.0
$120.0
$140.0
4 P 2025 21 WP(WP 2036)
(17)
4 P 2025 21 WP(WP 2040)
(49)
12 P 2025 21WP (WP 2036)
(21)
12 P 2025 21WP (WP 2040)
(50)
12 P 2025 4 WP(WP 2036)
(19)
12 P 2025 4 WP(WP 2040)
(51)
21 P 2025 4 WP(WP 2036)
(23)
21 P 2025 4 WP(WP 2040)
(52)
Tota
l R
OM
Co
st (
$B
)
Transportation Costs
Repackaging Costs
ISF costs
At-reactor Costs
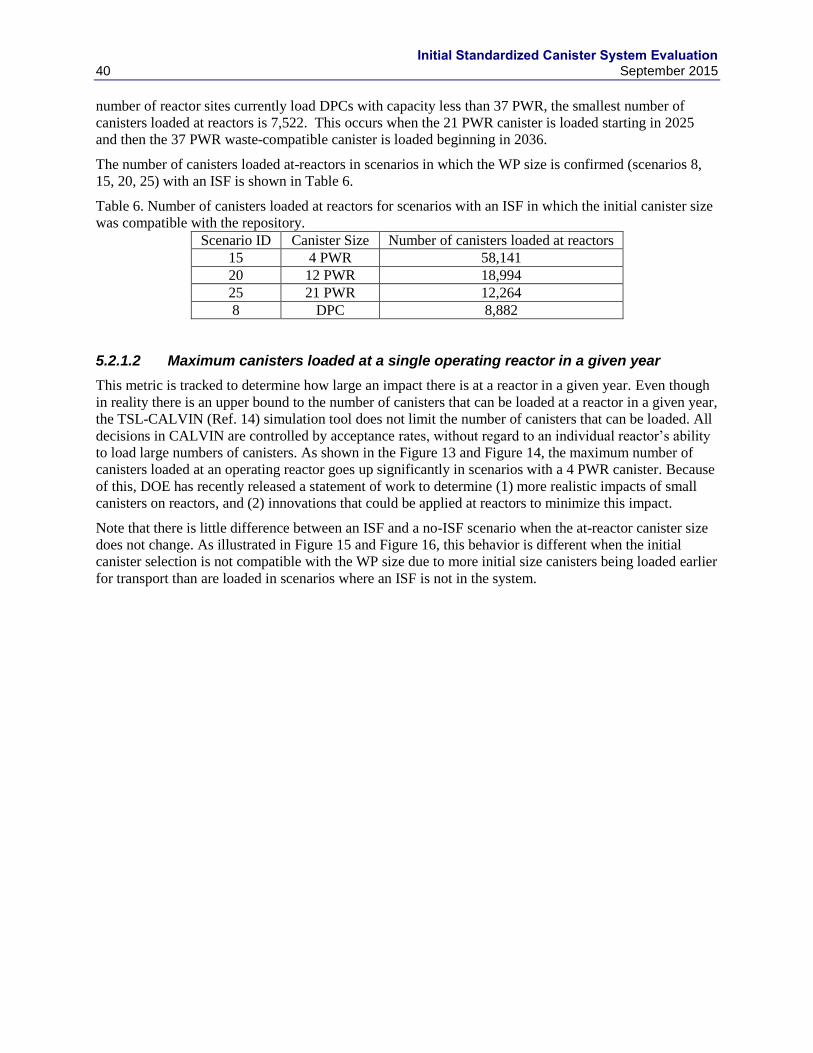
Initial Standardized Canister System Evaluation 40 September 2015
number of reactor sites currently load DPCs with capacity less than 37 PWR, the smallest number of
canisters loaded at reactors is 7,522. This occurs when the 21 PWR canister is loaded starting in 2025
and then the 37 PWR waste-compatible canister is loaded beginning in 2036.
The number of canisters loaded at-reactors in scenarios in which the WP size is confirmed (scenarios 8,
15, 20, 25) with an ISF is shown in Table 6.
Table 6. Number of canisters loaded at reactors for scenarios with an ISF in which the initial canister size
was compatible with the repository.
Scenario ID Canister Size Number of canisters loaded at reactors
15 4 PWR 58,141
20 12 PWR 18,994
25 21 PWR 12,264
8 DPC 8,882
5.2.1.2 Maximum canisters loaded at a single operating reactor in a given year
This metric is tracked to determine how large an impact there is at a reactor in a given year. Even though
in reality there is an upper bound to the number of canisters that can be loaded at a reactor in a given year,
the TSL-CALVIN (Ref. 14) simulation tool does not limit the number of canisters that can be loaded. All
decisions in CALVIN are controlled by acceptance rates, without regard to an individual reactor’s ability
to load large numbers of canisters. As shown in the Figure 13 and Figure 14, the maximum number of
canisters loaded at an operating reactor goes up significantly in scenarios with a 4 PWR canister. Because
of this, DOE has recently released a statement of work to determine (1) more realistic impacts of small
canisters on reactors, and (2) innovations that could be applied at reactors to minimize this impact.
Note that there is little difference between an ISF and a no-ISF scenario when the at-reactor canister size
does not change. As illustrated in Figure 15 and Figure 16, this behavior is different when the initial
canister selection is not compatible with the WP size due to more initial size canisters being loaded earlier
for transport than are loaded in scenarios where an ISF is not in the system.
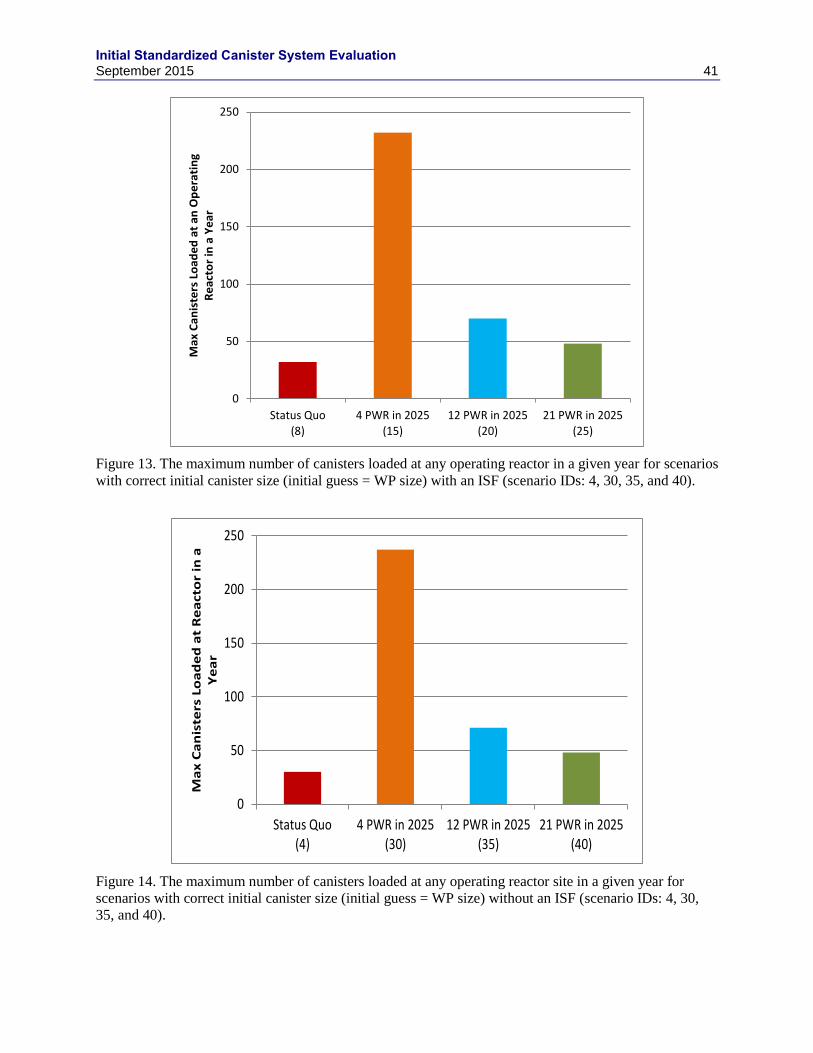
Initial Standardized Canister System Evaluation September 2015 41
Figure 13. The maximum number of canisters loaded at any operating reactor in a given year for scenarios
with correct initial canister size (initial guess = WP size) with an ISF (scenario IDs: 4, 30, 35, and 40).
Figure 14. The maximum number of canisters loaded at any operating reactor site in a given year for
scenarios with correct initial canister size (initial guess = WP size) without an ISF (scenario IDs: 4, 30,
35, and 40).
0
50
100
150
200
250
Status Quo(8)
4 PWR in 2025(15)
12 PWR in 2025(20)
21 PWR in 2025(25)
Ma
x C
an
iste
rs L
oa
de
d a
t a
n O
pe
rati
ng
Re
act
or
in a
Ye
ar
0
50
100
150
200
250
Status Quo(4)
4 PWR in 2025(30)
12 PWR in 2025(35)
21 PWR in 2025(40)
Ma
x C
an
iste
rs L
oa
de
d a
t R
ea
cto
r in
a
Ye
ar
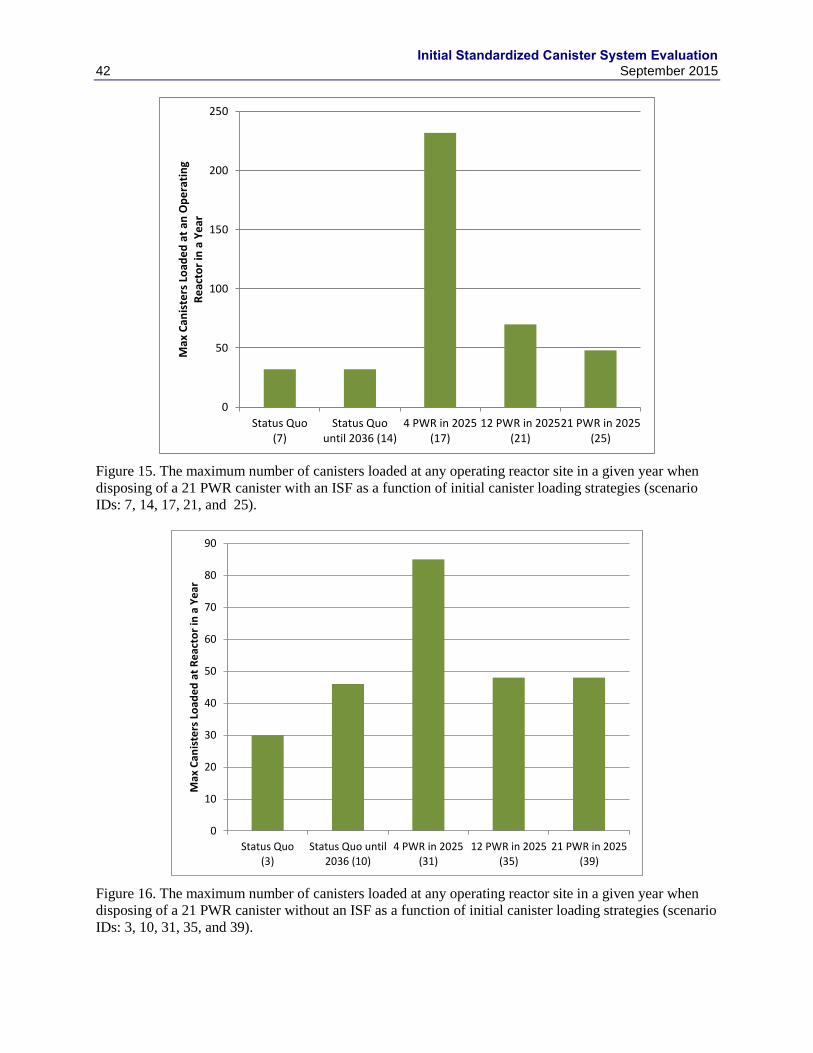
Initial Standardized Canister System Evaluation 42 September 2015
Figure 15. The maximum number of canisters loaded at any operating reactor site in a given year when
disposing of a 21 PWR canister with an ISF as a function of initial canister loading strategies (scenario
IDs: 7, 14, 17, 21, and 25).
Figure 16. The maximum number of canisters loaded at any operating reactor site in a given year when
disposing of a 21 PWR canister without an ISF as a function of initial canister loading strategies (scenario
IDs: 3, 10, 31, 35, and 39).
0
50
100
150
200
250
Status Quo(7)
Status Quountil 2036 (14)
4 PWR in 2025(17)
12 PWR in 2025(21)
21 PWR in 2025(25)
Max
Can
iste
rs L
oad
ed
at
an O
pe
rati
ng
Re
acto
r in
a Y
ear
0
10
20
30
40
50
60
70
80
90
Status Quo(3)
Status Quo until2036 (10)
4 PWR in 2025(31)
12 PWR in 2025(35)
21 PWR in 2025(39)
Ma
x C
an
iste
rs L
oa
de
d a
t R
ea
cto
r in
a Y
ea
r

Initial Standardized Canister System Evaluation September 2015 43
5.2.1.3 Total shutdown reactor years
One objective of this evaluation (and the larger standardization assessment) is to quantify the non-
productive use of reactor sites. Once the reactors have shutdown at a site, the site cannot be repurposed
until the SNF is off the site. As such, the number of years after the reactor shuts down until all of the SNF
is offsite is quantified in all scenarios. However, this evaluation showed that the effects of standardization
were negligible when compared with the effect of opening an ISF. As evident in Table 7, in all scenarios
without an ISF, the shutdown reactor years ranged from 3,868 to 3,907 years; in the scenarios with an ISF
open in 2025, the shutdown reactor years ranged from 2,035 to 2,177; and in the scenarios with an ISF
open in 2030, the shutdown reactor years were 2,410.
Table 7. Minimum and maximum number of shutdown reactor years as a function of ISF start date.
ISF Start Date Shutdown Reactor Years
Min Max
2025 2,035 2,177
2030 2,410 2,410
Never 3,868 3,907
This result implies that the DPC transportation limits rarely limit the ability to remove SNF from the
reactor sites when using a 3000 MTHM/year throughput rate and OFF/YFF acceptance strategy (Section
3.1.3). Because the standardized canisters do not have a thermal transportation limit, they are similar to
the bare fuel options documented in Reference 15.
5.2.1.4 Total Canisters in at-reactor storage
As expected, loading smaller canisters (instead of large DPCs) at reactor sites results in a higher
maximum number of canisters in dry storage at reactor sites. Figures showing the total canisters in storage
for different canister types can be found in Appendix A. It should be noted that because the 4PWR/9BWR
and the 12PWR/32BWR canisters are loaded in multicanister storage overpacks holding four and three3
canisters respectively, the number of storage overpacks in storage at reactor sites does not directly scale
with the number of canisters loaded for these canister sizes. Further study is needed to determine how
implementing standardization at reactor sites would necessitate ISFSI expansion or modification.
5.2.2 At-reactor ROM cost estimates
This section specifically investigates the at-reactor capital ROM costs and the at-reactor operational ROM
costs. As at-reactor costs are only a single piece of the relative system-wide ROM costs, any observations
in this section should be considered in the context of the whole system. There will be many situations
where lowering at-reactor costs will in turn increase other costs (and vice versa). This section will be
broken down into two sub-sections: at-reactor capital (canister) costs and at-reactor operational costs.
5.2.2.1 At-reactor capital ROM cost estimates
Capital costs at the reactor include canisters and cask/overpack costs, as well as ISFSI costs. However,
because cost is only tabulated after 2020, and most of the ISFSIs are already built at that point, the
majority of the capital costs are canisters and casks. For this reason, this evaluation will refer to at-reactor
capital costs as at-reactor canister costs. Figure 17 and Figure 18 show the at-reactor ROM costs with and
without an ISF when the final WP size is 4 PWR.
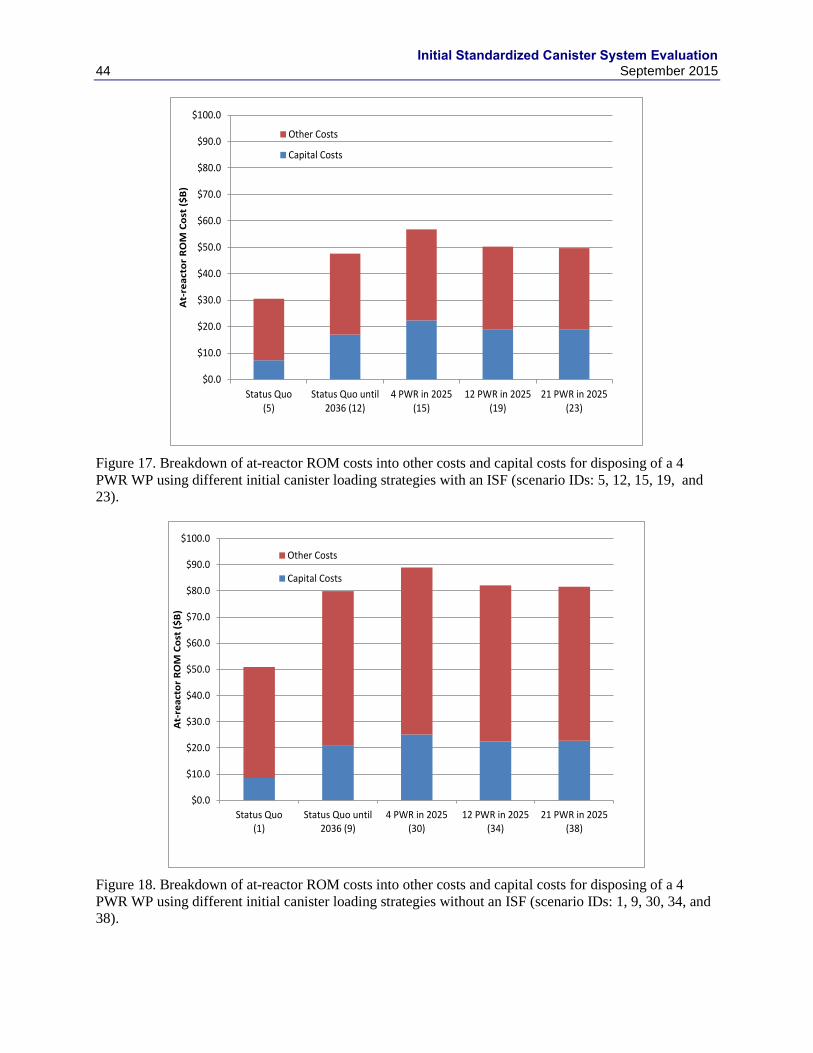
Initial Standardized Canister System Evaluation 44 September 2015
Figure 17. Breakdown of at-reactor ROM costs into other costs and capital costs for disposing of a 4
PWR WP using different initial canister loading strategies with an ISF (scenario IDs: 5, 12, 15, 19, and
23).
Figure 18. Breakdown of at-reactor ROM costs into other costs and capital costs for disposing of a 4
PWR WP using different initial canister loading strategies without an ISF (scenario IDs: 1, 9, 30, 34, and
38).
$0.0
$10.0
$20.0
$30.0
$40.0
$50.0
$60.0
$70.0
$80.0
$90.0
$100.0
Status Quo(5)
Status Quo until2036 (12)
4 PWR in 2025(15)
12 PWR in 2025(19)
21 PWR in 2025(23)
At-
rea
cto
r R
OM
Co
st (
$B
)
Other Costs
Capital Costs
$0.0
$10.0
$20.0
$30.0
$40.0
$50.0
$60.0
$70.0
$80.0
$90.0
$100.0
Status Quo(1)
Status Quo until2036 (9)
4 PWR in 2025(30)
12 PWR in 2025(34)
21 PWR in 2025(38)
At-
rea
cto
r R
OM
Co
st (
$B
)
Other Costs
Capital Costs

Initial Standardized Canister System Evaluation September 2015 45
As evident in the above figures, adding an ISF to the system insignificantly impacts the standardization
trends. Essentially, the ISF reduces the at-reactor other (operational) cost by a fairly constant amount in
all scenarios.
The detailed at-reactor capital costs can be seen in Appendix B based on the WP. These figures illustrate
the result that regardless of the final WP size, the at-reactor capital costs are minimized by continuing to
load DPCs. The minimum at-reactor other (operational) cost is on the order of $7B, whereas the
maximum at-reactor other cost is on the order of $25B, which occurs when loading 4 PWRs from 2025
until all SNF is out of the pool.
Therefore, the initial canister costs range from ~$7B to ~$25B, depending on the scenario selected.
5.2.2.2 At-reactor other ROM cost estimates
The at-reactor other costs include the cost to operate (maintenance, surveillance, etc.) an ISFSI or pool
and the cost associated with canister loading/unloading. The total number of shutdown reactor years can
be directly correlated to at-reactor other costs, as seen in Figure 19. These operational cost values were
calculated by taking the average over the different scenarios. The costs to keep ISFSIs open after reactor
sites are shutdown represent a majority of the operational costs at reactors. A pie chart showing the
average breakdown of other ROM costs between ISFSI costs, pool costs, and loading/unloading costs is
shown in Figure 20 through Figure 23. It should be noted that only pool costs occurring beyond 5 years
after reactor shutdown are included in the pool costs.
Figure 19. Total at-reactor other ROM costs versus the total number of shutdown reactor years.
0.0
10.0
20.0
30.0
40.0
50.0
60.0
0 1,000 2,000 3,000 4,000 5,000
Oth
er
Co
sts
($B
)
Shutdown Reactor Years
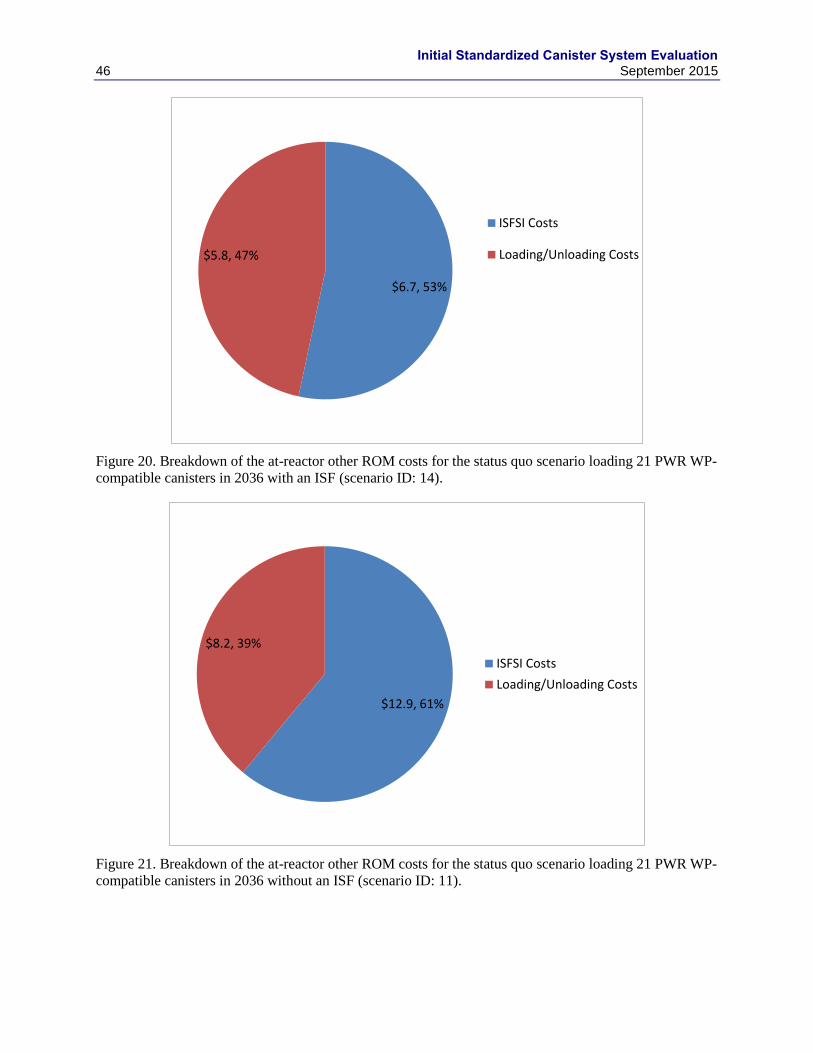
Initial Standardized Canister System Evaluation 46 September 2015
Figure 20. Breakdown of the at-reactor other ROM costs for the status quo scenario loading 21 PWR WP-
compatible canisters in 2036 with an ISF (scenario ID: 14).
Figure 21. Breakdown of the at-reactor other ROM costs for the status quo scenario loading 21 PWR WP-
compatible canisters in 2036 without an ISF (scenario ID: 11).
$6.7, 53%
$5.8, 47%
ISFSI Costs
Loading/Unloading Costs
$12.9, 61%
$8.2, 39%
ISFSI Costs
Loading/Unloading Costs
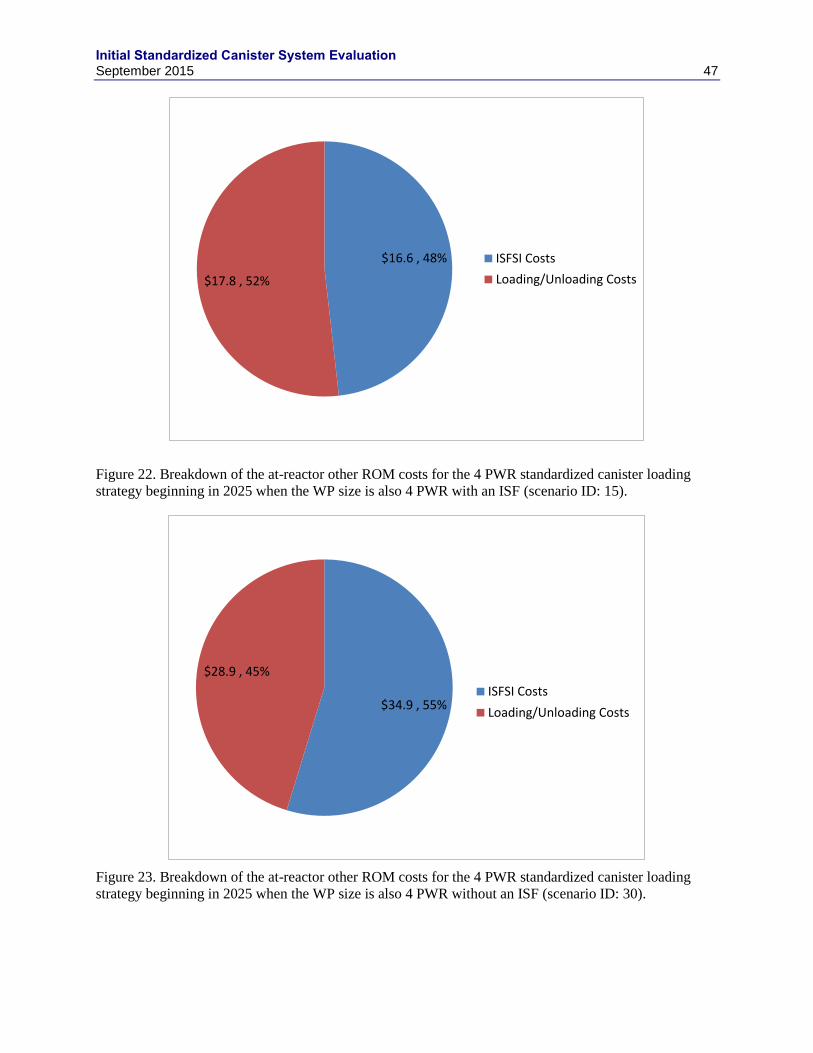
Initial Standardized Canister System Evaluation September 2015 47
Figure 22. Breakdown of the at-reactor other ROM costs for the 4 PWR standardized canister loading
strategy beginning in 2025 when the WP size is also 4 PWR with an ISF (scenario ID: 15).
Figure 23. Breakdown of the at-reactor other ROM costs for the 4 PWR standardized canister loading
strategy beginning in 2025 when the WP size is also 4 PWR without an ISF (scenario ID: 30).
$16.6 , 48%
$17.8 , 52%
ISFSI Costs
Loading/Unloading Costs
$34.9 , 55%
$28.9 , 45%
ISFSI Costs
Loading/Unloading Costs
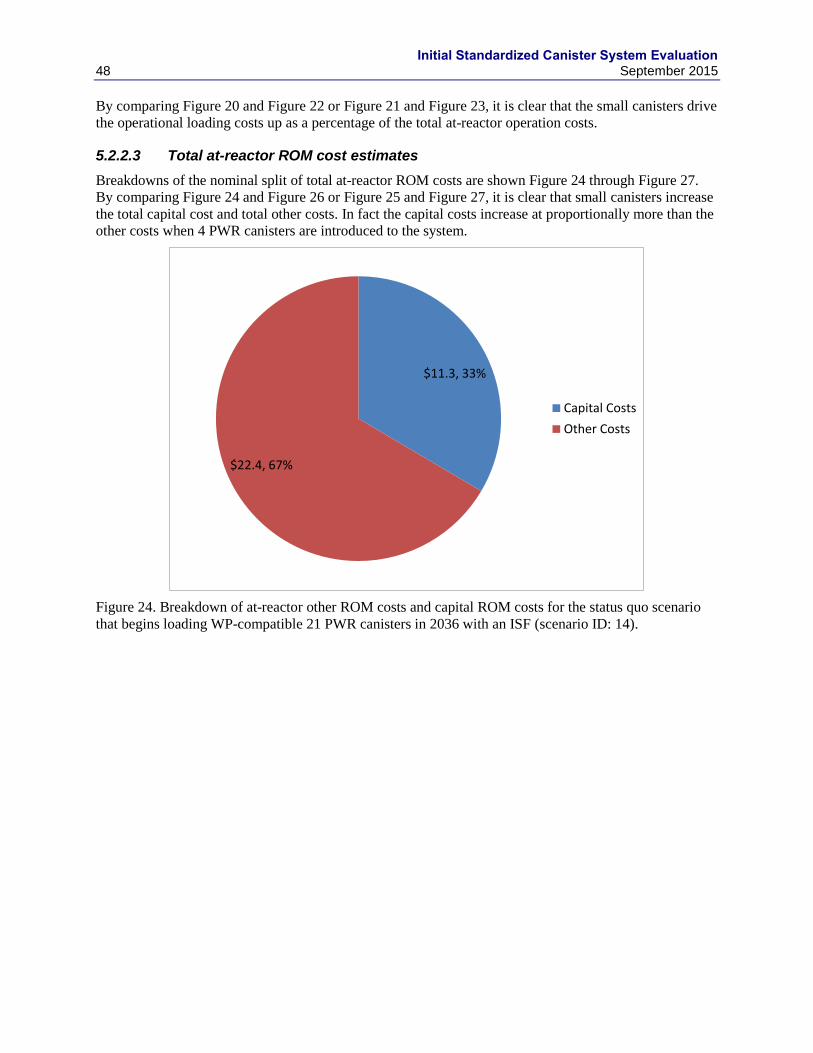
Initial Standardized Canister System Evaluation 48 September 2015
By comparing Figure 20 and Figure 22 or Figure 21 and Figure 23, it is clear that the small canisters drive
the operational loading costs up as a percentage of the total at-reactor operation costs.
5.2.2.3 Total at-reactor ROM cost estimates
Breakdowns of the nominal split of total at-reactor ROM costs are shown Figure 24 through Figure 27.
By comparing Figure 24 and Figure 26 or Figure 25 and Figure 27, it is clear that small canisters increase
the total capital cost and total other costs. In fact the capital costs increase at proportionally more than the
other costs when 4 PWR canisters are introduced to the system.
Figure 24. Breakdown of at-reactor other ROM costs and capital ROM costs for the status quo scenario
that begins loading WP-compatible 21 PWR canisters in 2036 with an ISF (scenario ID: 14).
$11.3, 33%
$22.4, 67%
Capital Costs
Other Costs

Initial Standardized Canister System Evaluation September 2015 49
Figure 25. Breakdown of at-reactor other ROM costs and capital ROM costs for the status quo scenario
that begins loading WP-compatible 21 PWR canisters in 2036 without an ISF (scenario ID: 11).
$13.8, 24%
$43.5, 76%
Capital Costs
Other Costs
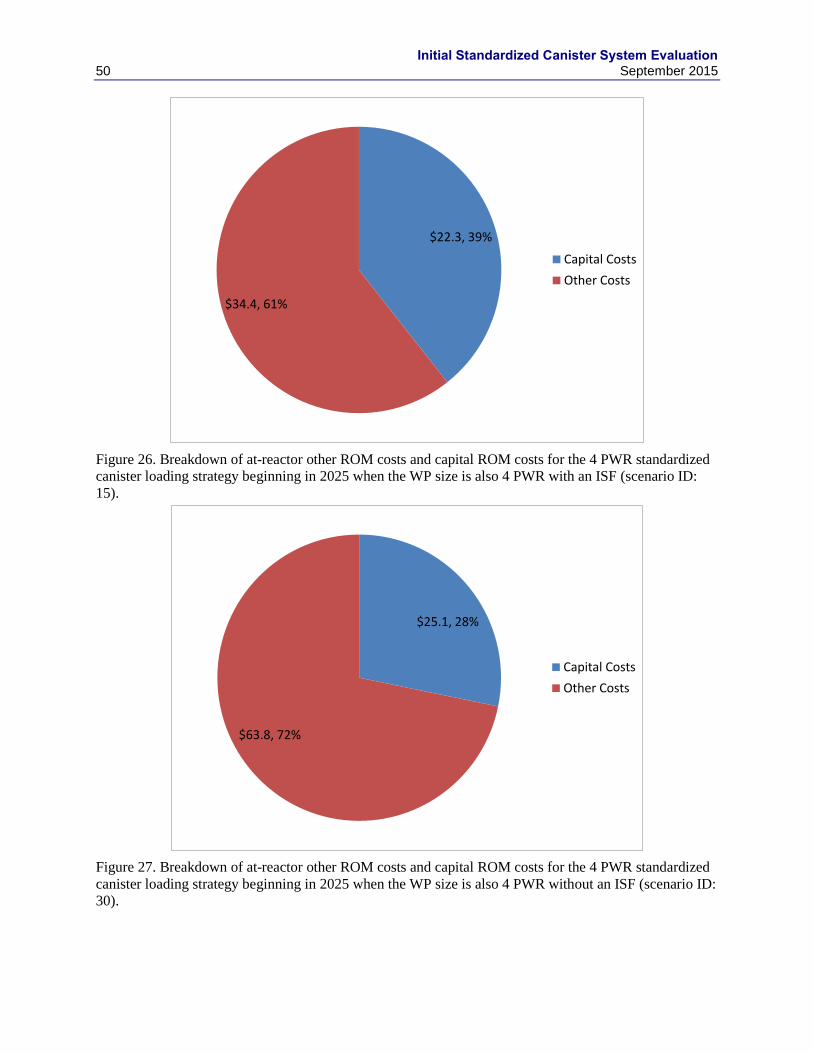
Initial Standardized Canister System Evaluation 50 September 2015
Figure 26. Breakdown of at-reactor other ROM costs and capital ROM costs for the 4 PWR standardized
canister loading strategy beginning in 2025 when the WP size is also 4 PWR with an ISF (scenario ID:
15).
Figure 27. Breakdown of at-reactor other ROM costs and capital ROM costs for the 4 PWR standardized
canister loading strategy beginning in 2025 when the WP size is also 4 PWR without an ISF (scenario ID:
30).
$22.3, 39%
$34.4, 61%
Capital Costs
Other Costs
$25.1, 28%
$63.8, 72%
Capital Costs
Other Costs
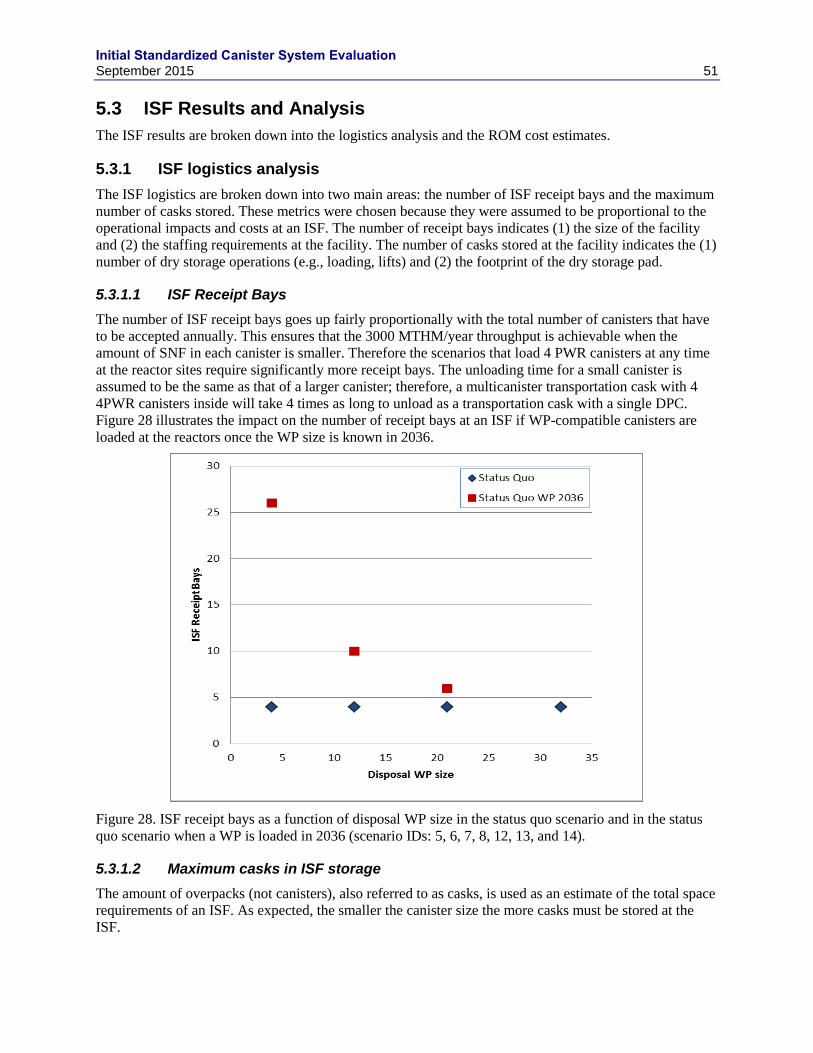
Initial Standardized Canister System Evaluation September 2015 51
5.3 ISF Results and Analysis
The ISF results are broken down into the logistics analysis and the ROM cost estimates.
5.3.1 ISF logistics analysis
The ISF logistics are broken down into two main areas: the number of ISF receipt bays and the maximum
number of casks stored. These metrics were chosen because they were assumed to be proportional to the
operational impacts and costs at an ISF. The number of receipt bays indicates (1) the size of the facility
and (2) the staffing requirements at the facility. The number of casks stored at the facility indicates the (1)
number of dry storage operations (e.g., loading, lifts) and (2) the footprint of the dry storage pad.
5.3.1.1 ISF Receipt Bays
The number of ISF receipt bays goes up fairly proportionally with the total number of canisters that have
to be accepted annually. This ensures that the 3000 MTHM/year throughput is achievable when the
amount of SNF in each canister is smaller. Therefore the scenarios that load 4 PWR canisters at any time
at the reactor sites require significantly more receipt bays. The unloading time for a small canister is
assumed to be the same as that of a larger canister; therefore, a multicanister transportation cask with 4
4PWR canisters inside will take 4 times as long to unload as a transportation cask with a single DPC.
Figure 28 illustrates the impact on the number of receipt bays at an ISF if WP-compatible canisters are
loaded at the reactors once the WP size is known in 2036.
Figure 28. ISF receipt bays as a function of disposal WP size in the status quo scenario and in the status
quo scenario when a WP is loaded in 2036 (scenario IDs: 5, 6, 7, 8, 12, 13, and 14).
5.3.1.2 Maximum casks in ISF storage
The amount of overpacks (not canisters), also referred to as casks, is used as an estimate of the total space
requirements of an ISF. As expected, the smaller the canister size the more casks must be stored at the
ISF.
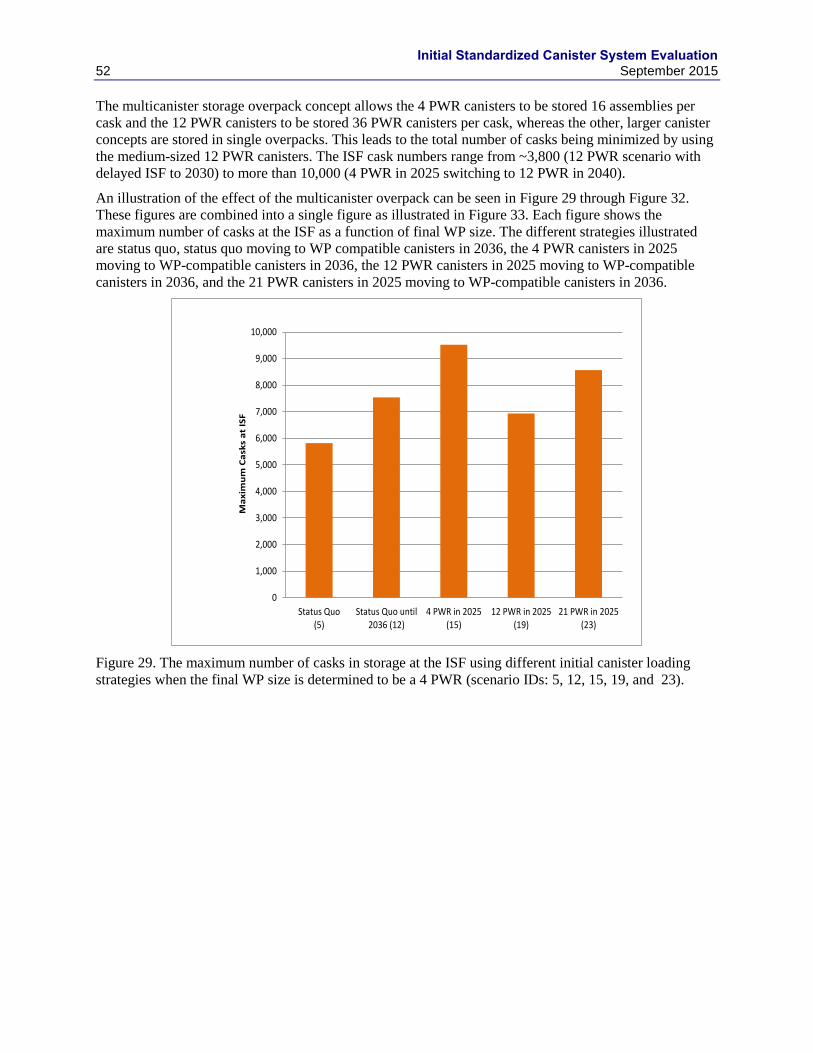
Initial Standardized Canister System Evaluation 52 September 2015
The multicanister storage overpack concept allows the 4 PWR canisters to be stored 16 assemblies per
cask and the 12 PWR canisters to be stored 36 PWR canisters per cask, whereas the other, larger canister
concepts are stored in single overpacks. This leads to the total number of casks being minimized by using
the medium-sized 12 PWR canisters. The ISF cask numbers range from ~3,800 (12 PWR scenario with
delayed ISF to 2030) to more than 10,000 (4 PWR in 2025 switching to 12 PWR in 2040).
An illustration of the effect of the multicanister overpack can be seen in Figure 29 through Figure 32.
These figures are combined into a single figure as illustrated in Figure 33. Each figure shows the
maximum number of casks at the ISF as a function of final WP size. The different strategies illustrated
are status quo, status quo moving to WP compatible canisters in 2036, the 4 PWR canisters in 2025
moving to WP-compatible canisters in 2036, the 12 PWR canisters in 2025 moving to WP-compatible
canisters in 2036, and the 21 PWR canisters in 2025 moving to WP-compatible canisters in 2036.
Figure 29. The maximum number of casks in storage at the ISF using different initial canister loading
strategies when the final WP size is determined to be a 4 PWR (scenario IDs: 5, 12, 15, 19, and 23).
0
1,000
2,000
3,000
4,000
5,000
6,000
7,000
8,000
9,000
10,000
Status Quo(5)
Status Quo until2036 (12)
4 PWR in 2025(15)
12 PWR in 2025(19)
21 PWR in 2025(23)
Ma
xim
um
Ca
sks
at
ISF
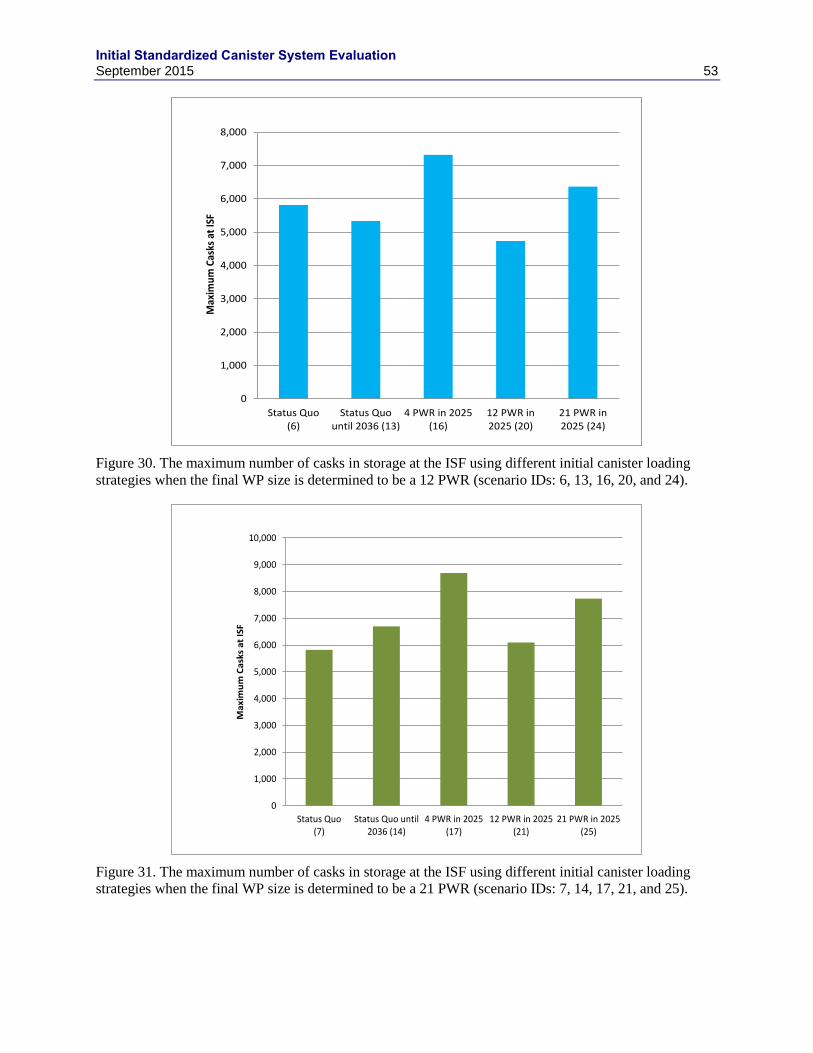
Initial Standardized Canister System Evaluation September 2015 53
Figure 30. The maximum number of casks in storage at the ISF using different initial canister loading
strategies when the final WP size is determined to be a 12 PWR (scenario IDs: 6, 13, 16, 20, and 24).
Figure 31. The maximum number of casks in storage at the ISF using different initial canister loading
strategies when the final WP size is determined to be a 21 PWR (scenario IDs: 7, 14, 17, 21, and 25).
0
1,000
2,000
3,000
4,000
5,000
6,000
7,000
8,000
Status Quo(6)
Status Quountil 2036 (13)
4 PWR in 2025(16)
12 PWR in2025 (20)
21 PWR in2025 (24)
Max
imu
m C
asks
at
ISF
0
1,000
2,000
3,000
4,000
5,000
6,000
7,000
8,000
9,000
10,000
Status Quo(7)
Status Quo until2036 (14)
4 PWR in 2025(17)
12 PWR in 2025(21)
21 PWR in 2025(25)
Ma
xim
um
Ca
sks
at
ISF
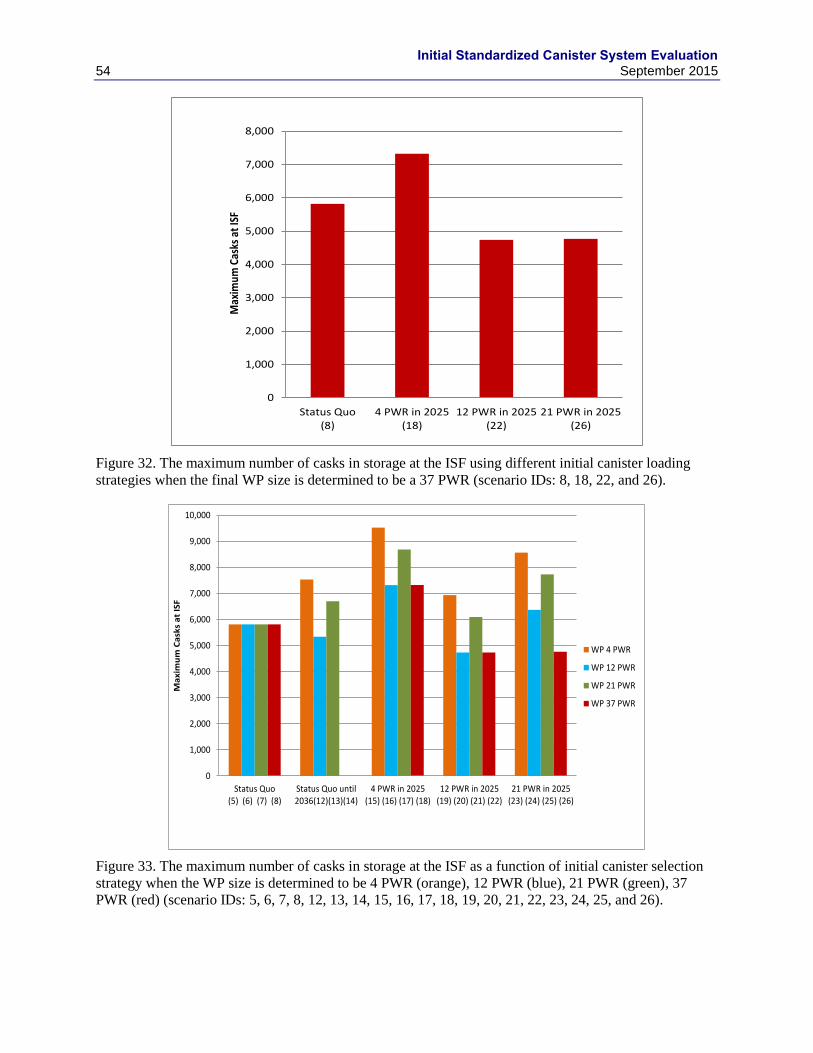
Initial Standardized Canister System Evaluation 54 September 2015
Figure 32. The maximum number of casks in storage at the ISF using different initial canister loading
strategies when the final WP size is determined to be a 37 PWR (scenario IDs: 8, 18, 22, and 26).
Figure 33. The maximum number of casks in storage at the ISF as a function of initial canister selection
strategy when the WP size is determined to be 4 PWR (orange), 12 PWR (blue), 21 PWR (green), 37
PWR (red) (scenario IDs: 5, 6, 7, 8, 12, 13, 14, 15, 16, 17, 18, 19, 20, 21, 22, 23, 24, 25, and 26).
0
1,000
2,000
3,000
4,000
5,000
6,000
7,000
8,000
Status Quo(8)
4 PWR in 2025(18)
12 PWR in 2025(22)
21 PWR in 2025(26)
Max
imum
Cas
ks a
t IS
F
0
1,000
2,000
3,000
4,000
5,000
6,000
7,000
8,000
9,000
10,000
Status Quo(5) (6) (7) (8)
Status Quo until2036(12)(13)(14)
4 PWR in 2025(15) (16) (17) (18)
12 PWR in 2025(19) (20) (21) (22)
21 PWR in 2025(23) (24) (25) (26)
Ma
xim
um
Ca
sks
at
ISF
WP 4 PWR
WP 12 PWR
WP 21 PWR
WP 37 PWR
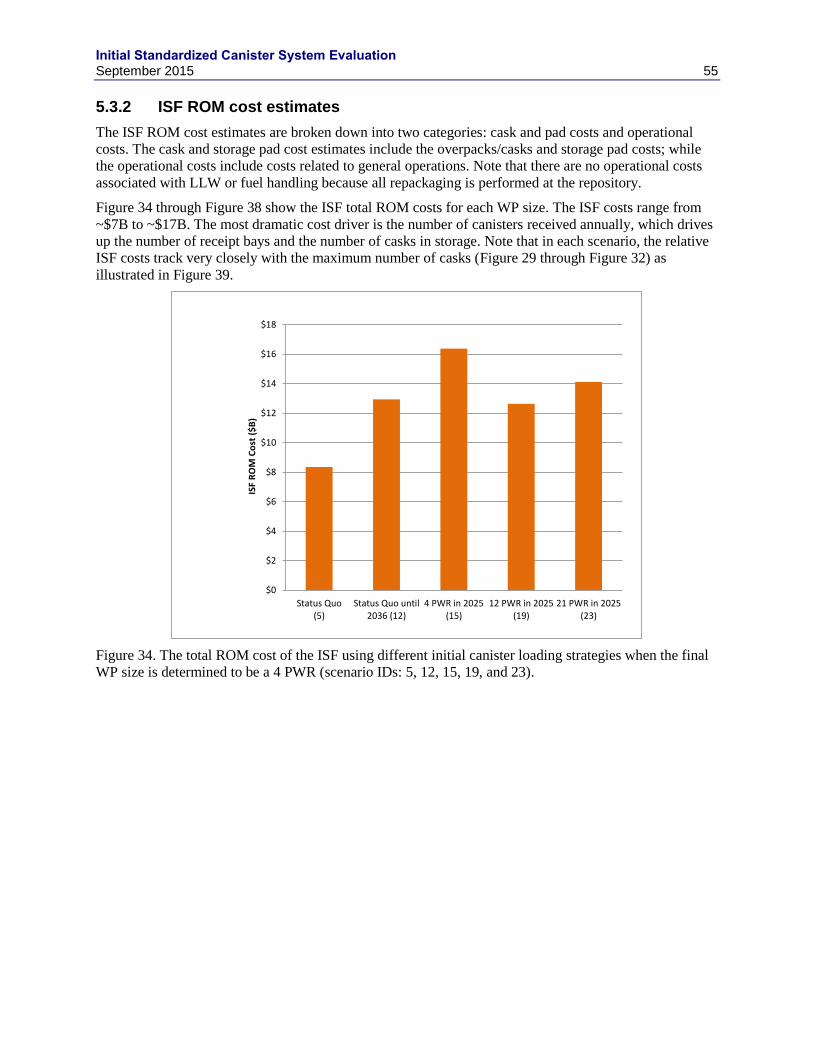
Initial Standardized Canister System Evaluation September 2015 55
5.3.2 ISF ROM cost estimates
The ISF ROM cost estimates are broken down into two categories: cask and pad costs and operational
costs. The cask and storage pad cost estimates include the overpacks/casks and storage pad costs; while
the operational costs include costs related to general operations. Note that there are no operational costs
associated with LLW or fuel handling because all repackaging is performed at the repository.
Figure 34 through Figure 38 show the ISF total ROM costs for each WP size. The ISF costs range from
~$7B to ~$17B. The most dramatic cost driver is the number of canisters received annually, which drives
up the number of receipt bays and the number of casks in storage. Note that in each scenario, the relative
ISF costs track very closely with the maximum number of casks (Figure 29 through Figure 32) as
illustrated in Figure 39.
Figure 34. The total ROM cost of the ISF using different initial canister loading strategies when the final
WP size is determined to be a 4 PWR (scenario IDs: 5, 12, 15, 19, and 23).
$0
$2
$4
$6
$8
$10
$12
$14
$16
$18
Status Quo(5)
Status Quo until2036 (12)
4 PWR in 2025(15)
12 PWR in 2025(19)
21 PWR in 2025(23)
ISF
RO
M C
ost
($
B)

Initial Standardized Canister System Evaluation 56 September 2015
Figure 35. The total ROM cost of the ISF using different initial canister loading strategies when the final
WP size is determined to be a 12 PWR (scenario IDs: 6, 13, 16, 20, and 24).
Figure 36. The total ROM cost of the ISF using different initial canister loading strategies when the final
WP size is determined to be a 21 PWR (scenario IDs: 7, 14, 17, 21, and 25).
$0
$2
$4
$6
$8
$10
$12
$14
Status Quo(6)
Status Quo until2036 (13)
4 PWR in 2025(16)
12 PWR in 2025(20)
21 PWR in 2025(24)
ISF
RO
M C
ost
($B
)
$0
$2
$4
$6
$8
$10
$12
$14
$16
Status Quo(7)
Status Quo until2036 (14)
4 PWR in 2025(17)
12 PWR in 2025(21)
21 PWR in 2025(25)
ISF
RO
M c
ost
($
B)
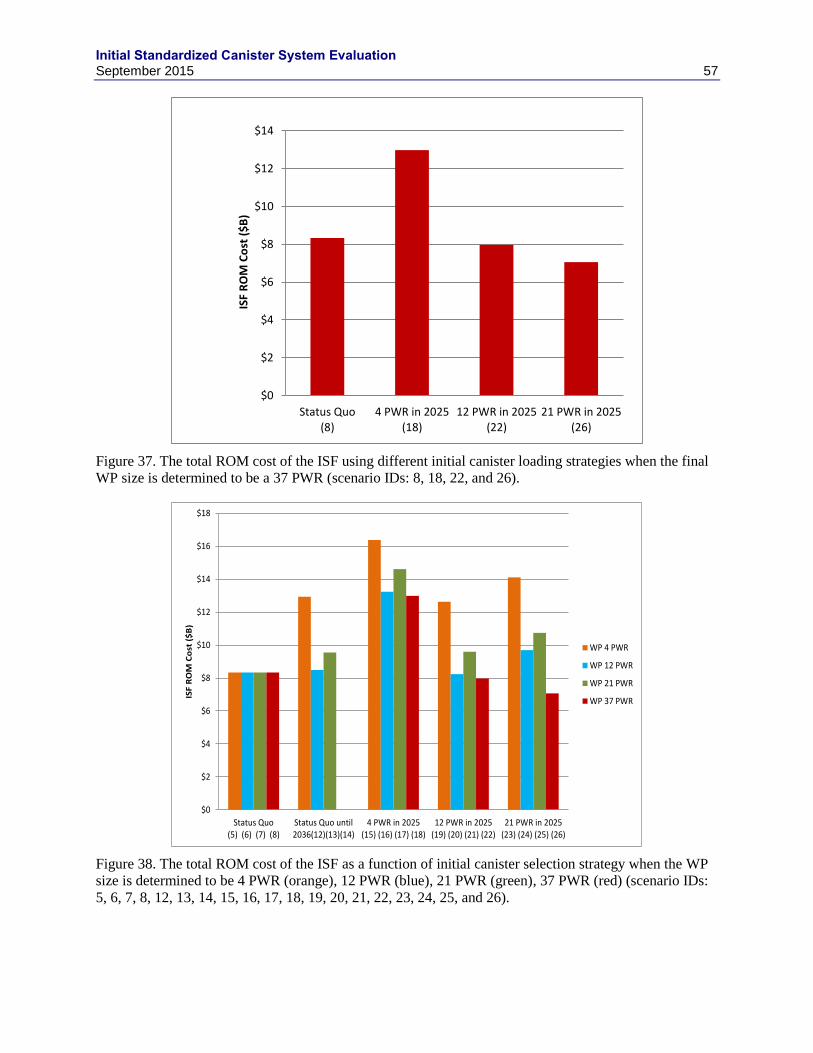
Initial Standardized Canister System Evaluation September 2015 57
Figure 37. The total ROM cost of the ISF using different initial canister loading strategies when the final
WP size is determined to be a 37 PWR (scenario IDs: 8, 18, 22, and 26).
Figure 38. The total ROM cost of the ISF as a function of initial canister selection strategy when the WP
size is determined to be 4 PWR (orange), 12 PWR (blue), 21 PWR (green), 37 PWR (red) (scenario IDs:
5, 6, 7, 8, 12, 13, 14, 15, 16, 17, 18, 19, 20, 21, 22, 23, 24, 25, and 26).
$0
$2
$4
$6
$8
$10
$12
$14
Status Quo(8)
4 PWR in 2025(18)
12 PWR in 2025(22)
21 PWR in 2025(26)
ISF
RO
M C
ost
($
B)
$0
$2
$4
$6
$8
$10
$12
$14
$16
$18
Status Quo(5) (6) (7) (8)
Status Quo until2036(12)(13)(14)
4 PWR in 2025(15) (16) (17) (18)
12 PWR in 2025(19) (20) (21) (22)
21 PWR in 2025(23) (24) (25) (26)
ISF
RO
M C
ost
($
B)
WP 4 PWR
WP 12 PWR
WP 21 PWR
WP 37 PWR

Initial Standardized Canister System Evaluation 58 September 2015
Figure 39. The ISF ROM cost as a function of maximum casks in storage at an ISF, where each symbol
represents a final WP size (e.g., 4 PWR WP, 12 PWR WP) (scenario IDs: 5, 6, 7, 8, 12, 13, 14, 15, 16, 17,
18, 19, 20, 21, 22, 23, 24, 25, and 26).
As the figures illustrates, the scenarios involving 4 PWR canisters have the highest ISF cost because they
have the most receipt bays and the greatest number of casks that must be stored. The least expensive ISF
occurs when the ISF is delayed and thus does not store as many casks.
5.4 Repackaging Results and Analysis
The repackaging results are broken down into the logistics analysis and the ROM cost estimates.
5.4.1 Repackaging logistics analysis
The repackaging facility logistics analysis is broken down in two main areas: LLW (number of canisters
and total cubic meters) and repackaging facility receiving, opening, and closing bays. The LLW indicates
the waste material generated in the process and the costs associated with this waste. The number of bays
at the repackaging facility indicates the size and cost of the facility and the staffing requirements at the
facility.
5.4.1.1 LLW
The amount of LLW generated in different scenarios is a key metric, as it represents the amount of
material no longer useful and is directly proportional to the cost of LLW disposal. Figure 40 through
Figure 47 illustrate that repackaging is minimized by using 4 PWR canisters, which are assumed to be
compatible with any repository concept. As expected, the total amount of waste generated is highest when
all SNF is loaded into DPCs at reactors (status quo cases). By 2025 the total volume of loaded DPCs is
projected to be 42,588 m3 (3,549 canisters), which would have to be repackaged in all scenarios in which
direct disposal of DPCs was found to be unfeasible. There is the possibility to decontaminate and then
recycle and repurpose some of this material. The current DOE commitment is to dispose of DPCs as
LLW, but that could be re-evaluated in the future.
$6
$8
$10
$12
$14
$16
$18
4,000 5,000 6,000 7,000 8,000 9,000 10,000
ISF
RO
M C
ost
($
B)
Maximum Casks at ISF
WP 4PWR
WP 12PWR
WP 21 PWR
WP 37 PWR or DPC

Initial Standardized Canister System Evaluation September 2015 59
Figure 40. Cubic meters of LLW using different initial canister loading strategies when the WP size is
determined to be a 4 PWR (scenario IDs: 5, 12, 15, 19, and 23).
Figure 41. Number of canisters to waste using different initial canister loading strategies when the WP
size is determined to be a 4 PWR (scenario IDs: 5, 12, 15, 19, and 23).
0
20,000
40,000
60,000
80,000
100,000
120,000
140,000
160,000
Status Quo(5)
Status Quo until2036 (12)
4 PWR in 2025(15)
12 PWR in 2025(19)
21 PWR in 2025(23)
LLW
V
olu
me
(m
3)
0
2,000
4,000
6,000
8,000
10,000
12,000
Status Quo(5)
Status Quo until2036 (12)
4 PWR in 2025(15)
12 PWR in 2025(19)
21 PWR in 2025(23)
Nu
mb
er
of
Ca
nis
ters
to
Wa
ste

Initial Standardized Canister System Evaluation 60 September 2015
Figure 42. Cubic meters of LLW using different initial canister loading strategies when the WP size is
determined to be a 12 PWR (scenario IDs: 6, 13, 16, 20, and 24).
Figure 43. Number of canisters to waste using different initial canister loading strategies when the WP
size is determined to be a 12 PWR (scenario IDs: 6, 13, 16, 20, and 24).
0
20,000
40,000
60,000
80,000
100,000
120,000
140,000
160,000
Status Quo(6)
Status Quo until2036 (13)
4 PWR in 2025(16)
12 PWR in 2025(20)
21 PWR in 2025(24)
LLW
Vo
lum
e (m
3 )
0
2,000
4,000
6,000
8,000
10,000
12,000
Status Quo(6)
Status Quo until2036 (13)
4 PWR in 2025(16)
12 PWR in 2025(20)
21 PWR in 2025(24)
Nu
mb
er o
f C
anis
ters
to
Was
te

Initial Standardized Canister System Evaluation September 2015 61
Figure 44. Cubic meters of LLW using different initial canister loading strategies when the WP size is
determined to be a 21 PWR (scenario IDs: 7, 14, 17, 21, and 25).
Figure 45. Number of canisters to waste using different initial canister loading strategies when the WP
size is determined to be a 21 PWR (scenario IDs: 7, 14, 17, 21, and 25).
0
20,000
40,000
60,000
80,000
100,000
120,000
140,000
160,000
Status Quo(7)
Status Quo until2036 (14)
4 PWR in 2025(17)
12 PWR in 2025(21)
21 PWR in 2025(25)
LLW
Vo
lum
e (m
3 )
0
2,000
4,000
6,000
8,000
10,000
12,000
Status Quo(7)
Status Quo until2036 (14)
4 PWR in 2025(17)
12 PWR in 2025(21)
21 PWR in 2025(25)
Nu
mb
er o
f Ca
nis
ters
to
Was
te

Initial Standardized Canister System Evaluation 62 September 2015
Figure 46. Cubic meters of LLW using different initial canister loading strategies with different the WP
sizes (scenario IDs: 5, 6, 7, 12, 13, 14, 15, 16, 17, 19, 20, 21, 23, 24, and 25).
Figure 47. Number of canisters to waste using different initial canister loading strategies with different the
WP sizes (scenario IDs: 5, 6, 7, 12, 13, 14, 15, 16, 17, 19, 20, 21, 23, 24, and 25).
0
20,000
40,000
60,000
80,000
100,000
120,000
140,000
160,000
Status Quo(5) (6) (7)
Status Quo until2036(12)(13)(14)
4 PWR in 2025(15) (16) (17)
12 PWR in 2025(19) (20) (21)
21 PWR in 2025(23) (24) (25)
LLW
Vo
lum
e (
m3 )
WP 4PWR
WP 12 PWR
WP 21 PWR
$0
$2,000
$4,000
$6,000
$8,000
$10,000
$12,000
Status Quo(5) (6) (7)
Status Quo until2036(12)(13)(14)
4 PWR in 2025(15) (16) (17)
12 PWR in 2025(19) (20) (21)
21 PWR in 2025(23) (24) (25)
Nu
mb
er
of
Ca
nis
ters
to
Wa
ste
WP 4 PWR
WP 12 PWR
WP 21 PWR
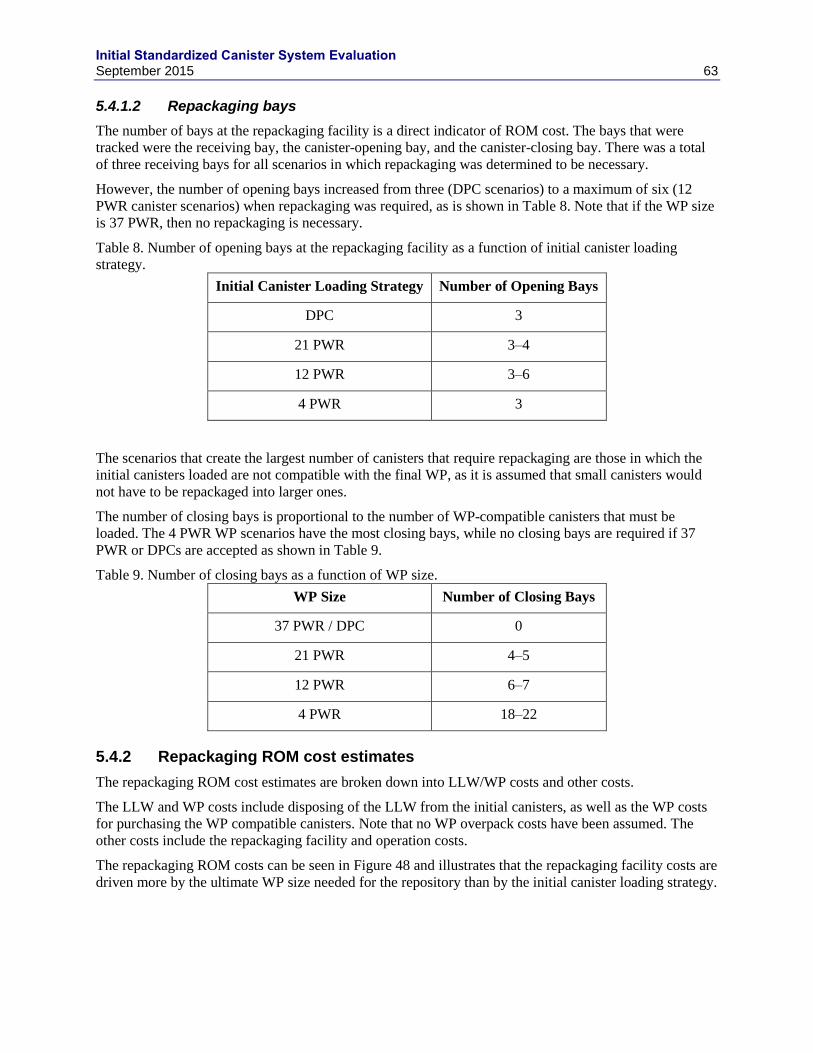
Initial Standardized Canister System Evaluation September 2015 63
5.4.1.2 Repackaging bays
The number of bays at the repackaging facility is a direct indicator of ROM cost. The bays that were
tracked were the receiving bay, the canister-opening bay, and the canister-closing bay. There was a total
of three receiving bays for all scenarios in which repackaging was determined to be necessary.
However, the number of opening bays increased from three (DPC scenarios) to a maximum of six (12
PWR canister scenarios) when repackaging was required, as is shown in Table 8. Note that if the WP size
is 37 PWR, then no repackaging is necessary.
Table 8. Number of opening bays at the repackaging facility as a function of initial canister loading
strategy.
Initial Canister Loading Strategy Number of Opening Bays
DPC 3
21 PWR 3–4
12 PWR 3–6
4 PWR 3
The scenarios that create the largest number of canisters that require repackaging are those in which the
initial canisters loaded are not compatible with the final WP, as it is assumed that small canisters would
not have to be repackaged into larger ones.
The number of closing bays is proportional to the number of WP-compatible canisters that must be
loaded. The 4 PWR WP scenarios have the most closing bays, while no closing bays are required if 37
PWR or DPCs are accepted as shown in Table 9.
Table 9. Number of closing bays as a function of WP size.
WP Size Number of Closing Bays
37 PWR / DPC 0
21 PWR 4–5
12 PWR 6–7
4 PWR 18–22
5.4.2 Repackaging ROM cost estimates
The repackaging ROM cost estimates are broken down into LLW/WP costs and other costs.
The LLW and WP costs include disposing of the LLW from the initial canisters, as well as the WP costs
for purchasing the WP compatible canisters. Note that no WP overpack costs have been assumed. The
other costs include the repackaging facility and operation costs.
The repackaging ROM costs can be seen in Figure 48 and illustrates that the repackaging facility costs are
driven more by the ultimate WP size needed for the repository than by the initial canister loading strategy.

Initial Standardized Canister System Evaluation 64 September 2015
Figure 48. Repackaging ROM costs as a function of initial canister selection strategy when the WP size is
determined to be 4 PWR (orange), 12 PWR (blue), 21 PWR (green) (scenario IDs: 5, 6, 7, 12, 13, 14, 15,
16, 17, 19, 20, 21, 23, 24, and 25).
For these ROM costs, there is a strong trend towards decreasing cost with larger WP size and only a weak
trend favoring smaller initial canister choice. The advantage of the large WP is that there is less
repackaging for any initial canister choice (assuming smaller canisters are compatible with the WP). The
weak trend with initial canister choice is due to the fact that the DPCs need to be repackaged for all
scenarios where the WP is less than 37 PWR, and choosing a small initial canister causes a larger number
of handling and opening operations.
5.5 Transportation Results and Analysis
The transportation results are broken down into the logistics analysis and the ROM cost estimates.
5.5.1 Transportation logistics analysis
The two key areas related to transportation are transportation cask miles (total number of miles that all
casks travel) and transportation consist miles (total number of miles that each consist travels). Because the
three-car consist was defined as the preferable consist size in all the scenarios, the cask miles are highly
correlated with the consist miles. A three-car consist was used in most shipments and smaller consists
were used in only a few shipments, which is reflected in the average consist size of 2.56. Consequently,
either cask miles or consist miles can be used as a transportation metric. The cask miles are directly
proportional to the number of casks to be transported, and as a result, the 12 PWR canisters scenarios
have the largest cask miles as illustrated in Figure 49 and Figure 50.
0
5
10
15
20
25
30
35
40
45
Status Quo(5) (6) (7)
Status Quo until2036(12)(13)(14)
4 PWR in 2025(15) (16) (17)
12 PWR in 2025(19) (20) (21)
21 PWR in 2025(23) (24) (25)
Repa
ckag
ing
Cost
($B)
WP 4 PWR
WP 12 PWR
WP 21 PWR

Initial Standardized Canister System Evaluation September 2015 65
Figure 49. Cask miles for scenarios with correct initial canister size (initial guess = WP size) with an ISF
(scenario IDs: 8, 15, 20, and 25).
Figure 50. Cask miles for scenarios with correct initial canister size (initial guess = WP size) without an
ISF (scenario IDs: 4, 30, 35, and 40).
Besides the status quo scenario where only DPCs are transported, the specific selection of initial canister
selection has a minor effect, as illustrated in Figure 51 and Figure 52.
0.0E+00
1.0E+07
2.0E+07
3.0E+07
4.0E+07
5.0E+07
6.0E+07
7.0E+07
8.0E+07
Status Quo(8)
4PWR in 2025(15)
12 PWR in 2025(20)
21 PWR in 2025(25)
Ca
sk M
ile
s
0.0E+00
1.0E+07
2.0E+07
3.0E+07
4.0E+07
5.0E+07
6.0E+07
7.0E+07
8.0E+07
Status Quo(4)
4PWR in 2025(30)
12 PWR in 2025(35)
21 PWR in 2025(40)
Cas
k M
iles

Initial Standardized Canister System Evaluation 66 September 2015
Figure 51. Cask miles when disposing of a 12 PWR WP using different initial canister loading strategies
with an ISF (scenario IDs: 6, 12, 16, 20, and and 24).
Figure 52. Cask miles when disposing of a 12 PWR WP using different initial canister loading strategies
without an ISF (scenario IDs: 2, 10, 31, 35, and 39).
0.0E+00
1.0E+07
2.0E+07
3.0E+07
4.0E+07
5.0E+07
6.0E+07
7.0E+07
8.0E+07
Status Quo(6)
Status Quo until2036 (12)
4 PWR in 2025(16)
12 PWR in 2025(20)
21 PWR in 2025(24)
Ca
sk M
ile
s
0.0E+00
1.0E+07
2.0E+07
3.0E+07
4.0E+07
5.0E+07
6.0E+07
7.0E+07
8.0E+07
Status Quo(2)
Status Quo until2036 (10)
4 PWR in 2025(31)
12 PWR in 2025(35)
21 PWR in 2025(39)
Ca
sk M
iles

Initial Standardized Canister System Evaluation September 2015 67
Due to the high correlation between consist and cask miles, the consist miles produce similar trends, as
illustrated in Figure 53 through Figure 56.
Figure 53. Consist miles for scenarios with correct initial canister size (initial guess = WP size) with ISF
(scenario IDs: 8, 15, 20, and 25).
Figure 54. Consist miles for scenarios with correct initial canister size (initial guess = WP size) without
ISF (scenario IDs: 4, 30, 35, and 40).
0.0E+00
5.0E+06
1.0E+07
1.5E+07
2.0E+07
2.5E+07
3.0E+07
Status Quo(8)
4PWR in 2025(15)
12 PWR in 2025(20)
21 PWR in 2025(25)
Co
nsi
st M
ile
s
0.0E+00
5.0E+06
1.0E+07
1.5E+07
2.0E+07
2.5E+07
3.0E+07
Status Quo(4)
4PWR in 2025(30)
12 PWR in 2025(35)
21 PWR in 2025(40)
Co
nsi
st M
ile
s

Initial Standardized Canister System Evaluation 68 September 2015
Figure 55. Consist miles when disposing of a 12 PWR WP using different initial canister loading
strategies with an ISF (scenario IDs: 6, 12, 16, 20, and 24).
Figure 56. Consist miles when disposing of a 12 PWR WP using different initial canister loading
strategies without an ISF (scenario IDs: 2, 10, 31, 35, and 39).
0.0E+00
5.0E+06
1.0E+07
1.5E+07
2.0E+07
2.5E+07
Status Quo(6)
Status Quo until2036 (12)
4 PWR in 2025(16)
12 PWR in 2025(20)
21 PWR in 2025(24)
Co
nsi
st M
ile
s
0.0E+00
5.0E+06
1.0E+07
1.5E+07
2.0E+07
2.5E+07
Status Quo(2)
Status Quo until2036 (10)
4 PWR in 2025(31)
12 PWR in 2025(35)
21 PWR in 2025(39)
Co
nsi
st M
ile
s
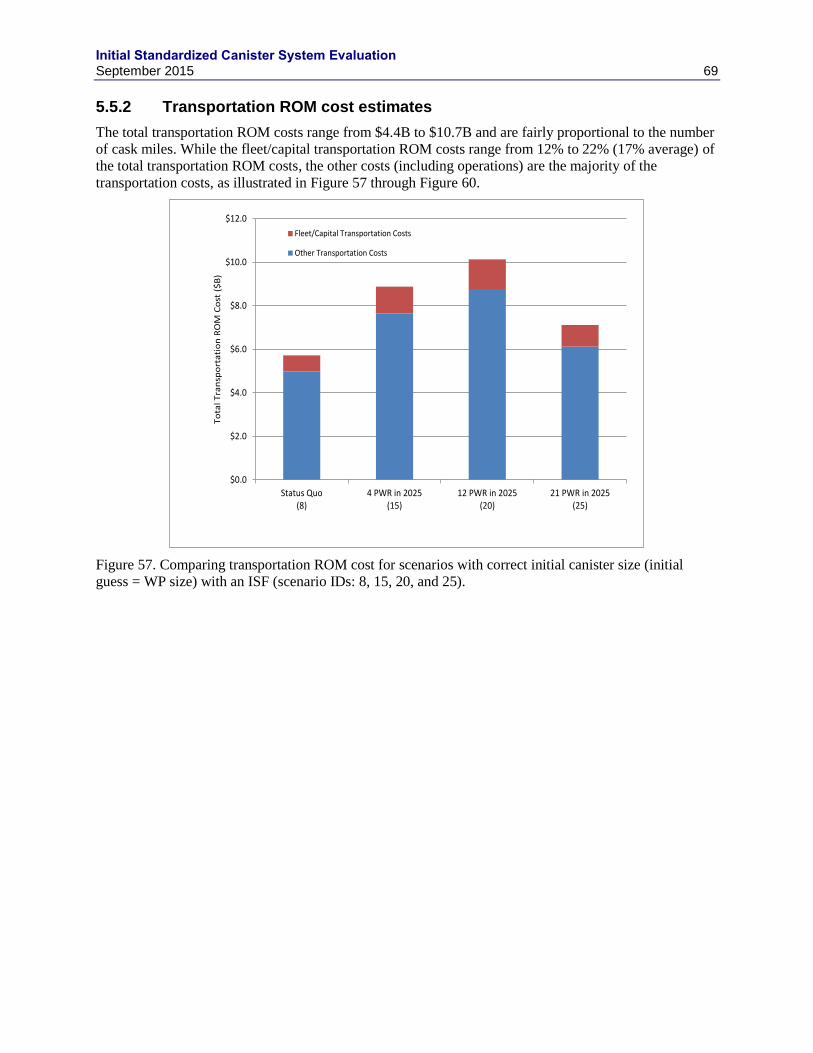
Initial Standardized Canister System Evaluation September 2015 69
5.5.2 Transportation ROM cost estimates
The total transportation ROM costs range from $4.4B to $10.7B and are fairly proportional to the number
of cask miles. While the fleet/capital transportation ROM costs range from 12% to 22% (17% average) of
the total transportation ROM costs, the other costs (including operations) are the majority of the
transportation costs, as illustrated in Figure 57 through Figure 60.
Figure 57. Comparing transportation ROM cost for scenarios with correct initial canister size (initial
guess = WP size) with an ISF (scenario IDs: 8, 15, 20, and 25).
$0.0
$2.0
$4.0
$6.0
$8.0
$10.0
$12.0
Status Quo(8)
4 PWR in 2025(15)
12 PWR in 2025(20)
21 PWR in 2025(25)
To
tal
Tra
nsp
ort
ati
on
RO
M C
ost
($
B)
Fleet/Capital Transportation Costs
Other Transportation Costs
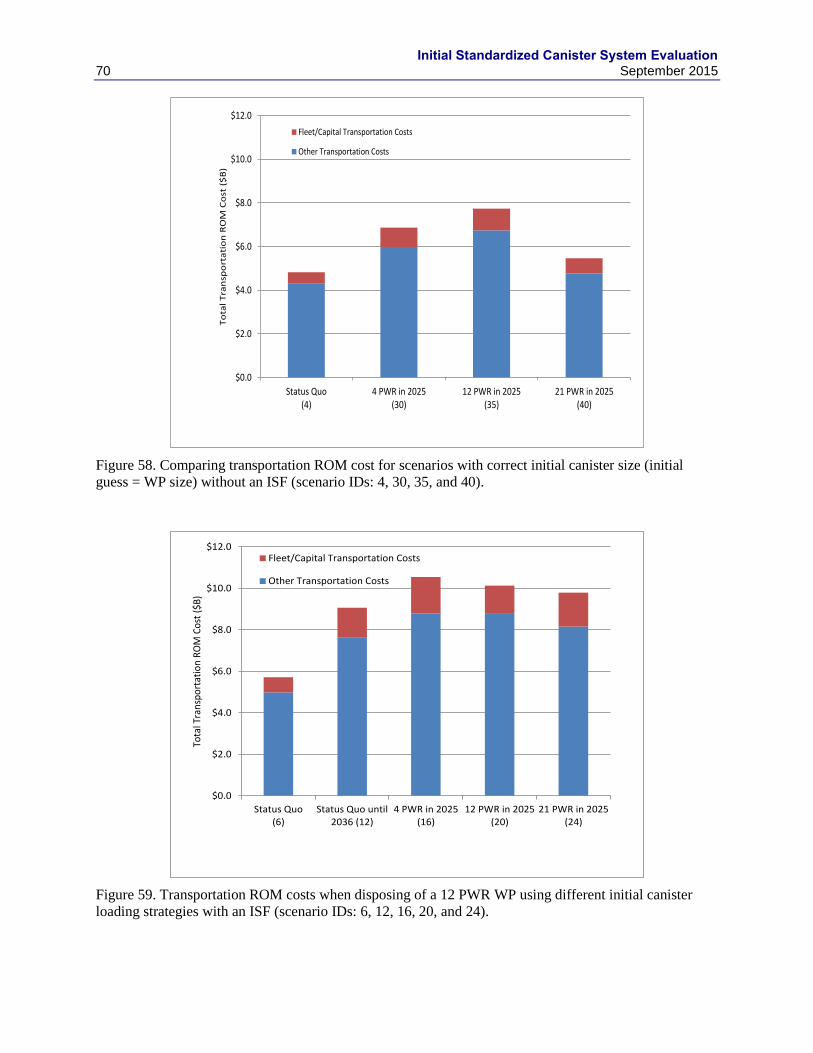
Initial Standardized Canister System Evaluation 70 September 2015
Figure 58. Comparing transportation ROM cost for scenarios with correct initial canister size (initial
guess = WP size) without an ISF (scenario IDs: 4, 30, 35, and 40).
Figure 59. Transportation ROM costs when disposing of a 12 PWR WP using different initial canister
loading strategies with an ISF (scenario IDs: 6, 12, 16, 20, and 24).
$0.0
$2.0
$4.0
$6.0
$8.0
$10.0
$12.0
Status Quo(4)
4 PWR in 2025(30)
12 PWR in 2025(35)
21 PWR in 2025(40)
To
tal
Tra
nsp
ort
ati
on
RO
M C
ost
($
B)
Fleet/Capital Transportation Costs
Other Transportation Costs
$0.0
$2.0
$4.0
$6.0
$8.0
$10.0
$12.0
Status Quo(6)
Status Quo until2036 (12)
4 PWR in 2025(16)
12 PWR in 2025(20)
21 PWR in 2025(24)
Tota
l Tra
nsp
ort
atio
n R
OM
Co
st (
$B)
Fleet/Capital Transportation Costs
Other Transportation Costs
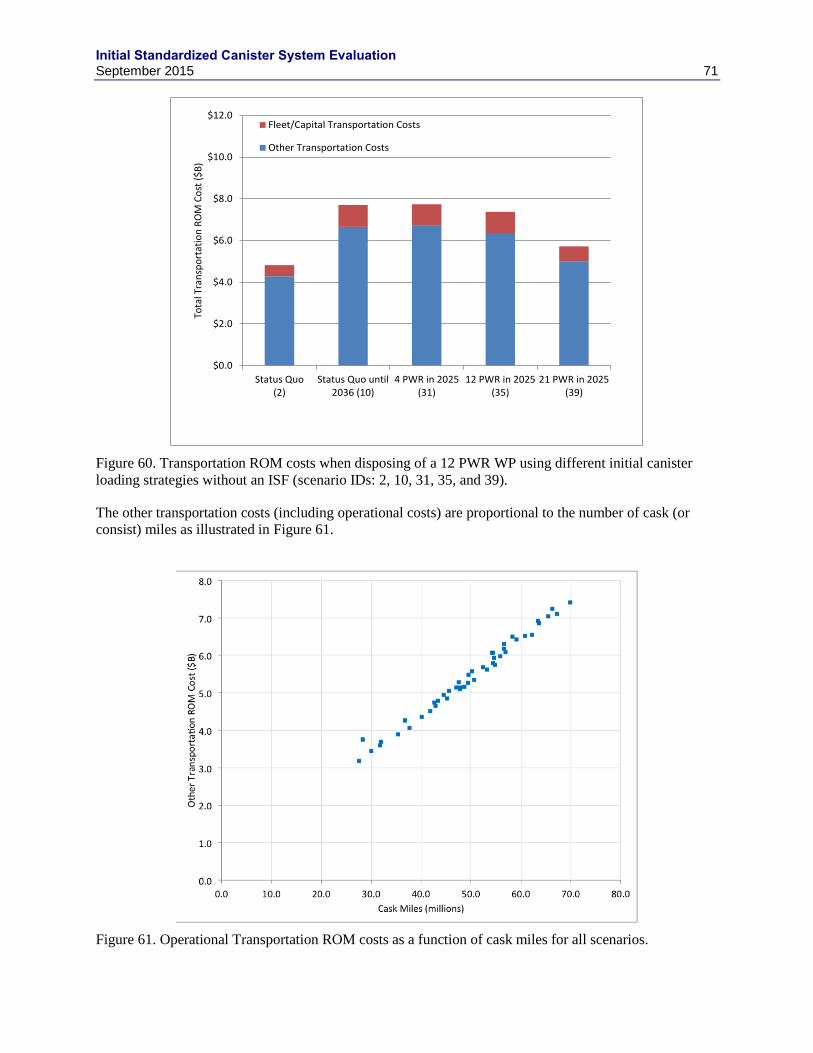
Initial Standardized Canister System Evaluation September 2015 71
Figure 60. Transportation ROM costs when disposing of a 12 PWR WP using different initial canister
loading strategies without an ISF (scenario IDs: 2, 10, 31, 35, and 39).
The other transportation costs (including operational costs) are proportional to the number of cask (or
consist) miles as illustrated in Figure 61.
Figure 61. Operational Transportation ROM costs as a function of cask miles for all scenarios.
$0.0
$2.0
$4.0
$6.0
$8.0
$10.0
$12.0
Status Quo(2)
Status Quo until2036 (10)
4 PWR in 2025(31)
12 PWR in 2025(35)
21 PWR in 2025(39)
Tota
l Tra
nsp
ort
atio
n R
OM
Co
st (
$B)
Fleet/Capital Transportation Costs
Other Transportation Costs

Initial Standardized Canister System Evaluation 72 September 2015
5.6 Qualitative Scenario Discussion
While the cost and logistics of the different scenarios can be quantitatively compared, a number of
metrics are qualitative. These metrics may always be qualitative (e.g., licensing complexity, research and
development [R&D] costs), or the metrics may require additional information to become quantitative
(e.g., dose, SNF loading times). The qualitative metrics discussed briefly below are R&D costs, waste
handling complexity, SNF loading times, organizational impacts, worker dose, licensing complexity, and
system performance uncertainties and risk.
The R&D costs are going to be higher for those scenarios where innovative or advanced activities are
required. This is a scenario differentiator when SNF may be stored in a manner that has not previously
been implemented (e.g., large-scale bare fuel wet and/or vault storage) or new operations at facilities
(e.g., reactors, repackaging facility). The scenarios that require repackaging or utilize multicanister
overpacks for storage and/or transportation will most likely have a higher R&D cost than those scenarios
without.
Waste handling complexity increases for bare fuel and repackaging operations. Bare fuel transportation
and storage will require additional fuel handling of individual assemblies, which increases the complexity
of structures and systems deployed at an ISF or a geologic repository operations area (Ref. 16). Any time
bare fuel is handled there is increased potential for off-normal conditions (e.g., fuel damage) (Ref. 17).
Repackaging requires handling individual assemblies and carries all of the associated complexities plus
the additional complexity of opening DPCs and dealing with the associated LLW (Refs. 18, 19, and 20).
Recognizing that some repackaging operations may be necessary at some point in the future, a waste
management system that includes scenarios with standardized canisters offers the potential to reduce
waste handling complexity system-wide and is within the state-of-the-art (Refs. 8, 5, and 21).
The SNF loading times and worker dose associated with loading and repackaging are metrics that cannot
currently be estimated without large uncertainty because there is little available historic perspective. DOE
is actively issuing SOWs to industry contractors to generate/estimate this data.
Organization impact includes the staffing needs of the facilities in different scenarios. Without more
detailed concepts of operations, it would be premature to quantify this metric. However, it is realistic to
assume that as more canisters are handled (and facilities become larger) facility staffing needs will
increase. Therefore, those scenarios with the largest number of canisters and casks (generally 4 PWR
scenarios) would have the largest impact on the staffing of those facilities.
Regulatory complexity includes the challenges associated with certification of the canisters and licensing
the facilities in the scenario. In this current evaluation, all canisters are assumed to be right circular
welded cylinders made of stainless steel. Certification of the canisters (at least for the storage and
transportation functions) is assumed to have little complexity. However, certification of the multicanister
overpacks (4 PWR and 12 PWR scenarios) may be more complex. The repackaging facility also has
licensing risk.
Finally, the system performance uncertainties and risk pertain to the ability to adapt to future changes.
The flexibility from a disposal perspective of smaller canisters is greater than that of the larger canisters,
since smaller canister concepts are compatible with a wider range of geologic disposal concepts(Refs. 5
and 9). However, as observed in this initial assessment (see preliminary observations below), this
additional flexibility may come with additional cost.
6. PRELIMINARY OBSERVATIONS
There are several observations regarding the results of this initial evaluation.
Initial Standardized Canister System Evaluation September 2015 73
4 PWR canisters may be the most expensive and most challenging option from a waste management
system operations perspective. Even if the WP is determined to be a 4 PWR-sized canister, the system
analysis tools (based on current assumptions and input selections) suggest that it might be more cost
effective to continue loading any larger canister concept. The results are highly dependent on and
sensitive to the assumptions for at-reactor loading operations and associated costs, as well as the
repackaging assumptions and associated cost. Results are also dependent on the assumptions about the
receipt rate and acceptance priorities. Therefore, it will be important to refine the technical bases and data
associated with at-reactor loading operations and repackaging facility concepts in future systems studies,
design studies, concept of operations, and process flows, and to consider a wider range of receipt rates
and acceptance priorities. The logistical challenges associated with managing (loading, storing, and
transporting, etc.) up to eight times more canisters than the current DPC strategy can be inferred from the
results in Section 6 and Appendix A. These logistical challenges and their associated increases in system
operational complexity will be further investigated and quantified as repository concepts and costs are
assimilated into the standardized canister system evaluation.
The 12 PWR, 21 PWR, and current DPC strategy have fairly equivalent relative system ROM costs
regardless of the WP size. The 12 PWR canisters show some attraction due the higher likelihood for
direct disposal without repackaging. However, the wait–and-see approach (i.e., continuing to load DPCs
until the WP size is known) shows similar cost estimates and would avoid impacting utility operations
until additional repository details are known. This observation is driven by the modest repackaging ROM
costs when compared to at-reactor storage and loading ROM costs. This further supports the need to
refine the technical bases and data associated with at-reactor loading operations and repackaging facility
concepts in future systems studies, design studies, concept of operations, and process flows.
Standardization strategies incorporated into the scenarios examined do not significantly influence the
ability to remove SNF from shutdown reactors for a given acceptance rate. The opening date of an ISF
has a much stronger effect on the ability to remove all of the SNF from a shutdown reactor site. However,
if higher acceptance rates and/or acceptance priorities aimed at clearing shutdown sites as quickly as
possible were assumed, standardized canisters may be able to clear sites faster due to their lack of
transportation limitations (some DPCs are not immediately transportable due to thermal and dose
constraints). The assumption that thermal loads would not limit transportation would need to be
confirmed once more detailed standardized canister designs are known. It may be useful to examine such
scenarios to explore this possibility.
The addition of an ISF that accepts only canisters to the system does not change the relative impacts of
standardization. The benefits of such an ISF are separate from those of standardization in this evaluation.
However, this evaluation did not address strategies that involve the acceptance of bare fuel from the
reactor sites even though bare fuel is the only acceptable waste form for acceptance under the Standard
Contract,.
From a relative system ROM cost perspective, the at-reactor costs were the bulk of the system costs as
they ranged from 36% to 91% of the total cost. The ISF was never more than 21% of the relative system
cost, and if repackaging was required, it ranged between 12% and 41% of the total. The transportation
costs made up less than 16% of the total costs in all scenarios. Note that the repository ROM costs
(excluded in this initial evaluation) are expected to be a substantial portion of the total system costs for all
scenarios. Multiple repository design concepts for different geologic media have been developed (Ref. 5).
Therefore, it is important to include consideration of these concepts in future system evaluations.
7. FUTURE ACTIVITIES
One of the goals of the larger standardization assessment is to quantify the potential system benefits
associated with:
Initial Standardized Canister System Evaluation 74 September 2015
Increased flexibility and/or reduced sensitivity to future decisions and changes to waste
management requirements
Simplified handling and licensing at an interim storage, repackaging, or reprocessing facility
and/or repository (Ref. 8)
Simplified transportation hardware and operations
Simplified ISF design and operations
Reduced uncertainties associated with waste acceptance and system performance
In order to accurately quantify these benefits and to gain confidence in the evaluation observations, some
questions need to be addressed.
How accurate are the at-reactor loading costs for small canisters and how sensitive are the
observations to uncertainties in this parameter?
How accurate are the capital costs for smaller canisters and how sensitive are the observations to
uncertainties in this parameter?
Are the multi-canister concepts used in this evaluation realistic? Are there other concepts that
should be evaluated?
What are the cost and operational impacts of repackaging standardized canisters (e.g., 12 PWR,
21 PWR) into smaller (e.g., 4 PWR) canisters?
As these questions are answered, the fidelity of the evaluations will improve. Along with improved
assumptions and evaluation parameters, the following scenarios will be explored in the next evaluation:
Bare fuel movement from reactors to an ISF and subsequent implementation of standardization at
the ISF
Accelerated acceptance rates and/or alternative acceptance priority rankings based on conclusions
from systems architecture studies (Refs. 2 and 15)
Repository concepts specifically including the ROM costs to dispose different sized canisters in
different geologic media
Additional scenarios related to those analyzed in this evaluation
8. REFERENCES
1. US Department of Energy, Strategy for the Management and Disposal of Used Nuclear Fuel and
High-Level Radioactive Waste, January 2013.
2. W. M. Nutt, E. Morris, F. Puig, J. Carter, P. Rodwell, A. Delley, R. L. Howard, and D. Giuliano,
Used Fuel Management System Architecture Evaluation, Fiscal Year 2012, FCRD-NFST-2013-
000020 Rev. 0, prepared for the US Department of Energy, October 2012.
3. CB&I Federal Services LLC, Transfer of Used Nuclear Fuel in Non-Disposable Canisters,
prepared for the US Department of Energy, September 2013.
4. AREVA Federal Services LLC, Transfer of Used Nuclear Fuel Stored in Non-Disposable
Canisters Study, RPT-3009487-000, prepared for the US Department of Energy, September 2013.
5. E. L. Hardin, D. J. Clayton, R. L. Howard, J. M. Scaglione, E. Pierce, K. Banerjee, M. D.
Voegele, H. R. Greenberg, J. Wen, T. A. Buscheck, J. T. Carter, T. Severynse, and W. M. Nutt,
Preliminary Report on Dual-Purpose Canister Disposal Alternatives (FY13), FCRD-UFD-2013-
Initial Standardized Canister System Evaluation September 2015 75
000171 Rev. 1, prepared for the US Department of Energy, Office of Used Nuclear Fuel
Disposition, December 2013.
6. BSC (Bechtel SAIC Co.), Basis of Design for the TAD Canister-Based Repository Design
Concept, prepared for the US Department of Energy, Office of Civilian Radioactive Waste
Management, 000-3DR-MGRO-00300-000-003, October 2008.
7. Office of Civilian Radioactive Waste Management, US Department of Energy. Multi-Purpose
Canister System Evaluation – A Systems Engineering Approach. A20000000-01717-5705-00002.
September 2004.
8. R. L. Howard, R. A. Joseph, J. J. Jarrell, and W. M. Nutt, Preliminary Used Fuel Management
System Concept of Operations Including Options for Standardized Transportation, Aging, and
Disposal Canisters, and Direct Disposal of Dual Purpose Canisters, FCRD-NFST-2013-000221
prepared for the US Department of Energy, July 2013.
9. E. L. Hardin, J. A. Blink, H. R. Greenberg, M. Sutton, M. Fratoni, J. T. Carter, M. Dupont and R.
L. Howard, Disposal Concepts/Thermal Load Management (FY11/12 Summary Report), FCRD-
UFD-2012-00219 Rev. 0, prepared for the US Department of Energy, September 2012.
10. AREVA Federal Services LLC, Task Order 12 – Standardized Transportation, Aging, and
Disposal Canister Feasibility Study Rev. 1, RPT-3008097-000, June 2013.
11. EnergySolutions, Task Order 12 – Standardized Transportation, Aging and Disposal Canister
Feasibility Study, June 2013.
12. J. T. Carter, D. R. Leduc, Nuclear Fuels Storage and Transportation Planning Project Inventory
Basis, FCRD-NFST-2013-000263 Rev. 0, prepared for the US Department of Energy, August
2013.
13. W. M. Nutt, J. Carter, A. Delley, T. Severynse, R. Howard, B. Bevard, Nuclear Fuels Storage
and Transportation Requirements Document, FCRD-NFST-2013-000330 Rev. 0, prepared for the
US Department of Energy, September 2013.
14. W. M. Nutt, E. Morris, F. Puig, E. Kalinina, and S. Gillespie, Transportation Storage Logistics
Model - CALVIN (TSL-CALVIN), FCRD-NFST-2012-000424, prepared for the US Department of
Energy, October 2012.
15. W. M. Nutt, F. Puig, E. Morris, Y.S. Park, R. Joseph III, G. Petersen, D. Giuliano, R. Howard,
Used Fuel Management System Architecture Evaluation, Fiscal Year 2013, FCRD-NFST-2013-
000377 Rev. 1, prepared for the US Department of Energy, October 2013.
16. BSC (Bechtel SAIC, LLC). Preliminary Report for Critical Decision-1 Revision. TDR-MGR-
MD-000042, Revision 00. November 2005.
17. BSC (Bechtel SAIC, LLC). Commercial Spent Fuel Handling in Air Study. 000-30R-MGR0-
00700-000-000. March 2005
18. BSC (Bechtel SAIC, LLC). Nuclear Facilities: Dual-Purpose Canister Opening Value
Engineering Study. 050-3TS-HD00-00100-000. Revision 00 January 2007
19. AREVA Federal Services LLC, Task Order 14- Transfer of Used Nuclear Fuel Stored in Non-
Disposable Canisters Study RPT-3009487-000. September 2013
20. Chicago Bridge and Iron Federal Services LLC, Task Order 14- Transfer of Used Nuclear Fuel
Stored in Non-Disposable Canisters Study
21. DOE (US Department of Energy). 2008. Yucca Mountain Repository License Application
for Construction Authorization. US Department of Energy.

Initial Standardized Canister System Evaluation 76 September 2015
22. B. van den Akker, J. Jarrell, J. Peterson, R. Joseph, I. Busch, K. Banerjee, J. Clarity, R. Howard,
M. Nutt, E. Kalinina, J. Carter, D. Vinson, Data Identification and Verification for Waste
Management System Analyses, FCRD-NFST-2014-000530 Rev. 0, July 2014.
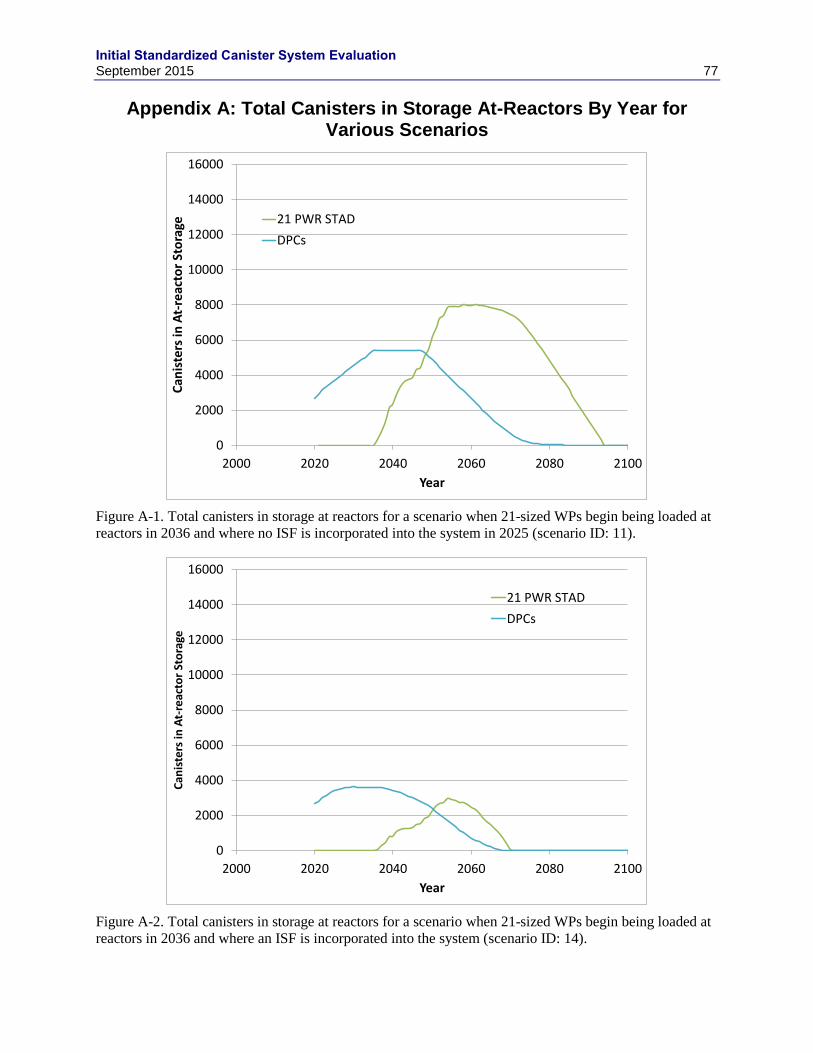
Initial Standardized Canister System Evaluation September 2015 77
Appendix A: Total Canisters in Storage At-Reactors By Year for Various Scenarios
Figure A-1. Total canisters in storage at reactors for a scenario when 21-sized WPs begin being loaded at
reactors in 2036 and where no ISF is incorporated into the system in 2025 (scenario ID: 11).
Figure A-2. Total canisters in storage at reactors for a scenario when 21-sized WPs begin being loaded at
reactors in 2036 and where an ISF is incorporated into the system (scenario ID: 14).
0
2000
4000
6000
8000
10000
12000
14000
16000
2000 2020 2040 2060 2080 2100
Can
iste
rs in
At-
reac
tor
Sto
rage
Year
21 PWR STAD
DPCs
0
2000
4000
6000
8000
10000
12000
14000
16000
2000 2020 2040 2060 2080 2100
Can
iste
rs in
At-
reac
tor
Sto
rage
Year
21 PWR STAD
DPCs

Initial Standardized Canister System Evaluation 78 September 2015
Figure A-3. Total canisters in storage at reactors for a scenario when 21 PWR standardized canisters
begin being loaded at reactors in 2025 and a 4 PWR WP is selected in 2036 and where an ISF is
incorporated into the system in 2025 (scenario ID: 23).
Figure A-4. Total canisters in storage at reactors for a scenario when 21 PWR standardized canisters
begin being loaded at reactors in 2025 and a 12 PWR WP is selected in 2036 and where an ISF is
incorporated into the system in 2025 (scenario ID: 24).
0
2000
4000
6000
8000
10000
12000
14000
16000
2000 2020 2040 2060 2080 2100
Can
iste
rs in
At-
reac
tor
Sto
rage
Year
4 PWR STAD
21 PWR STAD
DPCs
0
2000
4000
6000
8000
10000
12000
14000
16000
2000 2020 2040 2060 2080 2100
Can
iste
rs in
At-
reac
tor
Sto
rage
Year
12 PWR STAD
21 PWR STAD
DPCs

Initial Standardized Canister System Evaluation September 2015 79
Figure A-5. Total canisters in storage at reactors for a scenario when 21 PWR standardized canisters
begin being loaded at reactors in 2025 and a 21 PWR WP is confirmed in 2036 and where an ISF is
incorporated into the system in 2025 (scenario ID: 25).
Figure A-6. Total canisters in storage at reactors for a scenario when 21 PWR standardized canisters
begin being loaded at reactors in 2025 and a 37 PWR WP is selected in 2036 and where an ISF is
incorporated into the system in 2025 (scenario ID: 26).
0
2000
4000
6000
8000
10000
12000
14000
16000
2000 2020 2040 2060 2080 2100
Can
iste
rs in
At-
reac
tor
Sto
rage
Year
21 PWR STAD
DPCs
0
2000
4000
6000
8000
10000
12000
14000
16000
2000 2020 2040 2060 2080 2100
Can
iste
rs in
At-
reac
tor
Sto
rage
Year
21 PWR STAD
37 PWR STAD
DPCs

Initial Standardized Canister System Evaluation 80 September 2015
Figure A-7. Total canisters in storage at reactors for a scenario when 4 PWR standardized canisters begin
being loaded at reactors in 2025 and a 21 PWR WP is selected in 2036 and where an ISF is incorporated
into the system in 2025 (scenario ID: 17).
Figure A-8. Total canisters in storage at reactors for a scenario when 12 PWR standardized canisters
begin being loaded at reactors in 2025 and a 21 PWR WP is selected in 2036 and where an ISF is
incorporated into the system in 2025 (scenario ID: 21).
0
2000
4000
6000
8000
10000
12000
14000
16000
2000 2020 2040 2060 2080 2100
Can
iste
rs in
At-
reac
tor
Sto
rage
Year
4 PWR STAD
21 PWR STAD
DPCs
0
2000
4000
6000
8000
10000
12000
14000
16000
2000 2020 2040 2060 2080 2100
Can
iste
rs in
At-
reac
tor
Sto
rage
Year
12 PWR STAD
21 PWR STAD
DPCs

Initial Standardized Canister System Evaluation September 2015 81
Table A-1. Maximum number of canisters in storage at reactors for each scenario.22
22 As mentioned in Section 4.1.6, if the 37 PWR WP is feasible, all DPCs are assumed to be disposable.
Scenario # Major Class Scenario Class Scenario Description
Scenario
Description
Numbering
Maximum
Number of
4 PWR
Canisters in
Storage
Maximum
Number of
12 PWR
Canisters in
Storage
Maximum
Number of
21 PWR
Canisters in
Storage
Maximum
Number of
37 PWR
Canisters in
Storage
Maximum
Number of
DPCs in
Storage
Maximum
Number of
Canisters
(Any Type)
in Storage
1 Status Quo Class 1DPCs loaded at-Rx; 4 PWR WPs
repackaged at Repo(2048); no ISFSQ 1.a 0 0 0 0 9,378 9,378
2 Status Quo Class 1DPCs loaded at-Rx; 12 PWR WP
repackaged at Repo (2048); no ISFSQ 1.b 0 0 0 0 9,378 9,378
3 Status Quo Class 1DPCs loaded at-Rx; 21 PWR WP
repackaged at Repo (2048); no ISFSQ 1.c 0 0 0 0 9,378 9,378
4 Status Quo Class 1DPCs loaded at-Rx; all DPCs
disposable (2048); no ISFSQ 1.d 0 0 0 0 9,378 9,378
5 Status Quo Class 2
DPCs loaded at-Rx; 4 PWR WP Size
repackaged at Repo (2048); ISF
(2021)
SQ 2.a 0 0 0 0 4,107 4,107
6 Status Quo Class 2
DPCs loaded at-Rx; 12 PWR WP Size
repackaged at Repo (2048); ISF
(2021)
SQ 2.b 0 0 0 0 4,107 4,107
7 Status Quo Class 2
DPCs loaded at-Rx; 21 PWR WP Size
repackaged at Repo (2048); ISF
(2021)
SQ 2.c 0 0 0 0 4,107 4,107
8 Status Quo Class 2DPCs loaded at-Rx; all DPCs
disposable (2048); ISF (2021)SQ 2.d 0 0 0 0 4,107 4,107
9 Status Quo Class 3 4 PWR WPs loaded at Rx (2036);
Repo open (2048); no ISFSQ 3.a 40,729 0 0 0 5,382 46,111
10 Status Quo Class 312 PWR WPs loaded at Rx (2036);
Repo open (2048); no ISFSQ 3.b 0 12,829 0 0 5,382 18,211
11 Status Quo Class 321 PWR WPs loaded at Rx (2036);
Repo open (2048); no ISFSQ 3.c 0 0 8,000 0 5,382 13,382
12 Status Quo Class 4 4 PWR WPs loaded at Rx (2036);
Repo open (2048); ISF (2021)SQ 4.a 14,959 0 0 0 3,624 18,583
13 Status Quo Class 412 PWR WPs loaded at Rx (2036);
Repo open (2048); ISF (2021)SQ 4.b 0 4,704 0 0 3,624 8,328
14 Status Quo Class 421 PWR WPs loaded at Rx (2036);
Repo open (2048); ISF (2021)SQ 4.c 0 0 2,953 0 3,624 6,577
15Standardized
CanisterClass 1
4 PWR STADs loaded at Rx (2025);
4 PWR WP confirmed (2036); Repo
open (2048); ISF (2021)
SCS
1.4.2025.4.2
036
18,316 0 0 0 3,293 21,609
16Standardized
CanisterClass 1
4 PWR STADs loaded at Rx (2025);
12 PWR WP selected (2036); Repo
open (2048); ISF (2021)
SCS
1.4.2025.12.
2036
4,303 4,526 0 0 3,293 12,122
17Standardized
CanisterClass 1
4 PWR STADs loaded at Rx (2025);
21 PWR WP selected (2036); Repo
open (2048); ISF (2021)
SCS
1.4.2025.21.
2036
4,303 0 2,862 0 3,293 10,458
18Standardized
CanisterClass 1
4 PWR STADs loaded at Rx (2025);
37 PWR WP selected (2036); Repo
open (2048); ISF (2021)
SCS
1.4.2025.37.
2036
4,303 0 0 1,547 3,293 9,143
19Standardized
CanisterClass 1
12 PWR STADs loaded at Rx (2025);
4 PWR WP selected (2036); Repo
open (2048); ISF (2021)
SCS
1.12.2025.4.
2036
14,391 1,365 0 0 3,293 19,049
20Standardized
CanisterClass 1
12 PWR STADs loaded at Rx (2025);
12 PWR WP confirmed (2036); Repo
open (2048); ISF (2021)
SCS
1.12.2025.1
2.2036
0 5,745 0 0 3,293 9,038
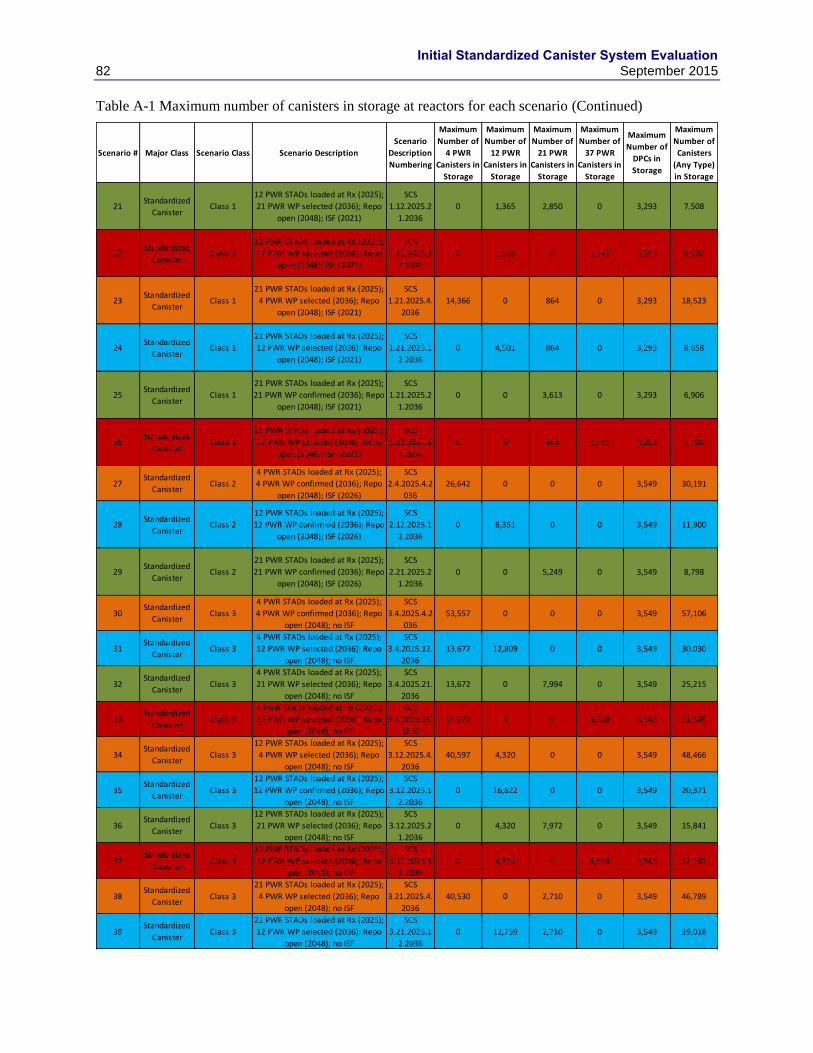
Initial Standardized Canister System Evaluation 82 September 2015
Table A-1 Maximum number of canisters in storage at reactors for each scenario (Continued)
Scenario # Major Class Scenario Class Scenario Description
Scenario
Description
Numbering
Maximum
Number of
4 PWR
Canisters in
Storage
Maximum
Number of
12 PWR
Canisters in
Storage
Maximum
Number of
21 PWR
Canisters in
Storage
Maximum
Number of
37 PWR
Canisters in
Storage
Maximum
Number of
DPCs in
Storage
Maximum
Number of
Canisters
(Any Type)
in Storage
21Standardized
CanisterClass 1
12 PWR STADs loaded at Rx (2025);
21 PWR WP selected (2036); Repo
open (2048); ISF (2021)
SCS
1.12.2025.2
1.2036
0 1,365 2,850 0 3,293 7,508
22Standardized
CanisterClass 1
12 PWR STADs loaded at Rx (2025);
37 PWR WP selected (2036); Repo
open (2048); ISF (2021)
SCS
1.12.2025.3
7.2036
0 1,365 0 1,542 3,293 6,200
23Standardized
CanisterClass 1
21 PWR STADs loaded at Rx (2025);
4 PWR WP selected (2036); Repo
open (2048); ISF (2021)
SCS
1.21.2025.4.
2036
14,366 0 864 0 3,293 18,523
24Standardized
CanisterClass 1
21 PWR STADs loaded at Rx (2025);
12 PWR WP selected (2036); Repo
open (2048); ISF (2021)
SCS
1.21.2025.1
2.2036
0 4,501 864 0 3,293 8,658
25Standardized
CanisterClass 1
21 PWR STADs loaded at Rx (2025);
21 PWR WP confirmed (2036); Repo
open (2048); ISF (2021)
SCS
1.21.2025.2
1.2036
0 0 3,613 0 3,293 6,906
26Standardized
CanisterClass 1
21 PWR STADs loaded at Rx (2025);
37 PWR WP selected (2036); Repo
open (2048); ISF (2021)
SCS
1.21.2025.3
7.2036
0 0 866 1,541 3,293 5,700
27Standardized
CanisterClass 2
4 PWR STADs loaded at Rx (2025);
4 PWR WP confirmed (2036); Repo
open (2048); ISF (2026)
SCS
2.4.2025.4.2
036
26,642 0 0 0 3,549 30,191
28Standardized
CanisterClass 2
12 PWR STADs loaded at Rx (2025);
12 PWR WP confirmed (2036); Repo
open (2048); ISF (2026)
SCS
2.12.2025.1
2.2036
0 8,351 0 0 3,549 11,900
29Standardized
CanisterClass 2
21 PWR STADs loaded at Rx (2025);
21 PWR WP confirmed (2036); Repo
open (2048); ISF (2026)
SCS
2.21.2025.2
1.2036
0 0 5,249 0 3,549 8,798
30Standardized
CanisterClass 3
4 PWR STADs loaded at Rx (2025);
4 PWR WP confirmed (2036); Repo
open (2048); no ISF
SCS
3.4.2025.4.2
036
53,557 0 0 0 3,549 57,106
31Standardized
CanisterClass 3
4 PWR STADs loaded at Rx (2025);
12 PWR WP selected (2036); Repo
open (2048); no ISF
SCS
3.4.2025.12.
2036
13,672 12,809 0 0 3,549 30,030
32Standardized
CanisterClass 3
4 PWR STADs loaded at Rx (2025);
21 PWR WP selected (2036); Repo
open (2048); no ISF
SCS
3.4.2025.21.
2036
13,672 0 7,994 0 3,549 25,215
33Standardized
CanisterClass 3
4 PWR STADs loaded at Rx (2025);
37 PWR WP selected (2036); Repo
open (2048); no ISF
SCS
3.4.2025.37.
2036
13,672 0 0 4,328 3,549 21,549
34Standardized
CanisterClass 3
12 PWR STADs loaded at Rx (2025);
4 PWR WP selected (2036); Repo
open (2048); no ISF
SCS
3.12.2025.4.
2036
40,597 4,320 0 0 3,549 48,466
35Standardized
CanisterClass 3
12 PWR STADs loaded at Rx (2025);
12 PWR WP confirmed (2036); Repo
open (2048); no ISF
SCS
3.12.2025.1
2.2036
0 16,822 0 0 3,549 20,371
36Standardized
CanisterClass 3
12 PWR STADs loaded at Rx (2025);
21 PWR WP selected (2036); Repo
open (2048); no ISF
SCS
3.12.2025.2
1.2036
0 4,320 7,972 0 3,549 15,841
37Standardized
CanisterClass 3
12 PWR STADs loaded at Rx (2025);
37 PWR WP selected (2036); Repo
open (2048); no ISF
SCS
3.12.2025.3
7.2036
0 4,320 0 4,318 3,549 12,187
38Standardized
CanisterClass 3
21 PWR STADs loaded at Rx (2025);
4 PWR WP selected (2036); Repo
open (2048); no ISF
SCS
3.21.2025.4.
2036
40,530 0 2,710 0 3,549 46,789
39Standardized
CanisterClass 3
21 PWR STADs loaded at Rx (2025);
12 PWR WP selected (2036); Repo
open (2048); no ISF
SCS
3.21.2025.1
2.2036
0 12,759 2,710 0 3,549 19,018

Initial Standardized Canister System Evaluation September 2015 83
Table A-1 Maximum number of canisters in storage at reactors for each scenario (Continued)
Scenario # Major Class Scenario Class Scenario Description
Scenario
Description
Numbering
Maximum
Number of
4 PWR
Canisters in
Storage
Maximum
Number of
12 PWR
Canisters in
Storage
Maximum
Number of
21 PWR
Canisters in
Storage
Maximum
Number of
37 PWR
Canisters in
Storage
Maximum
Number of
DPCs in
Storage
Maximum
Number of
Canisters
(Any Type)
in Storage
40Standardized
CanisterClass 3
21 PWR STADs loaded at Rx (2025);
21 PWR WP confirmed (2036); Repo
open (2048); no ISF
SCS
3.21.2025.2
1.2036
0 0 10,518 0 3,549 14,067
41Standardized
CanisterClass 3
21 PWR STADs loaded at Rx (2025);
37 PWR WP selected (2036); Repo
open (2048); no ISF
SCS
3.21.2025.3
7.2036
0 0 2,710 4,309 3,549 10,568
42Standardized
CanisterClass 4
4 PWR STADs loaded at Rx (2030);
4 PWR WP confirmed (2036); Repo
open (2048); ISF (2026)
SCS
4.4.2030.4.2
036
21,018 0 0 0 4,129 25,147
43Standardized
CanisterClass 4
12 PWR STADs loaded at Rx (2030);
12 PWR WP confirmed (2036); Repo
open (2048); ISF (2026)
SCS
4.12.2030.1
2.2036
0 6,595 0 0 4,129 10,724
44Standardized
CanisterClass 4
21 PWR STADs loaded at Rx (2030);
21 PWR WP confirmed (2036); Repo
open (2048); ISF (2026)
SCS
4.21.2030.2
1.2036
0 0 4,150 0 4,129 8,279
45Standardized
CanisterClass 5
4 PWR STADs loaded at Rx (2025);
21 PWR WP selected (2030); Repo
open (2042); ISF (2021)
SCS
5.4.2025.21.
2030
3,273 0 3,033 0 3,293 9,599
46Standardized
CanisterClass 5
12 PWR STADs loaded at Rx (2025);
21 PWR WP selected (2030); Repo
open (2042); ISF (2021)
SCS
5.12.2025.2
1.2030
0 1,042 3,026 0 3,293 7,361
47Standardized
CanisterClass 5
12 PWR STADs loaded at Rx (2025);
4 PWR WP selected (2030); Repo
open (2042); ISF (2021)
SCS
5.12.2025.4.
2030
15,281 1,042 0 0 3,293 19,616
48Standardized
CanisterClass 5
21 PWR STADs loaded at Rx (2025);
4 PWR WP selected (2030); Repo
open (2042); ISF (2021)
SCS
5.21.2025.4.
2030
15,226 0 665 0 3,293 19,184
49Standardized
CanisterClass 6
4 PWR STADs loaded at Rx (2025);
21 PWR WP selected (2040); Repo
open (2050); ISF (2021)
SCS
6.4.2025.21.
2040
7,799 0 2,263 0 3,293 13,355
50Standardized
CanisterClass 6
12 PWR STADs loaded at Rx (2025);
21 PWR WP selected (2040); Repo
open (2050); ISF (2021)
SCS
6.12.2025.2
1.2040
0 2,428 2,255 0 3,293 7,976
51Standardized
CanisterClass 6
12 PWR STADs loaded at Rx (2025);
4 PWR WP selected (2040); Repo
open (2050); ISF (2021)
SCS
6.12.2025.4.
2040
11,448 2,428 0 0 3,293 17,169
52Standardized
CanisterClass 6
21 PWR STADs loaded at Rx (2025);
4 PWR WP selected (2040); Repo
open (2050); ISF (2021)
SCS
6.21.2025.4.
2040
11,416 0 1,561 0 3,293 16,270
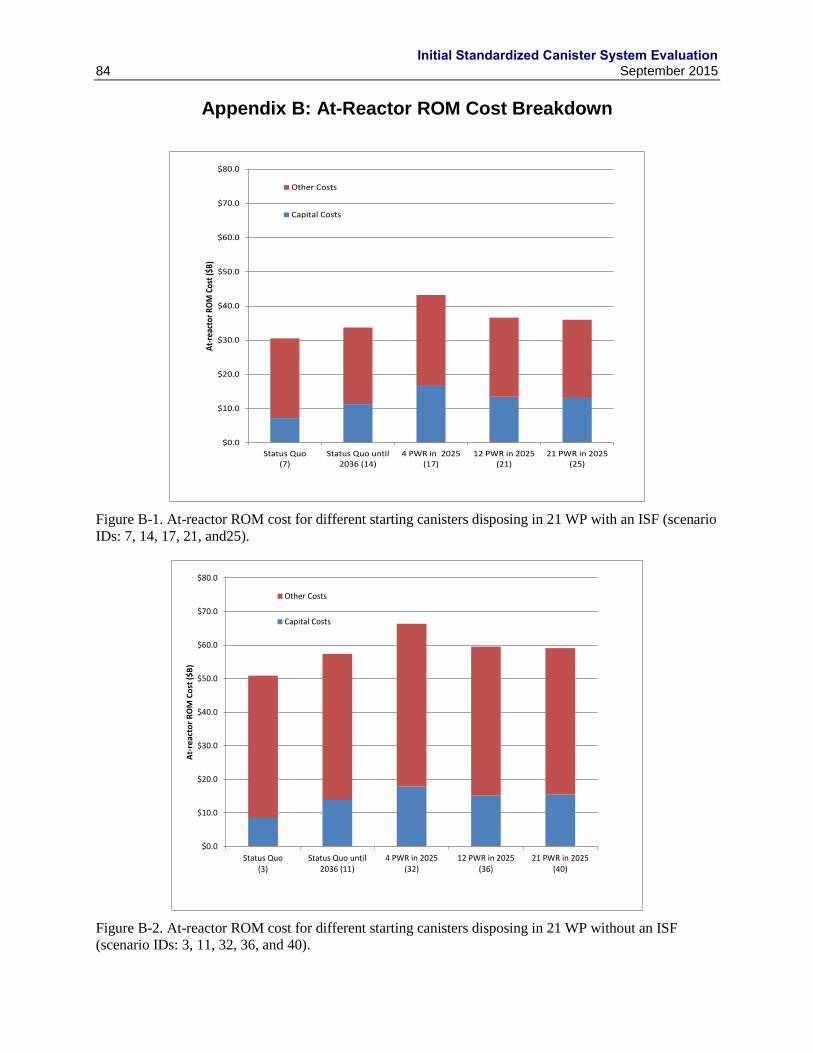
Initial Standardized Canister System Evaluation 84 September 2015
Appendix B: At-Reactor ROM Cost Breakdown
Figure B-1. At-reactor ROM cost for different starting canisters disposing in 21 WP with an ISF (scenario
IDs: 7, 14, 17, 21, and25).
Figure B-2. At-reactor ROM cost for different starting canisters disposing in 21 WP without an ISF
(scenario IDs: 3, 11, 32, 36, and 40).
$0.0
$10.0
$20.0
$30.0
$40.0
$50.0
$60.0
$70.0
$80.0
Status Quo(7)
Status Quo until2036 (14)
4 PWR in 2025(17)
12 PWR in 2025(21)
21 PWR in 2025(25)
At-
reac
tor
RO
M C
ost
($B
)
Other Costs
Capital Costs
$0.0
$10.0
$20.0
$30.0
$40.0
$50.0
$60.0
$70.0
$80.0
Status Quo(3)
Status Quo until2036 (11)
4 PWR in 2025(32)
12 PWR in 2025(36)
21 PWR in 2025(40)
At-
rea
cto
r R
OM
Co
st (
$B
)
Other Costs
Capital Costs

Initial Standardized Canister System Evaluation September 2015 85
Figure B-3. At-reactor ROM cost for different starting canisters disposing in 12 WP with an ISF (scenario
IDs: 6, 13, 16, 20, and 24).
Figure B-4. At-reactor ROM cost for different starting canisters disposing in 12 WP without an ISF
(scenario IDs: 2, 10, 31, 35, and 39).
$0.0
$10.0
$20.0
$30.0
$40.0
$50.0
$60.0
$70.0
$80.0
Status Quo(6)
Status Quo until2036 (13)
4 PWR in 2025(16)
12 PWR in 2025(20)
21 PWR in 2025(24)
At-
rea
cto
r R
OM
Co
st (
$B
)
Other Costs
Capital Costs
$0.0
$10.0
$20.0
$30.0
$40.0
$50.0
$60.0
$70.0
$80.0
Status Quo(2)
Status Quo until2036 (10)
4 PWR in 2025(31)
12 PWR in 2025(35)
21 PWR in 2025(39)
At-
reac
tor
RO
M C
ost
($
B)
Other Costs
Capital Costs
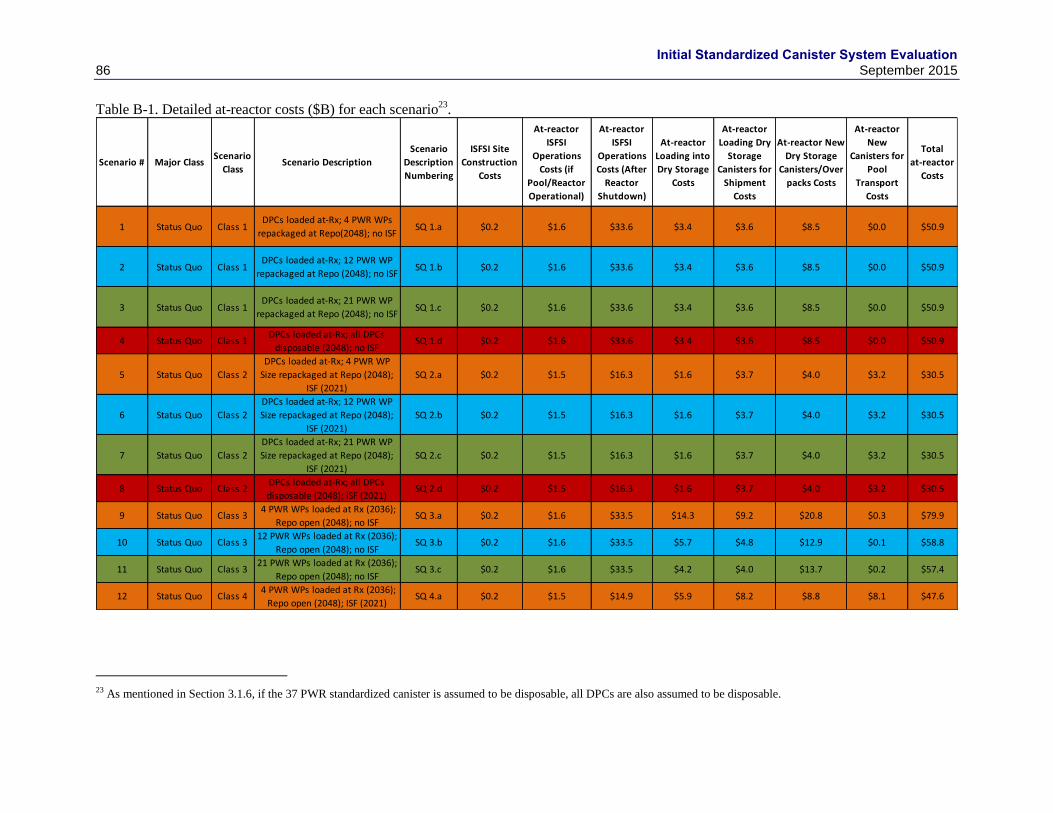
Initial Standardized Canister System Evaluation 86 September 2015
Table B-1. Detailed at-reactor costs ($B) for each scenario23
.
23 As mentioned in Section 3.1.6, if the 37 PWR standardized canister is assumed to be disposable, all DPCs are also assumed to be disposable.
Scenario # Major ClassScenario
ClassScenario Description
Scenario
Description
Numbering
ISFSI Site
Construction
Costs
At-reactor
ISFSI
Operations
Costs (if
Pool/Reactor
Operational)
At-reactor
ISFSI
Operations
Costs (After
Reactor
Shutdown)
At-reactor
Loading into
Dry Storage
Costs
At-reactor
Loading Dry
Storage
Canisters for
Shipment
Costs
At-reactor New
Dry Storage
Canisters/Over
packs Costs
At-reactor
New
Canisters for
Pool
Transport
Costs
Total
at-reactor
Costs
1 Status Quo Class 1DPCs loaded at-Rx; 4 PWR WPs
repackaged at Repo(2048); no ISFSQ 1.a $0.2 $1.6 $33.6 $3.4 $3.6 $8.5 $0.0 $50.9
2 Status Quo Class 1DPCs loaded at-Rx; 12 PWR WP
repackaged at Repo (2048); no ISFSQ 1.b $0.2 $1.6 $33.6 $3.4 $3.6 $8.5 $0.0 $50.9
3 Status Quo Class 1DPCs loaded at-Rx; 21 PWR WP
repackaged at Repo (2048); no ISFSQ 1.c $0.2 $1.6 $33.6 $3.4 $3.6 $8.5 $0.0 $50.9
4 Status Quo Class 1DPCs loaded at-Rx; all DPCs
disposable (2048); no ISFSQ 1.d $0.2 $1.6 $33.6 $3.4 $3.6 $8.5 $0.0 $50.9
5 Status Quo Class 2
DPCs loaded at-Rx; 4 PWR WP
Size repackaged at Repo (2048);
ISF (2021)
SQ 2.a $0.2 $1.5 $16.3 $1.6 $3.7 $4.0 $3.2 $30.5
6 Status Quo Class 2
DPCs loaded at-Rx; 12 PWR WP
Size repackaged at Repo (2048);
ISF (2021)
SQ 2.b $0.2 $1.5 $16.3 $1.6 $3.7 $4.0 $3.2 $30.5
7 Status Quo Class 2
DPCs loaded at-Rx; 21 PWR WP
Size repackaged at Repo (2048);
ISF (2021)
SQ 2.c $0.2 $1.5 $16.3 $1.6 $3.7 $4.0 $3.2 $30.5
8 Status Quo Class 2DPCs loaded at-Rx; all DPCs
disposable (2048); ISF (2021)SQ 2.d $0.2 $1.5 $16.3 $1.6 $3.7 $4.0 $3.2 $30.5
9 Status Quo Class 3 4 PWR WPs loaded at Rx (2036);
Repo open (2048); no ISFSQ 3.a $0.2 $1.6 $33.5 $14.3 $9.2 $20.8 $0.3 $79.9
10 Status Quo Class 312 PWR WPs loaded at Rx (2036);
Repo open (2048); no ISFSQ 3.b $0.2 $1.6 $33.5 $5.7 $4.8 $12.9 $0.1 $58.8
11 Status Quo Class 321 PWR WPs loaded at Rx (2036);
Repo open (2048); no ISFSQ 3.c $0.2 $1.6 $33.5 $4.2 $4.0 $13.7 $0.2 $57.4
12 Status Quo Class 4 4 PWR WPs loaded at Rx (2036);
Repo open (2048); ISF (2021)SQ 4.a $0.2 $1.5 $14.9 $5.9 $8.2 $8.8 $8.1 $47.6
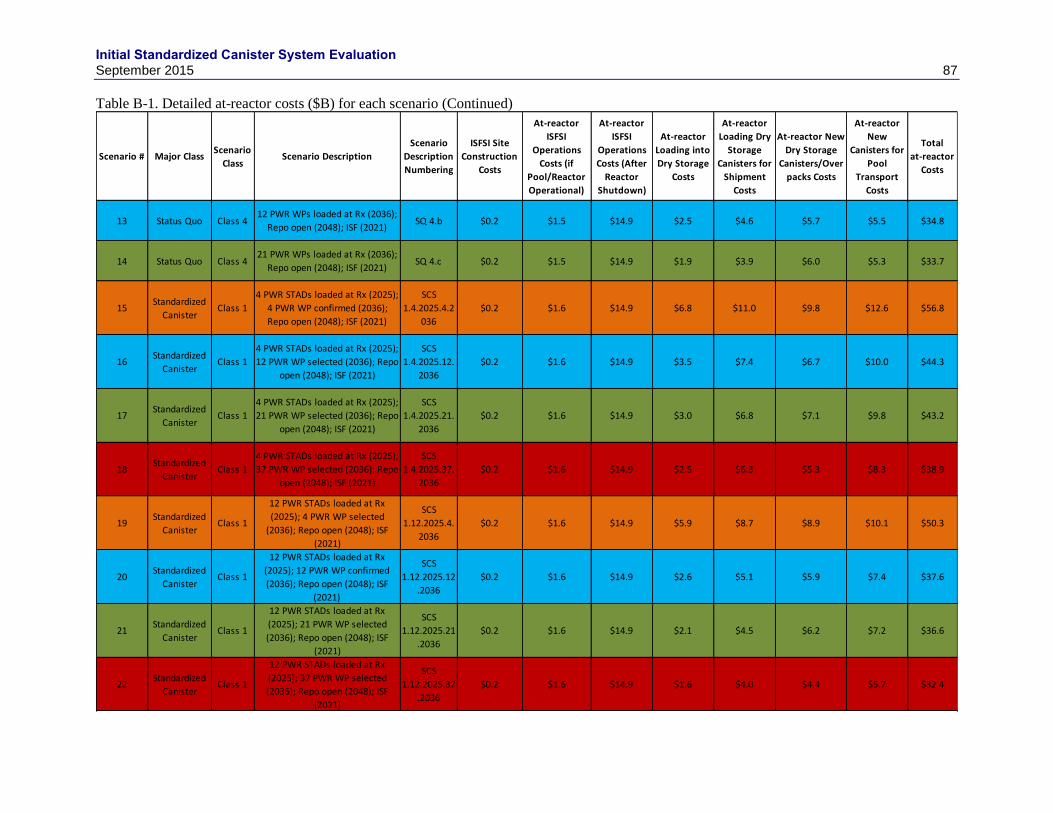
Initial Standardized Canister System Evaluation September 2015 87
Table B-1. Detailed at-reactor costs ($B) for each scenario (Continued)
Scenario # Major ClassScenario
ClassScenario Description
Scenario
Description
Numbering
ISFSI Site
Construction
Costs
At-reactor
ISFSI
Operations
Costs (if
Pool/Reactor
Operational)
At-reactor
ISFSI
Operations
Costs (After
Reactor
Shutdown)
At-reactor
Loading into
Dry Storage
Costs
At-reactor
Loading Dry
Storage
Canisters for
Shipment
Costs
At-reactor New
Dry Storage
Canisters/Over
packs Costs
At-reactor
New
Canisters for
Pool
Transport
Costs
Total
at-reactor
Costs
13 Status Quo Class 412 PWR WPs loaded at Rx (2036);
Repo open (2048); ISF (2021)SQ 4.b $0.2 $1.5 $14.9 $2.5 $4.6 $5.7 $5.5 $34.8
14 Status Quo Class 421 PWR WPs loaded at Rx (2036);
Repo open (2048); ISF (2021)SQ 4.c $0.2 $1.5 $14.9 $1.9 $3.9 $6.0 $5.3 $33.7
15Standardized
CanisterClass 1
4 PWR STADs loaded at Rx (2025);
4 PWR WP confirmed (2036);
Repo open (2048); ISF (2021)
SCS
1.4.2025.4.2
036
$0.2 $1.6 $14.9 $6.8 $11.0 $9.8 $12.6 $56.8
16Standardized
CanisterClass 1
4 PWR STADs loaded at Rx (2025);
12 PWR WP selected (2036); Repo
open (2048); ISF (2021)
SCS
1.4.2025.12.
2036
$0.2 $1.6 $14.9 $3.5 $7.4 $6.7 $10.0 $44.3
17Standardized
CanisterClass 1
4 PWR STADs loaded at Rx (2025);
21 PWR WP selected (2036); Repo
open (2048); ISF (2021)
SCS
1.4.2025.21.
2036
$0.2 $1.6 $14.9 $3.0 $6.8 $7.1 $9.8 $43.2
18Standardized
CanisterClass 1
4 PWR STADs loaded at Rx (2025);
37 PWR WP selected (2036); Repo
open (2048); ISF (2021)
SCS
1.4.2025.37.
2036
$0.2 $1.6 $14.9 $2.5 $6.3 $5.3 $8.3 $38.9
19Standardized
CanisterClass 1
12 PWR STADs loaded at Rx
(2025); 4 PWR WP selected
(2036); Repo open (2048); ISF
(2021)
SCS
1.12.2025.4.
2036
$0.2 $1.6 $14.9 $5.9 $8.7 $8.9 $10.1 $50.3
20Standardized
CanisterClass 1
12 PWR STADs loaded at Rx
(2025); 12 PWR WP confirmed
(2036); Repo open (2048); ISF
(2021)
SCS
1.12.2025.12
.2036
$0.2 $1.6 $14.9 $2.6 $5.1 $5.9 $7.4 $37.6
21Standardized
CanisterClass 1
12 PWR STADs loaded at Rx
(2025); 21 PWR WP selected
(2036); Repo open (2048); ISF
(2021)
SCS
1.12.2025.21
.2036
$0.2 $1.6 $14.9 $2.1 $4.5 $6.2 $7.2 $36.6
22Standardized
CanisterClass 1
12 PWR STADs loaded at Rx
(2025); 37 PWR WP selected
(2036); Repo open (2048); ISF
(2021)
SCS
1.12.2025.37
.2036
$0.2 $1.6 $14.9 $1.6 $4.0 $4.4 $5.7 $32.4
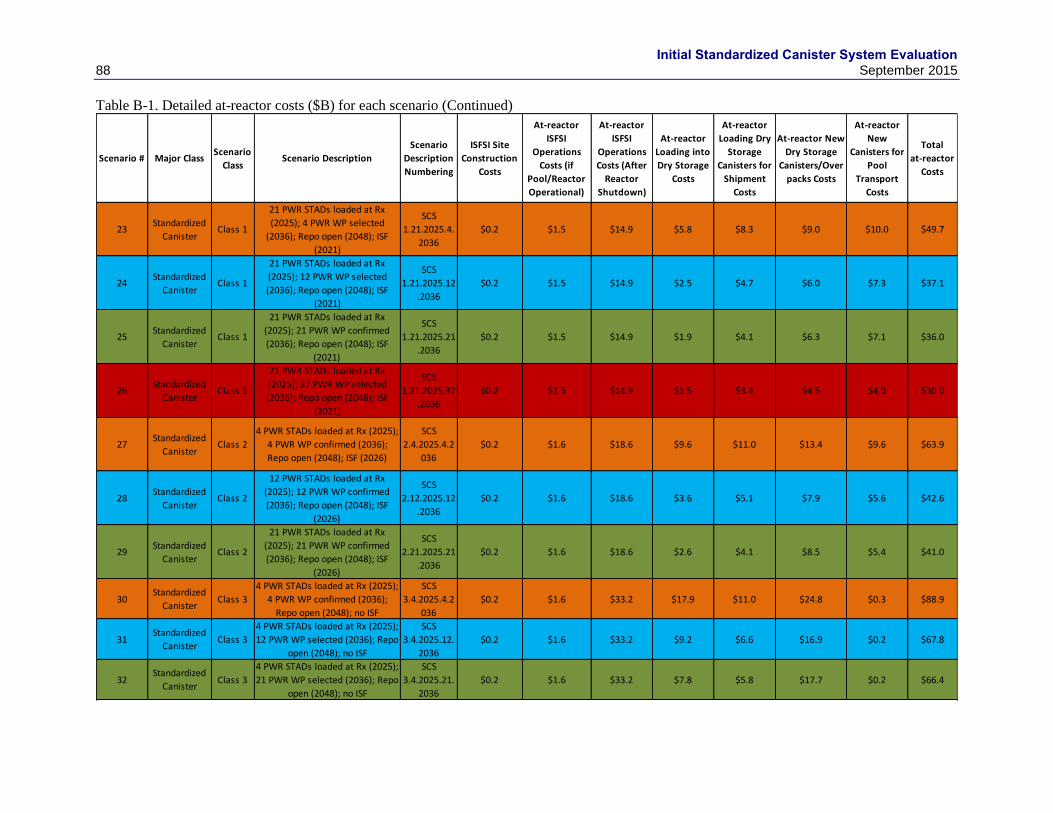
Initial Standardized Canister System Evaluation 88 September 2015
Table B-1. Detailed at-reactor costs ($B) for each scenario (Continued)
Scenario # Major ClassScenario
ClassScenario Description
Scenario
Description
Numbering
ISFSI Site
Construction
Costs
At-reactor
ISFSI
Operations
Costs (if
Pool/Reactor
Operational)
At-reactor
ISFSI
Operations
Costs (After
Reactor
Shutdown)
At-reactor
Loading into
Dry Storage
Costs
At-reactor
Loading Dry
Storage
Canisters for
Shipment
Costs
At-reactor New
Dry Storage
Canisters/Over
packs Costs
At-reactor
New
Canisters for
Pool
Transport
Costs
Total
at-reactor
Costs
23Standardized
CanisterClass 1
21 PWR STADs loaded at Rx
(2025); 4 PWR WP selected
(2036); Repo open (2048); ISF
(2021)
SCS
1.21.2025.4.
2036
$0.2 $1.5 $14.9 $5.8 $8.3 $9.0 $10.0 $49.7
24Standardized
CanisterClass 1
21 PWR STADs loaded at Rx
(2025); 12 PWR WP selected
(2036); Repo open (2048); ISF
(2021)
SCS
1.21.2025.12
.2036
$0.2 $1.5 $14.9 $2.5 $4.7 $6.0 $7.3 $37.1
25Standardized
CanisterClass 1
21 PWR STADs loaded at Rx
(2025); 21 PWR WP confirmed
(2036); Repo open (2048); ISF
(2021)
SCS
1.21.2025.21
.2036
$0.2 $1.5 $14.9 $1.9 $4.1 $6.3 $7.1 $36.0
26Standardized
CanisterClass 1
21 PWR STADs loaded at Rx
(2025); 37 PWR WP selected
(2036); Repo open (2048); ISF
(2021)
SCS
1.21.2025.37
.2036
$0.2 $1.5 $14.9 $1.5 $3.4 $4.5 $4.0 $30.0
27Standardized
CanisterClass 2
4 PWR STADs loaded at Rx (2025);
4 PWR WP confirmed (2036);
Repo open (2048); ISF (2026)
SCS
2.4.2025.4.2
036
$0.2 $1.6 $18.6 $9.6 $11.0 $13.4 $9.6 $63.9
28Standardized
CanisterClass 2
12 PWR STADs loaded at Rx
(2025); 12 PWR WP confirmed
(2036); Repo open (2048); ISF
(2026)
SCS
2.12.2025.12
.2036
$0.2 $1.6 $18.6 $3.6 $5.1 $7.9 $5.6 $42.6
29Standardized
CanisterClass 2
21 PWR STADs loaded at Rx
(2025); 21 PWR WP confirmed
(2036); Repo open (2048); ISF
(2026)
SCS
2.21.2025.21
.2036
$0.2 $1.6 $18.6 $2.6 $4.1 $8.5 $5.4 $41.0
30Standardized
CanisterClass 3
4 PWR STADs loaded at Rx (2025);
4 PWR WP confirmed (2036);
Repo open (2048); no ISF
SCS
3.4.2025.4.2
036
$0.2 $1.6 $33.2 $17.9 $11.0 $24.8 $0.3 $88.9
31Standardized
CanisterClass 3
4 PWR STADs loaded at Rx (2025);
12 PWR WP selected (2036); Repo
open (2048); no ISF
SCS
3.4.2025.12.
2036
$0.2 $1.6 $33.2 $9.2 $6.6 $16.9 $0.2 $67.8
32Standardized
CanisterClass 3
4 PWR STADs loaded at Rx (2025);
21 PWR WP selected (2036); Repo
open (2048); no ISF
SCS
3.4.2025.21.
2036
$0.2 $1.6 $33.2 $7.8 $5.8 $17.7 $0.2 $66.4

Initial Standardized Canister System Evaluation September 2015 89
Table B-1. Detailed at-reactor costs ($B) for each scenario (Continued)
Scenario # Major ClassScenario
ClassScenario Description
Scenario
Description
Numbering
ISFSI Site
Construction
Costs
At-reactor
ISFSI
Operations
Costs (if
Pool/Reactor
Operational)
At-reactor
ISFSI
Operations
Costs (After
Reactor
Shutdown)
At-reactor
Loading into
Dry Storage
Costs
At-reactor
Loading Dry
Storage
Canisters for
Shipment
Costs
At-reactor New
Dry Storage
Canisters/Over
packs Costs
At-reactor
New
Canisters for
Pool
Transport
Costs
Total
at-reactor
Costs
33Standardized
CanisterClass 3
4 PWR STADs loaded at Rx (2025);
37 PWR WP selected (2036); Repo
open (2048); no ISF
SCS
3.4.2025.37.
2036
$0.2 $1.6 $33.2 $6.6 $5.2 $13.0 $0.1 $59.9
34Standardized
CanisterClass 3
12 PWR STADs loaded at Rx
(2025); 4 PWR WP selected
(2036); Repo open (2048); no ISF
SCS
3.12.2025.4.
2036
$0.2 $1.6 $33.2 $15.0 $9.6 $22.2 $0.3 $82.1
35Standardized
CanisterClass 3
12 PWR STADs loaded at Rx
(2025); 12 PWR WP confirmed
(2036); Repo open (2048); no ISF
SCS
3.12.2025.12
.2036
$0.2 $1.6 $33.2 $6.4 $5.2 $14.3 $0.2 $61.0
36Standardized
CanisterClass 3
12 PWR STADs loaded at Rx
(2025); 21 PWR WP selected
(2036); Repo open (2048); no ISF
SCS
3.12.2025.21
.2036
$0.2 $1.6 $33.2 $4.9 $4.4 $15.1 $0.2 $59.5
37Standardized
CanisterClass 3
12 PWR STADs loaded at Rx
(2025); 37 PWR WP selected
(2036); Repo open (2048); no ISF
SCS
3.12.2025.37
.2036
$0.2 $1.6 $33.2 $3.8 $3.8 $10.4 $0.1 $53.1
38Standardized
CanisterClass 3
21 PWR STADs loaded at Rx
(2025); 4 PWR WP selected
(2036); Repo open (2048); no ISF
SCS
3.21.2025.4.
2036
$0.2 $1.6 $33.2 $14.5 $9.4 $22.4 $0.3 $81.6
39Standardized
CanisterClass 3
21 PWR STADs loaded at Rx
(2025); 12 PWR WP selected
(2036); Repo open (2048); no ISF
SCS
3.21.2025.12
.2036
$0.2 $1.6 $33.2 $5.9 $4.9 $14.5 $0.2 $60.5
40Standardized
CanisterClass 3
21 PWR STADs loaded at Rx
(2025); 21 PWR WP confirmed
(2036); Repo open (2048); no ISF
SCS
3.21.2025.21
.2036
$0.2 $1.6 $33.2 $4.5 $4.2 $15.3 $0.2 $59.1
41Standardized
CanisterClass 3
21 PWR STADs loaded at Rx
(2025); 37 PWR WP selected
(2036); Repo open (2048); no ISF
SCS
3.21.2025.37
.2036
$0.2 $1.6 $33.2 $3.3 $3.6 $10.7 $0.1 $52.6
42Standardized
CanisterClass 4
4 PWR STADs loaded at Rx (2030);
4 PWR WP confirmed (2036);
Repo open (2048); ISF (2026)
SCS
4.4.2030.4.2
036
$0.2 $1.6 $18.6 $7.9 $10.2 $11.5 $9.7 $59.7
43Standardized
CanisterClass 4
12 PWR STADs loaded at Rx
(2030); 12 PWR WP confirmed
(2036); Repo open (2048); ISF
(2026)
SCS
4.12.2030.12
.2036
$0.2 $1.6 $18.6 $3.3 $4.9 $7.2 $5.7 $41.5

Initial Standardized Canister System Evaluation 90 September 2015
Table B-1. Detailed at-reactor costs ($B) for each scenario (Continued)
Scenario # Major ClassScenario
ClassScenario Description
Scenario
Description
Numbering
ISFSI Site
Construction
Costs
At-reactor
ISFSI
Operations
Costs (if
Pool/Reactor
Operational)
At-reactor
ISFSI
Operations
Costs (After
Reactor
Shutdown)
At-reactor
Loading into
Dry Storage
Costs
At-reactor
Loading Dry
Storage
Canisters for
Shipment
Costs
At-reactor New
Dry Storage
Canisters/Over
packs Costs
At-reactor
New
Canisters for
Pool
Transport
Costs
Total
at-reactor
Costs
44Standardized
CanisterClass 4
21 PWR STADs loaded at Rx
(2030); 21 PWR WP confirmed
(2036); Repo open (2048); ISF
(2026)
SCS
4.21.2030.21
.2036
$0.2 $1.6 $18.6 $2.5 $4.1 $7.7 $5.4 $40.1
45Standardized
CanisterClass 5
4 PWR STADs loaded at Rx (2025);
21 PWR WP selected (2030); Repo
open (2042); ISF (2021)
SCS
5.4.2025.21.
2030
$0.2 $1.6 $14.9 $2.7 $5.4 $6.9 $8.3 $39.9
46Standardized
CanisterClass 5
12 PWR STADs loaded at Rx
(2025); 21 PWR WP selected
(2030); Repo open (2042); ISF
(2021)
SCS
5.12.2025.21
.2030
$0.2 $1.6 $14.9 $2.0 $4.3 $6.2 $7.1 $36.3
47Standardized
CanisterClass 5
12 PWR STADs loaded at Rx
(2025); 4 PWR WP selected
(2030); Repo open (2042); ISF
(2021)
SCS
5.12.2025.4.
2030
$0.2 $1.6 $14.9 $6.2 $9.9 $9.1 $11.5 $53.3
48Standardized
CanisterClass 5
21 PWR STADs loaded at Rx
(2025); 4 PWR WP selected
(2030); Repo open (2042); ISF
(2021)
SCS
5.21.2025.4.
2030
$0.2 $1.5 $14.9 $6.0 $9.7 $9.2 $11.5 $52.9
49Standardized
CanisterClass 6
4 PWR STADs loaded at Rx (2025);
21 PWR WP selected (2040); Repo
open (2050); ISF (2021)
SCS
6.4.2025.21.
2040
$0.2 $1.6 $14.9 $3.8 $7.9 $7.6 $10.9 $46.8
50Standardized
CanisterClass 6
12 PWR STADs loaded at Rx
(2025); 21 PWR WP selected
(2040); Repo open (2050); ISF
(2021)
SCS
6.12.2025.21
.2040
$0.2 $1.6 $14.9 $2.2 $4.7 $6.1 $7.3 $36.9
51Standardized
CanisterClass 6
12 PWR STADs loaded at Rx
(2025); 4 PWR WP selected
(2040); Repo open (2050); ISF
(2021)
SCS
6.12.2025.4.
2040
$0.2 $1.6 $14.9 $5.2 $7.7 $8.2 $9.2 $47.0
52Standardized
CanisterClass 6
21 PWR STADs loaded at Rx
(2025); 4 PWR WP selected
(2040); Repo open (2050); ISF
(2021)
SCS
6.21.2025.4.
2040
$0.2 $1.5 $14.9 $4.9 $7.2 $8.3 $9.1 $46.0
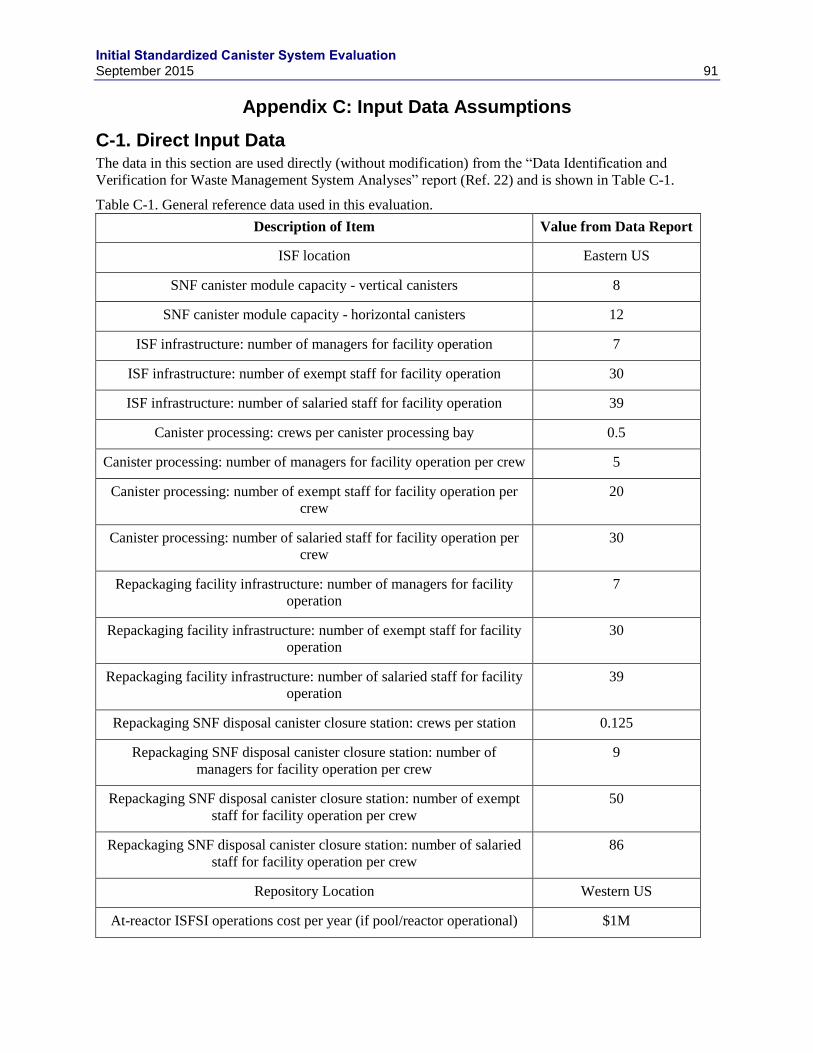
Initial Standardized Canister System Evaluation September 2015 91
Appendix C: Input Data Assumptions
C-1. Direct Input Data The data in this section are used directly (without modification) from the “Data Identification and
Verification for Waste Management System Analyses” report (Ref. 22) and is shown in Table C-1.
Table C-1. General reference data used in this evaluation.
Description of Item Value from Data Report
ISF location Eastern US
SNF canister module capacity - vertical canisters 8
SNF canister module capacity - horizontal canisters 12
ISF infrastructure: number of managers for facility operation 7
ISF infrastructure: number of exempt staff for facility operation 30
ISF infrastructure: number of salaried staff for facility operation 39
Canister processing: crews per canister processing bay 0.5
Canister processing: number of managers for facility operation per crew 5
Canister processing: number of exempt staff for facility operation per
crew
20
Canister processing: number of salaried staff for facility operation per
crew
30
Repackaging facility infrastructure: number of managers for facility
operation
7
Repackaging facility infrastructure: number of exempt staff for facility
operation
30
Repackaging facility infrastructure: number of salaried staff for facility
operation
39
Repackaging SNF disposal canister closure station: crews per station 0.125
Repackaging SNF disposal canister closure station: number of
managers for facility operation per crew
9
Repackaging SNF disposal canister closure station: number of exempt
staff for facility operation per crew
50
Repackaging SNF disposal canister closure station: number of salaried
staff for facility operation per crew
86
Repository Location Western US
At-reactor ISFSI operations cost per year (if pool/reactor operational) $1M

Initial Standardized Canister System Evaluation 92 September 2015
At-reactor ISFSI operations cost per year (if pool/reactor shutdown) $10M
At-reactor pool operations costs per year (if reactor shutdown) $30M
At-reactor pool to ISFSI loading cost per campaign $0.75M
At-reactor pool to transportation cask loading cost per campaign $0.75M
At-reactor ISFSI to transportation cask loading cost per campaign $0.75M
At-reactor ISFSI to transportation cask loading cost per cask24
$0.3M
Buffer railcar capital cost $1.5M
Escort railcar capital cost $6M
Cask trailer capital cost $0.05M
Escort truck capital cost $0.05M
ISF infrastructure cost25
$116.3M
ISF D&D cost: fraction of all capital costs 0.1
ISF canister processing bay capital cost $73.8M
Dry storage module capital cost: vertical canisters (cost per module) $8.2M
Dry storage module capital cost: horizontal canisters (cost per module) $15.8M
Repackaging facility D&D cost: fraction of all Capital Costs 0.1
Barge speed 2 mph
Mainline rail track classes A, B, and C speed 55 mph
Mainline rail track classes G, H, and X speed and shortline rail 20 mph
24 The same loading costs are used for all canister/cask types 25 This cost includes conceptual design, site improvement and infrastructure, and balance of plant.
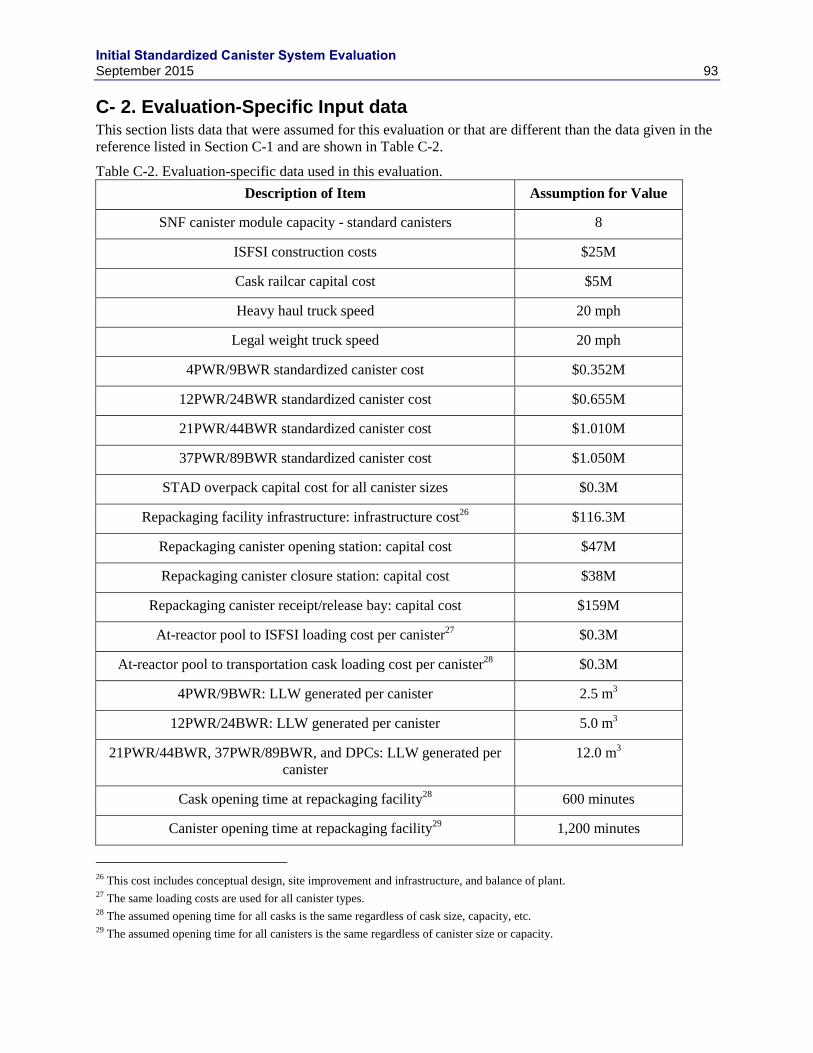
Initial Standardized Canister System Evaluation September 2015 93
C- 2. Evaluation-Specific Input data This section lists data that were assumed for this evaluation or that are different than the data given in the
reference listed in Section C-1 and are shown in Table C-2.
Table C-2. Evaluation-specific data used in this evaluation.
Description of Item Assumption for Value
SNF canister module capacity - standard canisters 8
ISFSI construction costs $25M
Cask railcar capital cost $5M
Heavy haul truck speed 20 mph
Legal weight truck speed 20 mph
4PWR/9BWR standardized canister cost $0.352M
12PWR/24BWR standardized canister cost $0.655M
21PWR/44BWR standardized canister cost $1.010M
37PWR/89BWR standardized canister cost $1.050M
STAD overpack capital cost for all canister sizes $0.3M
Repackaging facility infrastructure: infrastructure cost26
$116.3M
Repackaging canister opening station: capital cost $47M
Repackaging canister closure station: capital cost $38M
Repackaging canister receipt/release bay: capital cost $159M
At-reactor pool to ISFSI loading cost per canister27
$0.3M
At-reactor pool to transportation cask loading cost per canister28
$0.3M
4PWR/9BWR: LLW generated per canister 2.5 m3
12PWR/24BWR: LLW generated per canister 5.0 m3
21PWR/44BWR, 37PWR/89BWR, and DPCs: LLW generated per
canister
12.0 m3
Cask opening time at repackaging facility28
600 minutes
Canister opening time at repackaging facility29
1,200 minutes
26 This cost includes conceptual design, site improvement and infrastructure, and balance of plant. 27 The same loading costs are used for all canister types. 28 The assumed opening time for all casks is the same regardless of cask size, capacity, etc. 29 The assumed opening time for all canisters is the same regardless of canister size or capacity.

Initial Standardized Canister System Evaluation 94 September 2015
Description of Item Assumption for Value
Canister closing time at repackaging facility30
1,500 minutes
Time required to handle a cask (e.g., receipt, shipment) at the ISF or
the repackaging facility31
720 minutes
30 The assumed closing time for all canisters is the same regardless of canister size or capacity. 31 The assumed move time for all casks is the same regardless of cask size, capacity, etc.