Initial Misconceptions in Macro Principles Classes - …cook.rfe.org/Misconceptions.pdf · ·...
29
Initial Misconceptions in Macro Principles Classes * William L. Goffe Department of Economics Penn State University [email protected] May, 2013 Abstract Other disciplines have investigated student learning in a more fundamental manner than economics. One of their core findings is that misconceptions that students bring to the classroom hinder their learning. In economics, the study of misconceptions is rarely systemic or formal so attempts to deal with them are at best scattered. This paper aims to start a process of formally identifying common factual misconceptions among principles students with the ultimate goal of aiding learning. Drawing on many sources, a questionnaire was developed to probe possible student misconceptions and it was given to large macro principles class. Many startling misconceptions emerged. 1 Introduction Astute principles instructors have likely noticed their students bring economic misconceptions to the classroom. In- deed, some are well-known, such as views on trade and tax incidence. These and many others are addressed by textbooks and instructors a based on the intuition that misconceptions hinder their students’ learning. As shown be- low, cognitive science strongly concurs with this intuition, but it also has found that misconceptions can be very persistent—simply pointing them out is unlikely to eradicate them. One discipline, physics, has taken this finding and explicitly targets misconceptions and partly as a result can demonstrate improved learning. While many economic misconceptions are well-known (albeit not quantitatively studied), it might be the case that others are unknown to instructors. Citing Hill and Schneider (2006), the physicist Carl Wieman (Wieman, 2007a) notes that novices’ brains literally work differently than experts’. He describes the great difficulty experts have in understanding novices’ thinking and even believing they once thought like a novice. He goes on to describe how instructors might have a difficult time even envisioning student misconceptions. This paper employs several techniques to surmount instructors’ “curse of knowledge” to discover important misconceptions that may hinder learning. Modest learning appears to be the norm in college economics classrooms. As Walstad and Allgood (1999) show, an economics class adds little to college seniors’ economic knowledge. Their data also show that senior business majors, who generally have taken several economics classes, have great difficulty with basic principles-level ques- tions. The reasons for the modest impact of our classes is rarely studied, but cognitive science suggests unaddressed misconceptions may well be one reason. Other disciplines’ experiences adds weight to this hypothesis. This study is limited to “factual misconceptions.” They are defined here as specific incorrect facts that students bring to the classroom and have the potential to hinder their learning. Examples include the belief that many work at the minimum wage, that corporate profits are much higher than economists compute them to be, or that economic growth over recent generations has been very modest. If uncorrected, it is easy to imagine how learning is affected. For this paper’s purposes, a factual misconception is distinct from an economic fallacy as the latter often involve explicit use of economic models; examples include questions of who bears the incidence of a tax or who benefits from * I would like to thank, but not implicate, Lester Hadsell, Richard Hake, Elizabeth Jensen, David Kauper, Travis Letellier, Dirk Mateer, William A. McEachern, Mark Maier, KimMarie McGoldrick, and Scott Simkins. Anita Pratt and Matthew Kole provided very able research assistance. a Wood (2006) and Madariaga (2005) are extensive collections. 1
Transcript of Initial Misconceptions in Macro Principles Classes - …cook.rfe.org/Misconceptions.pdf · ·...

Initial Misconceptions in Macro Principles Classes∗
William L. GoffeDepartment of Economics
Penn State [email protected]
May, 2013
Abstract
Other disciplines have investigated student learning in a more fundamental manner than economics. One of theircore findings is that misconceptions that students bring to the classroom hinder their learning. In economics, thestudy of misconceptions is rarely systemic or formal so attempts to deal with them are at best scattered. This paperaims to start a process of formally identifying common factual misconceptions among principles students with theultimate goal of aiding learning. Drawing on many sources, a questionnaire was developed to probe possible studentmisconceptions and it was given to large macro principles class. Many startling misconceptions emerged.
1 IntroductionAstute principles instructors have likely noticed their students bring economic misconceptions to the classroom. In-deed, some are well-known, such as views on trade and tax incidence. These and many others are addressed bytextbooks and instructorsa based on the intuition that misconceptions hinder their students’ learning. As shown be-low, cognitive science strongly concurs with this intuition, but it also has found that misconceptions can be verypersistent—simply pointing them out is unlikely to eradicate them. One discipline, physics, has taken this finding andexplicitly targets misconceptions and partly as a result can demonstrate improved learning.
While many economic misconceptions are well-known (albeit not quantitatively studied), it might be the case thatothers are unknown to instructors. Citing Hill and Schneider (2006), the physicist Carl Wieman (Wieman, 2007a)notes that novices’ brains literally work differently than experts’. He describes the great difficulty experts have inunderstanding novices’ thinking and even believing they once thought like a novice. He goes on to describe howinstructors might have a difficult time even envisioning student misconceptions. This paper employs several techniquesto surmount instructors’ “curse of knowledge” to discover important misconceptions that may hinder learning.
Modest learning appears to be the norm in college economics classrooms. As Walstad and Allgood (1999) show,an economics class adds little to college seniors’ economic knowledge. Their data also show that senior businessmajors, who generally have taken several economics classes, have great difficulty with basic principles-level ques-tions. The reasons for the modest impact of our classes is rarely studied, but cognitive science suggests unaddressedmisconceptions may well be one reason. Other disciplines’ experiences adds weight to this hypothesis.
This study is limited to “factual misconceptions.” They are defined here as specific incorrect facts that studentsbring to the classroom and have the potential to hinder their learning. Examples include the belief that many workat the minimum wage, that corporate profits are much higher than economists compute them to be, or that economicgrowth over recent generations has been very modest. If uncorrected, it is easy to imagine how learning is affected.For this paper’s purposes, a factual misconception is distinct from an economic fallacy as the latter often involveexplicit use of economic models; examples include questions of who bears the incidence of a tax or who benefits from
∗I would like to thank, but not implicate, Lester Hadsell, Richard Hake, Elizabeth Jensen, David Kauper, Travis Letellier, Dirk Mateer, WilliamA. McEachern, Mark Maier, KimMarie McGoldrick, and Scott Simkins. Anita Pratt and Matthew Kole provided very able research assistance.
aWood (2006) and Madariaga (2005) are extensive collections.
1

international trade. In principle, factual misconceptions can be resolved by examining the appropriate data, whilefallacies require a model to resolve.
One advantage to focusing on factual misconceptions is that there is likely to be little disagreement amongeconomists on the correct answer. Another advantage of exploring factual misconceptions is that it may be easierto frame questions that probe for them and students might more readily understand those questions than questions thatquery about models. While factual, such questions have the potential to uncover information about student models. Asdescribed below, the students queried here believe that the government sets or controls many prices, which has clearimplications on economists’ descriptions of relative prices allocating resources. Student views of employment growthover recent decades has further influence on how students view economic growth.
The term “misconception” is deliberate here. In other disciplines, more subtle concepts such as “preconceptions”or even “conceptions” are used, but here, the focus is on students’ incorrect beliefs of discrete facts. Future researchmight wish to explore these finer distinctions, but for now, a focus on misconceptions seems appropriate.
This paper is organized as follows. The next section reviews gains in economic knowledge and understandingdue to college economic courses and it is then tied to research in cognitive science and research in other disciplinesthat finds that misconceptions often hinder learning. The following section describes misconceptions research ineconomics, and after that the development of the questionnaire is described. Next, student responses are analyzed.Finally, a summary concludes the paper.
2 Modest Learning in College Economics Courses and the Possible Role ofMisconceptions
To understand the importance of exploring student misconceptions, it helps to first review the literature on learning incollege economics classrooms. The best known work may be Walstad and Allgood (1999). They use two datasets; inthe first, a national sample of 300 college seniors were asked 15 questions about basic economic terms and concepts,such as fiscal policy, GDP, monetary policy, and the role of profits. Students who had taken no economics coursesanswered 48% correctly; those who had taken an economics course answered 62% correctly. Their second datasetcontains responses of nearly 13,000 students who took the Major Field Test in Business II (MFTB). Business studentstypically take several economics courses and a portion of the MFTB contains economics questions. Walstad andAllgood (1999) rate half the questions as definitions and the other half were “analytical” and “require use of supplyand demand in microeconomics, or aggregate supply and demand in macroeconomics, but the analysis is only at thePrinciples level.” 41% of the questions were answered correctly.
Further evidence on student learning in college economics courses comes from Walstad et al. (2007). In part, theTest of Understanding of College Economics (TUCE) is designed “to offer a reliable and valid assessment instrumentfor students in principles of economics courses.” Both the microeconomic and macroeconomic versions have 30questions. To determine national norms, they were given to approximately 3,000 students at more than 40 U.S.colleges and universities both before (“pretest”) and after instruction (“posttest”). On the micro version, students wentfrom answering a mean of 9.39 questions correctly to 12.77; for the macro version, they went from 9.80 to 14.19. b
See Figures 1 and 2; the data are from Walstad et al. (2007).
bPerhaps these results will not be very surprising to those who follow national debates on economic issues. Presumably many participants havetaken one or more economics courses, but this might escape knowledgeable viewers.
2

Number Correct on Micro TUCE (pretest and posttest)
Fre
quen
cy
0 5 10 15 20 25 30
010
020
030
040
0
Figure 1: TUCE scores of 3,255 U.S. college students before (blue/dark) and after (yellow/light) taking micro princi-ples from 71 instructors.
Number Correct on Macro TUCE (pretest and posttest)
Fre
quen
cy
0 5 10 15 20 25 30
010
020
030
0
Figure 2: TUCE scores of 2,798 U.S. college students before (blue/dark) and after (yellow/light) taking macro princi-ples from 62 instructors.
3

These results suggest the key issue confronting economic educators is poor student learning. All other issues wouldseem to pale in comparison—what higher priority can there be than maximizing the knowledge and understanding thatour students gain in our classes? Significant gains in our classrooms appear possible as another discipline achievednotable gains after shifting their pedagogical research to understanding and then alleviating poor learning. A significantpart of their shift was a focus on student misconceptions. Details are below.
Cognitive science provides the framework used for studying misconceptions. For some decades cognitive scien-tists have carefully studied how people learn complex subjects and they have largely settled on one model: “construc-tivism.” It holds that information is not transfered intact from teachers to students; instead, students build their ownunderstanding. Resnick (1983) describes the framework this way:
First, learners construct understanding. They do not simply mirror what they are told or what they read.... Second, to understand something is to know relationships. Human knowledge is stored in clusters andorganized into schemata that people use both to interpret familiar situations and to reason about new ones.Bits of information isolated from these structures are forgotten or become inaccessible to memory. ...Third, all learning depends on prior knowledge. Learners try to link new information to what they alreadyknow in order to interpret the new material in terms of established schemata.
She adds that prior knowledge, which includes misconceptions, play a significant role in learning in science classes:
Another well-supported finding is that all students, the weak as well as the strong learners, come to theirfirst science classes with surprisingly extensive theories about how the natural world works. They usethese “naive” theories to explain real world events before they have had any science instruction. Then,even after instruction in new concepts and scientifically supported theories, they still resort to their priortheories to solve any problems that vary from their textbook examples. ... Some studies have shown thatstudents’ prior theories can actually interfere with learning scientific concepts.
This point is further emphasized by Bransford et al. (2000) (sponsored by the National Academy of Sciences andthe U.S. Department of Education; it was approved by the National Research Council). It lists three “Implication forTeaching” stemming from cognitive science research. One is “Teachers must draw out and work with the preexistingunderstanding that their student bring with them.” It goes on to describe how assessments should be used to discoverthem and to ultimately challenge and replace incorrect beliefs.
In this constructivism framework, Bodner (1986) emphasizes how persistent, and thus damaging, misconceptionscan be:
Why are misconcepts so resistant to instruction? Each of us constructs knowledge that “fits” our experi-ences. Once we have constructed this knowledge, simply being told that we are wrong is not enough tomake us change our (mis)concepts. ... The only way to get rid of an old theory is by constructing a newtheory that does a better job at explaining the experimental evidence or finds a more appropriate set ofexperimental facts to explain. The only way to replace a misconcept is by constructing a new concept thatmore appropriately explains our experiences.
These authors’ focus is science education and of course there is a long debate on whether economics is a science.But for a student, economics has many science characteristics: basic facts, foundational principles, observed complexphenomena, and models describing these phenomena. Thus, constructivism seems to be an appropriate frameworkfor how students learn in our discipline. Other disciplines have used this framework, particularly with regard tomisconceptions, and have found the resulting insights powerful. Before examining how specific disciplines have usedthis research, note how “misconception” is broadly defined—it is an idea that students bring to the classroom. It mightbe as complex as a model or as distinct as a single fact. In whatever form, it has the potential to hinder learning.
Kourilsky (1993) started a small literature using these ideas in economics. The resulting papers include Sharp etal. (2005) and Sauer and Burdina (2010). Kourilsky (1993) does include some work on misconceptions, but many in-structors likely have encountered them before: misunderstanding terms and concepts such as investment, opportunitycost, demand, price ceilings and floors, scarcity, and which directions supply and demand curves shift. With cognitive
4

science as a base, it includes careful descriptions of why students make these common errors and how, with inno-vative methods, these misconceptions can be “eradicated.” The later papers describe various ways to implement theabove ideas from cognitive science. Unfortunately, these papers appears to have had little influence on the economicsliterature as a whole. Also, they did not identify novel misconceptions.
Other disciplines have done substantially more; in some cases, dramatically more has been accomplished. Mis-conceptions in psychology have been formally studied for nearly a century; see Nixon (1925) and Garrett and Fisher(1926). Lilienfeld et al. (2010) lists numerous misconceptions undergraduates bring to their classes (the figure inparenthesis is the percent holding the given misconception):
• “Opposites tend to attract in romantic relationships” (77%)
• “”People with schizophrenia have multiple personalities” (77%)
• “Most elderly people are lonely and largely alone” (65%)
• “Expressing anger reduces pent-up anger” (66%)
• “Tourettes disorder is characterized primarily by cursing” (65%)
These authors go on to describe the literature that finds that instruction has little impact on misconceptions. Morebroadly, Chew (2005) puts it this way:
In class, students bring with them a wide array of misconceptions and misunderstandings that many, ifnot most, teachers assume to be benign or easily corrected through sage instruction. Psychologists oughtto know better. These misconceptions are not benign: They affect students ability to learn and understandnew information, and these beliefs can be remarkably resistant to change.
Psychologists have found that misconceptions are negatively correlated with final grades (Kuhle et al. (2009)) andthere has been work on how best to change them; see Kowalski and Taylor (2009) and Lilienfeld et al. (2010).
Biologists have started to use this framework as well. Hartley et al. (2011) study persistent student biologicalmisconceptions regarding the carbon cycle. As they describe, it is how this element moves into, through, and out ofplants and animals and it plays a “prominent role in college biology courses.” Yet, even biology majors in their senioryear retain misconceptions. One example is not understanding that most of a tree’s dry mass comes from CO2 in the air(71% missed on a pretest and 40% on a posttest in introductory courses) as opposed to materials obtained via its roots.Or, when people diet and lose weight, it is not “burned off;” rather most mass is lost through through carbon leavingthe body via exhaled carbon dioxide. More broadly, mass (not just carbon) and energy conservation gives studentsgreat difficulty. Hartley et al. (2011) use these findings to generate insights into these persistent misconceptions:
Applying fundamental principles such as conservation of matter and energy seems so straightforward tomost biologists that they are hardly aware they do it. ... Faculty may be so accustomed to using principle-based reasoning skills [such as conservation laws] that they do not realize their students are more inclinedto use informal reasoning skills [which stem from non-scientific language or personal experiences thatstudents used in their years before formal instruction to understand biological phenomena.] Thus, facultyare unknowingly speaking a different language from their students. We define principle-based reasoningas a “hidden curriculum” because it is so familiar to biologists that they are hardly aware they use it;biologists assume students understand it, even when they do not.
They go on to recommend various ways to encourage principle-based reasoning: active learning exercises thatdirectly challenge misconceptions, instructors should acknowledge that rote memorization hinders desired higher-order thinking, and principles-based methods should be explicitly taught by instructors. Also, in the related disciplineof exercise physiology (part of which can be viewed as applied biology) Morton et al. (2008) find that misconceptionsare remarkably resistant to instruction. Of the nine misconceptions they discovered, only one declined in prevalenceafter several years of instructions.
Chemical misconceptions play a significant role in student understanding of biological concepts. Chemistry has arobust misconception literature; this includes the influential Nakhleh (1992). She summarizes numerous firmly heldmisconceptions that hinder chemistry learning:
5
First, apparently there are profound misconceptions in the minds of many students from a wide range ofcultures concerning the particulate and kinetic nature of matter. Some of these misconceptions persist evenup to the graduate level. ... Second, apparently students do not spontaneously visualize chemical eventsas dynamic interactions. Without an understanding of the kinetic behavior of particles, many topics inchemistry do not make conceptual sense and are learned by rote. ... Third, the cognitive model of learningimplies that misconceptions can occur when students come for instruction holding meanings for everydaywords that differ from the scientific meaning.
She also offers a suggestion on how to remedy this problem:
A helpful course of action would be to include questions on examinations that specifically probe formisconceptions. This would accomplish two goals. Educators would have a more accurate estimate ofstudents’ actual cognitive structures, and students might give more serious thought to understanding theconcepts. Students would then have a better chance if becoming meaningful learners of chemistry.
Physicists might have done the most to study their students’ misconceptions and then acted on their findings. Theyutilize “concept inventories” to assess students’ conceptual understanding. That is, rather than asking students to per-form calculations, students are asked questions that probe their conceptual framework. Distractors in these assessmentsare common student misconceptions that have been discovered through careful research. There are no comparable as-sessments in economics. Physicists have developed many concept inventories; the Assessment Instrument InformationPage lists them. The “Force Concept Inventory” (FCI) (Hestenes et al., 1992) was among the first and it appears to bethe most widely used.c It measures student understanding of Newtonian motion, a staple of the first physics course.As a concept inventory, it asks conceptual questions about real-world phenomena, such as a car-truck collision and thebehavior of a string with a weight on its end. To a physicist, the questions are strikingly easy, but for students, they areoften very difficult. Indeed, Hestenes et al. (1992) starts this way:
Every student begins physics with a well-established system of commonsense beliefs about how the phys-ical world works derived from years of personal experience. Over the last decade, physics educationresearch has established that these beliefs play a dominant role in introductory physics. Instruction thatdoes not take them into account is almost totally ineffective, at least for the majority of students. ... Theimplications could not be more serious. Since the students have evidently not learned the most basicNewtonian concepts, they must have failed to comprehend most of the material in the course. They havebeen forced to cope with the subject by rote memorization of isolated fragments and by carrying outmeaningless tasks. No wonder so many are repelled!
They go on to say
Conventional instruction does work for some students, but at best it is slow and inefficient. We nowhave strong evidence that misconceptions must be taken into account to improve the efficiency of physicsinstruction.d
Finally, they make this essential point:
...that effective instruction requires more than dedication and subject knowledge. It requires technicalknowledge about how students think and learn. The purpose of this article is to supply some of thattechnical knowledge and an instrument to help teachers probe and assess the commonsense beliefs oftheir students.
A very telling anecdote about the FCI comes from Harvard professor Eric Mazur.e The first time he gave it, herecounts (Mazur (2009)):
cBy July 2012 Google Scholar reported more than 1,600 citations to this paper and the assessment itself has been translated into 20 languages.dThe careful reader might notice that the focus with physics is on incorrect models that students bring to the classroom, while this paper focuses
on the seemingly easier to find factual misconceptions. Either may hinder student learning.eSeveral leading physics education research instructors are from elite universities or programs. Others include John Belcher of MIT (PI on
NASA’s Voyger mission) and Carl Wieman (Nobel Laureate in 2001).
6
I expected that the students would have no trouble tackling such questions, f but much to my surprise,hardly a minute after the test began, one student asked, “How should I answer these questions? Accordingto what you taught me or according to the way I usually think about these things?” To my dismay, studentshad great difficulty with the conceptual questions.
As he Mazur (2009) recounts, he began a search for more effective teaching techniques to confront his students’persistent misconceptions. Ultimately, he settled on Just-in-Time Teaching (on-line questions for students before classto help the instructor understand student needs for that class),g with in-class ConcepTests (conceptual in-class ques-tions) that students solve with each other—so-called “Peer-Instruction” (Crouch et al., 2007). Mazur’s pedagogicalodyssey mirrors his discipline’s.
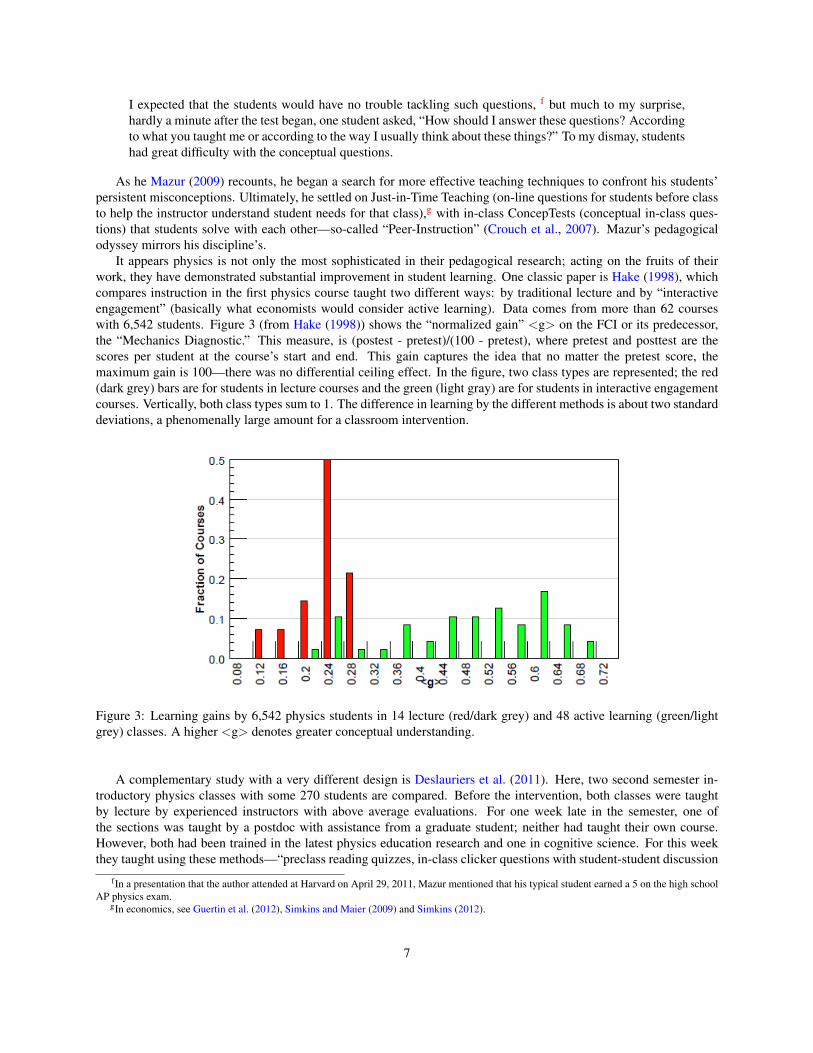
It appears physics is not only the most sophisticated in their pedagogical research; acting on the fruits of theirwork, they have demonstrated substantial improvement in student learning. One classic paper is Hake (1998), whichcompares instruction in the first physics course taught two different ways: by traditional lecture and by “interactiveengagement” (basically what economists would consider active learning). Data comes from more than 62 courseswith 6,542 students. Figure 3 (from Hake (1998)) shows the “normalized gain” <g> on the FCI or its predecessor,the “Mechanics Diagnostic.” This measure, is (postest - pretest)/(100 - pretest), where pretest and posttest are thescores per student at the course’s start and end. This gain captures the idea that no matter the pretest score, themaximum gain is 100—there was no differential ceiling effect. In the figure, two class types are represented; the red(dark grey) bars are for students in lecture courses and the green (light gray) are for students in interactive engagementcourses. Vertically, both class types sum to 1. The difference in learning by the different methods is about two standarddeviations, a phenomenally large amount for a classroom intervention.
Figure 3: Learning gains by 6,542 physics students in 14 lecture (red/dark grey) and 48 active learning (green/lightgrey) classes. A higher <g> denotes greater conceptual understanding.
A complementary study with a very different design is Deslauriers et al. (2011). Here, two second semester in-troductory physics classes with some 270 students are compared. Before the intervention, both classes were taughtby lecture by experienced instructors with above average evaluations. For one week late in the semester, one ofthe sections was taught by a postdoc with assistance from a graduate student; neither had taught their own course.However, both had been trained in the latest physics education research and one in cognitive science. For this weekthey taught using these methods—“preclass reading quizzes, in-class clicker questions with student-student discussion
fIn a presentation that the author attended at Harvard on April 29, 2011, Mazur mentioned that his typical student earned a 5 on the high schoolAP physics exam.
gIn economics, see Guertin et al. (2012), Simkins and Maier (2009) and Simkins (2012).
7

(CQ), small-group active learning tasks (GT), and targeted in-class instructor feedback (IF).”h In this class studentswere using and exploring their knowledge, while in the lecture class the goal was a transfer of knowledge. Be-fore this intervention, all instructors agreed upon a 12-question assessment for that week’s material. The results areshown in Figure 4 (from Deslauriers et al. (2011))—the control group shows the number of correct questions for thelecture-based class and the experiment is for the class taught by the postdoc and graduate student using the latestresearch-based methods. As with Hake (1998), the non-lecture teaching methods yields about a 2 standard deviationimprovement in student learning.
Figure 4: Number of correctly answered questions by students in a second semester physics class taught by lecture(light grey) versus students in another class taught with the latest research-based methods (dark grey). The lectureclass was taught by an experienced instructor with above average teaching evaluations and the other class by a postdocand graduate student. Neither had taught their own class before.
Two excellent primers to physics education research (“PER”) are Wieman (2007b)i while Simkins and Maier(2008) offers an economists’ perspective on PER.
Across disciplines, the American Association for the Advancement of Science is very concerned with poor learningin the STEM (“science, technology, engineering and mathematics”) disciplines. To promote general science literacy,with funding from the National Science Foundation, they have initiated “Project 2061.”.j An essential part of thisproject is understanding and confronting student misconceptions; their “Misconception References” lists more than250 publications.
This section might profitably be concluded by a quote from the Ambrose et al. (2010), which summarizes findingsfrom cognitive science for college instructors in all disciplines:
It is important for instructors to address inaccurate prior knowledge that might otherwise distort or impedelearning. In some cases, inaccuracies can be corrected simply by exposing students to accurate informa-tion and evidence that conflicts with flawed beliefs and models. However, it is important for instructors
hThis is basically identical to Mazur’s approach.i He is a 2001 Nobel Laureate and the Carnegie Foundation’s U.S. University Professor of the Year (given for teaching) in 2004. From 2010 to
2012 he was Deputy Science Advisor to the President (for science education). He now devotes all his research to PER; as of the summer of 2011he is Deputy Science Adviser to the President for science education.
jThe “2061” comes from the project starting in 1985, when Halley’s Comet last was seen with the unaided eye. Those starting school nowshould see its return in 2061.
8

to recognize that a single correction or refutation is unlikely to be enough to help students revise deeplyheld misconceptions. Instead, guiding students through a process of conceptual change is likely to taketime, patience, and creativity.
3 The Study of Misconceptions in EconomicsThere appears to be very few papers in the economics education literature that measure college students’ miscon-ceptions. Christandl and Fetchenhauer (2009) find that both experts and students underestimate economic growth.Williamson and Wearing (1996) conduct empirical analysis with both an open-ended survey and a multiple-choicesurvey of adults and students in Australia on their macro model. However, much of the focus was on the governmentbudget and does not provide much insight for U.S. instructors. Kourilsky (1993) discusses some microeconomic mis-conceptions, such as students not understanding the terms scarcity, demand, and investment. But, her primary focus isovercoming student resistance to understanding economists’ use of these terms.
More common and sometimes broader are studies on the general public’s economic views. These studies providehints on the thinking of non-economists and thus indirectly of students. The most thorough and wide-ranging appearsto be SAEE (1996). It “examines public understanding, assessments and attitudes about the economy and economicpolicy” with some 50 questions; approximately 1,500 randomly selected Americans were surveyed. It compares theirresponses to 250 members of the American Economic Association. Blendon et al. (1997) explore the reasons for thedifferences between the two groups. Caplan (2007a)k also uses this survey to provide support for four “families ofbeliefs” of “systematic errors” that the public harbors on economic issuesl
1. “anti-market bias:” “a tendency to underestimate the economic benefits of the market mechanism”
2. “anti-foreign bias:” “a tendency to underestimate the economic benefits of interaction with foreigners”
3. “make-work bias:” “a tendency to underestimate the economic benefits of conserving labor”
4. “pessimistic bias:” “a tendency to overestimate the severity of economic problems and underestimate the (re-cent) past, present, and future performance of the economy.
Caplan labels these and the ideas behind them as misconceptions. This is consistent with cognitive science usageas they are beliefs that may be brought into the classroom that hinder learning. One open question is the extent towhich college students share these views—perhaps they are picked up later in adulthood (most of the SAEE (1996)participants were adults). While Caplan’s “families of beliefs” provide a very useful framework, each is too broad fora specific question. To address misconceptions, a finer grained understanding is needed. That is, exactly why mighta student have an “anti-market bias?” Data below from questions on the importance of the minimum wage, farmsubsidies, and government price regulation offer some suggestions. Finally, while Caplan and SAEE (1996) focus onbroad issues, studies that examine a specific issue are detailed below next to the relevant misconception.
4 QuestionnaireThe questions in the next section that probe for student misconceptions were inspired by a variety of sources, includingSAEE, Caplan, Madariaga, and this author’s experiences. Each lists its origin. Several questions have been refinedover the years when the initial version made clear that the wording was imprecise. This questionnaire is franklyexploratory—any possible question that the author could develop that might elicit a misconception held by principlesstudents was tried at some point. This near-shotgun approach stems from the “curse of knowledge”—as Wieman(2007a)m defines it,
kCaplan (2007b) is an on-line summary.lThis wording comes from Caplan (2007b).
mAs above, he is one of the leading educational researchers in physics.
9

It is the idea that when you know something, it is extremely difficult to think about it from the perspectiveof someone who does not know it. ... Recent advances in brain imaging show us that this gap in under-standing has quite basic origins. The brains of novices in a subject are activated quite differently fromexperts when confronted with a problem. And as mastery is achieved, the brain literally changes; differentlinks are formed and there are different activation patterns during problem solving.
The questionnaire is largely free-response to avoid “priming”—that is, suggesting possible answers that mightinappropriately influence the student. A few questions offered multiple choice answers when the universe of answerscould be covered and were not likely to prime the student. Some of the questions were topical, such the 2007-09recession and the rise in gas prices associated with Hurricane Katrina in 2005.
It was given the second day of class, January 22, 2009, in a macro principles class at SUNY Oswego. Studentshad no particular motivation to be truthful, but neither did they have a reason to be deceitful. The class had some 275students, and 255 took the questionnaire. 31% of the respondents had taken an economics course in high school, 84%had taken micro principles at Oswego, and 3% had taken micro elsewhere.
5 Questionnaire Results
5.1 MicroOf the prices of goods and services that you buy, about what percent are set or controlled by the government?n
(free response; this chart and all the following ones show the distribution of student responses; in this case, approxi-mately 10% of students feel that the government sets 80% of consumer prices)
0
0.05
0.1
0.15
0.2
0 20 40 60 80 100
Rel
ativ
e fr
eque
ncy
Source: Unknown – I have asked this question for some years, and its genesis is long forgotten.o
Discussion: In this question (241 students responded), students were asked about their view of one type ofgovernment intervention in markets. The median student believes that the government sets or controls 40%of prices, and the upper quartile of students think that the government sets 63% or more. It is possible thatstudents confused price regulation with other types of regulation.
Implications: Of course, considerable time in a micro principles course is spent discussing how prices areformed. Students who feel that the government sets or controls many prices are likely to be confused by thisemphasis. Further, these students are likely to under-appreciate the role of prices in allocating resources.
nAs above, 87% of this class had previously taken micro, so these questions also investigate misconceptions that were retained after a course.oSometimes, the source of these questions is unfortunately poorly documented as I had been using them in the classroom years before this paper
was considered. Commonly, the ideas came from media stories that caught my attention as an economist in which part of the story seemed amiss.
10

About what percent of workers earn the minimum wage?
0
0.05
0.1
0.15
0.2
0.25
0 20 40 60 80 100
Rel
ativ
e fr
eque
ncy
Source: Media reports on changes in the minimum wage occasionally portray increases in it as having a majorimpact on consumer prices, apparently due to cost-push inflation. This would seemingly imply that a con-siderable number of workers earn this wage. Also, students have sometimes asked about the inflationaryimpact of changes in the minimum wage.
Discussion: The median student (243 responded) believes that 35% of workers earn the minimum wage. Ac-cording to the Bureau of Labor Statistics, in 2008, 1.7% of all workers earned the federal minimum or less,and about 11% of teens earned the federal minimum or less. Of course, many states, including New York,have higher minimums, but it seems doubtful that this accounts for the difference. While some of it mightbe due to students using their own experience in the labor market, even then the median estimate appears fartoo high. This would seem to be an example of both Caplan’s pessimistic bias (students see more workersthan there actually are at the bottom end of the wage distribution) and anti-market bias (without governmentintervention in this market, wages would be even lower).
Implications: Similar to the previous question, a substantial number of students feel that a price is set by thegovernment. They may well be puzzled that the only time that this may be discussed in class is withemployment effects of the minimum wage.
Each year the U.S. government makes substantial payments to many farmers. Why? (free response)A. to keep farmers farming / incentive to farm / similar responses: 43%B. other: 46%C. no response: 10%
Source: Caplan (2007b) argues that many see price supports for agricultural products as necessary to keep foodprices low; this is part of his “anti-market.”
Discussion: Marking this question was fairly subjective. The goal was to identify responses where the studentfelt that without government support for farmers, insufficient food would be produced.
Implications: These responses suggest that a fair number of students conformed to Caplan’s anti-market bias.Rewording: To more closely mirror Caplan’s argument, it would be desirable to reword this question to more
accurately inquire about food pricing.
11

As you likely know, gas prices rose after Hurricane Katrina struck in 2005. Why was this? (free response)A. gouging / greed / similar responses: 3%B. other: 86%C. no response: 11%
Source: When gasoline prices rose after Hurricane Katrina, there were many complaints in the media about pricegouging. Madariaga lists the idea that oil companies gouge consumers as a common fallacy. SAEE askedabout “the recent [1996] increase in gasoline prices,” and 73% of that sample felt that corporate profits andnot “the normal law of supply and demand” was driving prices up. It seemed sensible to ask about thisconcept with a recent event.
Discussion: It is surprising that so few students mentioned price gouging or greed as a reason for this event giventhe SAEE results. As the majority of the class had taken microeconomics, perhaps that class had an impact.However, such impact is not seen in other responses. As many of these students had micro, perhaps theyunderstood this concept while they did not understand more technical concepts. The same phenomenaoccurred in Walstad and Allgood (1999). After taking a course, students had difficulty with technicalquestions, but they generally favored flexible prices. Also, while not coded, some students responded thatthe price rose to fund the hurricane cleanup, which is is truly puzzling.
Implications: Using the response in the gasoline market to Hurricane Katrina might not be an effective teachingstrategy as many already seem to have some economic understanding of the event (phrases such as “supplyfell” were common).
For the average U.S. corporation, about how much are their profits as a percent of their sales? (free response;the chart below shows the distribution of student responses; four values greater than 100 were truncated)
0
0.05
0.1
0.15
0.2
0 20 40 60 80 100
Rel
ativ
e fr
eque
ncy
Source: On occasion, there is talk in the media about corporate profits; examples include oil company profitsduring the rise in gasoline prices until the Summer of 2008 and the debate over health insurance companyprofits in 2009. SAEE asked “...what percentage of profit do you think major American corporations make?”
Discussion: 227 students responded to this question, and the median student felt that profits were 30%, and theupper quartile of students felt that they were greater than 60%. One dataset on corporate sales and profits isthe Internal Revenue Services “SOI Tax Stats - Integrated Business Data” (IRS). The most recent availableyear is 2003, and it reports that total corporate receipts were $20.7 trillion with a net income of $.82 trillion,for a 4% net profit rate. While net income for tax purposes can be substantially different than accountingor economic profits, this does suggest that in this sample, many students over-estimate corporate profits. InSAEE, the mean response of the public was 47%.
Implication: It would appear that a fair number of students feel that entry into most markets is difficult or do not
12

understand this concept. This finding is consistent with Caplan’s anti-market bias.Rewording: “For U.S. corporations, what percentage of their profits stem soley from sales?” is much more
direct.
As you likely know, the price of oil rise [sic] a lot in the last few years until last summer. What happened toefforts to search for oil during this time of rising oil prices? (responses offered)
A. it fall [sic]: 14%B. it stayed about the same: 25%C. it rose: 59%D. no response: 2%
Source: When gasoline prices rose until the Summer of 2008, there was often talk in the media of marketmanipulation by oil companies. One type of manipulation would be supply reductions.
Discussion: While a majority of students believed that the oil supply curve is upward sloping, a substantialminority felt otherwise. However, at least in the author’s experience, students seem to have an easier timeunderstanding the slope of the demand curve than the slope of the supply curve; perhaps this is due to themajority of their market transactions being on the demand side. It is unclear if this response stems fromviews of oil market manipulation or confusion over supply itself.
Rewording: Perhaps a question on a less controversial market could be substituted for this one as it queries twoconcepts.
13

5.2 Macro
Of those in the U.S. who are willing and able to work, about what percent are not working? (This is the“unemployment rate.”) (free response)
0
0.05
0.1
0.15
0.2
0.25
0.3
0.35
0.4
0 10 20 30 40 50 60 70 80 90
Rel
ativ
e fr
eque
ncy
Source: The unemployment rate is a standard topic in macro principles. It is also in SAEE.Discussion: The median response of the 250 who answered here was 12%, and the upper quartile of students
thought that the unemployment rate was 30% or greater. When the questionnaire was given in January of2009, the most recently reported U.S. unemployment rate was 7.2%.
Implications: It would appear that this sample of students overestimates the unemployment rate. The same oc-curred in SAEE, where the mean estimate was 20.6%. These results are consistent with Caplan’s pessimisticbias.
If the typical unemployed worker started looking for a job today, about how long would it it take him or her tofind a one? (4 values of more than 52 weeks were dropped)
0
0.05
0.1
0.15
0.2
10 20 30 40 50
Rel
ativ
e fr
eque
ncy
Source: Besides asking about the unemployment rate, it seemed sensible to ask about another measure of thehealth of the labor market.
14

Discussion: Only 180 students gave useful answers (many could not be translated into weeks, the units usedhere). The median student felt that this came to 8 weeks, while the BLS reports that for January of 2009,the median duration of unemployment was 19.8 weeks (Bureau of Labor Statistics). Also, student estimateswere quite varied.
Implication: Perhaps students underestimated this value based on their experience with low-skill jobs, whichmight have a shorter time for matching employers and employees.
Rewording: It might be sensible to drop this question in future questionnaires given its secondary nature.
Over the last 12 months, by about what percent have consumer prices risen? (free response)
0
0.05
0.1
0.15
0.2
0.25
0.3
0.35
0.4
-20 0 20 40 60 80 100
Rel
ativ
e fr
eque
ncy
Source: Like the unemployment rate, the inflation rate is a staple of macro principles. SAEE queries for its valueas well, but it directly asks for an estimate of the rate of inflation rather than defining inflation.
Discussion: The median student (234 responded) estimated that inflation was 11% over the previous year, andthe upper quartile felt that that inflation was 25% or greater. Data from the BLS reports (Bureau of LaborStatistics) that from December 2007 to December 2008 the CPI rose by .09%. This response is puzzlinggiven the most widely viewed price, gasoline, fell over the year prior to January 2009, and at an apparentlycasual level, prices barely budged. In SAEE, the mean value was 13.5%, which like the unemployment rate,is an overestimate.
Implication: As with other key macro data that students might have heard of, it would appear that this sampleof students has views that diverge fairly far from actuality. This suggests that some discussion of basic datais in order in this class. Also, this is consistent with Caplan’s pessimistic bias.
There has been some talk about the U.S. economy in recent months. Can you please provide any details? (freeresponse)
A. a recession (or words to that effect, such as rising unemployment): 70%B. a financial crisis (or words to that effect, such as bank problems or falling stock prices): 10%C. other: 7%D. no response: 13%
Source: This questionnaire was given on January 22, 2009, and I was curious how much they followed news ofthe economy.
Discussion: This question may well demonstrate the desirability of the free-response format. While many stu-dents do not follow the news, it seems somewhat startling that one-fifth either offered no response or anincorrect one to this question.
Implications: It would appear that some students have at best, only a vague sense of macroeconomic events.Thus, many of the events used to illustrate concepts may fail as the students are unfamiliar with the events.
15

This also implies that a typical macro course might well need to devote more time to basic macro data andevents.
In 2001 the U.S. economy experienced a recession. What was the cause? (free response)A. 9/11 terror attacks: 40%B. other: 47%C. no response: 13%
Source: News reports sometimes describe how the 9/11 attacks harmed the economy, but the recession began inMarch and ended in November (National Bureau of Economic Research).
Discussion: Besides incorrect news reports, for this generation of students, 9/11 is a fairly distant event. Onemight wonder if they see mention of this year and make an incorrect inference.
Implication: While the 2001 recession has faded in importances given the 2007-09 recession, it maybe be sen-sible when discussing this recession to mention that it was not caused by the 9/11 attacks.
Consider the following countries: the U.S., Canada, Germany, Japan, France, China, and Great Britain. Whichare the largest four and please place them in order from the largest exporter on down. (free response)
A. the U.S. ranks first: 5%B. the U.S. ranks second: 22%C. the U.S. ranks third: 36%D. the U.S. ranks fourth: 17%E. the U.S. ranks fifth: 17%F. no response: 2%
Source: Media reports sometimes state that the U.S. is losing its international position.Discussion: Very few students know that the U.S. is the largest exporter in the world (World Trade Organization).
Perhaps their view is partly due to imports of consumer goods that students readily see coupled with storiesin the media about the U.S. trade deficit.
Implication: Certainly comparative advantage is a more important concept, but it is useful for students to knowthat exports play an important role in the U.S. economy.
Rewording: Instead of “Which are the largest four and please place them in order from the largest exporter ondown.” it should instead read “Which are the largest four exporters and please place them in order from thelargest exporter on down.”
At the federal level in Washington, how are the nation’s spending and taxes decided upon? (free response)A. the President and Congress decide: 15%B. Congress (includes answers with just one house): 28%C. the President decides: 2%D. the Fed decides: 2%E. the state of the economy / misinterpreted (i.e. with answers such as ”voting”): 36%F. don’t know: 2%G. no response: 15%
Source: When a new citizenship test was recently introduced, there were news reports that many existing cit-izens had difficulty with it. One of the challenging questions asked people to name the three branches ofgovernment, and I was curious how this might apply to students’ views of fiscal policymakers.
Discussion: While the wording of this question should be dramatically improved, even if one combines thecorrect answer with the plausible alternative where students directly answer “how,” barely half of studentsknew the answer.
Implication: Clearly, it is sensible for students to know the identity of fiscal policy makers. Yet, it appears thatmany do not.
Rewording: A better wording would be “At the federal level in Washington, who decides upon the nation’sspending and taxes?”
16

About how much influence does the President have over the economy? (responses offered)A. a lot: 30%B. some: 48%C. a little: 20%D. none: 2%E. no response: 0%
Source: Presidential campaigns are of course run on the premise that the President has considerable influence onthe economy. Yet, power is of course divided in the U.S. Also, SAEE asked “Do you think improving theeconomy is something an effective president can do a lot about, do a little about, or is that mostly beyondany president’s control?” Finally, Madariaga (2005) lists the idea that the President should get credit or takeblame for the economy as a common fallacy.
Discussion: It is puzzling why more than three-quarters of students think that the President has at least somepower when in the previous question they rarely mentioned the office. In SAEE, 31% of respondents feltthat the President had “a lot.”
Implication: As with the previous question, it seems sensible to describe to students the roles and powers offiscal policy makers. Given the results of the previous question, perhaps a follow-up question could askwhy the President has considerable power to influence the economy.
Consider the following parts of federal spending: welfare, Social Security, defense, Medicare (health care forthe retired), the space program, and foreign aid. What are the three largest? Please put these three in orderfrom largest to smallest. (free response)
A. none of welfare, the space program, or foreign aid was in the top three: 26%B. welfare is one of the top three: 43%C. foreign aid is one of the top three: 11%D. some combination of welfare, the space program, and foreign aid is one of the top three: 21%E. no response: 2%
Source: A news show I heard described a program that paired typical citizens with various experts. One citizenreported being surprised at the size of different components of the federal budget. In KFF (1995), respon-dents were asked to pick the largest two of these types of federal spending: foreign aid, welfare, interest onthe federal debt, defense, Social Security, and health.
Discussion: It would appear that many students begin a macro principles course with a poor knowledge of thecomponents of the federal budget.
Implication: It might be advisable to describe basic U.S. budget facts as part of a macro principles course.
On average, do those earning incomes higher than the middle class, pay a larger or smaller share of their incomein federal taxes than the middle class? (responses offered)
A. the wealthy pay a larger share: 46%B. the wealthy pay about the same share: 23%C. the wealthy pay a smaller share: 27%D. no response: 2%
Source: In a large national survey of college freshman (Hoover (2009)), some 60% favor raising taxes on thewealthy. However, this begs the question of how knowledgeable they are about taxes in general. Also,Slemrod (2006) found that significant support for a flat income tax stems from the misconception that theincome tax system is not progressive. In his data, “... 51 percent of all respondents think that middle-incomefamilies currently pay a higher percentage of income in taxes than high-income families...”
Discussion: This sample of students were less incorrect than Slemrod’s sample. While not a direct part of macro,it may well be useful to know that the income tax system is progressive. Also, they may not be that clear onthe difference between payroll and income taxes.
Rewording: Rather than saying “wealthy” it would be more accurate to use the term “high income.”
17

Can a country be in debt forever without it becoming a significant problem? (responses offered)A. yes: 26%B. no: 47%C. you can’t say on [sic] way or another for sure: 25%D. no response: 1%
Source: In class, my students are often puzzled by the U.S. continuously being in debt.Discussion: Given low levels of financial literacy, it might be the case that students feel unless debt is repaid it
will balloon out of control.Implication: A discussion of how governments manages their debt might be a useful addition to a macro prin-
ciples course.
Since 1950, after adjusting for inflation, income per person in the U.S. has changed by about what percent?(free response)
0
0.1
0.2
0.3
0.4
0.5
0.6
0.7
0 100 200 300 400 500 600 700 800
Rel
ativ
e fr
eque
ncy
Source: Years ago, a Wall Street Journal article described a cocktail party conversation between an economistand a non-economist. The non-economist was convinced that on average people lead a better material lifein the 1950s. The economist was truly puzzled. SAEE has several questions about growth over the last 20years, but here I wanted to look at a longer span to more closely correspond to long-run growth.
Discussion: The median student (241 responded) believes that this measure has increased by 25%. Data fromMeasuring Worth shows that real per capita GDP rose by 231%, while a somewhat closer to the questionvariable, paid compensation of employees (BEA) deflated by the personal consumption expenditures index(BEA) and adjusted by population (Measuring Worth), rose by 248%.
Implication: Students dramatically underestimated economic growth. It is likely that they would be puzzled bythe emphasis put on long-run growth of many of today’s macro courses. These results are consistent withChristandl (2008), which finds that many do not understand exponential growth.
18

Since 1950, in the U.S., the number of people working has changed by about what percent? (free response)
0
0.1
0.2
0.3
0.4
0.5
0 50 100 150 200 250 300
Rel
ativ
e fr
eque
ncy
Source: Besides asking about changes in income over the last half-century, it seemed sensible to ask aboutchanges in employment. This question might also bring out the lump of labor fallacy.
Discussion: The median student (245 responded) in this sample believes that employment rose by 30%, whilethe actual change in nonfarm payrolls over this period is 197%.p It might be the case that part of this resultis due to the questionnaire being given in a slow-growth area: Upstate New York.
Implication: As with changes in income, this set of students appears to come to class with little knowledge oflong-run growth.
Since 1950 or so, in the U.S. wealth (the value of what we own, such as houses, cars, stocks, bank accounts andso on) has changed by about what percentage? (free response)
0
0.1
0.2
0.3
0.4
0.5
0.6
0 100 200 300 400 500
Rel
ativ
e fr
eque
ncy
Source: This is a another question that asks about economic growth.Discussion: Board of Governors of the Federal Reserve System contains net financial assets, and by deflating
them by the PCE (BEA), one finds an increase of 462%. The median student feels that the broader measurepSpecifically, “Total Nonfarm Payrolls: All Employees” was taken from the FRED data base at the Federal Reserve Bank of St. Louis. The
median value in 1950 was compared to the January, 2009 value.
19

rose by 35%.Implication: Again, this sample of students appears to underestimate growth.Rewording: Drop “or so” to be consistent with the other growth questions. Also, it seems difficult to find data
on real assets, so perhaps the question could be restricted to financial assets.
Why is the currency we carry in our wallets and purses valuable? (free response)A. money is backed by gold / backed by silver: 14%B. other: 87%C. no response: 13%
Source: In class, I am occasionally asked about what backs U.S. currency while Madariaga (2005), the idea thatthe U.S. dollar is backed by gold as a common fallacy.
Implication: It might be sensible to briefly mention that U.S. currency is not backed. The discussion might thenlead to the desirability of low inflation policies by central banks and how a slowly advancing price level isan anchor for prices and wages.q
Overall, does trade with foreign countries aid or harm the U.S.? (responses offered)A. mostly aid: 29%B. both aid and harm: 63%C. mostly harm: 2%D. not sure: 4%E. no response: 2%
Source: Given the importance of foreign trade and the coverage devoted to it in principles, it seemed sensible toask a question along these lines. SAEE asks similar questions, but with substantially different wording.
Discussion: It would appear that many students have considerable qualms concerning international trade. Thisis consistent with Caplan’s anti-foreign bias.
Implication: Besides covering comparative advantage, it might be desirable to cover other arguments thateconomists use to describe trade’s benefits.
Rewording: Given the most common response, it might be desirable to develop other questions that investigatethe reason for this response, such as job losses or environmental issues.
5.3 PerceptionsThis section investigates student perceptions, rather than the above factual questions.
For the generation now in their 20s, their standard of living will likely be their parents when they reach theirparent’s age. (responses offered)
A. higher than: 72%B. similar to: 11%C. lower than: 16%C. no response: 0%
Source: This question was designed to further investigate their views on economic growth. SAEE asks “Do youexpect your children’s generation to enjoy a higher or lower standard of living than your generation, or doyou think it will be about the same?”
Discussion: Given that many students feel that growth has been modest in the past, this result appears a bitinconsistent. It is also inconsistent with SAEE respondents, where 38% felt that the next generation wouldhave a higher standard of living. One explanation is that in SAEE the question concerned the respondents’children, while here the question is directly posed to the people in question.
qTo address concerns about inflation under different monetary regimes, one might show long-term inflation data; it has been particularly stablesince the early 1980s and was dramatically unstable under the gold standard.
20

If you’re under the age of 25, what is the chance of getting, say, more than 50% of the Social Security you’vebeen promised? Please put this in percentage terms (0% would be no chance and 100% would be that youcertainly would). (free response)
0
0.02
0.04
0.06
0.08
0.1
0.12
0.14
0.16
0 20 40 60 80 100
Rel
ativ
e fr
eque
ncy
Source: There seems to be common perception that Social Security is “going broke.”Discussion: The median student (245 responded) reported a 20% chance. However, Trustees of the Social Secu-
rity and Medicare Trust Funds (2009) estimate that after 2037, when the trust fund zeros out, current taxeswill support Social Security benefits at about three-quarters of their current level.
Implication: It might be wise to describe the workings of this system.
What is the impact of immigrants on people working in the U.S.? (responses offered)A. mostly benefit: 11%B. neither benefit nor harm: 8%C. mostly harm: 64%D: not sure: 13%E: no response: 4%
Source: This topic has been an issue in the political realm in recent years. It is also mentioned in various waysin SAEE but with very different wordings.
Discussion: It would appear that students’ views mirror the views of the public. It is also consistent with Caplan’santi-foreign bias.
Implication: While immigration is not often covered in principles, it might need to be addressed. Above, manystudents felt that employment gains had been very small for many years, so perhaps students came to classwith something like the lump of labor fallacy.
21

5.4 Non-Economic QuestionsThese variables may influence classroom performance; some are rarely measured. It was not part of the above project,but some may find the results interesting and perhaps useful.
Which most accurately describes your study environment most of the time: (responses offered)A. a computer is on and you’re multitasking (say using IM or visiting web sites): 20%B. music is playing in the background or on headphones: 24%C. a TV is on the background: 9%D. a TV or music is on and you’re multitasking on a computer: 16%E. it is pretty quiet: 29%F. no response: 29%
Source: There is considerable discussion today of multitasking, and I was curious about the study environmentof my students.
Discussion: While studies of multitasking are still in their infancy, some reports suggest that it is not beneficialto learning (Ophir et al. (2009)), and that even background music hinders cognition (Ransdell and Gilroy(2001) and Beaman (2005)).
Implication: While doubtless it is near impossible to change this student behavior, perhaps this research couldbe mentioned if study skills are discussed.
Rewording: It should include texting and phone use.
There are basically two views of intelligence. One view is called fixed mindset which says that throughout lifeyou pretty much have the intelligence you were born with. The other view is called “flexible mindset” and itsays that you can add to your intelligence as you learn. Which best describes your views? (responses offered)
A. fixed mindset: 2%B. more fixed then flexible mindset: 16%C. more flexible than fixed mindset: 58%D. flexible mindset: 22%E. no response: 2%
Source: Blackwell et al. (2007) describes how different mindsets influence school achievement and how anintervention that changed mindsets to flexible improved classroom performance.
Rewording: Rather than asking students about their views, it might be better to use an assessment used in thisliterature that indirectly probes for views on this issue. Also, commas are needed after both occurances of“mindset.”
22

College itself and the college experience in general benefit graduates in many ways. About what percent of thosebenefits come from what happens in classes that you take (as opposed to other experiences, like extra-circular[sic] activities, what you do with friends, and jobs you might have while in college)? (free response)
0
0.05
0.1
0.15
0.2
0.25
0.3
10 20 30 40 50 60 70 80 90 100
Rel
ativ
e fr
eque
ncy
Source: Nathan (2006), in which a field anthropologist studies students at her own university, describes howsome students view classes as the “cost” of obtaining the real benefits of going to college, such as friendshipsand other activities. I have been puzzled by the low value of self-reported study hours by college students;in a large national survey of college students, NSSE (2009), they self-report an approximate median of 13hours of weekly homework.
Discussion: The median student (227 replied) reported 50%, which suggests a partial explanation of seeminglylow study hours.
Many students are in college today work to help pay for college. Consider both college classes and your workexperience while in college to their benefit to your future work life. If you had 100 points to apportion betweenthem to describe these benefits, how many points would work get? How many points would college classesget? (free response)
0
0.02
0.04
0.06
0.08
0.1
0.12
0.14
0.16
0.18
0 20 40 60 80 100
Rel
ativ
e fr
eque
ncy
Source: This question is partly designed to ferret out anticipated findings from the previous question and to help
23

explain a spirited class discussion. In class, I asked “What would be the opportunity cost of a college studentworking more and studying less?” I expected the answer “less income in the future due to lower humancapital.” Instead, many students felt that they needed experience in the workplace, and that there would beno cost or a benefit to working more. Here, I wanted to quantify that idea.
Discussion: The median student (244 replied) reported 40% on the work scale (the college scale was a check),which again suggests a partial explanation of seemingly low study hours. It would appear that economists’concept of acquiring human capital while in college would be met with some resistance by this sample ofstudents. Of course, the type of work significantly matters, but if their work experience mirrors high-schoolonly graduates, who have significantly lower lifetime earnings, this finding seems be puzzling.
Rewording: The question should be reworked to make it clear that “work” does not include internships or co-ops. Also, “are” should be dropped.
Did you watch or listen to at least part of the Inauguration on Tuesday? (free response)A. yes: 81%B. no: 15%C. no response: 2%
Source: I intended to use this as a marker of interest in the news, but in retrospect it likely also picked up politicalleanings.
6 Discussion and ConclusionWhen questions similar to those in SAEE (1996) were posed to this sample of students, they responded much likethe general public did in that survey and quite unlike professional economists. As Caplan (2007b) would put it, thesestudents often exhibited a bias against markets: the median student thought that the government controlled far moreprices than it actually does (a question not in SAEE), that many workers earn the minimum wage (also not in SAEE),and that corporate profits are much higher than they actually are. Further, it appears that a substantial minority ofstudents appeared to think that the government keeps farmers in business to make sure that food is available (alsonot in SAEE, but suggested by Caplan). In addition, these students exhibited Caplan’s anti-foreign bias as they wereequivocal on foreign trade and felt that immigrants mostly harmed native workers. When asked backward-lookingquestions about long-run growth that were similar to ones in SAEE, these students too were unduly pessimistic.
Unlike public respondents in SAEE, they were more optimistic regarding their generation’s economic future andmore accepting of the market mechanism as an explanation for the rise in gasoline prices after Hurricane Katrina.Aside from these two exceptions, this sample of students generally conformed to the public’s views in SAEE).
This overall consistency is interesting given that the questionnaire introduced here was generally free-response, theaudience was much younger, and that more than a decade had passed. This similarity raises the question of where andhow these views are formed; it would appear that the points in Rubin (2003) are worth further investigation.
When asked questions on basic macro facts like inflation, the unemployment rate, and long-run growth, this sampleof students were again too pessimistic. As in Christandl (2008), it appears that many do not understand the magnitudeof long-run growth; put another way, they dramatically underestimated exponential growth.
On a very basic factual question such as how the Federal budget is determined, many if not most students wereignorant, yet many felt that the President has substantial influence over the economy. Even more did not know somebasics about the components of the federal budget, how Social Security worked, or that the federal income tax isprogressive. A surprising 20% did not describe the U.S. economy as being in a recession or financial difficulty inJanuary 2009, during the depths of the worst recession since the 1930s. Thankfully, fewer than this felt that U.S.currency was backed by gold or silver.
Many of the questions were derived from SAEE, but some new ones were introduced, such as the ones on thepercent of workers paid the minimum wage and the percent of prices controlled by the government. Doubtless otherinstructors have similar insights that only need to be tested against a body of students. By their nature, an insight or twolike this does not merit a paper. Thus, it might be appropriate for a web site to be developed where instructors couldshare their questions, others could comment on and refine them, and yet others could report results when answered
24

by students. Thus, the Internet would mediate a different type of scholarly discourse.r If and when a core set ofmisconceptions is identified through this process, a formal survey could be developed and given at many institutionsto thoroughly investigate student misconceptions at the start of principles classes.
rOne interesting example of how the Internet can be used for quick scholarly collaboration in described by Gowers and Nielsen (2009). A groupof mathematicians used a blog and wikis to solve a difficult math problem.
25

ReferencesAmbrose, Susan A., Michael W. Bridges, and Michele DiPietro, How Learning Works: Seven Research-Based
Principles for Smart Teaching, Jossey-Bass, 2010. 8
BEA, Bureau of Economic Analysis, “National Income and Product Accounts Tables 1.10,” 2009. <http://www.bea.gov/National/nipaweb/SelectTable.asp>. 18
, “National Income and Product Accounts Tables 1.1.4,” 2009. <http://www.bea.gov/National/nipaweb/SelectTable.asp>. 18, 19
Beaman, C. Philip, “Auditory Distraction from Low-Intensity Noise: a Review of the Consequences for Learningand Workplace Environments,” Applied Cognitive Psychology, 2005, pp. 1041–1064. <http://dx.doi.org/10.1002/acp.1134>. 22
Blackwell, Lisa S., Kali H. Trzesniewski, and Carol Sorich Dweck, “Implicit Theories of Intelligence PredictAchievement Across an Adolescent Transition: A Longitudinal Study and an Intervention,” Child Development,2007, pp. 246–263. <http://dx.doi.org/10.1111/j.1467-8624.2007.00995.x>. 22
Blendon, Robert J., John M. Benson, Mollyann Brodie, Richard Morin, Drew E. Altman, Daniel Gitterman,Mario Brossard, and Matt James, “Bridging the Gap Between the Public’s and Economists’ Views of the Econ-omy,” The Journal of Economic Perspectives, Summer 1997, 11 (3), 105–118. <http://links.jstor.org/sici?sici=0895-3309%28199722%2911%3A3%3C105%3ABTGBTP%3E2.0.CO%3B2-0>. 9
Board of Governors of the Federal Reserve System, “Flow of Funds, Table L.100.” <http://www.federalreserve.gov/releases/z1/Current/data.htm>. 19
Bodner, G.M., “Constructivism: A Theory of Knowledge,” Journal of Chemical Education, 1986, 63 (10), 873–878.<http://pubs.acs.org/doi/abs/10.1021/ed063p873>. 4
Bransford, J.D., A.L. Brown, R.R. Cocking et al., How People Learn, National Academy Press Wash-ington, DC, 2000. <https://download.nap.edu/login.php?record_id=9853&page=%2Fcatalog.php%3Frecord_id%3D9853>. 4
Bureau of Labor Statistics, “Characteristics of Minimum Wage Workers: 2008.” <http://www.bls.gov/cps/minwage2008.htm>. 11
, “Consumer Price Index.” <ftp://ftp.bls.gov/pub/special.requests/cpi/cpiai.txt>. 15
, “Labor Force Statistics from the Current Population Survey, Series Id: LNS13008275.” <http://data.bls.gov/PDQ/servlet/SurveyOutputServlet?series_id=LNS13008275>. 15
Caplan, Bryan, The Myth of the Rational Voter: Why Democracies Choose Bad Policies, Princeton University Press,2007. 9
, “The Myth of the Rational Voter: Why Democracies Choose Bad Policies,” Cato Institute, Policy Analysis no.594, May 29 2007. <http://www.cato.org/pub_display.php?pub_id=8262>. 9, 11, 24
Chew, Stephen L., “Student Misconceptions in the Psychology Classroom,” Essays from E-xcellence in Teaching,2005, 4. <http://teachpsych.org/resources/e-books/eit2009/eit2009.pdf#page=55>. 5
Christandl, Fabian and Detlef Fetchenhauer, “How Laypeople and Experts Misperceive the Effect of EconomicGrowth,” Journal of Economic Psychology, June 2009, 30 (3), 381–392. <http://ideas.repec.org/a/eee/joepsy/v30y2009i3p381-392.html>. 9
Christandl, Kaufmann Fabian, “How Economic Laypeople Perceive Economic Growth and Inflation,” 2008.<http://deposit.ddb.de/cgi-bin/dokserv?idn=990042847&dok_var=d1&dok_ext=pdf&filename=990042847.pdf>. 18, 24
26

Crouch, Catherine H., Jessica Watkins, Adam P. Fagen, and Eric Mazur, “Reviews in PER Volume 1:Research-Based Reform of University Physics,” 2007. <http://www.compadre.org/Repository/document/ServeFile.cfm?DocID=241&ID=4990>. 7
Deslauriers, Louis, Ellen Schelew, and Carl Wieman, “Improved Learning in a Large-Enrollment Physics Class,”Science, 2011, 332 (6031), 862–4. <http://www.cwsei.ubc.ca/SEI_research/index.html>. 7, 8
Garrett, H.E. and T.R. Fisher, “The Prevalence of Certain Popular Misconceptions,” Journal of Applied Psychol-ogy, 1926, 10 (4), 411–420. <http://www.sciencedirect.com/science/article/B6WY3-4NRK6VB-1/2/5d0c25db70c92fef312ff354160d6000>. 5
Gowers, Timothy and Michael Nielsen, “Massively Collaborative Mathematics,” Nature, Octover 15 2009, 461(7266), 879–881. <http://dx.doi.org/10.1038/461879a>. 25
Guertin, Laura, Carol Ormand, Gregor Novak, Andy Gavrin, Scott Simkins, Gregor Novak, Marcelo Clerici-Arias, and Rae Jean Goodman, “Just in Time Teaching (JiTT),” 2012. <http://serc.carleton.edu/econ/justintime/>. 7
Hake, Richard .R., “Interactive-Engagement Versus Traditional Methods: A Six-Thousand-Student Survey of Me-chanics Test Data for Introductory Physics Courses,” American Journal of Physics, 1998, 66, 64–74. <http://web.mit.edu/rsi/www/2005/misc/minipaper/papers/Hake.pdf>. 7, 8
Hartley, Laurel M., Brook J. Wilke, Jonathon W. Schramm, Charlene D’Avanzo, and Charles W. An-derson, “College Students’ Understanding of the Carbon Cycle: Contrasting Principle-based and Infor-mal Reasoning,” BioScience, 2011, 61 (1), 65–75. <http://news.msu.edu/media/documents/2011/01/f6e8a4d5-8ccb-48be-8d4b-1915c5c2583c.pdf>. 5
Hestenes, David, Malcolm Wells, and Gregg Swackhamer, “Force Concept Inventory,” The Physics Teacher, 1992,30 (3), 141–158. <http://se.cersp.com/yjzy/UploadFiles_5449/200607/20060705142003187.pdf>.6
Hill, Nicole M. and Walter Schneider, “Brain Changes in the Development of Expertise: Neuroanatomical andNeurophysiological Evidence About Skill-Based Adaptations,” The Cambridge Handbook of Expertise and ExpertPerformance, 2006, pp. 653–682. 1
Hoover, Eric, “Freshmen’s Views: Politics, Admissions, and Marijuana,” The Chronicle of Higher Education, January22, 2009. <http://projects.ict.usc.edu/itw/gel/EricssonDeliberatePracticePR93.pdf>. 17
IRS, Internal Revenue Service SOI Tax Stats - Integrated Business Data, “Table 3,” 2009. <http://www.irs.gov/taxstats/bustaxstats/article/0,,id=152029,00.html>. 12
KFF, Kaiser Family Foundation, “National Survey of Public Knowledge of Welfare Reform and the Federal Budget,”Table 16: Americans’ Views of The Two Largest Areas of Federal Government Spending January 1995. <http://www.kff.org/kaiserpolls/1001-welftbl.cfm>. 17
Kourilsky, Marilyn, “Economic Education and a Generative Model of Mislearning and Recovery,” The Journal ofEconomic Education, 1993, 24 (1), 23–33. 4, 9
Kowalski, Patricia and Annette Kujawski Taylor, “The Effect of Refuting Misconceptions in the IntroductoryPsychology Class,” Teaching of Psychology, July-September 2009, 36 (3), 153–159. 5
Kuhle, Barry X., Jessica M. Barber, and Adam S. Bristol, “Predicting Students’ Performance in IntroductoryPsychology from their Psychology Misconceptions,” Journal of Instructional Psychology, June 2009, 36 (2), 119–124. 5
Lilienfeld, S.O., S.J. Lynn, J. Ruscio, and B.L. Beyerstein, “Mythbusting in Introductory Psychology Courses: TheWhys and the Hows,” Essays from E-xcellence in Teaching Volume IX, 2010, pp. 55–61. <http://teachpsych.org/resources/e-books/eit2009/eit2009.pdf#page=55>. 5
27
Madariaga, Bruce, Economics For Life: 101 Lessons You Can Use Every Day!, Houghton Mifflin, 2005. 1, 9, 12,17, 20
Mazur, Eric, “Education: Farewell, Lecture?,” Science, 2009, 323 (5910), 50–51. <http://www.sciencemag.org/cgi/reprint/323/5910/50.pdf>. 6, 7
Measuring Worth. <http://www.measuringworth.com/index.html>. 18
Morton, J.P., D.A. Doran, and D.P.M. MacLaren, “Common Student Misconceptions in Exercise Physiology andBiochemistry,” Advances in Physiology Education, 2008, 32 (2), 142–146. <http://advan.physiology.org/content/32/2/142.full>. 5
Nakhleh, Mary B., “Why Some Students Don’t Learn Chemistry: Chemical Misconceptions,” Journal of ChemicalEducation, 1992, 69 (3), 191. <http://pubs.acs.org/doi/abs/10.1021/ed069p191>. 5
Nathan, Rebekah, My Freshman Year: What a Professor Learned by Becoming a Student, Penguin, 2006. 23
National Bureau of Economic Research, “Business Cycle Expansions and Contractions.” <http://www.nber.org/cycles/cyclesmain.html>. 16
Nixon, H.K., “Popular Answers to Some Psychological Questions,” The American Journal of Psychology, 1925, 36(3), 418–423. <http://www.jstor.org/pss/1414166>. 5
NSSE, National Study of Student Engagement, 2009. <http://nsse.iub.edu/NSSE_2009_Results/pdf/NSSE_AR_2009.pdf>. 23
Ophir, Eyal, Clifford Nass, and Anthony D. Wagner, “Cognitive Control in Media Multitaskers,” Proceedings ofthe National Academy of Sciences, 2009, 106 (37), 15583–15587. <http://www.pnas.org/content/106/37/15583.abstract>. 22
Ransdell, S. E. and L. Gilroy, “The Effects of Background Music on Word Processed Writing,” Computers in HumanBehavior, March 2001, pp. 141–148. <http://dx.doi.org/10.1016/S0747-5632(00)00043-1>. 22
Resnick, Lauren B., “Mathematics and Science Learning: A New Conception,” Science, April 29 1983, 220 (4596),477–78. <http://www.sciencemag.org/content/220/4596/477.abstract>. 4
Rubin, Paul H., “Folk Economics,” Southern Economic Journal, July 2003, 70 (1), 157–171. 24
SAEE, The Washington Post/Harvard University/Kaiser Foundation, “Survey of Americans and Economists onthe Economy,” October 1996. <http://www.kff.org/kaiserpolls/1199-econgen.cfm>. 9, 12, 14, 15, 17,18, 20, 21, 24
Sauer, Katherine M. and Mariya (Maria) Burdina, “Using Generative Learning Strategies for Assessment of Stu-dent Understanding in a Principles of Microeconomics Course,” 2010. <http://ssrn.com/paper=1758855>.4
Sharp, David C., Dave S. Knowlton, and Renee E. Weiss, “Applications of Generative Learning for the Survey ofInternational Economics Course,” Journal of Economic Education, 2005, 36 (4), 345–357. 4
Simkins, Scott, “Using Just-in-Time Teaching to Promote Student Learning in Economics,” in Gail M. Hoyt andKimMarie McGoldrick, eds., International Handbook On Teaching And Learning Economics, Edward Elgar, 2012.7
and Mark Maier, Just in Time Teaching: Across the Disciplines, and Across the Academy, Stylus Publishing,2009. 7
Simkins, Scott P. and Mark H. Maier, “Learning from Physics Education Research: Lessons for Economics Educa-tion,” 2008. 8
28

Slemrod, Joel, “The Role of Misconceptions in Support for Regressive Tax Reform,” National Tax Journal, March2006. <http://www.brookings.edu/comm/events/20031216_Slemrod.pdf>. 17
Trustees of the Social Security and Medicare Trust Funds, “Status of the Social Security and Medicare Programs,”2009. <http://www.ssa.gov/OACT/TRSUM/index.html>. 21
Walstad, William B. and Sam Allgood, “What Do College Seniors Know about Economics?,” The American Eco-nomic Review, May 1999, 89 (2), 350–354. <http://links.jstor.org/sici?sici=0002-8282%28199905%2989%3A2%3C350%3AWDCSKA%3E2.0.CO%3B2-T>. 1, 2, 12
, Michael W. Watts, and Ken Rebeck, Test of Understanding in College Economics: Examiner’s Manual, fourthed., National Council On Economic Education, 2007. 2
Wieman, Carl, “APS News–The Back Page. The “Curse of Knowledge” or Why Intuition About Teaching OftenFails,” American Physical Society News, 2007, 16 (10). <http://www.cwsei.ubc.ca/resources/files/Wieman_APS_News_Back_Page_with_refs_Nov_2007.pdf>. 1, 9
, “Why Not Try a Scientific Approach to Science Education?,” Change, September/October 2007, 53 (40), 9–15.<http://www.cwsei.ubc.ca/resources/files/Wieman-Change_Sept-Oct_2007.pdf>. 8
Williamson, Maureen R. and Alexander J. Wearing, “Lay People’s Cognitive Models of the Economy,” Journal ofEconomic Psychology, 1996, pp. 3–38. <http://dx.doi.org/10.1016/0167-4870(95)00033-X>. 9
Wood, Geoffrey E., “Fifty Economic Fallacies Exposed,” SSRN eLibrary, 2006. <http://ssrn.com/paper=676634>. 1
World Trade Organization, “World trade developments in 2008.” <http://www.wto.int/english/res_e/statis_e/its2009_e/its09_world_trade_dev_e.htm>. 16
29