Initial and Long-Term Evaluation of the Tire … 06, 2011 · Initial and Long-Term Evaluation of...
50
Initial and Long-Term Evaluation of the Tire-Pavement Noise Produced by Various Portland Cement Concrete Surface Textures Measurements on the State Route KN 58 Mojave Bypass 2003 to 2010 Prepared by Paul R. Donavan, Sc.D. Illingworth & Rodkin, Inc. 505 Petaluma Boulevard South Petaluma, CA 94952 June 6, 2011
Transcript of Initial and Long-Term Evaluation of the Tire … 06, 2011 · Initial and Long-Term Evaluation of...

Initial and Long-Term Evaluation of the Tire-Pavement Noise Produced by Various
Portland Cement Concrete Surface Textures
Measurements on the State Route KN 58 Mojave Bypass 2003 to 2010
Prepared by
Paul R. Donavan, Sc.D. Illingworth & Rodkin, Inc.
505 Petaluma Boulevard South Petaluma, CA 94952
June 6, 2011

TABLE OF CONTENTS
CHAPTER 1 – INTRODUCTION.................................................................................................1 CHAPTER 2 – NOISE MEAUSREMENT DESCRIPTION.........................................................2 CHAPTER 3 – EVALUATION OF INITIAL APPLIED SURFACE TEXTURES......................5 Description of Baseline Pavement Surface Textures ..............................................................5 OBSI Results ...........................................................................................................................6 Analysis of Pavement Joints ...................................................................................................10 Data Analysis Methods .....................................................................................................10 Results of Joint Analysis ...................................................................................................11 CHAPTER 4 – EVALUATION OF MODIFIED SURFACE TEXTURES ..................................15 Description of Modified Surfaces ...........................................................................................15 OBSI Results ...........................................................................................................................15 Transient Analysis of Modified Pavement Joints ...................................................................23 CHAPTER 5 – ACOUSTIC LONGEVITY THORUGH SEVEN YEARS...................................23 Results of the 2008 Measurements..........................................................................................27 Results of the 2010 Measurements..........................................................................................29 Results in and out of the Wheel Path ......................................................................................30 High Frequency Noise Mechanisms .......................................................................................31 CHAPTER 6 – CONCLUSIONS ...................................................................................................33 Initial Baseline Surfaces (March 2003)...................................................................................33 Surface Modifications (June 2003) .........................................................................................33 Acoustic Longevity (2003-2010) ............................................................................................34 REFERENCES ...............................................................................................................................35 APPENDIX A: CONTROLLED PASSBY MEASUREMENTS APPENDIX B: INTERIOR NOISE MEASUREMENTS
2

CHAPTER 1 INTRODUCTION In the State of California, the standard texturing of Portland cement concrete (PCC) pavement is longitudinal tining. This is applied to all “at-grade” highway sections that use this type of pavement. From noise measurements made in California and Arizona in 2002, it was known that this texturing is typically on the quieter range of those used throughout the country, particularly in comparison to transverse tining used more widely elsewhere1,2. As part of on-going Quiet Pavement Research activities, Caltrans investigated other texturing methods with the intent of determining which would provide the lowest tire/pavement noise level. To perform this research, Caltrans had three different surface textures applied to the new PCC road surface on a newly constructed portion of a four-lane, divided highway on California State Route 58 (SR 58) that bypasses the City of Mojave in Kern County. The surfaces included typical California longitudinally tining, burlap drag, and longitudinally broom textures. Prior to opening, tire/pavement noise measurements were made on these three pavement sections. Initial noise measurement types consisted of controlled pass-by (CPB) noise, on-board sound intensity (OBSI), and interior noise in the test vehicle. Several months after the time of the initial measurements, eight sections of the original pavements were ground and/or grooved to various surface texture geometries. The original three textures were initially measured in March 2003 and again in June 2003 along with the eight new applied textures. Since these initial measurements, the test sections have measured on occasion through 2010. The purpose of this report is to document the initial performance of all eleven surfaces and to examine their performance or “acoustic longevity” through 2010. The main body of this report is devoted to the primary measurement method of OBSI. The methods and results of the controlled pass-by and interior noise measurements are reported in Appendix A and B, respectively.
1

CHAPTER 2 NOISE MEASUREMENT DESCRIPTION The primary technique used to quantify tire/pavement noise generated by the Mojave Bypass PCC surfaces was sound intensity. These measurements were done in a manner that has been applied to many other pavement surfaces in California and Arizona. Originally developed at General Motors Corporation for tire noise research, this method was adapted by Illingworth & Rodkin, Inc. (IR) for Caltrans use in evaluating the noise due to highway pavement surfaces in-situ in 20022. This method was the subject of research work sponsored by the National Highway Cooperative Research Program (NCHRP) Project 1-443and is currently being standardized as an American Association of State Highway Transportation Organizations (AASHTO) test procedure4. As part of the continuing development and demonstration of the sound intensity technique, controlled vehicle pass-by tests (see Appendix A) were made during the initial 2003 tests using the same vehicle and tires used for the OBSI measurements. For the Mojave site, pass-by measurements were readily performed at that time as there was only very limited construction traffic present on the unopened highway. In addition to the exterior measurements of tire/pavement noise, the interior noise in the test vehicle (see Appendix B) was also measured for each of the three test surfaces in a manner employed for other pavements in California and Arizona1. The sound intensity measurements were performed using the same methodology as those completed for Caltrans throughout California5. Through 2006, the test vehicle was exclusively a Subaru Legacy Outback equipped with Goodyear Aquatred 3 test tires and sound intensity data was acquired with a single probe mounted on the right rear spindle of the test vehicle. Photographs of the Aquatred test tire and single probe OBSI fixture installed on the vehicle are provided in Figs. 1a and 2a. The probe
(a) Aquatred 3
(b) SRTT
Figure 1: Photograph of each test tires
consisted of two G.R.A.S. Type 40AI ½ inch diameter condenser microphones and two G.R.A.S. Type 26AK preamplifiers spaced 0.63 inches (16 mm) apart in a “side-by-side” orientation. Prior to measurement, a foam windscreen was placed over the microphones. Sound intensity was measured in real time using a 2-channel Larson Davis 2900 real time analyzer (RTA). The OBSI measurements were made with the probe located 4 inches outboard of the trailing edge of the tire contact patch and 4
2

(a) Single probe configuration (leading edge)
installed on the Subaru test vehicle (2003)
(b) Dual probe configuration installed on the
Malibu test vehicle (2006) Figure 2: OBSI equipment installed on the test vehicles
inches outboard of the leading edge at a height of 3 inches above the pavement. With this probe and fixture configuration, sound intensity is measured at only one probe location per pass over the test pavement. The probe is repositioned, and the run repeated. The data from each position are later averaged together on an energy basis to obtain the average sound intensity for the tire operating on each test surface. This average intensity characterizes the sound power radiated to the sideline of the vehicle and is known to correlate well with the corresponding pass-by data2. Consistent with the statewide database, the vehicle was operated at the standard speed of 60 mph although data was also taken at 45 mph in the March 2003 baseline tests. Because of the interest in characterizing the noise from joints and the lack of interference from traffic, some sound intensity data was also acquired at 45 mph in the 2003 measurements. The RTA was set to capture a “linear” (energy) average over a 5 second interval consistent with other pavement tests. The data were reduced to provide overall, A-weighted sound intensity levels for the 400 to 5000 hertz (Hz) one-third octave band spectra. For each test section and probe location, two to three passes over the pavements were measured. In all cases, the difference between successive runs was 0.5 dB or less in terms of overall A-weighted level. The reported data is then an arithmetic average of the two (or more) runs. In 2006, it was verified that the probe could also be used mounted vertically which allowed the simultaneous measurement at both points reducing the measurement time by half. Switching to a dual probe system required the used of a new Brüel & Kjaer Pulse four-channel analyzer. The second probe added to the system used the same type of microphones and preamplifiers as described for the single probe. Although these changes were rather minor, some small average differences (on the order of 0.3 to 0.5 dB) were documented6. Beginning in 2007, the OBSI measurements were also made with the P215/R16 ASTM Standard Reference Test Tire (SRTT) as specified in the proposed AASHTO Standard Method of test for OBSI as the Aquatred tire was becoming no longer available. The use this larger tire also resulted in a test vehicle change to a Chevrolet Malibu in order to accommodate the new tire. The dual probe fixture is shown in Figure 2b as installed on the Malibu test vehicle with the SRTT shown in Figure 1b. A second Aquatred tire was acquired for use on the Malibu as mounted on a wheel with a different bolt pattern. For the 2008 measurements, extensive comparative testing was completed examining all these of these permutations on the Mojave sites. For the 2009 and 2010 tests, the Malibu
3

was used exclusively and the correlations for each specific test section were used to adjust the data to correspond to the original test vehicle and Aquatred tire. On average, these corrections subtracted 0.5 dB from the Malibu/Aquatred results to account for differences that ranged from 0.2 to 1.1 dB depending on the specific surface. Following this process, the most consistent set of data was generated for comparison over the 7½ year period.
4

CHAPTER 3 EVALUATION OF INITIAL APPLIED SURFACE TEXTURES Description of Baseline Pavement Surface Textures The three baseline pavement surfaces were textured with longitudinal tining, burlap dragging, and broom finish (Figure 3). The longitudinal tine grooves were 0.09 inch (2.4 mm) to 0.13 inch (3.2 mm)
Figure 3: SR 58 Bypass PCC baseline test section textures
wide, 1/16 inch (1.5 mm) to 5/16 inch (8 mm) deep, and randomized at ¼ inch (6.4 mm) to ¾ inch (19.1 mm) apart. The burlap drag and broom textures were applied to the uncured surfaces in the longitudinal direction. The surfaces were all placed in the eastbound direction of travel on both lanes of vehicle travel. In addition to the texturing, the PCC surfaces contained discontinuities in the transverse direction due to joints between the concrete slabs. To prevent future faulting, the slabs were dowelled together at the joints, which occurred at a randomized spacing ranging from 11 ft (3.35 m) to 14 ft (4.27 m). The joints were nominally ½ inch (12.5 mm) wide and partially filled with an epoxy plug recessed below the upper surface of the pavement (Fig. 4). These joints were found to produce an audible “slap” sound perceived both inside the test vehicle as it was driven on the surfaces and outside the vehicle as it drove by. Photographs of the joints for each of the three textures are shown in Figure 5.
Burlap Drag
Direction of Travel
Quarter (Typical)
Longitudinal Tined
Broom
5

Figure 4: Cross section view of typical pavement joint
Figure 5: Typical pavement joints for each baseline test surface
Surface #2: Burlap Drag Surface #3: Broomed
Surface #1: Longitudinally Tined
Surface #2: Burlap Drag Surface #3: Broomed
Surface #1: Longitudinally Tined
6

OBSI Results The one-third octave and overall OBSI levels for the three baseline textures are presented in Figure 6 as measured at the standard speed of 60 mph. At 103.4 dBA, the longitudinal tine surface is 2.0 and 1.7 dB
70
75
80
85
90
95
100
105
500 630 800 1000 1250 1600 2000 2500 3150 4000 5000
1/3 Octave Band Center Frequency, Hz
So
un
d In
ten
sity
Le
vel,
dB
A
Longitudinal Tine - 103.5 dBA
Burlap Drag (101.5 dBA)
Broomed (101.8 dBA)
Figure 6: 1/3 Octave band spectra for baseline surfaces measured at 60 mph
higher in level than the burlap drag and broom surfaces, respectively. This difference is dictated by the higher levels seen below 1600 Hz in which the differences range from 1½ dB to as much as 4 dB. From Figure 3, the longitudinal tine surface appears to have more surface roughness than the other two which may the cause of the higher levels in lower frequency bands. The spectral shapes of the burlap drag and broom surface virtually overlay through out the entire spectrum. Especially for these two surfaces, there is a secondary “peak” at 1600 Hz which is the second harmonic of the tread passage frequency that occurs at about 825 Hz for this tire for 60 mph. At 45 mph as shown in Figure 7, the 1600 Hz is reduced in frequency to about 1200 Hz, which in turns fills in the “valley” apparent in the 60 mph results for the 1250 Hz one-third octave band. At the lower speed, the difference between the longitudinal tine and other two surfaces is only more pronounced below the 1250 Hz band. The differences in overall level, however, remain about the same as those at 60 mph. Comparison of the Mojave Bypass baseline textures to the OBSI overall levels of other pavements is presented in Figure 8. These comparisons include PCC surfaces measured in California and Arizona and, for reference, the level measured for the new 75mm thick open graded asphalt concrete (OGAC) surface of the Caltrans Quieter Pavement Research Test Sections of LA 138 near Neenach, California. Relative to the other PCC surfaces, the burlap drag and broom surfaces tend to be among the quietest tested through 2003. Conversely, the longitudinally tined surface produced the levels on the higher end for this type of texture, 1.5 dB higher than an ADOT test surface on SR 202, and 1.8 dB higher than California Santa Clara 85 pavement. However, the Mojave pavement is slightly lower (0.6 dB) than the texture of the new I-210 pavement in Los County. The one-third octave spectra for these four longitudinal tine pavements are shown in Figure 9 and photographs of the four surfaces are compared in
7

65
70
75
80
85
90
95
100
500 630 800 1000 1250 1600 2000 2500 3150 4000 5000
1/3 Octave Band Center Frequency, Hz
So
un
d In
ten
sity
Le
vel,
dB
A
Longitudinal Tine - 99.1 dBA
Burlap Drag - 97.3 dBA
Broomed - (97.5 dBA)
Figure 7: 1/3 Octave band spectra for baseline surfaces measured at 45 mph
96.9
101.
2
101.
5
101.
7
101.
8
102.
0
102.
2
102.
3
102.
6
103.
1
103.
2
103.
5
103.
8
104.
1
107.
1
109.
2
95
97
99
101
103
105
107
109
111
LA 1
38 7
5mm
OGAC
I-280
Rou
gh G
roun
d PCC
58 B
ypas
s Lon
g. B
urlap
SCL 85
PCC (L
ong.
Tine
)
58 B
ypas
s Lon
g. B
room
ed
AZ Lon
gitud
inal T
ine
I-5 S
acra
men
to P
CC
I-280
New
Tex
ture
d PCC
I-280
New
Gro
und
PCC
LA 1
4 Age
d PCC
58 B
ypas
s Brid
ge D
eck
58 B
ypas
s Lon
g. T
ine
I-280
Orig
inal P
CC
I-210
Clar
emon
t
AZ Unif
orm
Tra
nsve
rse
AZ Ran
dom
Tra
nsve
rse
So
un
d In
ten
sity
Lev
el, d
BA
Mojave BypassCalifornia PCC
Transverse TinedOGAC
Figure 8: Comparison of Mojave test sections to other California and Arizona pavements
Figure 10. In the spectral data, results for I-210 are similar to Mojave although at 1600 Hz and above the levels I-210 range about 1½ dB to 3½ dB higher. From Figure 10, it appears as if there is less small scale texture in the I-210 surface which could induce more friction related noise in these frequencies7. In general, however, there is little else from the photographs that appear to explain the total 2½ dB difference between the pavements. The SCL 85 may have slightly less positive texture which could
8
a. Mojave b. Arizona SR 202
c. SCL 85 d. I-210
Figure 10: Photographs of different longitudinal tine PCC surfaces
70
75
80
85
90
95
100
105
500 630 800 1000 1250 1600 2000 2500 3150 4000 5000
1/3 Octave Band Center Frequency, Hz
So
un
d In
ten
sity
Lev
el,
dB
A
Mojave - 103.5 dBA
AZ 202 - 102.0 dBA
SCL 85 - 101.7 dBA
I-210 - 104.1 dBA
Figure 9: 1/3 Octave band spectra for different longitudinal tine PCC surfaces
9

surfaces display a secondary peak at 1600 Hz while for the Arizona pavement it is not as pronounced. Analysis of Pavement Joints Data Analysis Methods During the sound intensity tests, the sound pressure signals from the two intensity microphones were audibly monitored for each segment of the roadway surface. In this monitoring, the joints between pavement sections were found to produce audible slaps. After the tests, the signals of sound pressure as a function of time were reviewed on an oscilloscope and noticeable “spikes” in the sound pressure occurred corresponding to the joints. These spikes were of sufficient amplitude relative to the rest of the signal that it was possible to reliably trigger the Larson Davis 2900 Analyzer with these spikes. Using an 80 m-sec time window, the joint spike is clearly visible compared to the more continuous, random signal produced by the surface between the joints as shown in Fig. 11 these sound pressures were
recorded for the inboard, leading edge microphone for the broom finish PCC. To produce a direct
-1.20E+06
-1.00E+06
-8.00E+05
-6.00E+05
-4.00E+05
-2.00E+05
0.00E+00
2.00E+05
4.00E+05
6.00E+05
8.00E+05
1.00E+06
1.20E+06
0 0.01 0.02 0.03 0.04 0.05 0.06 0.07 0.08
Time, seconds
Sca
led
So
un
d P
res
sure
Am
plit
ud
e
With Joints
Without Joints
Figure 11: Sound Pressure time signals for burlap drag test section with and without joint slap included (scaled by reference pressure, 20μPa)
comparison of noise level with and without the slap, the time windows including and excluding the slap were produced by delaying the time window relative to the slap. Using this technique, Fast Fourier Transform (FFT) spectra were produced by averaging over eight occurences with and without the joint slap. To complete the comparison, the narrow band spectra were summed into one-third octave band levels. Before comparing the data obtained from the transient analysis, some discussion needs to be given to time windowing and rate of occurrence of the joints at 60 mph. If only one slap occurs in a given time
10

window, the sound pressure level resulting from the FFT decreases with increased time duration of the window as the impulsive slap gets averaged more with the lower sound pressure levels between joints. Considering just a single tire traveling on the road, the time between slap occurrences is just the separation between the joints divided by vehicle speed. For the joints randomly occurring at 11 ft (3.35 m) to 14 ft (4.27 m), the temporal separation between joint slaps is from 159 and 125 m-sec, respectively, at 60 mph. The time used for the analysis was 80 m-sec, or a little less than half of the time between joints. Thus, for a single tire (or axle), the duration of the quieter noise between joints would actually be about twice that determined by 80 m-sec time window. This would reduce the ratio of slap noise to noise generated by the texture alone as measured with the 80 m-sec window. However, for a light vehicle traveling on a road, two slaps occur for each joint, one for each tire (or axle) as experienced by a stationary observer. For the test vehicle with a wheelbase of 10 ft (2.74 m), the slap from the front and rear tires would be separated by 102 m-sec at 60 mph. For a stationary observer, this would result in 2 slaps in a 160 m-sec window or one in an 80 m-sec window. As a result, using the 80 m-sec window for the on-board data should give the relative contribution of the joints similar to that which would be experienced by a stationary observer. Results of Joint Analysis The analysis described in the previous section was applied to joints occurring in each of the three baseline pavements. Based on the above discussion, spectral data based on the 80 m-sec window can be properly used for comparing tire/pavement noise with and without the joints included. It should be noted, however, that these spectra are only indicators of OBSI performance as they are constructed from sound pressure level data only. As an example, Figure 12 illustrates that the primary differences with and without the joints for the burlap drag baseline pavement corresponding to the joint slap of Figure 11.
65
70
75
80
85
90
95
100
105
125
160
200
250
315
400
500
630
800
1000
1250
1600
2000
2500
3150
4000
5000
6300
8000
1/3 Octave Band Center Frequency, Hz
So
un
d P
res
su
re L
evel
, dB
A
SPL With Joints
SPL Without Joints
Figure 12: Comparison of 1/3 octave band sound pressure levels with and without joint slap on burlap drag texture surface
11

Differences with and without the joint occur at frequencies below 1600 hertz where the levels with the joints are higher. Common to the longitudinal tine and broom surfaces, the differences in individual one-third octave bands were typically 2 to 3 dB or more in the frequencies around 800 hertz. Slightly smaller differences were seen for the longitudinally tined surface. The overall A-weighted levels with and without the joints included can also be calculated by summing the one-third octave band levels. In doing this, it was found that the joints for the longitudinal tine surface increased the level by 1.3 dB, and for the burlap drag and broom surfaces, the joints added 1.9 and 2.0 dB, respectively. As would be expected, the increase for the louder longitudinal tine surface is less than the quieter surfaces because the level between the joints is lower providing less “masking” of the joints. The sound pressure impulses for the three different surfaces can also be compared to gain insight into the events, at least on a qualitative basis. For three events occurring on each surface, it appears that there is little difference in the joint generated impulse as shown in Fig. 13. The joints generate two
-1.50E+06
-1.00E+06
-5.00E+05
0.00E+00
5.00E+05
1.00E+06
1.50E+06
0 0.001 0.002 0.003 0.004 0.005 0.006 0.007 0.008 0.009 0.01
Time, seconds
Sca
led
So
un
d P
res
su
re A
mp
litu
de
Longitudinal TineBurlap DragBroomed
Figure 13: Sound Pressure time signals for joint slaps on baseline surfaces at 60 mph (scaled by reference pressure, 20μPa)
positive pressure peaks and possibly a third compared to the rest of the pavement. The cycle of impulse is about 0.001 seconds corresponding to about 1000 Hz. These oscillations decay quickly and fall back into the texture generated sound pressure by the time of the third oscillation. In these data, the second oscillation for the broom surface is slightly higher than the other surfaces, however, this is considered to be more a random occurrence in response as the initial oscillations are almost identical. Data for joint slap at 45 mph is compared to that obtained at 60 mph in Figure 14 for the burlap drag surface. This comparison indicated that the oscillations for the joint are independent of speed in the temporal pattern while the sound pressures for the slower speed are slightly reduced in amplitude. This behavior was later confirmed with a analysis of air-pumping from the pavement grooves in which the frequency of oscillation dependent only the length of the tube formed when the tire contact patch covers the pavement groove8.
12

-1.50E+06
-1.00E+06
-5.00E+05
0.00E+00
5.00E+05
1.00E+06
1.50E+06
0 0.001 0.002 0.003 0.004 0.005 0.006 0.007 0.008 0.009 0.01
Time, seconds
Sca
led
So
un
d P
ress
ure
Am
plit
ud
e
60 mph
45 mph
Figure 14: Sound Pressure time signals for joint slaps on burlap drag baseline surface for vehicle speeds of 60 and 45 mph (scaled by reference pressure, 20μPa)
The influence of impulsive slap joint noise was also examined in the pass-by data (see Appendix A for further details). To capture this, individual pass-by data were examined using a 5 m-sec sampling of the overall A-weighted “impulse” level and A-weighted “fast” meter response. The impulse function has a 35 m-sec exponential response time which is more suitable for detecting the 5 m-sec impulse generated by the joints, however, its decay time is 1500 m-sec. The fast response corresponds to a 125 m-sec exponential averaging and is used to determine the maximum level during a vehicle pass-by. This type of sound level analysis for a pass-by on the longitudinal tined surface is presented in Figure 15 for the
66
67
68
69
70
71
72
73
74
75
76
77
6.0 6.2 6.4 6.6 6.8 7.0 7.2 7.4 7.6 7.8 8.0 8.2 8.4 8.6 8.8 9.0
Time, seconds
So
un
d P
ress
ure
Lev
el, d
BA
Impulse Response
Fast Response
Typical Joint Slap Impulses
Figure 15: Occurrence of joint slap impulses in pass-by data – 15 m microphone location, 60 mph for longitudinal tine surface texture
13

15 m microphone location. The slaps from the joints are clearly indicated by the impulse response and occur at a rate dictated by the vehicle wheelbase, spacing of the joints and vehicle speed. For 60 mph as shown in Figure 15, the slaps can be as close together as 22 m-sec and as far apart as 160 m-sec. Once the slaps are identified by the impulse response, their effect on the fast response level becomes more apparent. Given the rate of occurrence of the slaps, it was not possible to quantitatively extract the joints from the pavement texture; however, it is apparent that the joints do contribute to the maximum pass-by level.
14

CHAPTER 4 EVALUATION OF MODIFIED SURFACE TEXTURES Description of Modified Surfaces In May of 2003, two basic types of surface modifications were applied to the existing PCC surfaces on the Mojave Bypass. The first was “texture ground” in which the blade spacing was varied. For this operation, the grinding did not follow the existing pavement profile, but rather averaged the depth of cut over a fixed distance. This operation tended to eliminate any height discontinuities between adjacent slabs. The grooving operations cut constant depth longitudinal grooves into the pavement following the surface profile. These grooves were varied in both separation and depth for different test sections. Since this operation follows the surface profile and it does not affect any discontinuities at the slab joints. For one of the eight sections, grooving and texture grinding operations were both applied. Specific information on the eight test sections is provided in Table 1 and photographs of each are given in Figure 16.
Table 1: Pavement Surface Treatments Applied to Baseline PCC
Description Test Section Type Details
Base Texture
1 Texture Grind 0.120" Blade Spacing* Longitudinal Tined
2 Texture Grind 0.120" Blade Spacing Burlap Drag
3 Grooved 3/4" apart, 1/8" deep Burlap Drag
4 Grooved 3/4" apart, 1/4" deep Burlap Drag
5 Texture Grind 0.105" Blade Spacing Burlap Drag
6 Texture Grind &
Grooved 0.120" blade spacing & grooves
3/4" apart, 3/8" deep Broom
7 Grooved 3/8" apart, 1/4" deep Broom
8 Texture Grind 0.120" Blade Spacing Broom
OBSI Results Relative to the measurements of the longitudinal tine, burlap drag, and broom surfaces from March 2003, the measurements of surfaces in June were different in several ways. Due to the placement of the newly textured test sections, the measurements of the original surface could not be made at the exact same locations as done previously. Also, because of the (shorter) length of the textured test sections,
15

Figure 16: Photographs of modified SR 58 surfaces with various grinding and grooving operations (see Table 1) Figure 16: Photographs of modified SR 58 surfaces with various grinding and grooving operations (see Table 1)
#2 – Ground #1 – Ground
#4 – Groove #3 – Grooved
#5 – Ground
#6 – Groove & Ground
#7 – Groove
#8 – Ground
sound intensity was averaged over a 4 second time instead of the standardized 5 second time. At the 60 mph test speed, this is equivalent to 352 ft. With the joint spacing ranging from 11 to almost 14 ft, this interval was sufficient to average over 24 to 30 pavement joints. Finally, although the same test tires
sound intensity was averaged over a 4 second time instead of the standardized 5 second time. At the 60 mph test speed, this is equivalent to 352 ft. With the joint spacing ranging from 11 to almost 14 ft, this interval was sufficient to average over 24 to 30 pavement joints. Finally, although the same test tires
16

were used, the test vehicle was similar to that used in March, but not identical (1998 Subaru Legacy Outback versus a 1997 model). These somewhat subtle differences, however, appeared not to be an issue as the overall levels were within 0.1 to 0.4 dBA of each other and one-third octave band spectra between the March and June testing compared quite closely as shown in Figure 17. Also, as before, joint slap was audible for all three surfaces.
70
75
80
85
90
95
100
500 630 800 1000 1250 1600 2000 2500 3150 4000 5000
1/3 Octave Band Center Frequency, Hz
So
un
d In
ten
sity
Lev
el, d
BA
Long. Tine 3/03 - 103.5 dBA
Long. Tine 6/03 - 103.4 dBA
Burlap Drag 3/03 - 101.5 dBA
Burlap Drag 6/03 - 101.4 dBA
Broom 3/03 - 101.8 dBA
Broom 6/03 - 102.2 dBA
Figure 17: Overall and 1/3 octave band OBSI level comparison of baseline surfaces between March and June testing in 2003
Overall A-weighted sound intensity levels for the original surfaces and the eight new test sections are presented in Figure 18. Compared to the “base” surface, the test sections produced higher noise level in six of the eight cases. The two that produced lower levels, Section #1 & #5, were both texture grind surfaces. In general, the texture grind surfaces did not have audible joint slap, however, this did not always result in lower levels relative to the base surface (e.g. Sections #2, #6, and #8). Spectral differences are also apparent between the different surface treatments as shown in Figure 19. These occur in two frequency ranges: lower frequency, at 800 hertz and below; and higher frequencies of 1,600 to 2,000 hertz. With the exception of the longitudinal tined base surface, the texture grind surfaces tend to produce higher levels in the lower frequency region while they produce consistently lower levels in the higher frequency range. Given the small range in noise level for the base surfaces, it is difficult, at best, to draw conclusions within each type of surface treatment. In Figure 20, the overall A-weighted sound intensities for the various grooved test sections are compared. Excluding the surface that is both grooved and ground, the range in the ground surfaces is small, just over 1 dB. In what should be direct comparison of the groove parameters, it is seen that with groove depth held constant at 1/4 inch, the closer spacing (3/8 inch) produced slightly higher levels than the wider spacing (3/4 inch). However, the difference in level between the burlap drag and broomed base surfaces alone are greater than this apparent difference from the grooving. For constant groove spacing, the shallower depth (1/8 inch) produced directionally lower
17

98
99
100
101
102
103
104
105
106
Long
itudin
al Tine
Sect #
1 Gro
und
Burlap
Dra
g
Sect #
2 Gro
und
Sect #
3 Gro
ove
Sect #
4 Gro
ove
Sect #
5 Gro
und
Broom
ed
Sect #
6 Grd
/Grv
Sect #
7 Gro
ove
Sect #
8 Gro
und
Ove
rall
So
un
d In
ten
sity
Lev
el, d
BA
Baseline SurfacesModified Surfaces
Figure 18: Comparison of overall A-weighted sound intensity levels for baseline and modified surfaces
70
75
80
85
90
95
100
105
500 630 800 1000 1250 1600 2000 2500 3150 4000 5000
1/3 Octave Band Center Frequency, Hz
So
un
d In
ten
sit
y L
evel
, dB
A
Sect #1 - Texture 1Sect #2 - Texture 1aSect #3 - Groove #1Sect #4 - Groove #2Sect #5 - Texture #2Sect #6 - Grind/GrooveSect #7 - Groove #3Sect #8 - Texture #3Longitudinal TineBurlap DragBroomed
Figure 19: Comparison of one-third octave band A-weighted sound intensity spectra for the Mojave SR 58 baseline and modified surfaces
18

98
99
100
101
102
103
104
105
106
Grooves 19.1 mmapart, 3.2 mm deep
Grooves 19.1 mmapart, 6.4 mm deep
Grooves 9.4 mmapart, 6.4 mm deep
Texture Grind w/3.05mm blade spacing +
grooves 19.1 mmapart, 9.4 mm deep
Ov
era
ll S
ou
nd
Inte
nsi
ty L
eve
l, d
BA On Burlap Drag
On Broom
Figure 20: Comparison of overall A-weighted sound intensity levels for various grooved test surfaces
levels than the deeper grooves (1/4 inch) on the same burlap drag base surface. However, given the typical measurement uncertainty on the order of ±0.2 dB for “back-to-back” runs, the significance of the difference measured for these different groove depths is questionable. Further, in comparing the different groove parameter cases to the base surface (see Figure 18), in each case, grooving raised the noise level over the base surface. On the broomed surface, combining texture grinding with grooving displayed no noise benefit, and may have slightly increased the noise over grooving alone. As suggested previously, adding grinding to a grooved surface improved the noise at higher frequency from 1,600 to 2,000 hertz at the expense of raising levels in the lower frequencies as shown in Figure 21. Based only on the elimination of audible joints slaps with the different grinding parameters, it would be expected that the ground surfaces would be quieter than the corresponding base surfaces. For Test Section #1 and #5 this is apparently the case (Figure 18). However, for Sections #2 and #8, the ground surfaces are actually higher in level than the base surfaces. Comparing the overall levels of the texture grind surfaces shown in Figure 22, some noise levels differences are sufficiently large and comparisons sufficiently direct that some differences are apparently significant. On the burlap drag base surface, a smaller blade spacing of 0.105 inches versus 0.120 inches lowered the noise level by 1.4 dB. For a constant blade spacing of 0.120 inches, there was no dependence on the base surface. This implies that the texture grinding process eliminates other surface features which would normally create differences between PCC surfaces. Visually, this is seen in comparing the photographs of Test Sections #1, #2, and #8, which were originally longitudinally tined, burlap drag, and broom surfaces, respectively. This is also confirmed by spectral data presented in Figure 23 which shows virtually no frequency content difference between the 0.120 inch spacing, texture grind surfaces as applied to the three difference base surfaces. In contrast, the 0.105 inch spacing, texture grind surface displays reduced low frequency
19

70
75
80
85
90
95
100
105
500 630 800 1000 1250 1600 2000 2500 3150 4000 5000
1/3 Octave Band Center Frequency, Hz
So
un
d In
ten
sity
Lev
el, d
BA
SR 58 Broomed
SR 58 Sect #7 - Groove #3
SR 58 Sect #6 - Grind + Groove
Lower with Increase Apparent Roughness
Higher with Increase Apparent Roughness
Figure 21: Comparison of one-third octave band A-weighted sound intensity spectra for various grooved test surfaces
98
99
100
101
102
103
104
105
106
Texture Grindw/2.7 mm blade
spacing
Texture Grindw/3.1 mm blade
spacing (head outof round)
Texture Grindw/3.1 mm blade
spacing (balancedhead)
Texture Grindw/3.1 mm blade
spacing
Texture Grindw/3.1 mm blade
spacing + grooves19.1 mm apart,9.4 mm deep
Ove
rall
So
un
d I
nte
nsi
ty L
evel
, d
BA
On Burlap Drag
On Longitudinal Tining On Broom
Figure 22: Comparison of overall A-weighted sound intensity levels for texture ground test surfaces
20

70
75
80
85
90
95
100
105
500 630 800 1000 1250 1600 2000 2500 3150 4000 5000
1/3 Octave Band Center Frequency, Hz
So
un
d In
ten
sity
Lev
el, d
BA
w/0.105" spacing
w/0.120" spacing
w/0.120" spacing
w/0.120" spacing
w/0.0120" spacing+grooves
Figure 23: Comparison of one-third octave band sound intensity spectra for texture ground test surfaces with different blade spacings and grooves
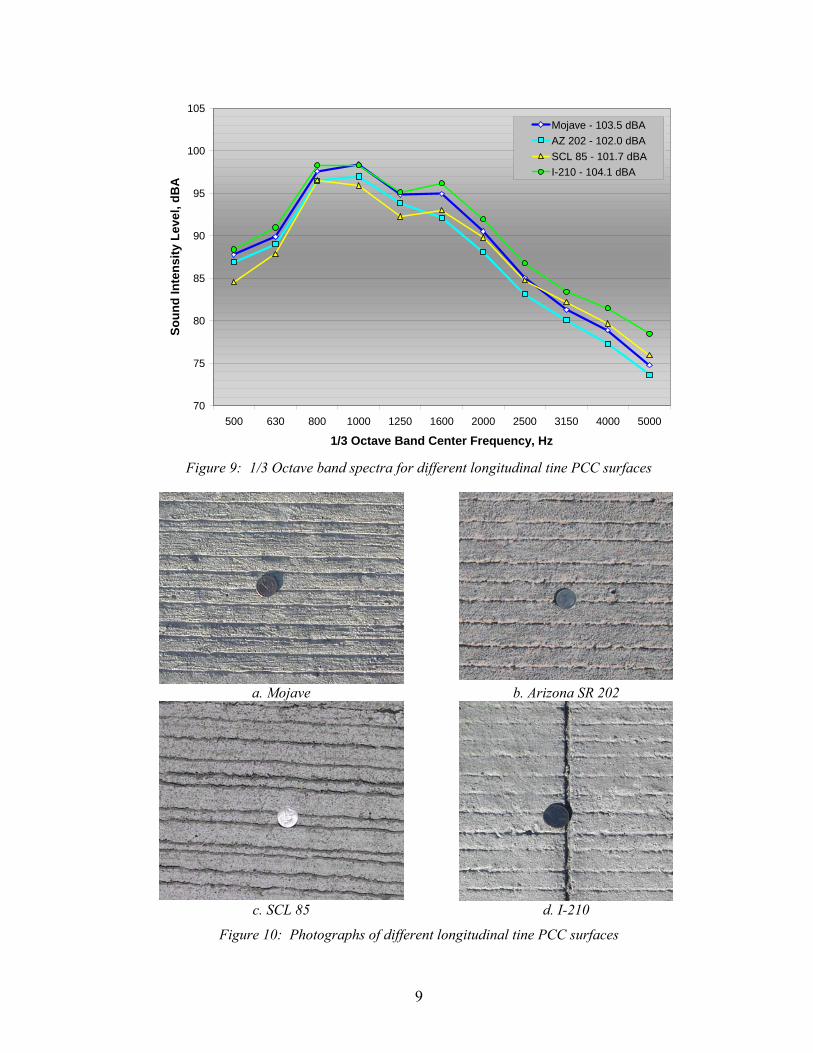
content below 1,250 hertz. This is consistent with results from other pavement surfaces in which lower visual “roughness” produced lower, low frequency levels also3. This trend is also seen for the surface that had both texture grinding and grooving. For this case, visually (see Figure 16), the surface was rougher than the surfaces that were only ground (Sections #7 and #8). This surface also produced more low frequency content than the comparable surfaces that were only ground In regard to the higher frequency differences between the texture grind and non-ground surfaces, comparison to other pavements is useful to understand the nature of the tire noise in the frequencies in the range of 1,500 to 2,300 hertz. On very fine texture surfaces such the “ultra smooth” HMA pavement tested at the Hyundai-Kia (H-K) Proving Ground in California City, California using narrow band analysis, it appears that the energy in this region is related to the tread of the Aquatred tire9. Data for this surface is presented in Figure 24 along with data from the longitudinal tine Mojave Bypass surface. For the H-K surface, it is seen that discrete frequencies modulated by the tread passage frequency around 850 Hz account for much of the spectral content between about 750 and 1050 Hz. . The second harmonic of this grouping of frequencies appears in the range from about 1500 Hz to 2100 Hz. Although the levels on the H-K track are lower than the Mojave surface, evidence of the peaks in the range from 1,500 to 2,200 Hz are clearly visible. Comparing the grooved S4 and ground S5 Mojave narrow band data shown in Figure 25, the differences between the two textures occur in this same range related the tread pattern. This implies that difference is at least partially due to tire noise mechanisms associated with higher harmonics of the tread passage frequency. Several of these can hypothesized including air-pumping from the tread voids, higher frequency tread vibration, and scrubbing10. From Figure 16, it is seen that both S4 and S5 have longitudinal grooves in their surface. These should help to relieve air-pumping in both cases and therefore not a likely candidate to explain these differences. For tread vibration, it is seen that the S4 surface has more apparent and random roughness. These features could tends to “break-up” the higher frequency noise which is dependent on a constant repetition rate
21
45
50
55
60
65
70
75
80
85
90
95
0 500 1000 1500 2000 2500 3000 3500 4000 4500 5000
Frequency, Hz
So
un
d In
ten
sity
Lev
el, d
BA
"Ultra Smooth" HMA
Mojave Longitudinal Tine
Figure 24: Comparison of narrow band sound intensity spectra for fine texture asphalt test track surface and Mojave longitudinal tine test surface
50
55
60
65
70
75
80
85
90
95
0 500 1000 1500 2000 2500 3000 3500 4000 4500 5000
Frequency, Hz
So
un
d In
ten
sity
Lev
el, d
BA
Grooved S4
Ground S5
Figure 25: Comparison of narrow band sound intensity spectra for fine texture asphalt test track surface and Mojave longitudinal tine test surface
and shift some energy to the lower frequencies as indicated by Figures 21 and 25. Finally, surface S5 has more fine scale roughness than S4 and possibly slightly higher friction. This could account for a reduction in higher frequency scrubbing noise11. Higher frequency noise mechanisms are discussed further in Chapter 5 in regard to acoustic longevity.
22

Transient Analysis of Modified Pavement Joints Following the process used to analyze the March 2003 recordings, analysis of the sound pressure signals of the inboard microphone of the sound intensity probe opposite the leading edge of the contact patch were performed in the time domain to isolate the contribution of joint slap. As before, post and pre trigger delays were used capture time histories with and without the joint slap included. The resultant time signals for the grooved surface of Section #3 are shown in Figure 26. Comparing these data to
-1.00E+06
-8.00E+05
-6.00E+05
-4.00E+05
-2.00E+05
0.00E+00
2.00E+05
4.00E+05
6.00E+05
8.00E+05
1.00E+06
0 0.01 0.02 0.03 0.04 0.05 0.06 0.07 0.08
Time, seconds
Sca
led
So
un
d P
ress
ure
Am
plit
ud
e
With Joints
Without Joints
Figure 26: Sound Pressure time signals for grooved test section #3 with and without joint slap included (scaled by reference pressure, 20μPa)
Figure 11, it is apparent that the impulse produced by the grooved was little changed over the base burlap drag texture. This is not surprising as the grooving operation did not effect any slab misalignment at the joint. For the ground surfaces, the slaps were not nearly so pronounced as the base or grooved surfaces. For these cases, the trigger level was lowered until the analyzer captured individual time blocks corresponding to the barely discernable peak pressures in the time signal. An example of the resulting time traces is given in Figure 27 for the ground surface of Section #5. The one-third octave band levels derived from the narrow band averaged sound pressure levels are given in Figures 28 and 29 for the grooved and ground surfaces of Figure 26 and 27, respectively. In Figure 29, the there is only a small difference in the spectra with and without the (apparent) joints with individual bands being 1 dB or less. When the joints were audible in the recorded data as for grooved Sect ion #3, the spectra levels below 2000 hertz were higher with the joints included by typically 1 to 3 dB (Figure 28). The one-third octave band data can be further summed into overall A-weighted sound pressure levels and the difference with and without the joints examined. This approximate indicator of joint noise contribution is presented in Figure 30 for all eleven of the surfaces tested. This comparison reveals that the surfaces which were not ground consistently had more contribution from the joints (1 to 2 dB) while the ground surfaces had typically ½ dB or less contribution.
23

-1.00E+06
-8.00E+05
-6.00E+05
-4.00E+05
-2.00E+05
0.00E+00
2.00E+05
4.00E+05
6.00E+05
8.00E+05
1.00E+06
0 0.01 0.02 0.03 0.04 0.05 0.06 0.07 0.08
Time, seconds
Sca
led
So
un
d P
ress
ure
Am
pli
tud
e
With Joints
Without Joints
Figure 27: Sound Pressure time signals for ground test section #5 with and without (weak) joint slap included (scaled by reference pressure, 20μPa)
65
70
75
80
85
90
95
100
105
125
160
200
250
315
400
500
630
800
1000
1250
1600
2000
2500
3150
4000
5000
6300
8000
1/3 Octave Band Center Frequency, Hz
So
un
d P
res
sure
Lev
el,
dB
A
SPL With Joints
SPL Without Joints
Figure 28: Comparison of 1/3 octave band sound pressure levels with and without joint slap on grooved surface #3
24

65
70
75
80
85
90
95
100
105
125
160
200
250
315
400
500
630
800
1000
1250
1600
2000
2500
3150
4000
5000
6300
8000
1/3 Octave Band Center Frequency, Hz
So
un
d P
ress
ure
Le
vel,
dB
ASPL With Joints
SPL Without Joints
Figure 29: Comparison of 1/3 octave band sound pressure levels with and without joint slap on ground surface #5
0
1
2
3
4
Long
itudin
al Tine
Sec
t #1
(Gro
und)
Burlap
Dra
g
Sect #
2 (G
roun
d)
Sect #
3 (G
roov
e)
Sect #
4 (G
roov
e)
Sect #
5 (G
roun
d)
Broom
Sect #
6 (G
rd/G
rv)
Sect #
7 (G
roov
e)
Sect #
8 (G
roun
d)
So
un
d L
evel
Dif
fere
nce
, dB
Leve
l with
Joi
nts
- Le
vel w
ithou
t
Baseline Surfaces
Modified Surfaces
Figure 30: Difference in overall A-weighted sound pressure level with and without joint slap included
25
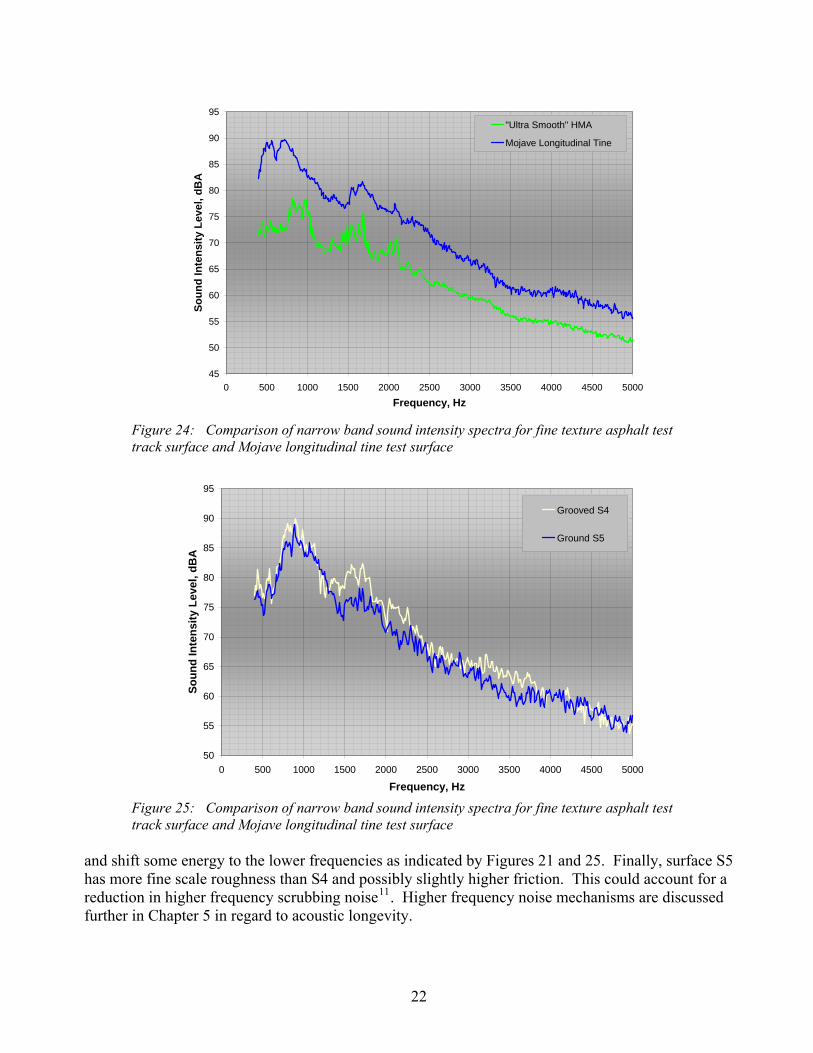
Since the contribution of joints is included in the 5-second average sound intensity data reported in Figure 18, the rank ordering includes both the effect of texture differences and the joints. As a result, it is not possible to isolate and rank order differences due to textures for the OBSI data. However, this can be approximated by considered the overall sound pressure levels calculated from the no-slap sound pressure traces such as the no slap date from Figures 26 and 27. These results are shown in Figure 31
98
99
100
101
102
103
104
105
106
Long
itudin
al Tine
Sec
t #1
(Gro
und)
Burlap
Dra
g
Sect #
2 (G
roun
d)
Sect #
3 (G
roov
e)
Sect #
4 (G
roov
e)
Sect #
5 (G
roun
d)
Broom
Sect #
6 (G
rd/G
rv)
Sect #
7 (G
roov
e)
Sect #
8 (G
roun
d)
So
un
d P
res
sure
Lev
el, d
BA
Baseline Surfaces
Modified Surfaces
Figure 31: Comparison of overall A-weighted sound pressure levels for baseline and modified surfaces with joint slap impulses excluded
and data help to confirm some the interpretation of the sound intensity data regarding differences in the surface treatments. As speculated previously, it appears from Figure 31 that adding grooves the existing burlap drag or broomed surface has virtually no effect on the noise over that dictated by the base surface treatment. Aside from the longitudinal tine section, higher levels generally were produced by those surfaces receiving the 0.120 texture grind surfaces (Sections #1, #2, #6 and #8). The 0.105 gronnd surface, however, appears to produce levels lower than the 0.120 surfaces and is similar to the quietest, burlap drag existing surface. This texturing also has the benefit of reducing joint slap noise. As a result, it is not surprising that this surface produced the overall lowest time-averaged sound intensity level. From the results of Figures 29 and 30, it appears that the shallower 0.105 texture grind did not eliminate the joint contribution as effectively as the 0.120. On the other hand, the lower apparent roughness of the 0.105 surface produced considerably less low frequency content in the sound intensity results (Figure 19). For the high frequencies, 1600 and 2000 hertz, the 0.105 surface was just as effective in reducing the tread related noise as were the 0.120 texture grind surfaces. This would suggest that a texture grind for a given pavement could be optimized for a given existing PCC pavement. The optimization considerations would be: 1.) sufficient depth of the grind to reduce the effects of joint and/or slap faulty; 2.) lower surface roughness to minimize mid frequency noise (400 to 1000); 3.) sufficient surface roughness to break-up higher frequency tread related noise.
26
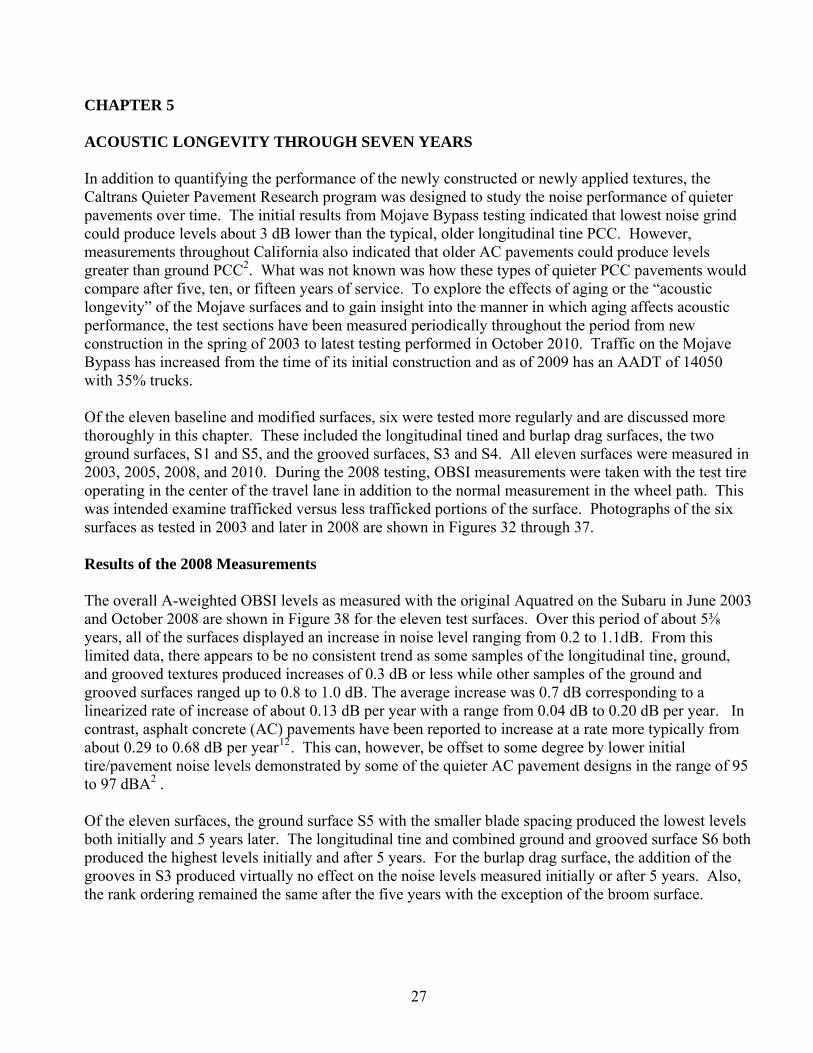
CHAPTER 5 ACOUSTIC LONGEVITY THROUGH SEVEN YEARS In addition to quantifying the performance of the newly constructed or newly applied textures, the Caltrans Quieter Pavement Research program was designed to study the noise performance of quieter pavements over time. The initial results from Mojave Bypass testing indicated that lowest noise grind could produce levels about 3 dB lower than the typical, older longitudinal tine PCC. However, measurements throughout California also indicated that older AC pavements could produce levels greater than ground PCC2. What was not known was how these types of quieter PCC pavements would compare after five, ten, or fifteen years of service. To explore the effects of aging or the “acoustic longevity” of the Mojave surfaces and to gain insight into the manner in which aging affects acoustic performance, the test sections have been measured periodically throughout the period from new construction in the spring of 2003 to latest testing performed in October 2010. Traffic on the Mojave Bypass has increased from the time of its initial construction and as of 2009 has an AADT of 14050 with 35% trucks. Of the eleven baseline and modified surfaces, six were tested more regularly and are discussed more thoroughly in this chapter. These included the longitudinal tined and burlap drag surfaces, the two ground surfaces, S1 and S5, and the grooved surfaces, S3 and S4. All eleven surfaces were measured in 2003, 2005, 2008, and 2010. During the 2008 testing, OBSI measurements were taken with the test tire operating in the center of the travel lane in addition to the normal measurement in the wheel path. This was intended examine trafficked versus less trafficked portions of the surface. Photographs of the six surfaces as tested in 2003 and later in 2008 are shown in Figures 32 through 37. Results of the 2008 Measurements The overall A-weighted OBSI levels as measured with the original Aquatred on the Subaru in June 2003 and October 2008 are shown in Figure 38 for the eleven test surfaces. Over this period of about 5⅜ years, all of the surfaces displayed an increase in noise level ranging from 0.2 to 1.1dB. From this limited data, there appears to be no consistent trend as some samples of the longitudinal tine, ground, and grooved textures produced increases of 0.3 dB or less while other samples of the ground and grooved surfaces ranged up to 0.8 to 1.0 dB. The average increase was 0.7 dB corresponding to a linearized rate of increase of about 0.13 dB per year with a range from 0.04 dB to 0.20 dB per year. In contrast, asphalt concrete (AC) pavements have been reported to increase at a rate more typically from about 0.29 to 0.68 dB per year12. This can, however, be offset to some degree by lower initial tire/pavement noise levels demonstrated by some of the quieter AC pavement designs in the range of 95 to 97 dBA2 . Of the eleven surfaces, the ground surface S5 with the smaller blade spacing produced the lowest levels both initially and 5 years later. The longitudinal tine and combined ground and grooved surface S6 both produced the highest levels initially and after 5 years. For the burlap drag surface, the addition of the grooves in S3 produced virtually no effect on the noise levels measured initially or after 5 years. Also, the rank ordering remained the same after the five years with the exception of the broom surface.
27

Figure 32: Longitudinally tined PCC in 2003 (left) and 2008 (right)
Figure 33: Burlap drag texture PCC in 2003 (left) and 2008 (right)
Figure 34: Ground PCC surface Sect #1 in 2003 (left) and 2008 (right)
Figure 35: Ground PCC surface Sect #5 in 2003 (left) and 2008 (right)
28

Figure 36: Grooved PCC surface Sect #3 in 2003 (left) and 2008 (right)
Figure 37: Grooved PCC surface Sect #4 in 2003 (left) and 2008 (right)
Results of the 2010 Measurements The six primary test surfaces were again measured in October of 2009 and all eleven surfaces in 2010. These were conducted using the newer test car with the newer Aquatred test tire. The correction factors developed in 2008 were used to adjust the data for the primary surfaces to be consistent with the test vehicle and tire used in the historical testing. To compare the changes in one-third octave spectra over the total span of years, the data from 2003 are shown in Figure 39 and those from 2010 are shown in Figure 40. For the 2003 data shown in Figure 39, the levels of the two ground surfaces are noticeably lower than the others in 1600 and 2000 Hz bands. Where the other surface display a “hump” in these frequencies, the ground pavements do not. In the lower frequencies, below 800 Hz, both the longitudinal tine and the ground texture S1 produced higher levels than the others. In the 2010 results shown in Figure 40, the higher frequencies, above 1250 Hz all display a shift upward in level. For the two ground surfaces, the hump at 1600 and 2000 Hz now appears and spectral shape is more like the other pavements. In the lower frequencies, only the longitudinal tine surface stands out from the other surfaces that are now more grouped together and producing lower levels. From Figure 32, the longitudinal tine surface appears to have some longer length scale waviness (on the order of more than an inch) that the other surfaces do not possess. This waviness does not appear to be changed comparing the 2003 to the 2008 photograph. To track these changes with time, the levels for overall level and the level in each one-third octave for each pavement were plotted against the number of years from construction. These data were then fit with linear regressions that reveal the rate of noise level change on a dB/year basis. An example of this
29

is presented in Figure 41 for the ground surface, S1. For this particular pavement, the overall level rate of change is 0.08 dB/year. For the one-third octave band levels, the slopes range from -0.32 dB/year to 0.59 dB/per with the negative slopes occurring in the lower frequency bands (below 1000 Hz) and the larger positive slopes in the higher frequencies (above 1250 Hz). Comparing Figures 39 and 40 or using Figure 41, the reduction in level is apparent in the 400, 500, and 630 one-third octave bands over the time period from 2003 to 2010. From Figure 34, it appears that this surface may have had residual texture or “fins” from the grinding process. This added surface roughness is unique compared to the other ground surface, the burlap drag, and the grooved burlap drag surfaces. As a result, the levels in these bands are 3 to 4 dB higher than those of the other three surfaces. By 2008, these fins are worn down (see Figure 34) and levels on ground surface S1 are approaching those of the other three surfaces. From Figure 41, this reduction in level appears to have occurred in the 4 to 5 years as the levels afterward no longer decrease with time. This effect of initial fins creating higher noise levels is not unique to the S1 and been noted in other research as well13. Similar plots for the other five pavements were generated and slopes for each regression were tabulated and are shown in Table 2. Reviewing these results, the general trend of the slopes of the one-third octave bands below 1000 Hz is that the level versus age slopes are negative, that is, the OBSI decrease with aging. However, the results varying by surface texture. For the most part, the grooved surfaces, S3 and S4, do not show any negative slopes in these frequencies. However, between 2003 and 2008, the pavements show some deterioration (see Figures 36 and 37) where chunks of pavement between the grooves have popped out and are missing. Although these pop-outs or “holes” in the pavement surface are negative in texture, their size is likely sufficient enough to provide some displacement input to the tire, contributing to increased noise from tread band and sidewall vibration in these lower frequencies. This deterioration likely accounts for generally increasing regression slopes for noise versus age for these specific pavements in these lower frequencies. For the ground surfaces, as noted in regard to Figure 41, S1 produced some relatively large negative slopes in the lower frequencies particularly when considered with the S5 ground surface. This can be explained from the photographs of these surfaces (Figure 34 and 35). With the larger blade spacing used for the S1 surface, fins are clearly visible, while for S5, they are not. Further in the 2008 photograph of S1, the fins appear to be completely worn away. For the burlap drag and longitudinal tine sections, the slopes of level versus age tend to be negative, however, the slopes are relatively small except for burlap drag at 400 Hz. Review of the photographs for these surfaces (Figure 32 and 33) does not reveal changes to these surfaces that should effect the lower frequency noise data and little change in the levels was is noted in Table 2. In the higher frequencies, above 1250 Hz, the rates of increase in noise with age are more than 3 to 5 times greater than the rate for the overall level. From Figures 39 and 40, it is seen that the 800 to 1250 Hz bands are the primary contributors to overall levels and in Table 2 these show only low sensitivity to aging. For all of the bands above 1250 Hz, all pavements produce positive slopes ranging from 0.13 to 0.59 dB/year. Averaging over these higher frequency bands and pavements, the resultant slope is 0.42 dB/year, more than 4 times greater than the 0.10 dB/year slope of the overall level. Results in and out of the Wheel Path In the 2008, OBSI measurements were made with the test tire positioned in wheel path (normal placement) and out of the wheel path in the lane center. Similar to the aging trends seen for all the surfaces, the OBSI levels in the wheel path are consistently higher than the lane center for those one-
30

third octave bands of 1600 Hz as typified by the results for S5 as shown in Figure 42. This suggests that the increased wear or polishing is responsible for increased noise level in these frequencies. This polishing effect can be seen in reviewing the photographs of Figure 32 through 37. Results very similar to those of Figure 42 were observed before and after the Skidabrader process was used to improve the frictional performance of worn pavements7. In this process, steel balls on the order of 1 mm are shot at the pavement generating increased small scale texture. A tryout of this process was documented on a longitudinal tine PCC pavement at another location in California yielding the change in noise performance shown in Figure 43. The reduction in higher frequency noise levels was also accompanied with almost a 50% improvement in the measured friction performance of this pavement. Although all six pavement surfaces demonstrated the same higher frequency performance in and out of the wheel path, some differences were found in the lower the frequencies. For the longitudinal tine and ground surfaces, little or no difference was indicated for one-third octave bands below 1600 Hz. For grooved burlap drag surfaces, S3 and S4, consistent differences of 1 to 2 dB are indicated were below 1600 Hz with higher levels measured in the wheel path. In the center of lane, the pop-outs were not as prevalent and likely contributing to the lower OBSI levels below 1600 Hz compared to the in wheel path levels. For the burlap drag surface, the uniformly higher levels below 1600 Hz of about 1 dB did not appear to be due to the same type of deterioration experienced by the grooved surfaces. In Figure 33, some scoring of the pavement is apparent, however these are relatively narrow, shallow, and in the direction of travel. Higher Frequency Noise Mechanisms To account for higher rate of noise increase versus age in the frequency range above 1250 Hz, two noise mechanisms are typically considered, “scrubbing” and tread pattern air-pumping. Air-pumping occurs at the leading edge of the tire contact patch as air is forced out of the tread voids and can continue throughout contact as organ pipe-like oscillations of air are created. At the trailing edge of the contact patch, the inverse of pumping can occur as the tread void area expands prior to complete release from the pavement11. This source is reduced as the open area of the pavement increases typically due to higher roughness or if the pavement is porous. Scrubbing also occurs at the leading and trailing edges of the contract patch. At entrance, just prior to the rubber tread elements locking into the pavement, the element is forced to scrub along the pavement both in the longitudinal and lateral direction due to shear stresses developed as the tire deforms coming into contact. The scrubbing of the tire tread element along the pavement produces higher frequency vibrations that are then radiated from the tread as sound. The reverse process occurs at the exit of the contact patch. This mechanism is particularly evident for tires under acceleration in which additional shear stress is present producing higher noise levels14. This mechanism is reduced with increased pavement friction as the tread elements lock into the surface more quickly and the duration of scrubbing is reduced. Reduction in the noise associated with this mechanism is thought to the primary factor in the reduction in the 1600 to 5000 Hz bands seen in Figure 43 before and after the Skidabrader process. For the Mojave sections, it appears that air-pumping was not a significant factor in the changes observed in the higher frequencies with aging. Comparing the photographs of the pavement surfaces Figures 32 through 37, none reveal a significant decrease in surface openness. As noted previously, ground surface S1 did possess some initial fins that appear to generate increased roughness that lessened with time. However, this behavior was not evidenced on any of the other surfaces and clearly not for the burlap
31

drag surface. Further, it might be speculated that the grooves cut into the burlap drag surface would help to relieve air build up in the tread and produce lower levels, however, it was found that the groove had either no effect on the measured levels, or produced a small increase in level. The ground surfaces tended to produce lower levels in the higher frequencies than the other surfaces, however, ground surfaces are also typically found to have higher values of friction (Rasmussen, R., unpublished data). The case for scrubbing being the primary mechanism for the increasing higher frequency levels with pavement wear can not be dismissed from the available data. All of the pavements show evidence of polishing with traffic wear that should result in some reduced friction. Mechanically induced polishing of ground PCC surfaces has been found to produce increases in noise level in this same higher frequency region in laboratory based research of the effect of texture on ground surfaces13. Further, the Skidabrader study also points to increased friction and reduced polishing of the surface leading to reduced noise levels, or conversely, increased polishing resulting in increased noise. For the Mojave sections, both over time and in and out of the wheel path, the surfaces show increased polishing and increased higher frequency noise levels. Assuming that the polishing observed also results in reduced friction performance, the scrubbing mechanism remains as a viable explanation of the increases of the higher frequency noise with pavement wear.
32

CHAPTER 6 CONCLUSIONS Initial Baseline Surfaces (March 2003) The evaluation of the longitudinal tine, burlap drag, and broom PCC pavement textures was somewhat clouded by the contribution of slap noise generated by the joints in the pavement. Based on the 5 m-sec average sound intensity data, the longitudinal tine surface produced levels about 2 dB higher than either the burlap drag or broom surface. For the quieter two surfaces, contributions from the joints alone are nearly equal to that of the pavement texture alone. Without the contribution of the joints, the difference between the longitudinal tine surface and the other two was 3 dB. Although the burlap drag may have a slight noise advantage over the broom surface, the two are very nearly equivalent. Relative to other longitudinal tined surfaces, the surface on the Mojave Bypass fell into the upper range of those in California and Arizona. Similar trends between the surfaces were seen for the controlled vehicle pass-bys, however, the effect of joints could not isolated. Surface Modifications (June 2003) The application of grooves of varying parameters produced little, if any change, in the noise level over the two base surfaces considered in the evaluation. Differences in groove parameters of depth and spacing produced little significant difference in the noise level. Grooving did not reduce the impulsive noise generated by discontinuities at the pavement joints. Texture grinding of the existing pavement surfaces produced distinct changes in the noise performance. Grinding was found to be effective in reducing or eliminating the impulses generated at pavement joint discontinuities. This affected both the slap noise radiated externally by the tire and the interior noise due to the structure-borne path from the tire, through the suspension, to the body panels. The random roughness created by the texture grinding also decreased noise in higher frequencies (1600 to 2000 Hertz) due to tire tread design. At mid frequencies between 400 and 1000 hertz, it is found that the roughness generated by grinding could increase noise levels depending on the spacing of the grinding heads. As a result, there is a potential for optimizing the texture grind parameters to maintain the beneficial effects of reducing joint impulses and high frequency tread related noise while minimizing the effect that increased surface roughness has on the mid frequency noise. Of the eleven surfaces tested on the Mojave Bypass, the best noise performance was achieved with the 0.105 inch spacing texture grind surface. Applied to the existing pavement surfaces on the Bypass, the 0.105 surface was well optimized to balance the high and mid frequencies while achieving a sizable reduction in the joint impulses. However, it should not be assumed that the parameters of this texture grind would result in similar, optimized performance on other surfaces. Acoustic Longevity (2003-2010) Relative to asphalt concrete pavements, the PCC textured pavements studied in this research indicated lower rates of overall noise level increase over time. The overall A-weighted levels are determined primarily by frequencies bands from 800 to 1250 Hz and these bands display only minimal effect of
33

aging to date. In the higher frequencies above 1600 Hz, the increase in noise with time is significant averaging 0.42 dB/year compared to 0.10 dB/year for the overall levels. This effect appears to be due polishing on the surfaces, corresponding reduction of surface friction, and an increase in noise generated by the scrubbing mechanism. The results found for these surfaces should not be generalized to others as design and build parameters may produce different outcomes. The Mojave pavements were dowelled at the slab joints, likely reducing the effects of slab faulting on acoustic longevity. Also joint slap is a factor in these pavements and would not be in continuously re-enforced concrete. Further, the surfaces produced generally lower levels than many other PCC textures that may display different rates or directions of change such as transverse tine surfaces. However, it is suspected that some of trends and behaviors found for these surfaces would apply to others of similar texturing.
34

35
REFERENCES
1 P. Donavan. and L. Scofield, “An Evaluation of the Effects of Different Portland Cement Concrete Pavement Texturing on Tire/Pavement Noise”, Proceedings of NoiseCon 2003, Cleveland, Ohio, June 2003. 2 P. Donavan, and B. Rymer, “Quantification of Tire/Pavement Noise: Application of the Sound Intensity Method”, Proceedings of Inter-Noise 2004, Prague, the Czech Republic, August 2004. 3 P. Donavan and D. Lodico, “Measuring Tire-Pavement Noise at the Source”, NCHRP Report 630, Transportation Research Board, Washington, D.C., 2009. 4 “Standard Practice for Measurement of Tire/Pavement Noise Using the On-Board Sound Intensity (OBSI) Method”. American Association of State Highway and Transportation Officials, 444 North Capitol Street N.W., Suite 249, May 2008. 5 P. Donavan, and B. Rymer, “Assessment of Highway Pavements for Tire/Road Noise Generation”, Society of Automotive Engineers Noise and Vibration Conference Proceedings, Traverse City, MI, May 2003. 6 P. Donavan, D. Lodico, and B. Rymer, “Considerations in the standardization of on-board sound intensity (OBSI) for highway pavement evaluation”, Proceedings of NoiseCon 2007, Reno, NV, October 2007. 7 B. Rymer, P. Donavan, and E. Kohler, “Tire/Pavement Noise Levels Related To Roadway Friction Improvement”, Compendium of Papers, TRB 89th Annual Meeting, Washington, D.C., January 2010. 8 P. Donavan, “The Acoustic Radiation from Pavement Joint Grooves between Concrete Slabs”, Transportation Research Record, Journal of the Transportation Research Board, No. 2158, Environment 2010, pp 129-137. 9 P. Donavan and D. Lodico, “Tire/Pavement Noise of Test Track Surfaces Designed to Replicate California Highways”, Proceedings of Inter-Noise 2009, Ottawa, Ontario, Canada, August 2009. 10 U. Sandberg, and J. Ejsmont. The Tyre/Road Noise Reference Book. INFORMEX, Ejsmont &
Sandberg Handelsbolag, Harg, SE-59040 Kisa, Sweden, 2002, pp. 266-271, 128-139, 272-273, 122. 11 P. Donavan, “Examination of Tire/Road Noise at Frequencies above 630 Hertz”, The Proceeding of InterNoise 2002, Dearborn, MI, USA, August 2002 12 H. Bendtsen, E. Kohler, Q. Lu, and B. Rymer. Californian and Danish Study on Acoustic Aging of Road Pavements. In Transportation Research Record: Journal of the Transportation Research Board, No. 2158, Transportation Research Board of the National Academies, Washington, D.C., 2010, pp. 122-128.

36
13 Dare, T., W. Thornton, T. Wulf, and R. Bernhard. Acoustical Effect of Grinding and Grooving Portland Cement Concrete Pavements. Report No. SQDH 2009-1, Purdue University Institute for Safe, Quiet, and Durable Highways, West Lafayette, IN, April 2009. 14 P. Donavan, “Tire-Pavement Interaction Noise Measurement under Vehicle Operating Conditions of Cruise and Acceleration”, Society of Automotive Engineers Noise and Vibration Conference Proceedings, SAE Paper 931276, Traverse City, MI, May 1993.

APPENDIX A
CONTROLLED PASS-BY MEASUREMENTS
A-1

CONTROLLED PASS-BY MEASUREMENTS In order to extend the data base comparing sound intensity to wayside measurements, controlled vehicle pass-by tests were performed using the Subaru test vehicle during the March 2003 tests. The pass-bys were conducted at an operating speed of 60 mph on each of the three baseline pavement surfaces, longitudinal tine, burlap drag, and broom. Microphone positions at two distances, 25 and 50 feet from the centerline of the path of the vehicle, were used. At the time of this testing, this was the fifth set of data comparing sound intensity to pass-by. Previous data were taken at the Caltrans Test Track at the California Highway Patrol Academy, the LA 138 test sections before and after the test surfaces were installed1, and the PCC tining test sections of SR 202 in the Phoenix area2. All of these previous tests have demonstrated a very good correlation between the two types of measurements with a 23.8 dB offset between intensity and passby at 25 feet, and 30.5 dB at 50 feet. The pass-by measurements were performed at the same positions along the 3 test surfaces as those used in controlled pass-by testing conducted by personnel from the US DOT Volpe Center for their 50 feet data3. The microphone height at the 25 feet position was set at 5 feet, the 50 feet microphone positions were elevated to maintain a height approximately 5 feet above the surface of the pavement as shown in Figure A-1. As the ground sloped downward from the roadway shoulder, some difference in height above the ground for the 25 and 50 feet microphone positions was required. The pass-bys were conducted in both the east- and westbound directions with test vehicle always operating in the outer of the eastbound lanes. The vehicle was operated in a steady cruise mode which in previous testing has been found to be less than 0.5 dB louder than coast. Maximum sound pressure levels were captured with a Larson Davis 2900 2-channel analyzer using fast exponential response. Larson Davis Type 2560 ½ inch microphones and Type PRM900C preamplifiers were used for both channels. The microphone signals were also recorded on a Sony TCD-D100 DAT recorder. For each test site, four or more individual pass-bys were averaged together to obtain the average pass-by level for each direction on each surface. The one-third octave band spectra obtained from this data analysis is presented in Figures A-2 and A-3 for both 25 and 50 ft microphone distances, respectively, and for the 3 baseline surfaces. As was seen with the sound intensity results, only minor differences were obtained between the two directions of travel. Also, the longitudinal tined surface was consistently higher in level than the burlap drag and broom textures. Little difference is apparent between these latter two textures. In comparing the two microphone locations, the differences between the longitudinal tine and the two textured surfaces is similar, however, the difference appears to be slightly greater at 50 ft than at 25 ft. Relative to the sound intensity data, the pass-by data display similar differences between the pavements as shown in Figure A-4. On an overall A-weighted basis, the sound intensity, I&R and Volpe pass-by levels all display consistency in rank ordering the 3 surfaces as shown in Figure A-5 with the longitudinal tined surface being about 2 to 3 dB higher in level that the two textured surfaces. In Figure A-6, overall A-weighted
A-2

controlled pass-by levels are plotted versus OBSI levels for the Mojave Bypass as well as other locations in California and Arizona. The indicated constant offset lines correspond to average differences of 23.6 and 30.4 for the 25 and 50 ft data, respectively. The standard deviation about these average differences is 0.8 dB for both microphone distances.
Figure A-1: Typical Setup and site geometry for controlled vehicle pass-by tests
30
35
40
45
50
55
60
65
70
75
80
85
50 63 80 100
125
160
200
250
315
400
500
630
800 1
1.25 1.
6 22.
53.
15 4 56.
3 8 10
1/3 Octave Band Center Frequency, Hz
Pas
s-B
y S
ou
nd
Pre
ssu
re L
evel
, dB
A
EB Long. WB Long.
EB Burlap WB Burlap
EB Broom WB Broom
Figure A-2: Controlled pass-by levels for test vehicle in both directions of travel over the same lane as measured at 25 ft
25 ft Microphone 50 ft Microphone
A-3

25
30
35
40
45
50
55
60
65
70
75
80
50 63 80 100
125
160
200
250
315
400
500
630
800 1
1.25 1.
6 22.
53.
15 4 56.
3 8 10
1/3 Octave Band Center Frequency, Hz
Pa
ss-B
y S
ou
nd
Pre
ssu
re L
evel
, dB
AEB Long. WB Long.
EB Burlap WB Burlap
EB Broom WB Broom
Figure A-3: Controlled pass-by 1/3 octave band sound pressure levels for test vehicle in both directions of travel over the same lane as measured at 50 ft
30
40
50
60
70
80
90
100
50 63 80 100
125
160
200
250
315
400
500
630
800 1
1.25 1.
6 22.
53.
15 4 56.
3 8 10
1/3 Octave Band Center Frequency, Hz
So
un
d L
evel
, dB
A
Longitudinal TineBurlap DragBroomed
Sound Intensity
Passby
25 ft
50 ft
Figure A-4: On-board sound intensity and controlled pass-by sound pressure 1/3 octave band levels as measured at 25 and 50 ft
A-4

60
65
70
75
80
85
90
95
100
105
WB OBSI WB Pass-by25 ft
WB Pass-by50 ft
EB OBSI EB Pass-by25 ft
EB Pass-by50 ft
EB Pass-by50 ft (Volpe)
So
un
d L
eve
l, d
BA
Longitudinal Tine
Burlap Drag
Broom
Figure A-5: Overall A-weighted on-board sound intensity and controlled pass-by sound pressure levels as measured at 25 and 50 ft in both directions of travel
61
63
65
67
69
71
73
75
77
79
81
83
85
87
92 94 96 98 100 102 104 106 108 110
Overall A-Weighted Sound Intensity Level, dB
Ov
eral
l Pas
s-b
y S
ou
nd
Pre
ssu
re L
evel
, dB
A
25 ft Microphone Distance
50 ft Microphone Distance
SR 58 Data Points
Figure A-6: Overall A-weighted controlled pass-by sound pressure levels versus on-board sound intensity levels as measured at 25 and 50 ft for Mojave Bypass and other locations
A-5

A-6
REFERENCES
1 Donavan, P., “Eight Year Evaluation of the Noise Performance of the Caltrans Asphalt Research Pavements on LA 138”, prepared by Illingworth & Rodkin, Inc., prepared for California Department of Transportation, Sacramento, CA, May, 2011. 2 P. Donavan. and L. Scofield, “An Evaluation of the Effects of Different Portland Cement Concrete Pavement Texturing on Tire/Pavement Noise”, Proceedings of Noise-Con 2003, Cleveland, Ohio, June 2003. 3 J. L. Rochat, “Acoustical Characterization of Three PCC Surface Treatments Using Wayside Tire/Road Noise Measurements”, U.S. Department of Transportation Memorandum, Research and Special Programs Administration, March 28, 2003.

APPENDIX B
INTERIOR NOISE MEASUREMENTS
B-1

INTERIOR NOISE MEASUREMENTS Interior noise levels were measured in the right rear passenger seat of the Subaru test vehicle. The output of Larson Davis Type 2560 ½ inch microphone and Type PRM900C preamplifier was captured with the Larson Davis 2900 analyzer and processed into 1/3 octave band spectra and overall A-weighted sound pressure levels. The microphone was suspended 24 inches above the seat cushion, centered on what would be a typical occupant’s head position. As with the other measurements, these data were obtained at a speed of 60 mph on the three different PCC textured surfaces. Unlike pass-by noise, interior noise is comprised of two components: airborne and structure borne. The airborne component is the equivalent to that measured by sound intensity and pass-by data. This component is transmitted into the vehicle interior by an airborne path in which the exterior tire/pavement noise is transmitted acoustically through body panels, door components, glass, etc. The structure borne component arises from vibrations which are generated at the tire/road interface and transmitted mechanically through the tire/wheel assembly, suspension, and body structure. This transmitted vibrational energy then excites body panels such as the floor pan, glass surfaces and roof, which in turn radiate acoustical energy into the vehicle. These two contributions are typically separated in frequency with the structure borne component dominating in lower frequencies (below ~400 Hz) and the air borne component dominating at higher frequencies (above ~500 Hz). Since the tire is not an efficient radiator of sound at lower frequency compared to structurally excited body panels, the overall interior A-weighted sound pressure level is typically governed more by the structure borne than the air borne. As a result, there may or may not be a clear correlation between the exterior and interior noise. However, the perception of the “noise” of a pavement by vehicle occupants can be influenced by what they hear on the inside of a vehicle, this dimension of tire/pavement is significant to characterize. The interior noise levels measured on the original three baseline surfaces as measured in March 2003 are presented in Figure B-1. As seen with both sound intensity and pass-by data (Appendix A), the longitudinal tined surface produced higher noise levels than either burlap drag or broom textures. In the airborne region, above 500 Hz, the sound intensity (Figure 6) and interior data both indicate that the longitudinal tined surface generates 2 to 3 dB higher levels from 500 to 1250 Hz. Down to about 315 Hz, the interior and the pass-by data (Figure A-4) show similar differences between surfaces. Below this frequency, only the interior data continues to shown higher levels for the longitudinal tined surface to about 125 Hz. Corresponding to the pavements of Figure 8, the overall A-weighted interior levels for the Mojave Bypass surfaces are plotted versus OBSI levels in Figure B-2. In this figure, the line representing the average offset between the data is shown corresponding to a offset of 31.6 dB with a standard deviation of 1.2 dB about this line. Although there are excursions of a little more than 2 dB from this fit of the data, the interior levels generally track OBSI levels fairly well. In June 2003, interior noise measurements were made on each of the eight modified test surfaces using the same test methods. Because of the shorter test sections, the sound
B-2

pressure signals were averaged over a 4 second time interval instead of a 5 second interval as used in March 2002. As with the time averaged intensity data, multiple joint slaps occurred within each time sample on those surfaces for which they were audible. Consistent with the intensity recordings, the slaps were not audible on any of the texture grind surfaces. The 1/3 octave band spectra results for the interior noise on the 8 test surfaces are shown in Figure B-3. Unlike the sound intensity results of Figure 19, these data display little difference between the pavement surfaces above 800 hertz. In the range from 400 to 800 hertz, some of the trends of the intensity data are apparent, although not as pronounced. In these frequencies, the texture grind surfaces tend to produce slightly more interior noise than the grooved surfaces, presumably due to the apparent increased surface roughness of the ground surfaces. At even lower frequencies, between 50 and 160 hertz, the texture grind surfaces consistently produce lower noise levels. This trend is better isolated in Figure B-4 which compares the grooved only surfaces to the texture grind and grooved surface. These data clearly demonstrate that the addition of texture grinding increase the mid frequencies (400 to 1000 hertz) and decreased the lower frequencies (below 160 hertz). These data also show the high frequency difference at 1600 and 2000 hertz as noted previously in the sound intensity data. The low frequency differences can also be examined by comparing the interior noise spectra between the base pavement surfaces, a grooved and a ground surface. As shown in Figure B-5, the longitudinally tined, burlap drag, and broom surfaces all produce similar levels in the frequency range from 50 to 160 hertz to that of the grooved surface. All of surfaces produce audible slaps from the joints. Typical of all of the ground surfaces, the data for texture grind Test Section #2 is about 3 dB lower in this range and no audible (or measurable) joint slap occurs. Unlike the results for frequencies above about 500 hertz, the low frequency levels are dictated by structure-borne energy which transmits from the tire/road interface through the suspension into the body panels of the vehicle. These panel vibrations then radiate into the interior of the vehicle. The higher frequencies are due to airborne paths and sound radiated directly by the tire. Using the interior results and those of the sound intensity measurements, a more complete understanding of the effect of texture grinding is gained. As discussed previously, in the high frequencies, around 1600 and 2000 hertz, the texture grinding “breaks-up” some of the tread related tire noise to produce lower noise levels both to the exterior and to a less degree, the interior. In the mid frequencies 400 to 1000 hertz, the roughness of the texture grind surfaces tends in increase noise, particularly again, on the exterior. In the lower frequencies, 50 to 160 hertz, the texture grinding reduces the discontinuities at the joints, lowering the vibration input to the vehicle, and thereby reducing the interior (structure-borne) noise.
B-3

25
30
35
40
45
50
55
60
65
70
2531
.5 40 50 63 80 100
125
160
200
250
315
400
500
630
800
1000
1250
1600
2000
2500
3150
4000
5000
6300
1/3 Octave Band Center Frequency, Hz
A-W
eig
hte
d S
ou
nd
Pre
ssu
re L
evel
, dB
SR 58 Longitudinal
SR 58 Burlap drag
SR 58 Broom
Sturcture Borne Region Air Borne Region
Figure B-1: Interior noise measurements on Mojave Bypass baseline test surfaces
64
66
68
70
72
74
76
78
80
96 98 100 102 104 106 108 110
Overall OBSI Level, dBA
Ove
rall
Inte
rio
r N
ois
e L
eve
l, d
BA
Figure B-2: Interior noise vs. OBSI comparison of Mojave Bypass Sections to other PCC pavements & the LA 138 OGAC test surface (Offset = 31.6 dB, σ = 1.2 dB)
B-4

10
20
30
40
50
60
70
2531
.5 40 50 63 80 100
125
160
200
250
315
400
500
630
800
1000
1250
1600
2000
2500
3150
4000
5000
6300
8000
1000
0
1/3 Octave Band Center Frequency, Hz
Inte
rio
r S
ou
nd
Lev
el,
dB
A
Sect #1 (Texture Grind) Sect #2 (Texture Grind)Sect #3 (Groove) Sect #4 (Groove) Sect #5 (Texture Grind) Sect #6 (Grind + Groove)Sect #7 (Groove) Sect #8 (Texture Grind)
Figure B-3: Interior noise comparison of 1/3 octave band interior noise spectra for different the modified Mojave Bypass tests surfaces
10
20
30
40
50
60
70
2531
.5 40 50 63 80 100
125
160
200
250
315
400
500
630
800
1000
1250
1600
2000
2500
3150
4000
5000
6300
8000
1000
0
1/3 Octave Band Center Frequency, Hz
Inte
rio
r S
ou
nd
Lev
el, d
BA
Sect #3 (Groove) Sect #4 (Groove)
Sect #6 (Grind + Groove) Sect #7 (Groove)
Figure B-4: Comparison of 1/3 octave band interior noise spectra for different grooved test surfaces
B-5

10
20
30
40
50
60
70
2531
.5 40 50 63 80 100
125
160
200
250
315
400
500
630
800
1000
1250
1600
2000
2500
3150
4000
5000
6300
8000
1000
0
1/3 Octave Band Center Frequency, Hz
Inte
rio
r S
ou
nd
Lev
el, d
BA
Longitudinal Avg Burlap AvgBroom Avg Sect #3 (Groove)Sect #5 (Texture)
Figure B-5: Comparison of 1/3 octave band interior noise spectra for various original and modified Mojave Bypass surfaces
B-6