Inhibitory Control and Reward Processes in Children and · PDF fileKatia Joanne Sinopoli...
176
Inhibitory Control and Reward Processes in Children and Adolescents with Traumatic Brain Injury and Secondary Attention-Deficit/Hyperactivity Disorder by Katia Joanne Sinopoli A thesis submitted in conformity with the requirements for the degree of Doctor of Philosophy Department of Psychology University of Toronto © Copyright by Katia Joanne Sinopoli (2010)
-
Upload
hoangthien -
Category
Documents
-
view
214 -
download
2
Transcript of Inhibitory Control and Reward Processes in Children and · PDF fileKatia Joanne Sinopoli...

Inhibitory Control and Reward Processes in Children and Adolescents with Traumatic Brain Injury and Secondary
Attention-Deficit/Hyperactivity Disorder
by
Katia Joanne Sinopoli
A thesis submitted in conformity with the requirements for the degree of Doctor of Philosophy
Department of Psychology
University of Toronto
© Copyright by Katia Joanne Sinopoli (2010)

ii
Inhibitory Control and Reward Processes in Children and Adolescents with Traumatic Brain Injury and Secondary Attention-
Deficit/Hyperactivity Disorder
Katia Joanne Sinopoli
Doctor of Philosophy
Department of Psychology
University of Toronto
2010
Abstract
Children with traumatic brain injury (TBI) often experience difficulties with inhibitory control
(IC), manifest in both neurocognitive function (poor performance on the stop signal task, SST)
and behavior (emergence of de novo attention-deficit/hyperactivity disorder, or secondary
ADHD, S-ADHD). IC allows for the regulation of thought and action, and interacts with reward
to modify behaviour adaptively as environments change. Children with developmental or
primary ADHD (P-ADHD) exhibit poor IC and abnormalities when responding to rewards, yet
the extent to which S-ADHD is similar to and different from P-ADHD in terms of these
behaviours is not well-characterized. The cancellation and restraint versions of the SST were
used to examine the effects of rewards on 2 distinct forms of IC in children and adolescents
divided into 4 groups (control, TBI, S-ADHD, and P-ADHD). The SST requires participants to
respond to a ―go signal‖ and inhibit their responses when encountering a ―stop signal‖. Rewards
improved performance similarly across groups, ages, and cancellation and restraint IC tasks.
Adolescents exhibited better IC and faster and less variable response execution relative to
children. Significant IC deficits were found in both tasks in the P-ADHD group, with participants
with S-ADHD exhibiting intermediate cancellation performance relative to the other groups.

iii
Participants with TBI without S-ADHD were not impaired on either task. The relationship
between neurocognitive and behavioral IC was examined by comparing multi-informant ratings
of IC across groups, and examining the relationship between ratings and IC performance on the
SST. Participants in the control and TBI groups were rated within the typical range, and
exhibited fewer problems than either of the ADHD groups, who differed from each other (the P-
ADHD group was rated as more inattentive than the S-ADHD group). Moderate to high
concordance was found between parent and teacher reports, each of which was poorly
concordant with self-reports. The P-ADHD and S-ADHD groups were unaware of their own
deficits. Poorer IC predicted parent and teacher classification of participants into ADHD
subtypes, although IC did not predict rating concordance. Despite similar clinical presentations,
S-ADHD and P-ADHD differ in the phenotypic expression of behaviour and manifestation of IC
across contexts.

iv
Acknowledgments
I would like to thank Dr. Maureen Dennis for her extraordinary mentorship throughout my PhD.
She has taught me valuable skills that will undoubtedly further my career, including how to think
critically, how to ask the important questions, and how to write to deadlines. Importantly, Dr.
Dennis has shown me that having a passion for science is what drives a successful research
career rather than a desire for fame or glory. She took a chance on a ―rat girl‖, and helped me
realize my potential by allowing me to discover what drives me to learn, succeed, and advance
within the discipline of psychology. I will be forever grateful to Dr. Dennis for what I have
learned over the last five years, and I hope to continue learning from her and benefitting from her
expertise as I enter the next phase of my education.
I would also like to thank my dissertation committee members; Drs. Russell Schachar, Mary Lou
Smith, and Jay Pratt. Dr. Schachar graciously shared his stop signal tasks with me, and his
helpful comments and interpretations have been invaluable throughout this entire process. Dr.
Smith’s concerns and suggestions throughout my PhD were essential in the streamlining of my
experiments and in the interpretation of the results, and I am grateful for her clinical supervision
and expertise throughout my first clinical practicum.
A special thanks to Dr. Talar Hopyan for her support, guidance, and friendship. She has lent an
empathetic ear during more than one challenging period of my PhD, and has been quick to
acknowledge my accomplishments and celebrate my successes.
I would also like to thank my friends and family for their unwavering support and love. While it
is not always easy dealing with a frustrated student, they have endured my ups and downs, and
have always been present when I needed them. My parents and sister have always given me their
unconditional love and support, and this has made me strive to be the best I can be. My
girlfriends, my sisters, their love, friendship, support, humor, and ―real talk‖ has been
instrumental throughout the dissertation, and I look forward to celebrating future achievements
with them. I’d like to thank my grandparents for their patience and for always letting me know
that they are there for me, regardless of our disagreements and different outlooks on life. Last but
certainly not least, I’d like to thank my fiancé Jeremy. Words cannot express how grateful I am
to have him in my life. He has calmed my fears, eased my self-doubts, and has been the greatest

v
cheerleader anyone could have. Not once has he ever doubted my abilities, and through him I
found the strength to get through the most challenging and difficult times of this degree. He
showed me how never to give up, how to look at the glass half full, and how to keep my head up
even when I wanted to bury it in the sand. I couldn’t have asked for a better partner in life.
I am also indebted for the technical assistance I have received from research assistants both in
Dr. Dennis’ and Dr. Schachar’s labs, including Alexandra Basile, Renee Ferrell, Arianna
Stefanatos, Tara Goodale, and Shirley Chen.
Lastly, I would like to acknowledge the various granting agencies that have provided me with
funding throughout my PhD: the Hospital for Sick Children (Restracomp Award), the
Government of Ontario (Ontario Graduate Scholarship), and the Ontario Neurotrauma
Foundation (ONF PhD Award).

vi
Table of Contents
Acknowledgments .......................................................................................................................... iv
Table of Contents ........................................................................................................................... vi
List of Figures ................................................................................................................................ xi
List of Appendices ....................................................................................................................... xiii
Chapter 1 Introduction .................................................................................................................... 1
Chapter 2 Reward Improves Cancellation and Restraint Inhibition Across Childhood and
Adolescence ............................................................................................................................. 11
1 Method ..................................................................................................................................... 15
1.1 Participants ........................................................................................................................ 15
1.2 Stop Signal Tasks .............................................................................................................. 16
1.3 Statistical Analyses ........................................................................................................... 18
2 Results ...................................................................................................................................... 20
2.1 Participant Characteristics ................................................................................................ 20
2.2 Cancellation ...................................................................................................................... 20
2.2.1 Reward Effects ...................................................................................................... 20
2.2.2 Age Effects ............................................................................................................ 21
2.2.3 Order Effects ......................................................................................................... 21
2.3 Restraint ............................................................................................................................ 21
2.3.1 Reward Effects ...................................................................................................... 21
2.3.2 Age Effects ............................................................................................................ 22
2.3.3 Order Effects ......................................................................................................... 22
2.4 Task Comparisons ............................................................................................................. 23
3 Discussion ................................................................................................................................ 23
3.1 Reward Effects .................................................................................................................. 24

vii
3.2 Age Effects ........................................................................................................................ 26
3.3 Task Effects ...................................................................................................................... 29
3.4 Conclusions ....................................................................................................................... 30
Chapter 3 Traumatic Brain Injury and Secondary Attention-Deficit/Hyperactivity Disorder in
Children and Adolescents: The Effect of Reinforcement on Inhibitory Control ..................... 43
4 Method ..................................................................................................................................... 49
4.1 Participants ........................................................................................................................ 49
4.2 Rating Scales: Inclusion and exclusion criteria ................................................................ 51
4.3 Stop Signal Tasks .............................................................................................................. 52
4.4 Statistical Analyses ........................................................................................................... 55
5 Results ...................................................................................................................................... 56
5.1 Participant Characteristics ................................................................................................ 56
5.2 Cancellation ...................................................................................................................... 56
5.2.1 Group and Reward Effects .................................................................................... 57
5.2.2 Order Effects ......................................................................................................... 57
5.3 Restraint ............................................................................................................................ 58
5.3.1 Group and Reward Effects .................................................................................... 58
5.3.2 Order Effects ......................................................................................................... 58
5.4 Injury Variables ................................................................................................................ 59
5.4.1 Cancellation .......................................................................................................... 59
5.4.2 Restraint ................................................................................................................ 59
6 Discussion ................................................................................................................................ 60
6.1 Group Effects .................................................................................................................... 60
6.2 Reward effects .................................................................................................................. 63
6.3 Conclusions ....................................................................................................................... 65

viii
Chapter 4 The Relationship between Multi-Informant Behavioural Ratings and Inhibitory
Control Performance on Cancellation and Restraint Tasks in Children with Traumatic
Brain Injury .............................................................................................................................. 78
7 Method ..................................................................................................................................... 80
7.1 Participants ........................................................................................................................ 80
7.2 Questionnaires: Conners 3rd
Edition ................................................................................. 82
7.3 Neurocognitive testing: Stop Signal Tasks ....................................................................... 84
7.4 Statistical Analyses ........................................................................................................... 85
8 Results ...................................................................................................................................... 86
8.1 Participant Characteristics ................................................................................................ 86
8.2 Validity of Ratings ............................................................................................................ 87
8.3 Group Differences across Raters ...................................................................................... 87
8.4 Conners-P: Group Differences .......................................................................................... 87
8.5 Conners-T: Group Differences ......................................................................................... 88
8.6 Conners-SR: Group Differences ....................................................................................... 88
8.7 Concordance between the Conners-P and Conners-T ...................................................... 89
8.8 Concordance between Conners-P and Conners-SR .......................................................... 90
8.9 Concordance between Conners-T and Conners-SR .......................................................... 91
8.10 IC Performance: Cancellation and Restraint ..................................................................... 92
8.10.1 Cancellation .......................................................................................................... 92
8.10.2 Restraint ................................................................................................................ 92
8.11 Relationship between SST Performance and Conners 3 Ratings ................................... 92
8.12 Relationship between the number of ADHD Symptoms and IC Performance ................. 93
8.12.1 Cancellation .......................................................................................................... 93
8.12.2 Restraint ................................................................................................................ 93
8.13 Is IC performance related to ADHD status? ..................................................................... 93
8.13.1 Cancellation .......................................................................................................... 94

ix
8.13.2 Restraint ................................................................................................................ 94
8.14 Agreement between Parent and Teacher Ratings and SST Performance ......................... 94
9 Discussion ................................................................................................................................ 95
9.1 Parent and teacher IC profiles ........................................................................................... 95
9.2 Rating concordance ........................................................................................................... 97
9.3 Self-report IC profile ......................................................................................................... 98
9.4 Relationship between Multi-Informant Ratings and Inhibitory Control Performance ... 100
9.5 Key differences between P-ADHD and S-ADHD .......................................................... 103
Chapter 5 General Discussion ..................................................................................................... 117
10 Summary of Studies ............................................................................................................... 117
11 Reward and Inhibitory Control in Normal Children .............................................................. 119
12 Reward and Inhibitory Control in TBI and ADHD ............................................................... 121
13 Differences between S-ADHD and TBI without S-ADHD ................................................... 122
14 Relationship between Ratings of IC and Neurocognitive measures of IC ............................. 123
15 Future Directions .................................................................................................................... 124
16 S-ADHD: A Separate Disorder from P-ADHD? ................................................................... 131
References ................................................................................................................................... 133
Appendices .................................................................................................................................. 160

x
List of Tables
Table 1. Participant Characteristics (Chapter 2)
Table 2. Accuracy on Go Trials: Mean Percent Correct (standard deviation)
Table 3. Participant Characteristics (Chapter 3)
Table 4. Accuracy and Variability of Go Responses (Means and standard deviations)
Table 5. Regression Table: Significant Predictor: Age at Injury (all p’s <0.05)
Table 6. Participant Characteristics (Chapter 4)
Table 7. Summary of Group Differences across the Conners-P, Conners-T, and Conners-SR
Table 8. Parent-Teacher Discrepancy Ratings (Means and standard deviations)
Table 9. Parent-Self-Reports Discrepancy Ratings (Means and standard deviations)
Table 10. Teacher-Self-Reports Discrepancy Ratings (Means and standard deviations)
Table 11. Summary of Discrepancy Ratings
Table 12. Correlation Coefficients (r) between SST Performance and Ratings
Table 13. Regression Results

xi
List of Figures
Figure 1. Cancellation and Restraint Models of the Stop Signal Task (with and without rewards)
Figure 2. Mean (standard error, SE) SSRT in the Cancellation Version of the SST
Figure 3. Mean (SE) Percent Inhibition in the Cancellation Version of the SST
Figure 4. Mean (SE) MRT in the Cancellation Version of the SST
Figure 5. Mean (SE) SDRT in the Cancellation Version of the SST
Figure 6. Mean (SE) Percent Inhibition in the Restraint Version of the SST
Figure 7. Mean (SE) SSRT in the Restraint Version of the SST
Figure 8. Mean (SE) MRT in the Restraint Version of the SST
Figure 9. Mean (SE) SDRT in the Restraint Version of the SST
Figure 10. Mean (SE) Percent Inhibition across Groups and Reward Conditions, Cancellation
Figure 11. Mean (SE) SSRT across Groups and Reward Conditions, Cancellation
Figure 12. Mean (SE) MRT across Groups and Reward Conditions, Cancellation
Figure 13. Mean (SE) Percent Inhibition across Groups and Reward Conditions, Restraint
Figure 14. Mean (SE) SSRT across Groups and Reward Conditions, Restraint
Figure 15. Mean (SE) MRT across Groups and Reward Conditions, Restraint
Figure 16. Cancellation and Restraint Models of the SST

xii
Figure 17. Conners-P Ratings across Groups
Figure 18. Conners-T Ratings across Groups
Figure 19. Conners-SR Ratings across Groups

xiii
List of Appendices
Appendix 1. TBI severity coding scale. Severity was coded utilizing this novel scale that
incorporated GCS scores and injury information available on all pre-surgical CT reports.
Appendix 2. A) Injury severity characteristics, B) TBI and S-ADHD Group Characteristics

1
Chapter 1 Introduction
Inhibitory control (IC) is a key component of executive functioning involved in the self-
regulation of behaviour, and it interacts with other executive-cognitive processes such as
working memory to guide adaptive interactions with the environment (Fuster, 2002; Logan,
1994). The IC construct itself is not unitary, but involves distinct processes such as cancellation
and restraint. Cancellation refers to inhibiting or stopping an already initiated or ongoing action;
for example, stopping the swing of a baseball bat as the pitch leaves the strike zone. Restraint
refers to withholding or preventing a prepotent response before it is initiated. Typical ―first-
person shooter‖ video games often involve this type of IC, requiring gamers to shoot at one type
of target (the bad guy), but restrain from shooting at another (innocent bystanders).
Deficits in IC are reflected not only in performance on neurocognitive tests of cancellation and
restraint IC, but also in behaviours such as inattention, impulsivity, and hyperactivity. In
children, these types of behaviours are observed by parents in the context of family and home,
and by teachers in the context of peers, playground, and classroom. Self-report ratings of
inattention, impulsivity, and hyperactivity reveal how a child perceives his/her IC (dis)abilities,
and any discrepancies between child and informant ratings provide some information about the
child’s deficit awareness.
Acts of IC do not occur within a motivational vacuum. Slamming on the brakes in response to a
red light is done to avoid a car accident or a ticket. For a child, acting in a controlled manner may
generate a reward in the form of praise or a tangible reward such as a cookie. Indeed, behavior is
often performed in order to avoid a punishment or to gain a reward. But how does reinforcement
affect IC? At a developmental level, IC and reward systems are both immature in children (e.g.,

2
Geir & Luna, 2009; Rubia, Smith, & Taylor, 2007). At a behavioral level, reinforcement can
both facilitate and hinder IC, depending on the strength and direction of the reinforcer. At a
neural level, rewards may directly influence the interaction between IC and motivational centers
in the brain, or may alter the activity in other brain centers that integrate inhibition and
motivation (Padmala & Pessoa, 2010). Because cancellation and restraint have different
measurement parameters, developmental trajectories, and neurological underpinnings (see
below; Chevrier, Noseworthy, & Schachar, 2007; Konishi, Nakajima, Uchida, Sekihara, &
Miyashita, 1998; Konishi et al., 1999; Johnstone et al., 2007; Williams, Ponesse, Schachar,
Logan, & Tannock, 1999), different forms of IC may be differently modifiable by reward across
development.
Poor IC has been documented across a wide range of neurodevelopmental and acquired disorders
of childhood, but a recent literature review suggests that IC may differ in degree and in kind
across disorders (see Dennis, Sinopoli, Fletcher, & Schachar, 2008). Because the literature
review compared disorders in different studies using different IC paradigms and measures,
important questions remain to be investigated: Do childhood disorders with IC problems differ in
the magnitude of IC difficulties or in the type of deficit? Is the reason for similar IC problems in
two groups superficial, or does it arise from different basic mechanisms?
The objective of this dissertation was to examine the broader questions about IC posed above in
children and adolescents with traumatic brain injury (TBI) who have developed attention-
deficit/hyperactivity disorder (ADHD) subsequent to the injury (secondary ADHD, S-ADHD).
Although 10-19 % of children with TBI exhibit a pre-injury diagnosis of ADHD (Gerring et al.,
1998; Max et al., 2004; Max et al., 1998; Slomine et al., 2005), approximately 15-20% of
survivors develop de novo symptoms of ADHD (Gerring et al., 1998; Gerring et al., 2000;

3
Herskovits et al., 1999; Max et al., 2005a; Max et al., 2005b; Slomine et al., 2005; Yeates et al.,
2005). Brown and colleagues (1981) published the first account of S-ADHD, describing a
hyperkinetic syndrome accompanied by a disinhibited state and impulsiveness in a subset of
severely-injured pediatric patients 2 years post-TBI. Subsequent studies have revealed that S-
ADHD is the most common psychiatric disorder in children with TBI (Max et al., 1998),
manifesting as early as 6 months post-injury and persisting into the chronic phase of recovery
(Levin et al., 2007; Max et al., 2005a, 2005b).
Inattentive and hyperactive/impulsive symptoms of S-ADHD peak at 6 months post-injury, with
greater and more frequent changes in hyperactive/impulsive symptoms over time, resulting in the
inattentive subtype being most prominent in this population (Levin et al., 2007). A number of
pre-injury variables have been found to be significantly associated with the emergence of S-
ADHD, including lower socioeconomic status, greater psychosocial adversity and adaptive
functioning, poorer family functioning, and poorer socialization and communication skills
(Gerring et al., 1998; Levin et al., 2007; Max et al., 2004; Max et al., 2005a, 2005b). Children
who develop S-ADHD also tend to develop new-onset, persistent personality changes, exhibit
greater affective lability and aggression, and experience the emergence of de novo oppositional
defiant /conduct /disruptive behaviour disorders (Gerring et al., 1998; Levin et al., 2007; Max et
al., 2004; Max et al., 2005a, 2005b). On the other hand, diagnosis of S-ADHD is not related to
age at assessment, age at injury, severity of injury, sex, number of lesions, lesion area and/or
volume (Gerring et al., 2000; Herskovits et al., 1999; Levin et al., 2007; Max et al., 1998; Max et
al., 2004; Max et al., 2005a, 2005b). There is some evidence of a relationship between lesion
location and diagnosis in the acute phase of injury, specifically damage to the orbitofrontal gyrus
(Max et al., 2005a), basal ganglia (especially the putamen), and thalamus (Herskovits et al.,
1999; Gerring et al., 2000), yet other studies have failed to show a relationship between lesion

4
location and S-ADHD diagnosis, especially in the chronic phase of recovery (Max et al., 2004;
Max et al., 2005b).
Previous research has mainly focused on elucidating the factors that predict the onset of S-
ADHD; however the meaning of an S-ADHD diagnosis remains unclear. One important area of
study is whether S-ADHD is an acquired condition that reflects abnormalities much like those
present in children with developmental or primary ADHD (P-ADHD). P-ADHD is associated
with IC deficits that range across a number of tasks, including cancellation and restraint (e.g.,
Schachar, Logan, Robaey, Chen, Ichowicz, & Barr, 2007; Willcutt, Doyle, Nigg, Faraone, &
Pennington, 2005). Poor IC is a well-studied deficit in P-ADHD thought to reflect frontostriatal
dysfunction (e.g. Aron & Poldrack, 2005), and is a candidate endophenotype for the disorder
(Crosbie, Perusse, Bar, & Schachar, 2008). If children with S-ADHD present with IC difficulties,
are they similar to the prototypical IC deficits of children with P-ADHD, and are deficits
apparent in both cancellation and restraint paradigms? If so, does this suggest similarity in
underlying processes/mechanisms between S-ADHD and P-ADHD? Alternatively, do children
with S-ADHD exhibit a ―pastel‖ version of P-ADHD or a fundamentally distinct IC profile?
The question of IC abilities in youths with S-ADHD is both urgent and problematic. Deficits in
this group are poorly characterized. Compared to children with TBI without ADHD, children
with S-ADHD exhibit greater impairments in attention (Slomine, Salorio, Grados, Vasa,
Christensen, & Gerring, 2005) but similar cancellation IC indicating an impairment only relative
to healthy controls (Konrad et al., 2000a; Konrad et al., 2000b). On the other hand, poorer
cancellation IC has been documented in children with both a severe TBI and S-ADHD diagnosis
relative to children with TBI only and healthy controls (Schachar et al., 2004), suggesting that
those with greater injury severity and a de novo diagnosis of ADHD are more susceptible to

5
disinhibition than those with less severe injuries. To date, no study has examined restraint IC in
children with S-ADHD. Because difficulties with IC tend to resolve by 2 years post-TBI
(Leblanc et al., 2005), a major problem with the Konrad et al. (2000a, 2000b) studies is that they
included children in the in the acute and chronic phases of recovery. Thus further studies are
warranted to examine the long-term influences of TBI and S-ADHD on both cancellation and
restraint IC, and how reward may impact each of these processes.
To address the issues outlined above, IC on neurocognitive tests of rewarded and unrewarded
cancellation and restraint tasks were examined in a S-ADHD group and in three other carefully
selected groups. Typically developing children and adolescents formed a healthy control group
that was used, first, to chart previously unstudied age-related changes in cancellation and
restraint under conditions of reward, and, second, to provide benchmarks of typical development
for the clinical comparison groups. Children with TBI without a diagnosed S-ADHD (TBI
group) allowed the study of the effects of childhood TBI on IC processes, independent of clinical
ADHD status. While not all children with TBI develop S-ADHD, it remains unclear whether
children with S-ADHD exhibit a similar neurocognitive phenotype to children with TBI without
a diagnosis of ADHD, despite the expression of behaviorally significant attention problems. If
children with TBI are shown to exhibit similar IC deficits as those with S-ADHD, then the link
between IC dysfunction and specific psychiatric syndromes like ADHD may need to be re-
examined. The P-ADHD group included children and adolescents with the primary,
developmental form of the attention disorder. Carefully parsing similarities and differences in
both neurocognitive and clinical features of S-ADHD and P-ADHD examines the question of
whether deficits in IC are qualitatively and quantitatively different, as well as whether or not
these deficits arise from similar mechanisms.

6
In addition to exhibiting IC deficits, children with P-ADHD also respond abnormally to rewards
(e.g., Haenlein & Caul, 1987; Sonuga-Barke, 2002). How rewards affect IC in this population is
not yet clear, with methodological confounds complicating the interpretation within and across
studies. Very little is known about how rewards affect cognition and behavior (specifically IC) in
children with S-ADHD. There is some evidence of a delay aversion in children with S-ADHD
(Konrad et al., 2000a); a deficit thought to be related to abnormalities in the mesolimbic reward
system (see Sonuga-Barke, 2002). Only one study has examined the effects of reward on
cancellation IC in this population, revealing that rewards improve the latency to inhibit responses
despite persisting impairments relative to controls (Konrad et al., 2000b). However, as
mentioned previously, the Konrad et al. (2000a, 2000b) studies included children in both the
acute and chronic phase of injury, tempering the interpretation of these results. To date, no study
has articulated similarities and differences in how S-ADHD and P-ADHD groups respond to
rewards. Comparisons between groups on rewarded IC tasks would further delineate S-ADHD
from P-ADHD, and would show whether reward effects are independent or enmeshed with
disorder-specific IC deficits. If there is indeed an abnormality in reward processing in ADHD,
interventions that utilize reward as a motivational strategy for the adjustment of behaviour may
need to be modified in order to account for these difficulties.
With the general objective of understanding S-ADHD in mind, the dissertation proceeded to
execute a series of steps. The first two steps involved solving a pair of methodological problems:
the comparability of different IC tasks and the issue of how to reward inhibition but not response
execution (―going‖). While there is consensus that the stop signal task (SST) and the go/no-go
task (GNG) both measure IC (the former measuring cancellation, the latter, restraint), attempts to
ascribe these to different underlying processes are confounded by differences in methodology.
The SST mixes sensory modalities, with a visual go signal (to respond to) and an auditory stop

7
signal (signaling cancellation), while the GNG task involves a visual go signal and a visual no-go
signal for restraint. Thus, IC in the GNG task may be confounded by the demands that the task
places on selective attention rather than on IC (Aron & Poldrack, 2005; Rubia, Smith, Brammer,
& Taylor, 2003). Schachar and colleagues (2007) addressed this problem by creating a restraint
version of the SST to address cancellation and restraint in a common methodology with a
common metric of inhibition (stop signal reaction time, SSRT). STEP 1 involved the adaptation
of this methodology for the dissertation studies.
One difficulty in studying IC and reward is that many previous studies rewarded both response
execution and IC, or used both reward and punishers within the same paradigm, effectively
confounding the motivational manipulation. As a result, it is not possible to identify which
operation are the targets of reinforcement. Further, the addition of both rewards and punishers in
a single paradigm has limited the comprehension of the effect of reward on IC. STEP 2 involved
creating a paradigm where only successful cancellation and restraint were rewarded, and where
response execution and failed inhibition trials had no overt motivational consequences.
STEP 3 involved collecting benchmark data for how IC and reward interact in typically
developing children and adolescents. Chapter 2 examined the effect of increasing reward
magnitude (no reward, low reward, high reward) on restraint and cancellation in healthy
participants aged 7-17 years old. The specific aims of the study were to show how reward
improved IC cancellation and IC restraint in typically developing children and adolescents, and
given the immaturity of both reward and inhibition systems, to chart age-related differences in
how rewards affect IC from childhood through adolescence.
Having demonstrated the appropriateness of the new IC reward paradigms for typically
developing children and adolescents, the dissertation progressed onto STEP 4, which involved

8
the administration of the restraint and cancellation versions of the SST (reward and non-reward
conditions) to the four carefully selected groups described above (controls, TBI, S-ADHD, and
P-ADHD). The results of those comparisons are described in Chapter 3. The first specific aim
was to delineate TBI from S-ADHD. Approximately 10-20 % of children with TBI were
predicted to exhibit symptoms consistent with a S-ADHD diagnosis, and these participants were
expected to exhibit poorer IC on the SST measures of cancellation and restraint relative to those
with TBI only or controls. Participants in the P-ADHD group were expected to exhibit poorer IC
relative to controls, with rewards potentially improving this performance. In a direct comparison
of the ADHD groups, similar IC performance may reflect similarities in underlying mechanisms
of dysfunction, and would show that children with TBI without S-ADHD are behaviorally
distinct from TBI without S-ADHD. These findings would have implications for the assessment
and prediction of deficits following TBI, and may indicate the need for a similar treatment
approach for children with S-ADHD as is established for children P-ADHD. However, stimulant
medication that is effective in treating the developmental form of the disorder is less effective in
controlling S-ADHD (Jin & Schachar, 2004), suggesting potential differences between the
disorders that may be apparent at the behavioral level as well. Differences in IC between the
ADHD groups would suggest that S-ADHD is not merely an acquired form P-ADHD despite
overlap in clinical expression, and would suggest the need for further delineation of deficits in
the S-ADHD group and interventions targeted to their specific dysfunction.
STEP 5 involved the ecology of behavioral IC (inattention, impulsivity, and hyperactivity) at
home and at school and its relation to IC on the cancellation and restraint tasks. Children and
adolescents are surrounded by people who form constant impressions of their IC and attentional
abilities. Parents of children with IC deficits can report on home and leisure behavior in the
family, while teachers see these children with peers in the classroom and playground.

9
Considerable debate exists in the literature about self-knowledge of deficits in typically
developing children and in those with TBI, mainly due to the dearth of information on this topic.
After TBI, adults exhibit a lack of awareness of the consequences of their injury, with
incongruence between self and other ratings of behavioral and affective functioning (e.g., Bivona
et al., 2008; Hart, Seignourel, & Sherer, 2009; Prigatano, 1996). Similarities and differences
between the ways in which parents and teachers rate the IC behaviour of children with S-ADHD
relative to children with P-ADHD remains to be explored, and no study to date has assessed how
children with S-ADHD rate their own behaviours.
Chapter 4 addressed three specific aims related to the issues presented above: 1) how do parents,
teachers, and the children themselves rate inattention, hyperactivity/impulsivity, and DSM-IV-
TR ADHD symptoms? 2) What are the levels of rater concordance and to what extent are the
three raters endorsing the same symptoms? 3) How are behavioral ratings related to
neurocognitive measures of restraint and cancellation IC? These questions are intrinsically
interesting and provide missing information about how children with S-ADHD behave in the real
world and about whether children with TBI have insight into their level of inattention,
impulsivity, and hyperactivity. Overall, the study in Chapter 4 is a natural extension of the
previous studies, as it provides information on other aspects of behaviour in children with S-
ADHD and also describes the ecological congruence between the IC behaviors and
neurocognitive measures of IC.
For all study groups, ratings of behavioural IC were defined as behaviours that reflected poor
inhibition on the Conners 3rd
Edition (Conners 3; Conners, 2008) multi-informant rating scales.
Subscales of interest were those that measured inattention, hyperactivity/impulsivity, and DSM-
IV-TR ADHD symptom criteria. The Conners 3 was chosen as an appropriate tool to assess IC

10
behaviors reported by parents, teachers, and the participants themselves. It assesses ADHD
behaviours such as inattention, hyperactivity, and impulsivity, as well as associated behaviours
such as oppositionality and academic difficulties. Importantly, it includes items that correspond
to the DSM-IV-TR ADHD subtypes of hyperactivity/impulsivity and inattention, so that ADHD
symptoms can be measured both quantitatively and categorically. All scales are easy to
administer and score and the results can be easily profiled for each participant. The normative
sample that the scale is based on is large, with ratings taken from over 8000 individuals in over
200 rural and urban sites in Canada and the US, including individuals from different social
classes, ethnicities, ages and gender. Moreover, the scale yields moderate to high validity and
reliability coefficients (Conners, 2008).
STEP 6 involved reflecting on some of the more general questions arising from the three studies.
The general discussion of these questions is in Chapter 5, and includes the following issues: the
developmental course of IC and reward processes; how IC problems manifest across a range of
childhood disorders and the interpretation of IC behavioral phenotypes and IC neurocognitive
phenotypes; and the ecological validity of IC tasks. Chapter 5 ends with the suggestion of some
avenues for future research, limitations of the dissertation studies, and a return to the question
driving the dissertation: what, if anything is unique about IC in S-ADHD and how does it differ
from P-ADHD?

11
Chapter 2 Reward Improves Cancellation and Restraint Inhibition Across
Childhood and Adolescence
Inhibitory control (IC) is a regulatory mechanism that facilitates adaptive interactions with the
environment by aligning current thought and action with priorities of changing goals and stimuli
(Logan, 1994). IC involves rapid, voluntary, internally generated acts that oppose excitatory
(―go‖) signals to respond, and interacts with other adaptive processes such as performance
monitoring and error adjustment (Logan, 1994; Verbruggen & Logan, 2008). Motor inhibition
functions include (but are not limited to) withholding or restraining a response before it is
initiated, and canceling or stopping a prepotent, ongoing response. Reinforcement of these
processes may promote favourable outcomes (successful inhibition) or prevent negative
outcomes (failed inhibition). In the present study, the effects of reward on the IC functions of
cancellation and restraint were examined in typically developing children and adolescents.
Like other regulatory mechanisms such as working memory or performance monitoring, IC
improves with development. The latency to cancel a response becomes faster throughout
childhood and adolescence, with only limited slowing in older adults (Williams, Ponesse,
Schachar, Logan, & Tannock, 1999). Restraint inhibition, in contrast, peaks around age 12 years
(Levin, Culhane, Hartmann, Evankovich, & Mattson, 1991). Age-related improvements in both
types of IC are thought to reflect maturation of frontostriatal circuitry (Liston et al., 2006; Rubia,
Smith, & Taylor, 2007) which includes non-linear decreases in cortical gray matter accompanied
by linear increases in myelination (Giedd et al., 1999; Gogtay et al., 2004; Sowell, Thompson,
Holmes, Jernigan, & Toga, 1999).

12
Acts of IC occur within a motivational context of reward, non-reward, and punishment. As with
substrates of the IC system, the neural substrates of the reward system, including dopaminergic
networks, are also immature in children and adolescents (Geir & Luna, 2009; Meng, Ozawa,
Itoh, & Takashima, 1999). What is not understood is how reward modulates different forms of
IC throughout development. In typically developing children, the effect of reinforcers on
cancellation and restraint have been variously reported as facilitatory (Desman, Petermann, &
Hampel, 2008; Huang-Pollock, Mikami, Pfiffner, & Burnett, 2007; Kohls, Peltzer, Herpertz-
Dahlmann, & Konrad, 2009; Scheres, Oosterlaan, & Sergeant, 2001), impairing (Wodka et al.,
2007), or as having no effect on either process (Iaboni, Douglas, & Baker, 1995; Oosterlaan &
Sergeant, 1998; Slusarek, Velling, Bunk, & Eggers, 2001). It may be that typically developing
children perform at optimal levels with very minimal levels of reinforcement (Slusarek et al.,
2001), such that any further incentives may have null effects or result in slowing response
execution to ensure successful inhibition.
Although centrally located neural substrates such as the ventrolateral prefrontal cortex or basal
ganglia may be important for both cancellation and restraint (Dillon & Pizzagalli, 2007; Leung &
Cai, 2007; Xue, Aron, & Poldrack, 2008), evidence supports the idea of distinct pathways
mediating each form of inhibition. Specifically, cancellation may engage a predominately
bottom-up, rapid control system involved in the detection of salient sensory stimuli (i.e., the stop
signal; e.g., Chevrier, Noseworthy, & Schachar, 2007; see Downar, Crawley, Mikulis, & Davis,
2002), while restraint may be mainly dependent on a top-down system driven by regulatory
centers in the dorsal aspects of the prefrontal cortex (e.g., Kelly et al., 2004). Given that restraint
and cancellation differ in their measurement (see below), developmental trajectory, and
neurological underpinnings, then the way each is modifiable by reward might be dissociable as
well.

13
Understanding the developmental effects of reward on inhibition has been clouded by a set of
methodological problems. Some studies lack a neutral reward condition (Huang-Pollock et al.,
2007; Iaboni et al., 1995; Oosterlaan & Sergeant, 1998; Slusarek et al., 2001), or confound the
influence of both rewards and punishments on response execution and IC processes (Shanahan,
Pennington, & Willcutt, 2008; Slusarek et al., 2001). One study showed that rewards and
punishments ameliorated IC as well as feedback about the ―correctness‖ of the response
(Desman et al., 2008), and another showed that reinforcement decreased the latency to cancel a
response by only 5-13 milliseconds (Scheres et al., 2001). The Kohls et al. (2009) study of
rewarded restraint involved children, leaving developmental questions about adolescence
unexplored.
To date, no study has compared how rewards affect restraint and cancellation inhibition in the
same study and with methodologically comparable paradigms. Cancellation inhibition is often
measured with the stop signal task (SST; Logan & Cowan, 1984; Logan, 1994). The SST
consists of a primary visual choice reaction time task (responding quickly to one of 2 ―go
signals‖), and a secondary task where participants are instructed to stop responding to go signals
when the auditory ―stop signal‖ occurs (Logan & Cowan, 1984; Logan, 1994). The stop signal is
presented at various delays following the onset of the go signal such that the response is
cancelled rather than withheld. The latency of inhibitory control (i.e., the stop signal reaction
time, SSRT) is estimated as a measure of the efficiency of inhibitory control (Logan, 1994).
Restraint inhibition is typically measured with the go/no-go (GNG) task in which participants
respond as quickly as possible to a go stimulus and inhibit their responses to a no-go stimulus,
each occurring on separate trials. Responses to the no-go stimulus (commission errors) index
failed inhibitory control.

14
The present study compared cancellation and restraint inhibition in comparable experimental
paradigms in typically developing children and adolescents, and analyzed whether these forms of
IC were modifiable by reward. In addressing the methodological criticisms of previous studies,
only successful IC trials were rewarded, and these effects were compared to performance during
a neutral, non-reward condition. To make task procedures comparable over different inhibition
operations, we employed the cancellation and restraint versions of the SST (Schachar et al.,
2007). Critics of the GNG task argue that because a similar modality is required to discriminate
between go and no-go stimuli (i.e., both are visual cues occurring on separate trials), the act of
inhibition may be confounded with the process of selective attention, so that the demands on IC
may be weaker in the GNG task than in the SST (Aron & Poldrack, 2005; Rubia, Smith,
Brammer, & Taylor, 2003). To make the SST and GNG tasks methodologically comparable,
Schachar and colleagues (2007) developed a restraint (i.e., GNG) version of the SST where the
delay between the onset of the go and stop signal is zero. Thus, the concurrent presentation of the
go and stop signals interrupts the preparation of a response rather than interrupting an ongoing
response (Schachar et al., 2007). In this manner, prepotent responding to the go signal is
withheld, similar to the GNG task. Importantly, the no-go signal in the restraint version of the
SST is an auditory tone, which minimizes the task demands on selective attention.
We predicted that rewards, which promote approach and consumption (Schultz, 2006), would
improve IC across tasks. Given the immaturity of both the reward and inhibition systems, we
hypothesized that there would be age-related differences in the way in which rewards affect
inhibition processes, with greater reward-induced facilitation of IC apparent in the adolescent
than in the child group.

15
1 Method
1.1 Participants
We recruited 66 healthy children and adolescents aged 7 to 17 years old through flyers and
community advertisements. Brief telephone interviews were conducted at recruitment with each
participant’s parent to exclude participants with neurological or psychiatric disorders, mental
retardation, learning disabilities, or sensory or motor impairments. Nine participants cancelled or
missed their appointments. To confirm that our participants were typically developing children
and adolescents with no significant behavioural impairments, parent ratings of each participant’s
behaviour were assessed with the Conners 3rd
Edition Rating Scales (Conners 3; Conners, 2008).
The Conners 3 assess behaviours and symptoms of attention-deficit/hyperactivity disorder
(ADHD) as well as other difficulties related to inattention and/or hyperactivity such as executive
dysfunction and oppositionality. Scales of interest on the Conners 3 included the Diagnostic and
Statistical Manual of Mental Disorders, 4th
edition text revision (DSM-IV-TR; American
Psychological Association, 2000) Scales, which assess behaviours related to ADHD, conduct
disorder, and oppositional defiant disorder, and DSM-IV-TR Symptom Counts which reflect the
criteria needed to make a diagnosis of either of these disorders. Participant data were excluded
from further analyses if parent ratings revealed significant elevations (T-score of 65 or greater)
on the DSM-IV-TR Scales and met criteria for any disorder on the DSM-IV-TR Symptom
Counts. Based on these criteria, 13 participants were excluded. The remaining 44 participants (22
female, 22 male; mean age, 12.44 years) were divided into two age groups: a TEEN group
(N=22, aged 13 to 17 years), and a CHILD group (N=22, aged 7 to 12 years).
All participants were administered the Vocabulary and Matrix Reasoning subscales of the
Wechsler Abbreviated Scale of Intelligence (WASI), and overall score was used to exclude

16
participants with IQ scores under 75. Demographic information was recorded at recruitment,
including household income, parental occupation, and parental education. The socioeconomic
status (SES) of each participant was computed using the Hollingshead Four-Factor Index
(Hollingshead, 1975), which includes parental occupation and education. Family Hollingshead
scores were calculated for each participant by averaging the SES scores of both parents. Family
SES data was based on data from one parent when this was the only information available.
Prior to testing, informed consent was obtained from each parent, and assent was obtained from
each participant. This experiment was conducted with approval of the Research Ethics Boards at
the Hospital for Sick Children and the University of Toronto.
1.2 Stop Signal Tasks
The SST is based on a formal model that conceptualizes performance as a race between go
processes (triggered by the go signal) and stop processes (triggered by the stop signal; Logan &
Cowan, 1984; Logan, 1994; Verbruggen & Logan, 2008). As go and stop processes ―race‖
against each other, the process that ―wins‖ the race determines the outcome (Logan & Cowan,
1984; Logan, 1994). Because inhibition is unobservable, the race model allows for the
measurement of the latency of IC (i.e., the SSRT) and the factors that affect the probability and
latency of stopping the ongoing response (Logan, 1994).
Two versions of the SST were used to measure canceling and restraining a prepotent response
(see Figure 1; Logan, 1994; Schachar et al., 2007). In both versions, the primary task involved
the computerized presentation of one of two possible go signals (an X or an O) on each trial.
Participants were instructed to respond to these stimuli as quickly as possible by making the
appropriate button press on a handheld controller. The auditory stop signal (a 1000 Hz tone
emitted from computer speakers) occurred randomly on 25% of trials, and participants were

17
instructed to inhibit their responses to the go signal when they heard this tone. Logan (1994)
reasoned that presenting the stop signal on only 25% of trials ensures that enough data on IC can
be collected while minimizing expectation for the stop signal, which can result in slower go
reaction time on the go trials as a strategy to increase the probability of inhibition.
In the restraint (GNG) version of the task, the stop signal was presented at the same time as the
go signal. Because the delay between the onset of the go and stop signal is zero, the response is
inhibited during the preparation of the response and before being executed (Schachar et al.,
2007). In the cancellation version, the stop signal was presented at various delays following the
go signal to allow for the interruption of an ongoing response. The initial delay period between
the presentation of the go and stop signal was set at 250 milliseconds and was adjusted
dynamically based on the participants’ performance (Logan, 1994). Using this dynamic tracking
of performance, the probability of inhibition on stop signal trials should converge on
approximately 50%, regardless of whether or not participants slowed their go signal reaction
time as a strategy to increase successful inhibition (Logan & Cowan, 1984; Logan, 1994).
The initial presentation of either version of the SST was a neutral or non-reward (NO) condition,
where participants received no specific feedback about performance. Rather, at the end of each
block, the words ―Good work! Press a button to keep going‖ appeared in the middle of the
screen. Following the NO condition, the participants were told that they would perform the task
for a second time where they could receive 2 points each time they successfully inhibited their
responses (low reward condition, LOW). They were also told that they would be performing the
task for a third time, where they could win 10 points for each successful inhibition trial (high
reward condition, HIGH), and if they could acquire 400 points by the end of the testing session,
they would receive a prize (a $10 gift certificate for the movies). Bonus points were offered for

18
pushing the buttons as quickly as they could when they saw the go stimuli. Although no bonus
points were actually rewarded, this instruction was introduced to reduce the tendency for
participants to slow their go RT to ensure successful inhibition (and thus win more points).
Points earned in the LOW and HIGH conditions were immediately represented on the screen in a
visual analog scale (the scale was left empty in the NO condition). At the end of each block, a
message appeared in the middle of the screen updating participants of how many points they had
just won in that specific block (e.g., ―You won 10 points.‖). Points earned were tallied by the
examiner, and total scores (and the prize) were revealed at the end of the testing session. The
reward conditions were always presented in the same ascending order of magnitude (NO, LOW,
HIGH).
All participants completed both the cancellation and restraint (GNG) versions of the SST three
times in order to examine performance under three different reward conditions (NO, LOW,
HIGH). Each reward condition consisted of 120 trials divided into 5 blocks of 24 trials each,
with the stop signal randomly occurring on 30 trials. The first block in each task was a practice
block, data from which were not utilized in subsequent analyses. The order of administration of
each version was counterbalanced, with a break between, during which other tasks were
administered.
1.3 Statistical Analyses
Age group differences in WASI and SES scores were examined with an analysis of variance
(ANOVA), and chi-squared tests compared group differences in sex and handedness.
Consistent with previous studies (Band, van der Molen, & Logan, 2003; Schachar, Levin, Max,
Purvis, & Chen, 2004; Shuster & Toplack, 2009), participants were excluded from the data
analyses if the following conditions were met: less than 66% accuracy on go trials, mean go

19
reaction time (MRT) less than 100 milliseconds, and for the cancellation version only, percent
inhibition (reflecting the amount of responses that were inhibited) less than 12.5% or greater than
87 %. Based on these criteria, one participant was excluded from subsequent analyses of the
cancellation and restraint data.
Dependent variables of interest in both versions of the SST (and across reward conditions) were
related to response execution and IC. Response execution measures included MRT, standard
deviation of go reaction time (SDRT), and accuracy on go trials (percent correct). IC measures
included SSRT and percent inhibition. SSRT was estimated via the integration procedure
(Logan, 1994). First, the go reaction times for trials in which there were no stop signals
presented were collapsed and rank ordered. Then, the go reaction time that corresponded to the
probability of inhibition was determined, and the SSRT was estimated by subtracting the mean
delay from this new ―integrated go reaction time‖. For instance, if a participant inhibited 55% of
their go responses when the stop signal was presented, then the 55th
slowest go reaction time was
used as the integrated go reaction time measure. This method can be used to estimate SSRT for
both cancellation and restraint versions of the SST (Schachar et al., 2007).
Performance on each task was compared separately for each dependent variable utilizing
repeated measures ANOVA, with reward condition as the within-subjects factor (NO, LOW,
HIGH), and group (CHILD, TEEN) and order (cancellation administered first, restraint
administered first) as the between-subjects factors. Repeated measures ANOVAs were also
utilized to compare MRT and SSRT between the restraint and cancellation tasks separately for
each reward condition. The only significant finding from analyses of sex differences was that
females exhibited more variable performance than males on the cancellation task (data not
shown), so we did not include sex in any further analyses.

20
2 Results
2.1 Participant Characteristics
Table 1 describes the participant characteristics. No participants were excluded based on WASI
scores below 75. Although there was a significant difference in IQ between groups (F(1,
42)=6.08, p=0.018), mean IQ scores were within the normal range. Family SES scores and
handedness were similar between groups, as was the gender distribution.
2.2 Cancellation
Approximately 50% of inhibition trials were successfully inhibited across reward conditions, and
there was no significant effect of age group on percent inhibition, confirming that the tracking
algorithm was successful at limiting the probability of inhibition to approximately 0.5 across
reward conditions and across participants.
2.2.1 Reward Effects
Repeated measures ANOVAs revealed a significant main effect of reward on SSRT (linear
effect, F(2, 78)=3.770, p=0.027; see Figure 2) and percent inhibition (linear effect, F(2,
78)=6.116, p=0.003; see Figure 3). Conversely, reward did not alter MRT (see Figure 4), SDRT
(see Figure 5), or the accuracy of responses on go trials (see Table 2). Therefore, as reward
magnitude increased, the latency to cancel a response decreased, but the probability of inhibition
also decreased. The speed and variability of response execution and primary task accuracy were
not altered by reward. Across reward conditions, there were no significant interactions between
any of the dependent variables and age, suggesting that reward did not alter performance
differently across age groups.

21
2.2.2 Age Effects
There were significant main effects of age group on the percentage of accurate responses on go
trials (F(1, 39)=12.569, p=0.0011), MRT (F(1, 39)=11.102, p=0.002), SDRT (F(1, 39)=11.000,
p=0.002), and SSRT (F(1, 39)=7.698, p=0.008). Participants in the TEEN group exhibited faster
and less variable go responses, were more accurate when responding to go stimuli, and exhibited
faster latencies to cancel a response when encountering a stop signal.
2.2.3 Order Effects
There were no main effects of task order on go task accuracy, MRT, SDRT, or SSRT, nor were
there any significant interactions between these variables and order across reward conditions.
There was, however, a main effect of order on percent inhibition (F=(1, 39)=8.896, p=0.005) and
an interaction between this variable and inhibition task order (F(2, 78)=5.005, p=0.009),
revealing that participants cancelled responses to a greater degree when the cancellation version
was administered first, especially in the no reward condition. There were no significant
interactions between any of the other dependent variables, task order, and age group across any
of the reward conditions.
2.3 Restraint
2.3.1 Reward Effects
There was a main effect of reward on the percentage of responses inhibited (linear effect, F(2,
78)=4.386, p=0.016; see Figure 6), indicating fewer errors of commission as rewards increased.
Reward also decreased the latency of SSRT (linear effect, F(2, 78)=9.378, p<0.001; see Figure
7), decreased the percentage of correct go responses (linear effect, F(2, 78)=3.368, p=0.04; see
Table 2), and decreased MRT (linear effect, F(2, 78)=5.559, p=0.005; see Figure 8). Reward did
not affect SDRT (see Figure 9). Thus, increasing reward magnitude helped restraint IC by

22
increasing the percentage of inhibited responses and decreasing inhibition speed. Reward also
decreased the latency to execute a response while also decreasing the accuracy to respond to the
go signal, suggesting a speed-accuracy tradeoff that did not influence the variability of
responses. There were no significant interactions between any of the dependent variables and age
across reward conditions, suggesting similar effects of reward across age groups.
2.3.2 Age Effects
There were significant main effects of age group on all response execution measures: accuracy of
go responses (F(1, 39)=13.453, p=0.001), MRT (F(1, 39)=18.062, p<0.001), and SDRT (F(1,
39)=11.544, p=0.002). Compared to children, adolescents exhibited faster, less variable and
more accurate go responses. There was no significant main effect of age group on percent
inhibition, but adolescents were faster at inhibiting their responses relative to children (SSRT;
F(1, 39)=19.246, p<0.001).
2.3.3 Order Effects
Order of task administration did not influence MRT, SDRT, or SSRT across reward conditions.
There was an interaction effect between order and percent inhibition (F(2, 78)=3.518, p=0.034)
revealing that fewer responses were restrained in the NO condition and more responses were
restrained in the HIGH condition if the cancellation version was administered first. There was
also a main effect of order on go task accuracy (F(1, 39)=4.800, p=0.035), showing better
accuracy on the go task if the restraint version was administered first. There were no significant
interactions between any of the dependent variables, order, and age group across any of the
reward conditions.

23
2.4 Task Comparisons
MRT was faster in the restraint version across reward conditions (linear effects; NO, F(1,
39)=4.803, p=0.034; LOW, F(1, 39)=25.658, p<0.001; HIGH, F(1, 39)=19.958, p<0.001).
However, this effect in the NO condition may have been driven by the order of task
administration: MRT was faster in the restraint version only if the cancellation task was
administered first, but was slower when the restraint version was administered first (interaction
effect; F(1, 39)=14.564, p<0.001). Conversely, SSRT was faster in the cancellation version of
the SST across reward conditions (linear effects; NO, F(1, 39)=117.336, p<0.001; LOW, F(1,
39)=226.802, p<0.001; HIGH, F(1, 39)=137.360, p<0.001). There was a significant interaction
between age group and SSRT in the NO condition (F(1, 39)=6.768, p=0.013), suggesting that in
the absence of reward, the finding of faster SSRT in the cancellation relative to restraint version
was greater only in the CHILD group. Participants in the TEEN group exhibited shorter SSRT
and MRT compared to participants in the CHILD group (data not shown).
3 Discussion
The present study explored the effect of reward magnitude on two different forms of IC
(cancellation and restraint) in typically developing children and adolescents. Increasing the
magnitude of reward earned for successful inhibition improved both cancellation and restraint
IC. The lack of interaction between age group and reward suggests that reward facilitated
inhibition to a similar degree across ages. On both versions of the SST, adolescents were faster at
inhibiting and executing responses, and were less variable and more accurate in their go
responses relative to younger children. Inhibition was faster in the cancellation version and
response execution was faster in the restraint version, although both findings may be mediated
24
by the order of task administration in the neutral condition. These results bear on the effects of
reward, age, and inhibition task.
3.1 Reward Effects
Reward operated similarly on cancellation and restraint to decrease the latency to inhibit
responses (i.e., SSRT). There were fewer commission errors in the restraint task following
administration of reward (i.e., percent inhibition increased), especially in the adolescent group.
In the cancellation task, reward decreased the percentage of responses that were inhibited, but it
seems that this effect was mainly due to the order of task administration. Regardless, neither
reward nor order effects changed the frequency of cancellation IC (approximately 0.5). The
effect of reward on go task accuracy in the restraint version was also mediated by task order. The
data are consistent with the general idea that reward effects are sensitive to context (e.g., Guitart-
Masip, Bunzeck, Stephan, Dolan, & Duzel, 2010; Luo, Ainslie, Giragosian, & Monterosso,
2009).
Reward did not differentially alter restraint or cancellation as shown by the lack of a significant
interaction between the dependent variables and task version. In the cancellation version,
rewards did not merely increase general information processing or approach behaviours because
there were no significant influences of reward on the speed of response execution as measured
by MRT. These data support the idea that ―going‖ and ―stopping‖ processes in the cancellation
task are dissociable (e.g., Aron, Fletcher, Bullmore, Sahakian, & Robbins, 2004; Chambers et al.,
2007), and rejects the claim that the speed of response execution is directly tied to the speed of
cancellation SSRT (see Alderson, Rapport, & Kofler, 2007). In the restraint version, increasing
reward magnitude decreased MRT and decreased go task accuracy in addition to its effects on
IC. Given that the stop and go signals are presented concurrently in restraint, the processes of

25
―going‖ and ―restraining‖ may be more closely related than in the cancellation version of the
SST, which may indicate a potential shared mechanism for response execution and IC in restraint
that is not apparent in cancellation.
Incentive learning involves the detection and estimation of the valence of appetitive stimuli
(rewards), followed by signals about the actual magnitude of the incentive and prediction errors
that allow for the adjustment of behaviour (Geir & Luna, 2009). Our results may allow us to
speculate about the brain bases that may underlie the facilitation of IC processes by reward. To
influence IC processes, rewards may directly influence the interaction between cognitive control
and motivational centers in the brain, or may be altering the activity in other areas that are
responsible for the integration of inhibition and motivation (Padmala & Pessoa, 2010). In the
present study, rewards may operate on overlapping neural substrates that mediate each form of
inhibitory control to effect the preparation of the inhibition function via stimulation of the
reward pathway.
We propose that stop signals that signify increased rewards for successful inhibition are more
salient than non-rewarding stop signals, enhancing the preparation of inhibition via stimulation
of bottom-up, inferior frontal gyrus (IFG)-mediated pathways, which in turn may have facilitated
the cancellation or restraint of a response. While the active suppression of motor responses is
largely undertaken by activity in the basal ganglia (Mink, 1996), successful restraint and
cancellation also involve activation of the IFG (e.g., Chevrier et al., 2007; Konishi, Nakajima,
Uchida, Sekihara, & Miyashita, 1998; Konishi et al., 1999). The IFG may be part of a network
that arouses attention when salient information, such as a stop signal, is detected in the
environment (Downar et al., 2002). The IFG may also signal when inhibitory control demands
increase or when previously learned information needs to be inhibited as task demands change

26
(Konishi et al., 1998; 1999; Smith & Jonides, 1998). Thus, the role of the IFG in cancellation
may be to direct attention toward the stop signal to improve the efficiency of inhibition while
decreasing the prepotent drive on go responses. Because restraint places a high cognitive demand
on response preparation and selective attention prior to the presentation of the no-go stimulus
(Johnstone et al., 2007; Kelly et al., 2004), successful restraint may rely predominantly on a top-
down control system driven by regulatory structures such as the dorsolateral (Garavan, Ross,
Murphy, Roche, & Stein, 2002; Kelly et al., 2004; Menon, Adleman, White, Glover, & Reiss,
2001), mid frontal, and dorsal premotor prefrontal cortices (Kelly et al., 2004; Watanabe et al.,
2002). Thus, the bottom-up ―saliency detection‖ and ―behavioural updating‖ system associated
with the bilateral IFG may interact with a top-down control system to result in successful
restraint inhibition.
Alternatively (or concurrently), reward signals may facilitate IC at the level of the basal ganglia
by similarly altering the preparation of the motor response. When the environment changes and
salient stimuli are detected, nigrostriatal and mesolimbic dopamine neurons are activated and the
subsequent dopamine release converges with glutamatergic output from the orbitofrontal cortex
and amygdala on dendritic spines in the dorsal and ventral striatum (Horvitz, 2002). Dopamine
acts to ―gate‖ basal ganglia processing of the gluatmatergic sensorimotor and incentive-related
information in the striatum by enhancing strong signals and dampening weak signals (see
Horovitz, 2002). Here, rewards may facilitate preparation of the inhibition response by
enhancing the gating mechanism of dopamine in the striatum.
3.2 Age Effects
Consistent with previous research (Hale, 1990; Johnstone et al., 2007; Williams et al., 1999), we
found that adolescents exhibited faster and more accurate IC and response execution than

27
younger children. For appropriate preparation, initiation, and on-line control of behaviour, a
balance between inhibition and response execution processes needs to be established (Rubia et
al., 2001). This balance seems to improve with development, with age-related changes in SSRT
distinct from age-related changes in go RT (Williams et al., 1999), suggesting distinct neural
mechanisms subserving the maturation of speeded information processing. Improvements in IC
may also be related to age-dependent improvements in other regulatory processes, such as
working memory, decision-making, and performance monitoring (e.g., Roncadin, Pascual-
Leone, Rich, & Dennis, 2007; Velanova, Wheeler, & Luna, 2009).
The neural circuits subserving inhibition mature into adulthood, and these changes correlate with
more efficient and controlled responses (Rubia et al., 2007). For instance, activity of the IFG is
greater in adults than in adolescents during successful inhibition, with linear progressive changes
occurring in response to successful stopping from ages 10-42 years in the bilateral inferior
prefrontal cortex, thalamus, caudate, and cerebellum (Rubia et al., 2007). Group differences in
SSRT may be related to increased recruitment of the IFG with age, which would increase the
saliency of the stop signal, thereby improving cancellation (Chikazoe et al., 2009). Restraint
inhibition matures somewhat earlier in development relative to cancellation, with adult levels in
performance reached by age 12 years (Levin et al., 1991). Increased maturation of the
frontostriatal system is related to improvements in restraint, with linear progressive changes
observed in the striatum and inferior and mesial prefrontal cortices correlated with successful no-
go trials (Liston et al., 2006; Rubia et al., 2006). Therefore, group differences in restraint
performance, both in terms of the latency to inhibit a response and percent inhibition, may reflect
age-related changes in the frontostriatal circuitry. In particular, the maturation of cognitive
control centers in the prefrontal cortex may promote developmental changes in restraint (Kelly et
al., 2004).

28
Like the inhibition system, reward circuitry, including the dopamine system, also matures with
age (Meng et al., 1999; Segawa, 2000; Spear, 2000). Adolescents recruit the same neural
circuitry as adults when encountering rewards (e.g., Bjork et al., 2004; Ernst et al., 2005; Galvan
et al., 2006), but relative to adults, exhibit decreased activation of the ventral striatum when
anticipating rewards (Bjork et al., 2004), but hyperactivation that is sustained and more diffuse in
both the ventral striatum and orbitofrontal cortex with reward consumption (Ernst et al., 2005;
Galvan et al., 2006; May et al., 2004). Hyperactivity in reward-related centers of the adolescent
brain parallel the exaggerated dopaminergic response to rewards that is apparent during
adolescence (Laviola, Macri, Morley-Fletcher, & Adriani, 2003); despite relatively low basal
levels of dopaminergic output (Andersen & Gazzara, 1993). Moreover, adolescents show
increased activity in the ventral striatum in anticipation of a high reward, but decreased activity
in the same region in anticipation of a low reward (Galvan et al., 2006).
Immaturities in the reward system may bias the underdeveloped adolescent inhibition system
towards actions that result in immediate rewards as a result of greater reward-seeking (Galvan,
2010; Geir & Luna, 2009). This can be adaptive if the decision is appropriate but maladaptive if
the behaviour is based on receipt of immediate rewards (Geir & Luna, 2009). On the other hand,
the hypoactive nature of anticipatory signals may drive high sensation seeking, which when
paired with an immature IC system and hyperactive consummatory signals, may bias adolescents
towards poor decisions marked by impulsivity and a lack of inhibition driven toward obtaining
high-risk, short-term goals (Ernst, Pine, & Hardin, 2006; Fareri, Martin, & Delgado, 2008; Geir
& Luna, 2009). Thus, one might expect that the adolescent group would have had an exaggerated
response to rewards given the apparent hyperactivity in their reward circuitry, perhaps leading to
faster SSRT during the high reward condition. While the slope of the reward effects on inhibition
appears greater in the adolescent group in both tasks, there were no significant interactions
29
between inhibition measures during reward trials and age group on either task, suggesting that
reward improves inhibition similarly across the developmental span studied here. The data do not
decide between a range of possibilities that may account for the apparent discrepancy between
the results and predictions based on the reward literature, which include: a lack of statistical
power; an underdeveloped IC system in the child group, biasing them toward high rewards,
thereby equating the response to rewards between age groups; and the fact that reward systems in
children may develop in some form earlier than expected. A direct comparison to adult
participants group may have shown the exaggerated response to reward hypothesized to be
present in adolescents.
3.3 Task Effects
The behavioural literature suggests that cancellation and restraint are different forms of
inhibition, and this is supported by developmental studies and research on neural function (e.g.,
Johnstone et al., 2007; Schachar et al., 2007). The present data provide further support for the
idea that IC is not a unitary construct by utilizing methodologically comparable inhibition tasks,
and also adds new information about how reward acts on each type of inhibition process. The
latency to inhibit a response was faster when a response needed to be cancelled, but the latency
to execute a response was faster in the restraint version. However, without reward present, ―go‖
responses in restraint were only faster in the NO condition when the cancellation version was
presented first. Therefore, under conditions of reward, it is easier to execute a response if the
demands on IC are to restrain a response. As argued by Schachar and colleagues (2007), because
the restraint task has a delay period of zero between presentation of the go and stop signal, it
allows an individual to delay responding to decide whether or not to respond, which might
account for longer SSRT in the restraint task.

30
3.4 Conclusions
Rewards facilitated both restraint and cancellation IC in typically developing children and
adolescents. Although cancellation IC was faster than restraint IC, both were similarly affected
by rewards. Adolescents were faster and more accurate across tasks, and age did not interact with
task version. These findings confirm that reward can positively alter inhibition processes
throughout development. Ongoing studies examine whether or not rewards influence inhibition
in children and adolescents with known inhibition deficits and reward-related sensitivities such
as those with ADHD or acquired traumatic brain injuries.

31
Table 1
Participant Characteristics
Group Age
(Years)*
WASI
Scores*
Family
SES*
Handedness
(Right : Left)
Sex
(Females :
Males)
CHILD 9.52 (1.8) 116 (12.8) 54 (6.6) 19:3 13:9
TEEN 15.36 (1.3) 108 (7.3) 51 (5.5) 22:0 8:14
*Mean (standard deviation)
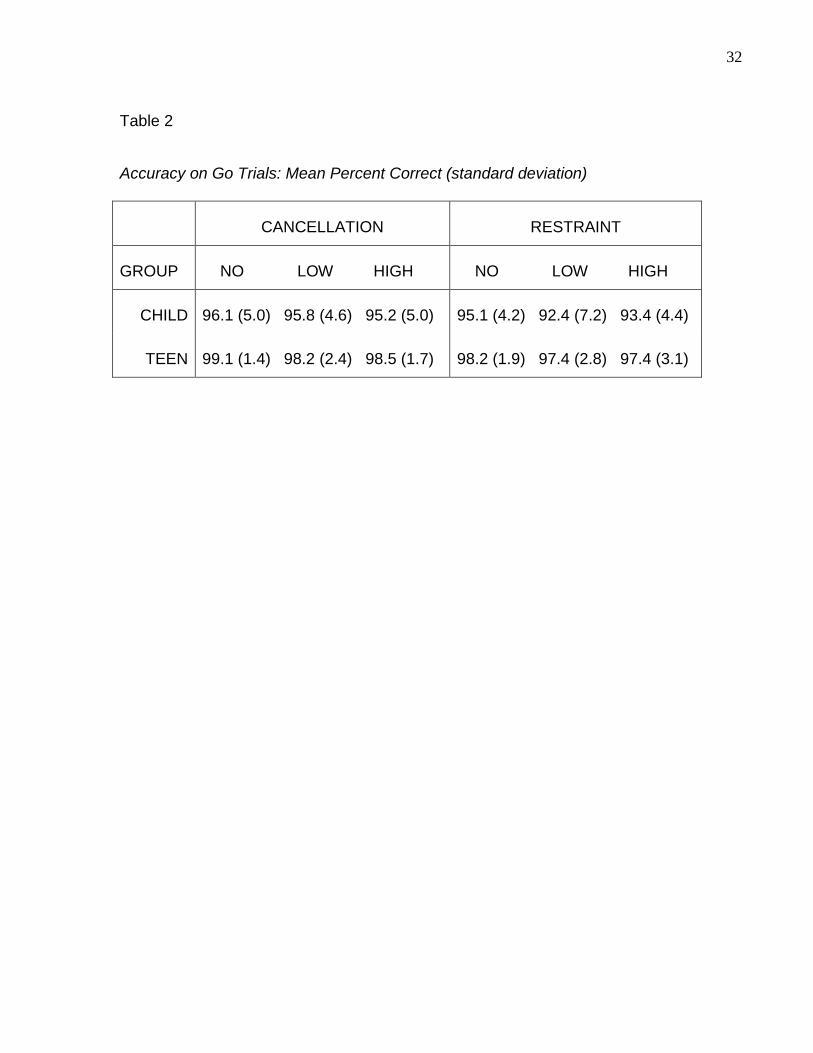
32
Table 2
Accuracy on Go Trials: Mean Percent Correct (standard deviation)
CANCELLATION RESTRAINT
GROUP NO LOW HIGH NO LOW HIGH
CHILD 96.1 (5.0) 95.8 (4.6) 95.2 (5.0) 95.1 (4.2) 92.4 (7.2) 93.4 (4.4)
TEEN 99.1 (1.4) 98.2 (2.4) 98.5 (1.7) 98.2 (1.9) 97.4 (2.8) 97.4 (3.1)

33
Figure 1
Cancellation and Restraint Models of the Stop Signal Task (with and without rewards)
Trials 1 and 2 represent the primary task in both versions, where a go signal (X in Trial 1, O in
Trial 2) is presented for 1000 milliseconds (ms) following a 500 ms fixation point. Participants
were instructed to respond to these stimuli as quickly as possible by making the appropriate
button press on a handheld controller. An inhibition trial is depicted in Trial 3. In the cancellation
version (left panel), the initial auditory stop signal was presented 250 ms following onset of the
go signal. If a participant was able to successfully inhibit his/her response, then the delay was
increased by 50 ms on the subsequent stop trail to increase the level of difficulty. If the

34
participant was unable to inhibit his/her response, then the delay was decreased by 50 ms on the
subsequent stop trial to make cancellation easier. In the restraint version (right panel), the stop
signal was always presented at the same time as the go signal (the delay between the onset of the
go and stop signal was zero). In both versions of the task, the feedback following the inhibition
trials were identical. Failed inhibition (i.e., going instead of stopping or withholding) resulted in
no feedback in the NO condition. In the LOW and HIGH conditions, failed inhibitions resulted
in the failure to win points. Successful inhibition in the NO condition also resulted in no
feedback. However, each successful inhibition in the LOW and HIGH conditions resulted in the
receipt of 2 or 10 points, respectively.

35
Figure 2
Mean (standard error, SE) SSRT in the Cancellation Version of the SST
SSRT decreased with increasing reward magnitude, and participants in the TEEN group
exhibited faster SSRT relative to participants in the CHILD group.
100
150
200
250
300
NO LOW HIGH
Me
an
(S
E)
SS
RT
(m
s)
Reward Condition
CHILD
TEEN

36
Figure 3
Mean (SE) Percent Inhibition in the Cancellation Version of the SST
Percent inhibition decreased with reward, but there were no effects of age or an interaction
between reward and age.
45
50
55
60
NO LOW HIGH
ME
AN
PE
RC
EN
T
INH
IBIT
ION
(S
E)
REWARD CONDITION
CHILD
TEEN

37
Figure 4
Mean MRT (SE) in the Cancellation Version of the SST
MRT was not altered by increasing reward magnitude, but was faster in the TEEN group relative
to the CHILD group.
400
450
500
550
600
650
NO LOW HIGH
Me
an
(S
E)
MR
T (
ms)
Reward Condition
CHILD
TEEN

38
Figure 5
Mean (SE) SDRT in the Cancellation Version of the SST
SDRT was not altered by increasing reward magnitude. Participants in the TEEN group
exhibited less variable responses relative to participants in the CHILD group.
50
100
150
NO LOW HIGH
Me
an
(S
E)
SD
RT
(m
s)
Reward Condition
CHILD
TEEN

39
Figure 6
Mean (SE) Percent Inhibition in the Restraint Version of the SST
Percent inhibition increased with reward, but there were no effects of age or an interaction
between age and reward.
80
85
90
95
100
NO LOW HIGH
ME
AN
PE
RC
EN
T
INH
IBIT
ION
(S
E)
REWARD CONDITION
CHILD
TEEN

40
Figure 7
Mean (SE) SSRT in the Restraint Version of the SST
SSRT decreased with increasing reward magnitude, and participants in the TEEN group
exhibited faster SSRT relative to participants in the CHILD group.
250
300
350
400
450
500
NO LOW HIGH
Me
an
(S
E)
SS
RT
(m
s)
Reward Condition
CHILD
TEEN

41
Figure 8
Mean (SE) MRT in the Restraint Version of the SST
MRT decreased with increasing reward, and was faster in the TEEN group relative to the CHILD
group.
400
450
500
550
600
NO LOW HIGH
Me
an
(S
E)
MR
T (
ms)
Reward Condition
CHILD
TEEN
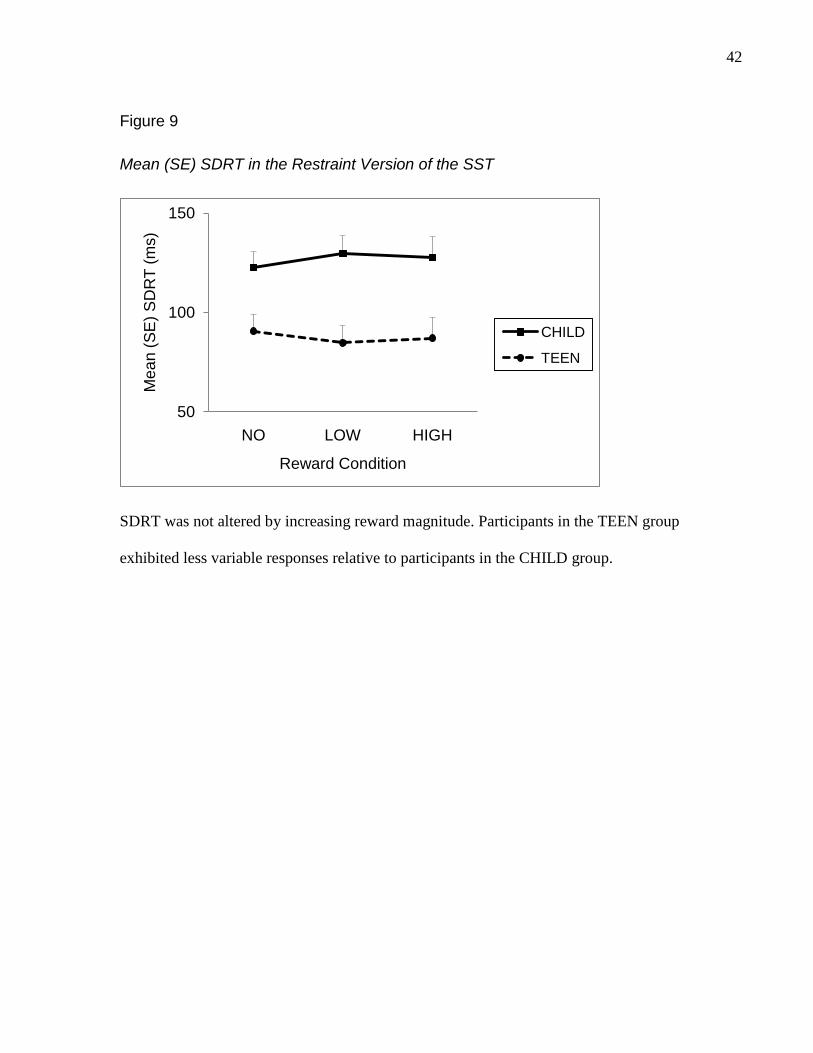
42
Figure 9
Mean (SE) SDRT in the Restraint Version of the SST
SDRT was not altered by increasing reward magnitude. Participants in the TEEN group
exhibited less variable responses relative to participants in the CHILD group.
50
100
150
NO LOW HIGH
Me
an
(S
E)
SD
RT
(m
s)
Reward Condition
CHILD
TEEN

43
Chapter 3 Traumatic Brain Injury and Secondary Attention-
Deficit/Hyperactivity Disorder in Children and Adolescents: The Effect of Reinforcement on Inhibitory Control
Traumatic brain injury (TBI) is common in children and adolescents, often resulting in
significant long-term cognitive and behavioural consequences including inattention (Catroppa,
Anderson, & Stargatt; Cicerone, 1996; Dennis, Wilkinson, Koski, & Humphreys, 1995) and poor
inhibitory control (IC; Levin, Hanten, Zhang, Swank, Hunter, 2004; Levin et al., 1993; Konrad,
Gauggel, Manz, & Scholl, 2000a, 2000b). Childhood TBI may also lead to persistent personality
changes (Max et al., 2000; Max et al., 2005a, 2005c), increases in aggressive behaviour (Cole et
al., 2008), and the emergence of new-onset psychiatric disorders such as attention-
deficit/hyperactivity disorder (i.e., secondary ADHD (S-ADHD); Max et al., 1998; Max et al.,
2005a, 2005b).
S-ADHD occurs in approximately 15-20% of TBI survivors without a previous history of ADHD
(Gerring et al., 1998; Gerring et al., 2000; Herskovits et al., 1999; Max et al., 2005a, 2005b;
Slomine et al., 2005; Yeates et al., 2005). This de novo diagnosis of ADHD manifests as early as
6 months post-TBI (Max et al., 2005a) and persists into the chronic stage of recovery (e.g., Max
et al., 1998, 2005b). It is not clear whether S-ADHD is simply the acquired form of
developmental or primary ADHD (P-ADHD), sharing commonalities in cognitive, behavioural
and functional outcomes, or whether fundamental differences exist between these disorders
despite similarities in overt behavioral expression. Differences between P-ADHD and S-ADHD
have been shown in terms of the expression of behavioral symptoms as well as in the underlying
pathology associated with each diagnosis. For example, children with P-ADHD exhibit structural
and functional abnormalities throughout the cerebrum, particularly in frontostriatal networks

44
(e.g., Casey et al., 1997; Castellanos et al., 1996), yet there is only limited evidence to suggest
that damage to similar neural networks is correlated with diagnosis of S-ADHD (Gerring et al.,
2000; Herskovits et al., 1999; Max et al., 2005b). While both groups of patients experience
deficits with IC (e.g., Schachar, Levin, Max, Purvis, & Chen, 2004b; Schachar, Logan, Robaey,
Chen, Ickowicz, & Barr, 2007), the nature and magnitude of IC difficulties in children with S-
ADHD have not been well-studied, and it is currently unknown whether both groups exhibit
similar deficits across all IC tasks or whether their responses to reinforcement are similar.
The behavioral phenotype of attention-inhibition deficits in P-ADHD has been parsed in a
number of different ways. A key distinction is that between canceling or stopping an ongoing
prepotent response and restraining or withholding an action. Children with P-ADHD exhibit
deficits in both cancellation and restraint (e.g., Schachar, et al., 2004a; Schachar et al., 2007).
Cancellation may be measured with the stop signal task (SST; Logan & Cowan, 1984; Logan,
1994), in which participants are instructed to respond as quickly as possible to one of 2 visual
―go‖ signals and stop responding when they hear the auditory stop signal (which is presented
after varying delays following the go signal). Poor or inefficient inhibition is manifested as
longer latencies to respond to the stop signal, or slower stop signal reaction time (SSRT).
Restraint is commonly measured with the go/no-go (GNG) task which requires participants to
respond as quickly as possible to a visual go stimulus, but to withhold their responses when they
encounter a visual ―no-go‖ stimulus. Poor restraint is indexed by the number of responses made
to no-go stimuli (commission errors).
In addition to difficulties with IC, children with P-ADHD respond abnormally to rewards and
exhibit failures in reinforcement learning in general, with some theorists speculating that these
children have a preference for immediate reward (Sonuga-Barke, 2002) and/or an insensitivity to

45
reward such that greater amounts of reinforcement are required to motivate behaviour (e.g.
Haenlein and Caul, 1987). Douglas (1985) argues that children with P-ADHD focus on rewards
and on the prospect of attaining rewards, and this increased vigilance may help to reduce
impulsive responses, which in turn should facilitate IC.
To date, results of studies of IC and reward in children with P-ADHD are equivocal, with reports
of reward facilitation (Desman, Petermann & Hampel, 2008; Huang-Pollock, Mikami, Pfiffner,
& McBurnett, 2007; Konrad et al., 2000b; Scheres, Oosterlaan, & Sergeant, 2001; Stevens,
Quittner, Zuckerman, & Moore, 2002; Tamm & Carlson, 2007), reward impairment (Gomez,
2003; Shanahan, Pennington, & Willcutt, 2008; Wodka et al. 2007), or null effects (Crone,
Jennings, & van der Molen, 2003; Iaboni, Douglas, & Baker, 1995; Oosterlaan & Sergeant,
1998). Methodological problems that complicate interpretation within and across these studies
include: lack of a control group (Tamm & Carlson, 2007); no non-reward condition to compare
reinforcement effects to (Huang-Pollock et al., 2007; Iaboni et al., 1995; Oosterlaan & Sergeant,
1998); confounding of rewards and punishments (Crone et al., 2003; Gomez, 2003; Shanahan et
al., 2008; Wodka et al., 2007); rewarding both response execution and inhibition (Huang-Pollock
et al., 2007; Shanahan et al., 2008; Stevens et al., 2002); the finding that feedback alone produces
similar improvements to rewards (Desman et al., 2008); and the existence of normal inhibition in
P-ADHD groups (Crone et al., 2003; Scheres et al., 2001), which makes it difficult to ascertain if
rewards facilitated or impaired performance. Current behavioural therapies for P-ADHD utilize
rewards and response costs to modify behaviour (Oosterlaan & Sergeant, 1998), so clarification
of the relationship between IC and reward in children with P-ADHD has important therapeutic
applications. For instance, if rewards can act to ―normalize‖ IC, then the focus of behavioural
therapy should be on training children with P-ADHD to achieve and maintain an adequate

46
motivational state to help reduce impulsivity, thus strengthening IC and other regulatory
processes (Luman, Oosterlaan, & Sergeant, 2005).
Relative to typically developing children, children with S-ADHD exhibit poor response
execution and cancellation IC on the SST, but similar performance to children with TBI without
a S-ADHD diagnosis (Konrad et al., 2000a, 2000b). An inhibition deficit has been documented
relative to children with TBI in those with both a severe TBI and S-ADHD diagnosis (Schachar
et al., 2004b), suggesting that those with greater injury severity and a de novo diagnosis of
ADHD are more susceptible to disinhibition than those with less severe injuries. Because most
studies include children in both chronic and acute phases of recovery, the interpretation of data
on inhibition in TBI and S-ADHD populations is not clear. For instance, children with TBI
exhibit an initial deficit in SSRT that resolves by two years post-injury (Leblanc et al., 2005).
Further, commission errors on the GNG task decrease with time since injury, with greater injury
severity resulting in poorer improvement over time (Wassenberg, Max, Lindgren, & Schatz,
2004). To date, only two studies have assessed both P-ADHD and S-ADHD groups on the SST
(Konrad et al., 2000a, 2000b), but because the performance was not directly compared between
groups, it is currently unknown whether or not these patients cancel their responses in a similar
manner. No study has compared the performance of children with P- and S-ADHD on other
forms of IC, such as restraint.
Little is known about reinforcement learning in children with S-ADHD or specifically how
reward variables influences inhibition in this population. Konrad and colleagues (2000b)
rewarded successful inhibition on the SST, which improved cancellation performance in children
with TBI and S-ADHD, although not to the point of comparability to controls. At the same time,
reward facilitated inhibition in children with P-ADHD such that their performance was similar to

47
controls. However, the ADHD groups were not directly compared in this study (Konrad et al.,
2000b), so it is unknown whether or not they responded similarly to reward.
While comparisons to non-injured controls are helpful in determining whether and how children
with S-ADHD differ from typically functioning children in terms of IC and responses to reward,
and comparisons to children with TBI without S-ADHD indicate the specific deficits S-ADHD
confers beyond the consequences of TBI, a direct comparison to children with P-ADHD may
reveal the degree and intensity of deficits in S-ADHD. This later comparison would also clarify
whether both forms of ADHD reflect a similar disinhibition syndrome despite differences in
etiology. Although childhood TBI can affect a number of cognitive processes, poor IC on the
SST (longer SSRT) has been proposed as a candidate endophenotype for P-ADHD (Crosbie,
Perusse, Bar, & Schachar, 2008). If children with TBI exhibit similar IC deficits as those with
ADHD, then the link between IC dysfunction and specific psychiatric syndromes like ADHD
may need to be re-examined. If children with S-ADHD exhibit similar deficits in cancellation
and restraint to children with P-ADHD, then S-ADHD may be thought of as an acquired disorder
that mimics the P-ADHD endophenotype, which would inform not only the brain bases of IC
deficits in P-ADHD, but also the neural bases of IC in general. If the two groups differ across
measures or exhibit a dissimilar pattern of results, then there is evidence that S-ADHD is a
separate disorder from P-ADHD, in terms of both underlying mechanisms and associated
behavioural deficits. If both groups of children respond similarly to reward despite differences in
IC, then it may be concluded that rewards operate similarly on IC across groups suggesting a
powerful effect of motivational variables in spite of differences in brain abnormalities. In sum,
each different pattern of results would have specific and direct implications for the assessment
and treatment of S-ADHD.

48
The objective of the present study was to understand how reward modulates cancellation and
restraint inhibition in developmental (P-ADHD) and acquired (S-ADHD) forms of ADHD. We
compared the 2 forms of inhibition in 4 groups of participants (typically developing children,
children with P-ADHD, children with TBI in the chronic stage of recovery, and children with
TBI in the chronic stage of recovery with a research diagnosis of S-ADHD). We used two
versions of the SST to measure cancellation and restraint that differed only in the presentation of
the stop signal (Schachar et al., 2007). Because the no-go signal in the restraint version of the
SST is an auditory tone, task demands are equated thus minimizing reliance on selective
attention that are associated with the traditional GNG task (Aron & Poldrack, 2005; Rubia,
Smith, Brammer, & Taylor, 2003). Following the administration of the standard IC tasks, we
then investigated the relation between reward and IC by rewarding successful cancellation and
restraint.
Predictions concerned both group and reward effects, and were aligned with the literature
reviewed earlier. We predicted that approximately 15-20 % of children with TBI would exhibit
symptoms consistent with a S-ADHD diagnosis, and these participants were expected to exhibit
poorer IC on the SST measures of cancellation and restraint relative to those with TBI only or to
healthy controls. Given that time since injury ameliorates cancellation deficits in children with
TBI (Leblanc et al., 2005), and that participants in the TBI group in the present study were also
in the chronic phase of recovery, we predicted that children with TBI without S-ADHD would
exhibit IC like that of normal controls under all reward conditions. Participants in the P-ADHD
group were expected to have poorer IC relative to controls, with rewards possibly improving IC
performance. If rewards can improve IC deficits in the P-ADHD group to levels exhibited by
typically developing children, it may suggest that children with P-ADHD also suffer from an
inability to self-motivate their own behaviour.

49
4 Method
4.1 Participants
Children and adolescents aged 7 to 17 years old were recruited into three groups. Participants in
the initial TBI group (n=63) were recruited through trauma registries at the Hospital for Sick
Children in Toronto. Inclusion criteria included the presence of a non-inflicted, non-penetrating
TBI at least 1 year but no more than 6 years prior to testing, hospitalization for at least one night
for the TBI, the absence of multiple head injuries, and no pre-injury neurological disorders. Ten
participants cancelled or missed their appointments, and 4 participants were excluded due to the
presence of a pre-injury P-ADHD diagnosis. Forty-nine participants formed the final TBI group
(21 female, 28 male; mean age, 11.89 years; mean age of injury, 8.07 years). Severity of injury
was defined by categories outlined by the method of Teasdale and Jennet (1974), separating
participants into those with mild (n=28), moderate (n=6), and severe (n=16) injuries based on
initial post-resuscitation Glasgow Coma Scale (GCS) scores. For patients that did require
resuscitation, the lowest GCS score on record was used. Severity was also classified utilizing a
new scale that generated a total severity score out of 20, including both a scaled GCS and the
presence of specific brain abnormalities on pre-surgical, inpatient computed tomography (CT)
scans (see Appendix 1).
Twenty children from the community were recruited into the initial P-ADHD group. Inclusion
criteria included the diagnosis of ADHD from a health care professional and a negative history
for TBI. Two participants were excluded from further analyses due to the lack of significant
parent and teacher endorsement of clinically significant ADHD symptoms required for an
ADHD diagnosis on Conners 3rd
Edition Rating Scales (Conners 3; Conners, 1998). One
participant initially recruited for the control group was included in the P-ADHD group based on

50
significant endorsement of diagnostic criteria for ADHD on the same scale (see below). The final
P-ADHD group (n=19; 2 female, 17 male; mean age, 10.70 years) included 12 participants who
were either drug naïve or were not currently taking any psychotropic medication for their
ADHD. The remaining participants were currently undergoing pharmacological treatment (with
2 participants taking multiple medications); these participants were asked to discontinue
treatment for 24 hours prior to testing.
Sixty-six typically developing children were recruited into an initial control group (CON group)
through flyers and community advertisements. Nine participants cancelled or missed their
appointments and 13 participants were excluded based on clinically significant elevations on the
Conners 3 rating scales (see below). The final CON group consisted of 44 participants (21
female, 23 male; mean age, 12.44 years).
Telephone questionnaires were conducted with each participant’s parent during recruitment to
screen for eligibility for participation. Exclusion criteria for TBI and P-ADHD groups included
the presence of mental retardation, severe psychiatric disorder (e.g. psychosis), and sensory or
motor impairments. Exclusion criteria for the CON group included a history of TBI, P-ADHD,
neurological or psychiatric disorders, mental retardation, learning disabilities, and sensory or
motor impairments.
All participants were administered the Vocabulary and Matrix Reasoning subscales of the
Wechsler Abbreviated Scale of Intelligence (WASI); participants with Full Scale IQ scores under
75 were excluded. Informed consent was obtained prior to testing from each participant’s parent,
and assent was obtained from the participants themselves. This experiment was conducted with
approval of the Research Ethics Boards at the Hospital for Sick Children and the University of
Toronto.

51
4.2 Rating Scales: Inclusion and exclusion criteria
The Full Form of the Conners 3 was administered to each participant’s parent and teacher. The
Conners 3 assesses behaviours related to ADHD symptoms and possible comorbid conditions, as
well as other variables such as cognitive difficulties (Conners, 2008). For the purpose of the
present study, we examined whether or not participants were rated as exhibiting elevated T-
scores (i.e., over 65) on the Diagnostic and Statistical Manual of Mental Disorders, 4th
edition
text revision (DSM-IV-TR; American Psychological Association, 2000) Scales and whether or
not they reached criteria for ADHD, conduct, and/or oppositional defiant disorder on the DSM-
IV-TR Symptom Counts of the Conners 3.
Thirteen participants in the CON group exhibited elevated T-Scores (over 65) on the DSM-IV-
TR Scales and met criteria for a disorder on the DSM-IV-TR Symptom Counts, thus were
excluded from further analyses. One excluded CON participant met DSM-IV-TR criteria for
ADHD diagnosis based on both teacher and parent ratings, so he was included in the P-ADHD
group. Two participants were excluded from the P-ADHD group due to the absence of a
diagnosis of ADHD based on both parent and teacher ratings.
We also used the Conners 3 to identify children in the TBI group who reached criteria for S-
ADHD. In addition to meeting criteria for inclusion into the TBI group, the participants in the S-
ADHD group needed to exhibit no evidence of P-ADHD prior to the TBI (based on parental
report during the recruitment phone call). Although not a full diagnostic interview, retrospective
reports about behavior prior to TBI have been used to exclude P-ADHD in previous S-ADHD
samples (e.g., Konrad et al., 2000a, 2000b; Schachar et al., 2004). To be eligible for inclusion
into the S-ADHD group, participants also needed to meet diagnostic criteria for ADHD (any
subtype) on the Conners 3 via teacher and/or parent reports. Given that S-ADHD has yet to be

52
defined in the DSM, we waived the age requirement for diagnosis as well as the requirement that
ADHD symptoms must be present in at least 2 environments (American Psychological
Association, 2000), because it is not clear if these criteria are necessary for the classification of
participants into the S-ADHD group. Nine participants in the TBI group without evidence of pre-
injury P-ADHD met criteria for S-ADHD through parent and/or teacher reports on the Conners 3
(S-ADHD group, 5 female, 4 male; mean age, 11.84 years; mean age at injury, 7.22 years), and
40 participants without evidence of ADHD on the Conners 3 remained in the TBI group (16
female, 24 male; mean age, 11.91 years; mean age at injury, 8.26 years).
4.3 Stop Signal Tasks
The SST is based on a formal model that conceptualizes performance as a race between response
execution (go processes) and response inhibition (stop processes; Logan & Cowan, 1984; Logan,
1994; Verbruggen & Logan, 2008); whichever process wins the race determines whether the
response with be executed or inhibited. The race model is advantageous because it allows for the
measurement of the latency of IC (i.e., the SSRT), which is an unobservable, internally generated
act of control (Logan, 1994).
Two versions of the SST were used to measure canceling (―cancellation‖) and restraining
(―restraint‖) a prepotent response (see Figure 1; Logan, 1994; Schachar et al., 2007). Both
versions consisted of a primary visual choice reaction time task involving a go signal and a
secondary task involving a stop signal (Logan & Cowan, 1984; Logan, 1994). In the primary
task, one of two possible go signals (an X or an O) was presented on a computer screen for 1000
milliseconds (ms) following a 500 ms fixation point. Participants were instructed to respond to
these stimuli as quickly as possible by making the appropriate button press on a handheld
controller. Participants were also instructed to inhibit their responses to the go signal when they

53
heard the auditory stop signal (a 1000 Hz tone emitted from computer speakers). The stop signal
occurred randomly on 25% of trials.
In the restraint version of the task, the stop signal was presented concurrently with the go signal
to prevent a response from being executed (Schachar et al., 2007). In the cancellation version,
the stop signal occurred at various delays following the go signal to interrupt an already executed
response. The delay between the presentation of the go and the stop signal was varied
dynamically in this version of the task to ensure that participants would cancel their responses on
50% of the inhibition trials, regardless of whether or not they slowed their go reaction time as a
strategy to increase successful cancellation (Logan & Cowan, 1984; Logan, 1994). The initial
stop signal delay was set at 250 ms. If a participant successfully inhibited his/her response, then
the delay was increased by 50 ms on the subsequent stop trail, and if the participant was unable
to inhibit his/her response, then the delay was decreased by 50 ms on the subsequent stop trial.
This method ensured approximate control over stop and go processes by increasing or decreasing
the ease of successful cancellation.
The latency of IC on both versions of the SST was estimated by determining the SSRT via the
integration procedure (Logan, 1994): the go reaction time in non-stop signal trials are rank
ordered, the go reaction time that corresponds to the probability of inhibition is determined, and
the SSRT is estimated by subtracting the mean delay from this new ―integrated go reaction
time‖. By utilizing this procedure, all faster go reaction times that would have been executed and
all slower responses that would have been stopped can be excluded from the final SSRT metric
(Schachar et al., 2007).
Each task version was performed under three different reward conditions presented in the same
ascending order of magnitude (NO, LOW, HIGH). In the neutral (NO) condition, the words

54
―Good work! Press a button to keep going‖ appeared in the middle of the screen. No other
specific feedback about task performance was revealed. Following the NO condition,
participants were informed that they would be performing the task for a second and third time
where they could win points for successful inhibition, and if they could win 400 points by the
end of the testing session, they would receive a prize (a $10 gift certificate for the movies). They
were also told that each time that they successfully inhibited their responses they would win 2
points in the low reward condition (LOW), which would be followed by a high reward condition
(HIGH) where they would win 10 points. Points earned were immediately represented on the
screen in a visual analog scale (the scale was left empty in the NO condition). Participants were
informed of how many points they had won in each block via a message in the middle of the
screen (e.g. ―You won 12 points.‖). Participants were also told that they would receive bonus
points for pushing the buttons as quickly as possible during the primary task. Although no actual
bonus points were rewarded, this additional instruction was given in order to reduce the tendency
for participants to slow their go reaction time to ensure successful inhibition. The points were
recorded by the examiner, and total scores were revealed at the end of the testing session. When
2 children did not win enough points for the prize, their scores were bumped up to 400 via
―bonus points‖ to ensure that all children won the prize.
Each reward condition of the cancellation and restraint versions of the SST involved a total of
120 trials divided into 5 blocks of 24 trials each, with the stop signal randomly occurring on 30
trials. The first block in each task was a practice block, not utilized in subsequent analyses. The
order of administration of each version was counterbalanced, with the WASI and another
computerized task intervening.
55
4.4 Statistical Analyses
Participant data from the SST was excluded from statistical analyses if any of the following
occurred (Band, van der Molen, & Logan, 2003; Schachar et al., 2004; Shuster & Toplack,
2009): less than 66% accuracy on go trials, mean go reaction time (MRT) less than 100 ms, and
for the cancellation version only, percent inhibition less than 12.5% or greater than 87 %. Based
on these criteria, 1 participant from the CON group, 2 from the TBI group, and 1 participant
from the ADHD group were excluded from analyses of the cancellation data, while 1 participant
from the CON group and 1 participant from the ADHD group were excluded from analyses of
the restraint data.
We examined both IC and response execution. IC was indexed by SSRT and by the number of
responses inhibited (percent inhibition). Response execution was indexed by MRT, standard
deviation of go reaction time (SDRT), and percent correct on go trials (accuracy). SDRT allowed
for a measurement of variability, or the degree to which go responses were consistent across the
tasks and reward conditions. We investigated accuracy to not only assess how well participants
performed on the go task, but it also allowed us to investigate if reward altered IC at the expense
of accuracy (i.e., speed-accuracy trade-off)
Age of test, age of injury, time since injury (for the TBI and S-ADHD groups only) and WASI
scores were compared between groups using an analysis of variance (ANOVA). Group
differences in performance on each task were compared separately for each dependent variable
utilizing repeated measures ANOVAs, with reward condition as the within-subjects factor (NO,
LOW, HIGH), group (TBI, S-ADHD, P-ADHD, CON) and order of task administration
(cancellation administered first, cancellation administered second) as between-subjects variables.

56
Given that IC improves with age (see Chapter 2), age at test was added as a covariate in these
analyses.
Regression analyses determined the impact of injury variables on performance in the TBI and S-
ADHD groups. Age at injury, time since injury, severity score (out of 20), and GCS score were
entered as possible predictors of SST performance. The effects of severity of injury using the
traditional GCS scoring method were also explored utilizing repeated measures ANOVAs with
severity (mild, moderate, severe) as the between-subjects factor and age at testing as the
covariate.
5 Results
5.1 Participant Characteristics
Participant characteristics for each group are presented in Table 3. There were no significant age
differences between groups, and age of injury and time since injury did not differ between the
TBI and S-ADHD groups. Although WASI scores differed between groups (F(3, 110)=4.244,
p=0.007), mean IQ scores were within the normal range for all groups and no participants were
excluded based on low IQ scores. SES also differed between groups (F(3, 102)=6.797, p<0.001),
with the CON group exhibiting greater scores relative to the other groups.
5.2 Cancellation
Percent inhibition was approximately 50% across reward conditions, and was not significantly
altered by reward (see Figure 10). Moreover, percent inhibition did not differ between groups.
These data indicate that the tracking algorithm was successful at limiting the probability of
inhibition to approximately 0.5 across groups and reward conditions.

57
5.2.1 Group and Reward Effects
The analysis of SSRT revealed a main effect of reward (linear effect; F(2, 198)=4.590, p=0.015)
and a significant group effect (F(3, 99)=3.784, p=0.013), but no significant interaction between
reward condition and group (see Figure 11). SSRT decreased across reward conditions, and
participants in the P-ADHD group exhibited longer SSRT relative to participants in the TBI
(p=0.009) and CON (p=0.001) groups. MRT did not differ between groups, nor was there a
significant effect of reward or reward by group interaction (see Figure 12). SDRT was not altered
by reward, nor was there a significant reward by group interaction (see Table 4). SDRT did differ
between groups (F(3, 99)=3.362, p=0.022), with participants in the P-ADHD (p=0.008) and TBI
(p=0.013) group exhibiting more variable performance relative to the CON group. Accuracy on
go trials differed between groups (F(3, 99)=8.283, p<0.001), with the P-ADHD group exhibiting
poorer go trial accuracy relative to both CON and TBI groups (p<0.001) (see Table 4). Percent
correct was not altered by reward and there was no significant reward by group interaction.
5.2.2 Order Effects
Order of task administration did not influence SSRT, MRT, and SDRT, nor were there
significant interactions between these variables and order. Greater accuracy on was observed
when the cancellation version was administered first (F(1, 99), 5.992, p=0.016). A significant
interaction between percent inhibition and order (linear effect; F(2, 198)=4.315), p=0.015)
indicates that participants were able to inhibit their responses to a greater degree in the NO and
LOW conditions when the cancellation version was administered first.

58
5.3 Restraint
5.3.1 Group and Reward Effects
Percent inhibition increased with increasing reward magnitude (linear effect; F(2, 202)=5.059,
p=0.007), but no significant differences were found between groups (see Figure 13). SSRT was
not altered by reward (see Figure 14) and was similar across groups. Despite the lack of
significant group effects on the inhibition variables, planned comparisons revealed differences
between CON and P-ADHD groups (percent inhibition, p=0.053; SSRT, p=0.03), suggesting
poorer restraint performance in the P-ADHD group relative to typically developing children.
Analysis of MRT yielded no significant effects of reward, group, or an interaction (see Figure
15). SDRT varied across groups (F(3, 101)=4.330, p=0.006), with the CON group exhibiting less
variable performance relative to P-ADHD (p=0.002) and S-ADHD (p=0.021) groups (see Table
4). Accuracy on the go task decreased with increasing reward magnitude (linear effect; F(2,
202)=4.072, p=0.018), suggesting poorer accuracy with greater rewards. No group differences in
accuracy or group by reward interactions were found (see Table 4).
5.3.2 Order Effects
Order of task administration did not alter SSRT, percent inhibition, or MRT. Participants were
more accurate (F(1, 101)=3.977, p=0.049) and less variable (F(1, 101)=5.620, p=0.02) when the
restraint task was administered first. The presence of an interaction between order and percent
inhibition (linear effect; F(2, 202)=3.613, p=0.029) suggests that a greater number of responses
were restrained in the NO condition if restraint was administered first, while the opposite was
true in the LOW and HIGH conditions.

59
5.4 Injury Variables
5.4.1 Cancellation
MRT and SDRT were significantly predicted by age of injury across reward conditions (see
Table 5); younger age at injury resulted in slower and more variable response execution in the
neutral and reward conditions. MRT during the NO and LOW conditions were additionally
predicted by time since injury: greater time since the injury was associated with faster response
speed (data not shown). Age at injury, severity, and GCS score were not significant predictors of
accuracy on go trials, SSRT, or percent inhibition.
Univariate ANOVAs utilizing GCS severity classification as the between-subjects variable
revealed an inconsistent pattern of results across dependent variables. Group differences in
SDRT were found in the NO condition (F(2, 43)=4.412, p=0.018), with participants with
moderate injuries exhibiting more variable performance relative to participants with mild
(p=0.007) or severe (p=0.01) TBIs. Group differences in SSRT were found in the NO (F(2,
43)=3.204, p=0.05) and HIGH (F(2, 43)=3.759, p=0.031) conditions, with participants with
severe injuries exhibiting longer SSRTs than those with mild injuries (p=0.019 and p=0.016,
respectively).
5.4.2 Restraint
Regression analyses revealed that age of injury was a significant predictor of MRT and SDRT
performance across reward conditions (see Table 5), indicating that a younger age of injury
results in slower and more variable response execution. MRT during the NO and LOW
conditions were additionally predicted by time since injury (data not shown). Age of injury also
predicted SSRT in the LOW and HIGH conditions only, with longer SSRT observed in
participants who had incurred their TBIs at younger ages. Accuracy in the HIGH condition was

60
also significantly predicted by age of injury, revealing better accuracy on the go task in the
HIGH condition in those with an older age of injury. Age at injury, severity, and GCS score did
not predict percent inhibition.
Performance on any variables did not vary by GCS severity.
6 Discussion
The broadest objective of the present study was to investigate how reward affects cancellation
and restraint inhibition under comparable task demands in developmental (P-ADHD) and
acquired (S-ADHD) forms of attention disorders. In examining rewarded or unrewarded
cancellation and restraint in children and adolescents with TBI, S-ADHD, P-ADHD, and
typically developing controls, we aimed to articulate the inhibitory control profile of the four
groups. The order of task administration affected the accuracy of go responses and the
percentage of responses that were inhibited, possibly reflecting participant fatigue as the testing
session progressed. The data bear on a number of issues, but particularly how the P-ADHD and
S-ADHD groups differ and whether there are significant differences between children with TBI
with and without identifiable S-ADHD.
6.1 Group Effects
Consistent with our hypotheses and previous research (e.g., Max et al., 2005b), 18 % of
participants in the TBI group reached criteria for S-ADHD. IC in the S-ADHD group was
statistically similar to that in the other groups, but they did exhibit greater variability in go
responses. The TBI group did not differ from controls in terms of either the latency to cancel or
restrain a response, or in the percentage of responses that were inhibited on either task. In
contrast, previous studies have shown slower cancellation in children with S-ADHD than in

61
typically developing children, but similar SSRT relative to children with TBI only (who were
also impaired relative to controls; Konrad et al., 2000a, 2000b). The Konrad et al. (2000a,
2000b) studies included children who had incurred their injuries 6 months to 6 years prior to
testing, thereby including participants in the acute phase of injury who might have experienced
greater inhibition problems than those in the chronic phase of injury (Leblanc et al., 2005). Rapid
functional improvement occurs soon after a TBI, especially in severe injuries, with more gradual
recovery over the first few years post-TBI (Yeates, 2000). Performance in our TBI and S-ADHD
groups may represent some recovery of IC over time, which, if so, would have attenuated group
differences.
A direct comparison of the ADHD groups allowed us to determine whether or not P-ADHD and
S-ADHD share a similar expression of disordered behaviour. Poor inhibition performance is a
well-replicated finding in children and adolescents with P-ADHD (e.g. Schachar et al., 2007;
Willcutt, Doyle, Nigg, Faraone, & Pennington, 2005). Consistent with previous research,
participants in the P-ADHD group exhibited longer latencies to cancel and restrain their
responses, inhibited fewer responses on the restraint version (made more commission errors),
produced more variable responses to go stimuli, and were less accurate in the cancellation go
task relative to typically developing controls. The S-ADHD group did not differ significantly
from any other group in terms of cancellation or restraint inhibition. However, their performance
on the cancellation task may be thought of as ―intermediate‖ between the control, TBI, and P-
ADHD groups. That is, they exhibited statistically similar IC performance relative to the CON
and TBI groups, but they also did not differ from the most impaired group, suggesting atypical
performance in the S-ADHD group. Schachar and colleagues (2004b) revealed an IC deficit in
children with S-ADHD and a severe TBI relative to a TBI only group. Because only one
participant in the S-ADHD group had incurred a severe TBI, it remains unclear whether children

62
with more severe injuries would exhibit poorer IC compared to those with less severe injuries
and/or those with P-ADHD.
Children and adolescents who experienced TBI at a younger age had slower and more variable
responses across reward conditions and tasks. The greater burden of an earlier age at injury is
consistent with other studies of childhood TBI (e.g. Dennis, Barnes, Wilkinson, & Humphreys,
1998; Dennis, Wilkinson, Koski, & Humphreys, 1995; Ewing-Cobbs, Fletcher, Levin, Iovino, &
Miner, 1998). Compared to older children with equally severe injuries, younger children
demonstrate slower recovery of function over time and greater deficits once recovery plateaus
(Ewing-Cobbs et al., 1997; Yeates, 2000). Age at injury predicted restraint IC under conditions
of low or high reward, but did not predict restraint when no rewards were present nor did it
predict cancellation IC under any reward condition (see also Schachar et al., 2004b). Either early
injuries do not have a specific effect on inhibition, or a younger age enhances neural
compensation for damaged inhibition circuits and/or leads to an over-commitment of neural
processing resources that balances the effects of early lesions (Kramer et al., 2008; McAllister,
Sparling, Flashman, & Saykin, 2001).
In published reports, the relationship between injury severity and performance outcomes has
been contradictory: GCS scores have shown to be both predictive of (Levin et al., 2004; Levin et
al., 1993; Konrad et al., 2000a, 2000b) and unrelated to (Leblanc et al., 2005; Schachar et al.,
2004b) IC. Utilizing the conventional GCS severity coding, we also found inconsistencies in the
relationship between severity and cancellation performance, and no relationship between severity
and restraint performance. GCS scores vary over time, so the classification of an injury depends
on the timing of assessment (Yeates, 2000). Moreover, categorizing severity based on initial
GCS scores ignores injury variables such as the presence of edema, hemorrhaging, or localized
63
hematomas. Given these difficulties, we created a new severity scale that integrated injury
variables presented on pre-surgical, in-patient CT reports with GCS scores, hypothesizing that
this new scale might capture the severity of TBI better than GCS alone. Contrary to expectations,
scores derived on this new scale did not predict performance on any variable in any reward
condition, suggesting that the addition of specific injury-related variables from CT reports does
not increase the predictive power of GCS scores on behavioral performance.
6.2 Reward effects
Increases in reward improved the latency to cancel a response in all groups, and increased the
number of successfully restrained responses. This is consistent with our previous study that
showed that increasing the reward magnitude for successful inhibition improved cancellation and
restraint in typically developing children and adolescents (see Chapter 2). We extended that
previous study by showing that reward facilitated inhibitory control in children with TBI (with
and without S-ADHD) and those with P-ADHD. Reward did not alter the group differences
reported above, indicating that all groups benefited similarly from reward.
How reward facilitates IC is not completely known, but our results may allow us to make some
predictions about the brain bases of these effects. Reward may be interacting directly with the IC
system, or indirectly via a separate system that in turn influences the relationship between reward
and inhibition substrates (Padmala & Pesoa, 2010). As elaborated elsewhere (see Chapter 2), we
propose that rewards may enhance the preparation of the inhibition response via activation of the
neural pathways involving the inferior frontal gyrus (IFG) and/or the basal ganglia. The IFG has
been repeatedly implicated in cancellation and restraint (e.g., Chevrier, Noseworthy, & Schachar,
2007; Konishi, Nakajima, Uchida, Sekihara, & Miyashita, 1998; Konishi et al., 1999), and it is
thought that this neural structure is involved in a bottom-up, novelty detection system that not

64
only signals the salience of stimuli, but also feeds into regulatory systems such as working
memory to update behavioral plans once contingencies and priorities change (Chikazoe et al.,
2009; Downar, Crawley, Mikulis, & Davis 2002; Konishi et al., 1998; 1999; Smith & Jonides,
1998). The basal ganglia are important for the execution of motor responses as well as the gating
of sensorimotor information from cortical and limbic areas such that strong reward signals are
enhanced, and weak reward signals are dampened (Horvitz, 2002; Mink, 1996).
Given that reward facilitated IC in children and adolescents with TBI, the mesolimbic dopamine
system may be intact in the TBI and S-ADHD groups and interacting adaptively with the
inhibition system. Our findings are in line with previous research that also showed the beneficial
effects of rewards on IC in TBI and S-ADHD groups (Konrad et al., 2000b), and with a study
that showed that increasing the magnitude of monetary incentives improved prospective memory
in children with mild or severe TBI (McCauley, Pedroza, McDaniel, Chapman, & Levin, 2009).
In neither the present study nor the Konrad et al. (2000b) or McCauley et al. (2009) studies is it
clear whether rewards stimulated greater allocation of specific cognitive resources to increase
proficiency, or whether reinforcement simply served to increase general arousal. The former is
more likely to be correct. Relative to the CON group, the TBI group continued to exhibit greater
variability in go responses in the cancellation task and the S-ADHD group continued to exhibit
greater variability in go responses in the restraint task regardless of reward conditions.
Furthermore, MRT was unaffected by reward in both versions of the SST, which indicates that
reward did not generally increase arousal.
Rewards facilitated IC in the P-ADHD group across tasks (see also Konrad et al., 2000b). These
linear improvements in IC are consistent with previous findings that increasing the value of
reinforcement improves SSRT (Slusarek et al., 2001; Huang-Pollock et al., 2007), and that

65
children with P-ADHD make advantageous decisions with high magnitude (Luman, Oosterlaan,
Knol, & Sergeant, 2008) or high frequency (Toplack, Jain, & Tannock, 2005) reinforcement.
Children with P-ADHD may use immediate rewards to motivate, decrease distractibility, and
focus attention (Sonuga-Barke, 2002). Here, high reward did not normalize the stopping deficit
exhibited by the P-ADHD group, so either the IC deficit in P-ADHD is too profound for rewards
to significantly improve it, or children with ADHD, despite their preference for immediate
incentive, have a higher than normal reward threshold (Douglas, 1999; Haenlein & Caul, 1987;
Quay, 1997). Both hypotheses may account for the results, given both the lack of group
interaction with reward and the improvements in SSRT (cancellation) and commission errors
(restraint) with reward.
6.3 Conclusions
Developmental and acquired forms of ADHD appear to be distinct in terms of IC deficits, with
children and adolescents with P-ADHD experiencing greater difficulties with both cancellation
and restraint. Our data is in line with the idea that poor IC may be only evident in children with a
heritable form of P-ADHD (Crosbie & Schachar, 2001), and that a longer SSRT may be a
candidate endophenotype only for this specific group of children (Crosbie et al., 2009).
However, the P-ADHD group exhibited longer SSRT and less percent inhibition (restraint
version only) relative to controls, which suggests that inhibition is not entirely typical in children
with S-ADHD given the lack of significant differences between ADHD groups.
Although problems with attention are common following TBI (e.g., Slomine et al., 2005), our
data confirm that long-term inhibition deficits are different from those evident in children with P-
ADHD. Compared to the P-ADHD group, the TBI group exhibited significantly faster SSRT on
the cancellation task. Like the P-ADHD group, however, children with TBI and S-ADHD were

66
more variable in their responses to go stimuli, implying that stability of response execution is
disrupted to a similar degree in developmental and acquired disorders of attention. The
inconsistent pattern of responding in the participants with P-ADHD is in line with a number of
studies (e.g. Berwid, Kera, Marks, Santra, Bender, & Halperin, 2005; Lijffijt, Kenemans,
Verbaten, & Engeland, 2005; Schachar, Tannock, Marriott, & Logan, 1995), and may reflect
problems in sustained attention and concentration, motor timing and time estimation (Rubia, et
al., 1999; Rubia, Taylor, et al., 2001; Rubia et al., 2003) and response regulation (Rubia, Smith,
& Taylor, 2007; Sergeant et al., 1999). The exact mechanism of disruption in the TBI groups is
unknown, but because the speed of response execution did not differ between groups, slower
cognitive processing (Kalff et al., 2005) and slower motor speed (Van Meel, Oosterlaan,
Heslenfeld, & Sergeant, 2005) can be excluded as possible mediators of SDRT group
differences.
The data have some treatment implications. Stimulant medication ameliorates P-ADHD
symptoms and improves the latency of cancellation (see Dennis et al., 2008). Although stimulant
effects on attention after childhood TBI are attenuated and time-limited, children with TBI do
exhibit greater improvements in cognition relative to placebo (Jin & Schachar, 2004; Mahalick et
al., 1998). Our data suggest that stimulants may be beneficial in ameliorating the atypical
inhibition performance in children with S-ADHD, and may perhaps also aid in stabilizing the
inconsistent pattern of responses presented by this group. In children with ADHD, reward
improved both cancellation and restraint. Incentives may be a beneficial in the classroom or at
home when children with ADHD are having difficulty stopping their thoughts or actions when it
is adaptive to do so via the reduction of impulsive behaviors, which would potentially result in a
reduction of IC difficulties (Luman, Oosterlaan, & Sergeant, 2005). However, given the lack of
group by reward interaction, it seems unlikely that incentives would fully normalize this deficit.

67
Children with TBI also benefited from rewards; like typically developing controls, they may
require low levels of reinforcement to optimize inhibition.
Broadly, the methods and results in our study support the recent proposal (Levy & Ebstein,
2009) that principled and systematic comparisons of core cognitive phenotypes across disorders
inform cognitive processes, putative brain mechanisms, and treatment planning. S-ADHD as a
result of childhood TBI results in inconsistent responding to go stimuli and inhibition
performance that may be thought of as intermediate between participants with TBI and P-
ADHD. Unlike children with P-ADHD, children with S-ADHD do not show significant
difficulties with restraint and cancellation inhibition, but they may not possess the typical IC
abilities of children with TBI only. Despite similarities in clinical manifestation, S-ADHD and P-
ADHD appear to have different cognitive-behavioral phenotypes.

68
Table 3
Participant Characteristics
CON TBI S-ADHD P-ADHD
AGE AT TEST* 12.44 (3.3) 11.91 (3.4) 11.84 (2.5) 10.70 (3.2)
WASI Score* 112 (11.0) 105 (10.5) 99 (14.3) 109 (16.8)
SES Score* 52.8 (6.2) 44.1 (10.1) 44.6 (10.5) 46.2 (11.5)
HANDEDNESS (R:L) 41:3 38:2 8:1 14:5
SEX (M:F) 23:21 24:16 4:5 17:2
AGE AT INJURY* -- 8.26 (3.6) 7.22 (2.4) --
TIME SINCE INJURY* -- 3.65 (1.5) 4.62 (1.2) --
*Mean (standard deviation)

69
Table 4
Accuracy and Variability of Go Responses (Means and standard deviations)
CON TBI S-ADHD P-ADHD
ACCURACY(C) NO 97.6 (3.9) 97.6 (2.9) 97.1 (3.4) 92.7 (5.6)
LOW 97.0 (3.8) 96.7 (4.6) 95.3 (5.2) 90.0 (8.5)
HIGH 96.9 (4.0) 95.7 (6.7) 95.9 (3.8) 90.8 (6.6)
SDRT (C) NO 116.8 (34.0) 147.1 (61.0) 128.1 (45.3) 162.8 (58.7)
LOW 119.6 (34.0) 144.0 (52.5) 144.6 (51.9) 142.2 (30.2)
HIGH 121.3 (36.9) 138.7 (48.9) 131.9 (30.3) 163.1 (46.0)
ACCURACY (R) NO 96.7 (3.5) 96.2 (6.7) 93.7 (7.6) 91.6 (7.8)
LOW 95.0 (5.9) 95.9 (8.0) 95.2 (4.6) 90.8 (5.0)
HIGH 95.4 (4.3) 94.3 (9.0) 92.6 (7.0) 91.2 (6.2)
SDRT (R) NO 107.1 (40.8) 131.6 (63.4) 171.4 (67.8) 160.1 (79.9)
LOW 107.6 (47.5) 121.1 (57.8) 144.0 (51.4) 158.6 (70.3)
HIGH 108.7 (51.7) 125.8 (52.8) 147.8 (71.1) 150.2 (55.4)
Legend: Accuracy (C) = Percent correct, Cancellation Version; SDRT (C) = Standard
deviation of go reaction time, Cancellation Version; Accuracy (R) = Percent correct,
Restraint Version; SDRT (R) = Standard deviation of go reaction time, Restraint Version

70
Table 5
Regression Table: Significant Predictor: Age at Injury (all p’s <0.05)
VARIABLE B SE B β
CANCELLATION
MRT, NO -18.67 4.92 -0.519
MRT, LOW -15.05 4.68 -0.458
MRT, HIGH -14.87 5.23 -0.414
SDRT, NO -9.03 2.55 -0.493
SDRT, LOW -8.84 2.08 -0.562
SDRT, HIGH -7.91 1.78 -0.580
RESTRAINT
MRT, NO -15.74 3.95 -0.528
MRT, LOW -17.91 3.95 -0.578
MRT, HIGH -16.10 4.12 -0521
SDRT, NO -8.20 2.68 -0.432
SDRT, LOW -9.83 2.04 -0.601
SDRT, HIGH -7.66 2.22 -0.474
SSRT, LOW -9.82 3.16 -0.436
SSRT, HIGH -11.01 3.80 -0.413

71
Legend: MRT=Mean reaction time (milliseconds); SDRT=Standard deviation of go
reaction time (milliseconds); SSRT=Stop signal reaction time (milliseconds); NO=neutral
reward condition; LOW=Low reward condition; HIGH=high reward condition

72
Figure 10
Mean (SE) Percent Inhibition across Groups and Reward Conditions, Cancellation
Percent inhibition was not influenced by reward, nor was there a main effect of group.
45 50 55 60
P-ADHD
S-ADHD
TBI
CON
MEAN (SE) PERCENT INHIBITION
GR
OU
P
HIGH
LOW
NO

73
Figure 11
Mean (SE) SSRT across Groups and Reward Conditions, Cancellation
SSRT decreased with increasing reward magnitude. Participants in the P-ADHD group exhibited
slower SSRT relative to participants in the CON and TBI groups.
150 200 250 300 350 400
P-ADHD
S-ADHD
TBI
CON
Mean (SE) SSRT (ms)
GR
OU
P
HIGH
LOW
NO

74
Figure 12
Mean (SE) MRT across Groups and Reward Conditions, Cancellation
MRT did not differ between groups, nor was there a significant effect of reward
500 550 600
P-ADHD
S-ADHD
TBI
CON
Mean (SE) MRT (ms)
GR
OU
P
HIGH
LOW
NO

75
Figure 13
Mean (SE) Percent Inhibition across Groups and Reward Conditions, Restraint
Reward increased the amount of responses inhibited. The P-ADHD group exhibited significantly
more commission errors relative to the CON group.
70 80 90 100
P-ADHD
S-ADHD
TBI
CON
MEAN (SE) PERCENT INHIBITION
GR
OU
P
HIGH
LOW
NO

76
Figure 14
Mean (SE) SSRT across Groups and Reward Conditions, Restraint
Participants in the P-ADHD exhibited slower SSRT relative to participants in the CON group.
SSRT was not affected by reward.
350 400 450 500
P-ADHD
S-ADHD
TBI
CON
Mean (SE) SSRT (ms)
GR
OU
P
HIGH
LOW
NO

77
Figure 15
Mean (SE) MRT across Groups and Reward Conditions, Restraint
MRT did not vary by reward condition or by group.
450 500 550 600
P-ADHD
S-ADHD
TBI
CON
Mean (SE) MRT (ms)
GR
OU
P
HIGH
LOW
NO

78
Chapter 4 The Relationship between Multi-Informant Behavioural Ratings
and Inhibitory Control Performance on Cancellation and Restraint Tasks in Children with Traumatic Brain Injury
Common sequelae of childhood traumatic brain injury (TBI) include neuropsychological and
behavioral disorders of inhibitory control (IC; e.g., Catroppa, Anderson, Morse, Haritou, &
Rosenfeld, 2007; Dennis, Wilkinson, Koski, & Humphreys, 1995). The former include
difficulties stopping an ongoing action, IC cancellation (Leblanc et al., 2005) and restraining a
prepotent response, IC restraint (Levin, Hanten, Zhang, Swank, & Hunter, 2004). The latter
include formal diagnoses of secondary attention-deficit/hyperactivity disorder (S-ADHD). Some
15-20% of children with TBI develop these de novo symptoms of ADHD (e.g., Max et al.,
2005a, 2005b), diagnosis of which is associated with neurocognitive IC deficits (Konrad,
Gauggel, Manz, & Scholl, 2000a, 2000b; Schachar, Levin, Max, Purvis, & Chen, 2004b; see
Chapter 2). Problems with IC appear to be somewhat specific in this population: children with
chronic-stage TBI and a S-ADHD diagnosis have difficulty canceling a prepotent response but
are able to restrain a response before it is executed (Schachar et al., 2004b; see Chapter 3). This
paper is concerned with how parents, teachers, and the children themselves view IC behaviours
after TBI, as manifested as inattention, hyperactivity, and impulsivity, and with how informant
ratings of behavior are related to neurocognitive IC performance.
Parents of children with TBI rate them as inattentive, aggressive, dysexecutive, and dysregulated
(Cole et al., 2008; Mangeot, Armstrong, Colvin, Yeates, & Taylor, 2002; Sesma, Slomine, Ding,
McCarthy, & CHAT, 2008; Schachar et al., 2004b; Vriezen & Pigott, 2002; Yeates, et al., 2005).
Although parents of children with TBI also rate them as exhibiting poor metacognition (i.e.,
cognition about one’s own cognition; Mangeot, et al., 2002; Sesma et al., 2008; Vriezen &

79
Pigott, 2002), the discrepancy between parent and self-reports, which would provide insight into
the ―awareness of deficit‖, has not been examined. Further, the relationship between ―awareness
of deficit‖ following childhood TBI and neurocognitive function is also unclear. Children with
TBI overestimate their memory and learning abilities (Hanten et al., 2004), are impaired in
detecting the adequacy of their own knowledge (Dennis, Barnes, Donnelly, Wilkinson, &
Humphreys, 1996), and exhibit less post-error slowing than controls after failed inhibition trials,
suggesting impaired error monitoring (i.e., poor awareness of errors; Ornstein et al., 2009).
Retrospectively, however, they appear able to accurately evaluate their own performance
(Hanten et al., 2004).
Parent, teacher, and self-ratings have often been obtained in separate studies, so it is not clear
what each informant rates about the same child, and the degree of rating concordance is
unknown. The pattern and informant concordance of ratings for children with S-ADHD relative
to those with TBI without S-ADHD is unclear. Further, although children with developmental or
primary ADHD (P-ADHD) and children with TBI and S-ADHD have superficially similar
clinical symptoms, it is unclear how the two groups are rated across different environments. Past
studies have indicated that the performance of children with TBI on executive functioning tasks
is poorly related to parent executive function ratings (Mangeot, et al., 2002; Vriezen & Pigott,
2002), and impulsivity ratings are unrelated to impulsivity performance (Carrillo-de-la-Pena,
Otero, & Romero, 1993; see also McAuley, Chen, Goos, Schachar, & Crosbie, 2010). Perhaps
the most significant question, then, is whether informant ratings of behavior, whether concordant
or not, predict neurocognitive performance, which, in this context, should involve a theoretically
meaningful process rather than an omnibus psychometric measure, and should have both face
and ecological validity.

80
We explored a number of issues:
1. Which IC problems do parents, teachers, and the children themselves endorse in TBI, S-
ADHD, P-ADHD, and typically developing children and adolescent groups? How do
children with TBI (both with and without a S-ADHD diagnosis) differ from children with a
diagnosis of P-ADHD? How aware of their IC problems are children in each group? We
rated IC for purposes of this study with measures of inattention, impulsivity, and
hyperactivity, as well as measures of ADHD symptoms, based on the parent, teacher, and
self-report forms of the Conners 3rd
Edition Rating Scales (Conners 3; Conners, 2008).
2. What is the level of concordance for IC ratings across raters, subscales, and groups? Do
ratings vary with the rater, and with whether or not the child with TBI had diagnosed S-
ADHD?
3. How are informant ratings of IC related to neurocognitive measures of withholding and
stopping a response as measured by the restraint and cancellation versions of the stop signal
task (SST; Schachar et al., 2007)?
7 Method
7.1 Participants
Participants included children and adolescents aged 7 to 17. A brief interview was conducted
with each participant’s parent during an initial recruitment phone call to collect demographic
information and ensure eligibility for participation. Participants in the control (CON) group were
excluded if they had a reported history of P-ADHD, TBI, neurological or psychiatric disorders,
mental retardation, learning disabilities, and sensory or motor impairments. Exclusion criteria for
TBI and P-ADHD groups included the presence of a severe psychiatric disorder (e.g. psychosis),
mental retardation, and sensory or motor impairments. Participants with Wechsler Abbreviated

81
Scale of Intelligence (WASI) Full Scale IQ scores under 75 were excluded. The Hollingshead
Four-Factor Index of socioeconomic status (SES; Hollingshead, 1975) was calculated from
information about parental education and occupation. Family SES scores were calculated by
averaging the SES scores of both parents (or from one parent, when this was the only
information available).
Sixty-six typically developing children and adolescents were recruited into the CON group
through flyers and community advertisements. Thirteen participants were excluded based on
clinically significant elevations on the Conners 3 rating scales (see below), and 9 participants
cancelled or missed their appointments. The final CON group consisted of 44 participants (21
female, 23 male; mean age, 12.44 years).
Participants in the TBI group (n=63) were recruited through trauma registries at the Hospital for
Sick Children in Toronto. Because IC and other cognitive problems abate with increasing time
since injury (Leblanc et al., 2005) while ratings of adaptive behaviors remain stable or increase
with time (Sesma et al., 2008; Taylor et al., 2002), all children were all in the chronic phase of a
single TBI and had had no pre-injury neurological disorders. Inclusion criteria included the
presence of a non-inflicted, non-penetrating TBI that occurred 1 to 6 years prior to assessment
and hospitalization for the TBI for at least one night. Ten participants cancelled or missed
appointments, and 4 were excluded due to parental reports of a pre-injury P-ADHD diagnosis,
resulting in a TBI group of 49 participants (21 female, 28 male; mean age, 11.89 years; mean age
of injury, 8.07 years). Severity of injury was based on initial post-resuscitation Glasgow Coma
Scale (GCS) scores (Teasdale & Jennet, 1974), separating participants into those with mild
(n=28), moderate (n=6), and severe (n=16) injuries.
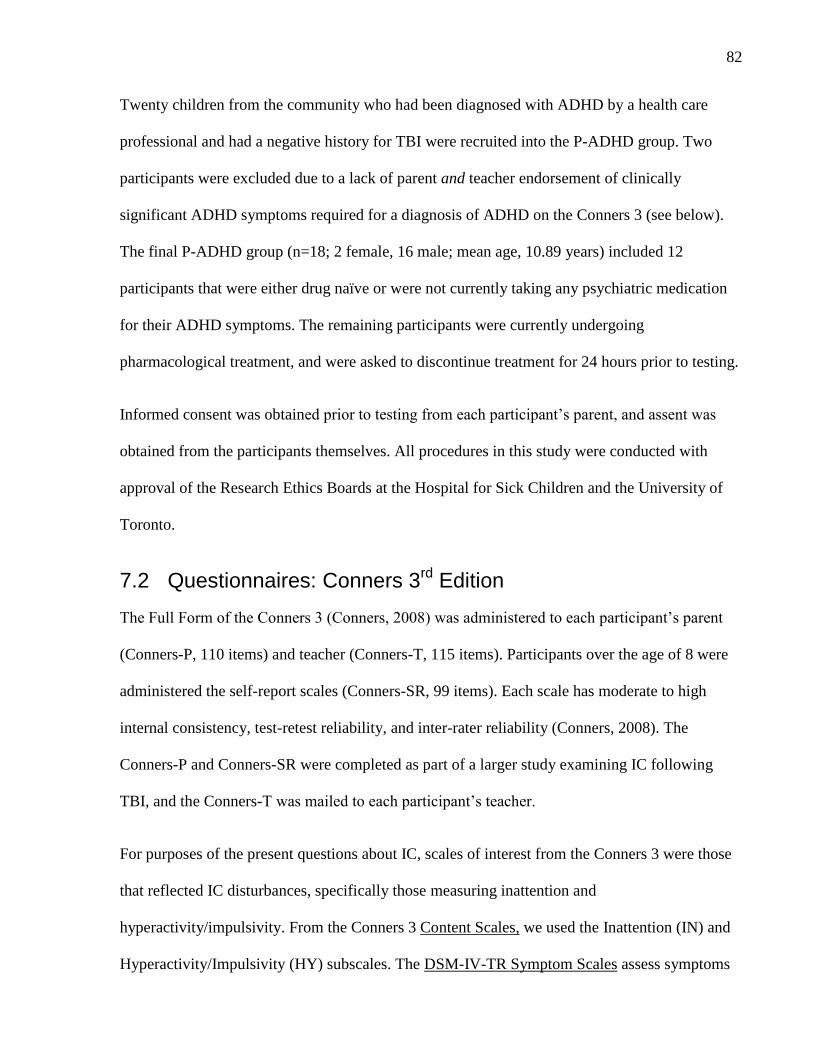
82
Twenty children from the community who had been diagnosed with ADHD by a health care
professional and had a negative history for TBI were recruited into the P-ADHD group. Two
participants were excluded due to a lack of parent and teacher endorsement of clinically
significant ADHD symptoms required for a diagnosis of ADHD on the Conners 3 (see below).
The final P-ADHD group (n=18; 2 female, 16 male; mean age, 10.89 years) included 12
participants that were either drug naïve or were not currently taking any psychiatric medication
for their ADHD symptoms. The remaining participants were currently undergoing
pharmacological treatment, and were asked to discontinue treatment for 24 hours prior to testing.
Informed consent was obtained prior to testing from each participant’s parent, and assent was
obtained from the participants themselves. All procedures in this study were conducted with
approval of the Research Ethics Boards at the Hospital for Sick Children and the University of
Toronto.
7.2 Questionnaires: Conners 3rd
Edition
The Full Form of the Conners 3 (Conners, 2008) was administered to each participant’s parent
(Conners-P, 110 items) and teacher (Conners-T, 115 items). Participants over the age of 8 were
administered the self-report scales (Conners-SR, 99 items). Each scale has moderate to high
internal consistency, test-retest reliability, and inter-rater reliability (Conners, 2008). The
Conners-P and Conners-SR were completed as part of a larger study examining IC following
TBI, and the Conners-T was mailed to each participant’s teacher.
For purposes of the present questions about IC, scales of interest from the Conners 3 were those
that reflected IC disturbances, specifically those measuring inattention and
hyperactivity/impulsivity. From the Conners 3 Content Scales, we used the Inattention (IN) and
Hyperactivity/Impulsivity (HY) subscales. The DSM-IV-TR Symptom Scales assess symptoms

83
associated with ADHD, so we examined ratings from the ADHD inattentive (DSM-AN) and the
ADHD hyperactive/impulsive (DSM-AH) subscales. Raw scores on each Content and DSM-IV-
TR Symptom subscales were converted into T-scores, adjusted for each participant’s age and
sex. All T-scores have a mean of 50, with a standard deviation (SD) of 10. T-scores greater than
1.5 SD above the mean (i.e., over 65) are considered to be elevated for age and sex (Conners,
2008). The Conners 3 also includes DSM-IV-TR Symptom Counts for all ADHD subtypes
(inattentive, hyperactive/impulsive, and combined subtypes). Symptom Counts represent the
explicit DSM-IV-TR symptoms required for a diagnosis of either subtype.
Thirteen participants in the CON group exhibited elevated T-Scores on the DSM-IV-TR
Symptom Scales and met criteria for a disorder on the DSM-IV-TR Symptom Counts, thus were
excluded from further analyses. Two participants were excluded from the P-ADHD group due to
the absence of parent and teacher ratings of significant ADHD symptoms that are required for an
ADHD diagnosis.
The Conners 3 was also used to identify children in the TBI group who reached criteria for S-
ADHD. These participants met criteria for inclusion into the TBI group, had no diagnosed P-
ADHD prior to the TBI, and had met diagnostic criteria for ADHD (any subtype) on the
Conners-P and/or Conners-T. Because it is not clear if the DSM criteria for P-ADHD are
necessary for the classification of participants as S-ADHD, and because age at onset of any S-
ADHD can be no earlier than the age at TBI, we waived the age requirement for diagnosis as
well as the requirement that ADHD symptoms must be present in at least 2 environments
(American Psychological Association, 2000). Nine participants in the TBI group without
evidence of pre-injury P-ADHD met criteria for S-ADHD through parent and/or teacher ratings
(S-ADHD group, 5 female, 4 male; mean age, 11.84 years; mean age at injury, 7.22 years), and

84
40 participants without evidence of ADHD on the Conners 3 remained in the TBI group (16
female, 24 male; mean age, 11.91 years; mean age at injury, 8.26 years).
7.3 Neurocognitive testing: Stop Signal Tasks
The SST is an IC task based on a formal model conceptualizing performance as a race between
―go‖ and ―stop‖ processes (Logan & Cowan, 1984; Logan, 1994; Verbruggen & Logan, 2008).
These processes ―race‖ against each other and the process that ―wins‖ the race determines the
outcome (i.e., response execution or inhibition; Logan & Cowan, 1984; Logan, 1994). The race
model allows for the measurement of the latency of IC (i.e., the stop signal reaction time, SSRT),
which is an unobservable, internally generated act of control (Logan, 1994). Figure 16 shows a
cartoon of the cancellation and restraint versions of the SST utilized in the present study (Logan,
1994; Schachar et al., 2007). Both versions consist of a primary visual choice reaction time task
involving a go signal and a secondary task involving a stop signal that indicated the need to
inhibit a response (Logan & Cowan, 1984; Logan, 1994). In the cancellation version, the stop
signal was presented after a delay following the go signal in order to interrupt an already
executed response, and was varied dynamically to ensure inhibition on approximately 50% of the
stop trials. In the restraint version of the task, the stop signal was presented concurrently with the
go signal to prevent a response from being executed (Schachar et al., 2007).
The latency to inhibit a response (SSRT) on both versions of the SST was determined via the
integration procedure (Logan, 1994). First, the go reaction times in non-stop signal trials were
rank ordered, and the go reaction time that corresponded to the probability of inhibition was
determined. The SSRT was estimated by subtracting the mean delay from this new ―integrated
go reaction time.‖ Participant data from the SST were excluded if there was less than 66%
accuracy on go trials, mean go reaction time (MRT) was less than 100 milliseconds, or percent

85
inhibition was less than 12.5% or greater than 87 % (for the cancellation version; only Schachar
et al., 2004; Shuster & Toplak, 2009). Based on these criteria, 3 participants were excluded from
analyses of cancellation data (n=2, TBI; n=1, P-ADHD), and 2 participants were excluded from
restraint analyses (n=1, CON; n=1, P-ADHD).
7.4 Statistical Analyses
Age of injury, time since injury (for TBI and S-ADHD groups), age at test, WASI scores, and
SES scores were compared between groups utilizing an analysis of variance (ANOVA) with
group (CON, TBI, P-ADHD, S-ADHD) as the between subjects variable.
Ratings that met criteria for inconsistent responding on the Inconsistency Index of the Conners 3
were considered invalid and were subsequently excluded from future analyses. Group differences
in ratings were analyzed separately for each scale using ANOVAs with SES as a covariate.
Because we used parent and teacher ratings to define the S-ADHD group, confirm the inclusion
of participants in the P-ADHD group, and exclude participants in the CON group with clinically
significant elevations, making comparisons across all four groups on these scales would not be
meaningful. Instead, we limited the comparison between groups on the Conners-P and Conners-
T to the following: CON vs. all groups; TBI vs. P-ADHD; S-ADHD vs. P-ADHD. Pearson
correlations were conducted to explore associations between rating scales, the relationship
between SST performance and ratings, and the relationship between SST performance and the
number of ADHD symptoms.
For each subscale, the discrepancy between raters was obtained by calculating the difference
score between two raters (e.g., subtracting the IN T-score on the Conners-P from the IN T-score
on the Conners-T). Negative or positive scores indicated that one rater rated a participant more
negatively or more positively than another. Group differences in discrepancy scores were

86
examined with separate ANOVAs for each discrepancy rating, with SES as a covariate and
group as the between-subjects factor. Concordance in discrepancy ratings was defined as scores
within 1 SD of the mean of each subscale discrepancy rating. We also rated each discrepancy
rating on a binary scale that indicated whether or not each rating for each participant was
concordant or not (i.e., whether it fell within 1 SD of the mean). We analyzed this concordance
data with a series of non-parametric Kruskal-Wallis tests, and post-hoc analyses were conducted
with separate Mann-Whitney U tests with the alpha level adjusted to 0.008 to adjust for multiple
group comparisons.
Group differences in SST performance were conducted with separate ANOVAs with group and
order of task administration (cancellation first, cancellation second) as between-subjects
variables, and age as a covariate. Stepwise linear regression analyses were conducted to examine
the diagnostic utility of inhibition measures on the SST. We examined whether or not SSRT and
percent inhibition (restraint only) predicted parent, teacher, and/or concordance of parent and
teacher classification of ADHD subtypes on the DSM-IV-TR Symptom Counts. Percent
inhibition from the cancellation data was not entered as a predictor because the tracking
algorithm was designed to limit the probability of inhibition to approximately 0.5. Severity of
injury was unrelated to ratings by any informant, or to performance on the SST (data not shown),
so will not be discussed further.
8 Results
8.1 Participant Characteristics
Participant characteristics are presented in Table 6. Age at assessment did not differ between
groups, and age of injury and time since injury was similar between the TBI and S-ADHD
groups. IQ scores differed between groups (F(3, 109)=4.207, p=0.007), but all mean scores were
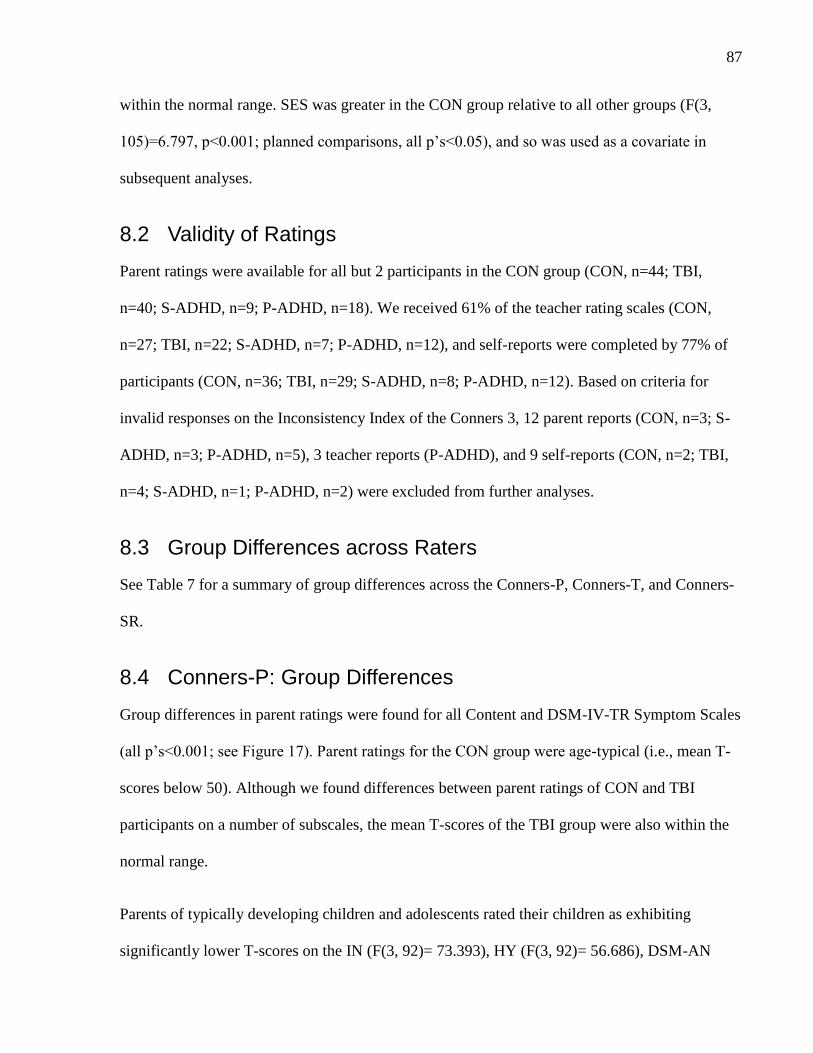
87
within the normal range. SES was greater in the CON group relative to all other groups (F(3,
105)=6.797, p<0.001; planned comparisons, all p’s<0.05), and so was used as a covariate in
subsequent analyses.
8.2 Validity of Ratings
Parent ratings were available for all but 2 participants in the CON group (CON, n=44; TBI,
n=40; S-ADHD, n=9; P-ADHD, n=18). We received 61% of the teacher rating scales (CON,
n=27; TBI, n=22; S-ADHD, n=7; P-ADHD, n=12), and self-reports were completed by 77% of
participants (CON, n=36; TBI, n=29; S-ADHD, n=8; P-ADHD, n=12). Based on criteria for
invalid responses on the Inconsistency Index of the Conners 3, 12 parent reports (CON, n=3; S-
ADHD, n=3; P-ADHD, n=5), 3 teacher reports (P-ADHD), and 9 self-reports (CON, n=2; TBI,
n=4; S-ADHD, n=1; P-ADHD, n=2) were excluded from further analyses.
8.3 Group Differences across Raters
See Table 7 for a summary of group differences across the Conners-P, Conners-T, and Conners-
SR.
8.4 Conners-P: Group Differences
Group differences in parent ratings were found for all Content and DSM-IV-TR Symptom Scales
(all p’s<0.001; see Figure 17). Parent ratings for the CON group were age-typical (i.e., mean T-
scores below 50). Although we found differences between parent ratings of CON and TBI
participants on a number of subscales, the mean T-scores of the TBI group were also within the
normal range.
Parents of typically developing children and adolescents rated their children as exhibiting
significantly lower T-scores on the IN (F(3, 92)= 73.393), HY (F(3, 92)= 56.686), DSM-AN

88
(F(3, 92)=74.093), and DSM-AH (F(3, 92)=50.03) subscales compared to the clinical groups. In
addition, parent ratings of TBI participants were lower on all subscales compared to the P-
ADHD group. Parent ratings were generally similar in the two ADHD groups, except for the IN
subscale where participants with P-ADHD were rated as exhibiting greater impairments than the
S-ADHD group.
8.5 Conners-T: Group Differences
Teacher ratings differed significantly between groups on Content and DSM-IV-TR Symptom
Scales (all p’s<0.001; see Figure 18). No differences were found between CON and TBI teacher
ratings on any subscale, and all teacher ratings of these participants were within the normal
range. Teachers rated participants in the CON and TBI groups as exhibiting significantly lower
scores on the IN (F(3, 56)=17.703), HY (F(3, 56)=21.56) and DSM-AH (F(3, 56)=20.343)
subscales relative to the ADHD groups. Greater impairments on the DSM-AN (F(3, 56)=21.685)
subscale were found for the P-ADHD group compared to the other groups. The two ADHD
groups were rated similarly on the IN, HY, and DSM-AH subscales.
8.6 Conners-SR: Group Differences
Typically developing children yielded self-report measures within the normal range (see Figure
19). Despite differences in self-report measures between the CON and TBI group on a number of
subscales, T-scores on all scales were within the normal range for the TBI group. Moreover, no
group rated itself with difficulties (i.e. no mean T-scores were above 65) in any domain. Groups
rated themselves similarly on the HY and DSM-AH subscales. The CON group rated themselves
as having fewer difficulties on the IN (F(3, 67)=4.585, p=0.006) and DSM-AN (F(3, 67)=5.072,
p=0.003) subscales than any of the other groups.

89
8.7 Concordance between the Conners-P and Conners-T
Significant correlations were found between parent and teacher ratings on all Content and DSM-
IV-TR Symptom Scales. Following correction for attenuation, all subscales yielded medium to
large correlations between raters: IN, r=0.681; HY, r=0.694; DSM-AN, and r=0.672; DSM-AH,
r=0.710. These data indicate fair, although not perfect, agreement between parent and teacher
ratings of behavior.
Parent-teacher discrepancy scores across subscales were analyzed to further investigate
concordance between raters (see Table 8). Negative scores specify that teachers endorsed a
greater number of difficulties, whereas positive scores indicate that parents reported more
difficulties. All discrepancy measures for the CON group were within 1 SD of the mean for all
subscales, suggesting considerable concordance between teachers and parents. Concordance was
also found for discrepancy ratings in the TBI, S-ADHD, and P-ADHD groups. Significant group
differences between discrepancy ratings were found for the IN (F(3, 56)=3.210, p=0.03), HY
(F(3, 56)=4.114, p=0.011), and DSM-AH (F(3, 56)=5.238, p=0.003) subscales, with marginal
significance for the DSM-AN (F(3, 56)=2.747, p=0.052) subscale. Parents identified more
problems than teachers (there were more positive discrepancy scores) in the TBI and P-ADHD
groups compared to the CON group discrepancy scores.
We also assigned a rating to each subscale depending on whether or not parents and teachers met
concordance (i.e., scores within 1 SD of the mean), with a 1 indicating concordance, and 0
indicating non-concordance. We then analyzed group differences utilizing a Kruskal-Wallis test,
and significant findings were further analyzed utilizing Mann-Whitney U tests with α levels
adjusted to 0.008 to adjust for multiple group comparisons. No significant group differences
were found for any subscale.

90
8.8 Concordance between Conners-P and Conners-SR
Significant correlations were found between parent and self-report ratings on both Content
Scales and the only significant correlation found on the DSM-IV-TR Symptom Scales was for
DSM-AN. Following correction for attenuation, significant correlations were: IN, r=0.423; HY,
r=0.303; and DSM-AN, r=0.441. These findings suggest modest agreement between parent and
self-report ratings of a subset of behaviors assessed.
Table 9 displays the parent-self-report discrepancy scores. Concordance between parent and self-
reports across all scales were found for the CON and TBI groups. Both ADHD groups were rated
by their parents as exhibiting more disturbances on the Conners 3 relative to self-report ratings.
Parent and self-report ratings in the P-ADHD group were not concordant. In the S-ADHD group,
concordance was found only for the inattention subscales. Significant group differences were
found for all subscales (IN: F(3, 64)=12.822, P<0.001, HY: F(3, 64)=15.319, p<0.001, DSM-
AN: F(3, 64)=17.762, p<0.001, DSM-AH: F(3, 63)=12.495, p<0.001). Planned comparisons
revealed more positive discrepancy scores (i.e., greater impairments reported by parents) in the
P-ADHD and S-ADHD groups relative to both the CON and TBI groups in subscales assessing
inattention (IN and DSM-AN) and hyperactivity/impulsivity (HY and DSM-AH). The P-ADHD
group exhibited more positive discrepancy scores relative to the S-ADHD group on scales
measuring inattention (IN and DSM-AN).
Significant group differences in concordance ratings were found for the IN (2=8.290, df=3,
p=0.034), HY (2=20.494, df=3, p<0.001), DSM-AN (
2=12.114, df=3, p=0.006), and DSM-AH
(2=11.666, df=3, p=0.007) subscales. Post-hoc tests revealed differences between the CON and
P-ADHD groups on the IN (U=36.5, p=0.004), HY (U=12.0, p<0.001), DSM-AN (U=30.5,
p=0.001), and DSM-AH (U=33.5, p=0.002) subscales. The TBI group differed from the P-

91
ADHD group on the HY (U=21.0, p=0.001) and DSM-AN (U=31.0, p=0.006) subscales. No
other significant differences were found. In brief, the P-ADHD group exhibited poorer
concordance on ratings of inattention and hyperactivity/impulsivity relative to the CON and TBI
groups.
8.9 Concordance between Conners-T and Conners-SR
No significant correlations were found between teacher and self-report ratings on any Content or
DSM-IV-TR Symptom Scales. Table 10 displays the teacher-self-report discrepancy scores.
Concordance was found for all discrepancy scores in the CON group. Concordance was found
across all subscales for the TBI group. In the S-ADHD group, concordance was found for all
scales with the exception of hyperactivity/impulsivity ratings (HY and DSM-AH), and near-
perfect concordance was reached on ratings of DSM symptoms of inattention. In the P-ADHD
group, there was concordance across all subscales except for the DSM-AN scale.
Significant group differences between discrepancy ratings were found for the HY (F(3,
37)=3.848, p=0.017), DSM-AN (F(3, 27)=3.715, p=0.02), and DSM-AH (F(3, 37)=3.247,
p=0.033) subscales. Planned comparisons revealed less positive discrepancy scores in the CON
and TBI groups relative to the S-ADHD group on the HY and DSM-AH subscales, and relative
to the P-ADHD group on the DSM-AN subscale.
Concordance analyses (Kruskal-Wallis tests) were significant for the DSM-AN (2=7.469, df=3,
p=0.50) subscale, yet post-hoc tests did not reveal significant differences between groups at the
adjusted alpha level.
A summary of group differences in discrepancy measures is presented in Table 11.

92
8.10 IC Performance: Cancellation and Restraint
8.10.1 Cancellation
The tracking algorithm successfully limited the probability of inhibition to approximately 0.5
across groups. There was a significant group effect on SSRT (F(3, 100)2.858, p=0.041). Planned
comparisons revealed that the P-ADHD group exhibited longer SSRT relative to participants in
the TBI (p=0.026) and CON (p=0.005) groups. The S-ADHD group did not differ from any other
group, suggesting intermediate SSRT performance in this group across the task. MRT was
similar between groups, and there were no task order effects.
8.10.2 Restraint
Inhibition measures did not differ between groups, but planned comparisons revealed marginal
differences in SSRT between CON and P-ADHD groups (p=0.051), suggesting poorer restraint
performance in the P-ADHD group relative to typically developing children. There were no
group differences in MRT. Task order did not alter SSRT, percent inhibition, or MRT.
8.11 Relationship between SST Performance and Conners 3 Ratings
The relationship between rating scales and SST performance are presented in Table 12. In the
CON group, significant correlations were: SSRT in cancellation and Conners-T ratings of IN,
HY, DSM-AN, and DSM-AH; percent inhibition in restraint and Conners-T ratings of IN, HY,
DSM-AN, and DSM-AH; MRT in cancellation and Conners-SR ratings of HY and DSM-AH;
SSRT in restraint and Conners-SR ratings of HY and DSM-AH. Significant correlations in the
TBI group were: percent inhibition in restraint and Conners-P ratings of HY; percent inhibition
in restraint and Conners-SR ratings of IN. In the P-ADHD group, significant correlations were:
percent inhibition in restraint and Conners-P ratings of IN; SSRT in restraint and Conners-P

93
ratings of DSM-AN; MRT in cancellation and Conners-T ratings of HY and DSM-AH; SSRT in
cancellation and restraint and Conners-T ratings of HY and DSM-AH.
8.12 Relationship between the number of ADHD Symptoms and IC Performance
8.12.1 Cancellation
Significant correlations were found between SSRT and the number of Conners-P inattentive
(r=0.265, p=0.048) and hyperactive/impulsive symptoms (r=0.316, p=0.018). SSRT was
significantly correlated with Conners-T inattentive (r=0.335, p-0.043) and hyperactive/impulsive
symptoms (r=0.323, p=0.051). Conners-SR ADHD symptoms were uncorrelated with SSRT.
8.12.2 Restraint
Percent inhibition was significantly correlated with the number of Conners-P
hyperactive/impulsive symptoms (r=-0.268, p=0.042). Conners-T and Conners-SR ADHD
symptoms were uncorrelated with SSRT.
8.13 Is IC performance related to ADHD status?
Regression analyses were performed to examine whether neurocognitive IC performance
predicted rater classification into ADHD subtypes. Thus cancellation and restraint inhibition
(SSRT and percent inhibition) were entered as potential predictors of parent, teacher, or self-
report classification of participants into the ADHD inattentive, hyperactive/inattentive, or
combined subtypes on the DSM-IV-TR Symptom Counts. We conducted separate linear
stepwise regression analyses for each type of rating scale.

94
8.13.1 Cancellation
Table 13 displays the results from the regression analyses for cancellation. SSRT significantly
predicted parent classification of ADHD, inattentive (r2=0.056, p=0.015), hyperactive/impulsive
(r2=0.056, p=0.015), and combined (r
2=0.082, p=0.003) subtypes. SSRT also predicted teacher
classifications of ADHD, inattentive (r2=0.170, p=0.001), hyperactive/impulsive (r
2=0.075,
p=0.027), and combined (r2=0.071, p=0.032) subtypes. No inhibition variable predicted self-
report classification into any ADHD subtype.
8.13.2 Restraint
Table 13 displays the regression results for restraint. Neither SSRT nor percent inhibition on the
restraint task significantly predicted parent classification of ADHD inattentive or
hyperactive/impulsive subtype. Percent inhibition significantly predicted parent classification of
ADHD, combined subtype (r2=0.040, p=0.036). Restraint inhibition predicted teacher ADHD
classification: percent inhibition predicted ADHD, inattentive subtype (r2=0.134, p=0.002), and
SSRT predicted ADHD, hyperactive/impulsive (r2=0.059, p=0.049) and combined (r
2=0.066,
p=0.038) subtypes. No inhibition variable predicted self-report classification into any ADHD
subtype.
8.14 Agreement between Parent and Teacher Ratings and SST Performance
Linear regression analyses were conducted to examine if IC performance predicted parent and
teacher agreement of classification of participants into ADHD subtypes. Agreement between
parent and teacher ratings was defined as both raters identifying each participant as 1) meeting
criteria for inattentive or hyperactive/impulsive or combined ADHD subtype or 2) not meeting
criteria for any ADHD subtype. SSRT for both tasks and percent inhibition from the restraint

95
task were entered into regression analyses as potential predictors, with separate analyses run for
cancellation and restraint. Agreement between raters in classifying children and adolescents as
meeting criteria for ADHD, combined subtype was significantly predicted by SSRT in the
cancellation task (r2=0.020, p=0.052). No other IC measures were significant predictors of
agreement of classification.
9 Discussion
This paper addresses three issues about IC that concerned how it is rated behaviorally by
multiple informants (parent, teacher, and self), the concordance of ratings across raters, and the
relation of neurocognitive cancellation IC and restraint IC performance to informant ratings of
IC behavior. The purpose of the paper was to understand more about IC following childhood
TBI; in particular, to delineate similarities and differences in IC within and between four groups:
children with TBI, children with TBI and S-ADHD, children with P-ADHD, and a typically
developing control group. The data bear on a number of issues: Parent and teacher IC profiles;
rating concordance; self-report IC profile, which informs the level of awareness of deficits in
children with TBI; the relation between IC ratings and cancellation and restraint; the diagnostic
utility of neurocognitive IC performance for ADHD ratings; and key differences between
primary and secondary forms of ADHD.
9.1 Parent and teacher IC profiles
Parents and teachers of children with ADHD rated them as inattentive, hyperactive, and
impulsive. A diagnosis of S-ADHD following TBI, not TBI alone, increases the identification of
IC problems by parents and teachers. Our data extend previous work on IC ratings in childhood
TBI. Although Yeates and colleagues (2005) showed that parent ratings of attention problems
and ADHD symptoms were greater for participants with TBI relative to non-head injured

96
controls, the TBI group was not divided into those with and without S-ADHD, so group
differences may reflect inclusion of children with clinically significant symptoms. Indeed,
children with S-ADHD exhibit more attentional difficulties than children with TBI without
ADHD (Slomine, Salorio, Grados, Vasa, Christensen, & Gerring, 2005).
The absence of significant ADHD symptoms in the TBI group implies that these participants are
behaving normally and/or that any acute IC impairment is now attenuated. By 2 years post-
injury, performance measures of inattention and impulsiveness improve (Wassenberg, Max,
Lindgen, & Schatz, 2004) and normal IC performance is achieved (Leblanc et al., 2005), despite
the presence of deficits in the acute phase of injury. A proposed ―recovery of function‖ in the
TBI group might be associated with atypical activity in neural circuits that support behaviour.
For example, children with TBI exhibit similar attention performance and activate the same
neural networks subserving attention as non-head injured controls, but exhibit hyperactivation in
the same areas (Kramer et al., 2008). According to McAllister and colleagues (2001), putative
brain mechanisms may include compensation or greater activation of neural resources due to
effortful processing, or an over-commitment of neural resources that does not alter performance
but improves subtle deficits that have occurred as a result of the TBI (McAllister, Sparling,
Flashman, & Saykin, 2001).
Despite elevated IC ratings by parents and teachers for both ADHD groups, the rating profiles
were not identical in the two groups. The groups differed in terms of parent ratings of inattention
on the Content Scales and teacher ratings of inattention on the DSM-IV-TR Symptom Scale,
with greater difficulties identified in children with P-ADHD. This finding is surprising given that
the inattentive ADHD subtype predominates in S-ADHD (Levin, Hanten, Max, Li, Swank,
Ewing-Cobbs, et al., 2007; Max et al., 2005a; 2005b) and that the most common behavioral

97
problem endorsed by parents and teachers of children with S-ADHD is a short attention span
(Schachar et al., 2004b). Moreover, hyperactive symptoms in children with S-ADHD tend to
decline over the first few years following TBI (Levin et al., 2007), suggesting that hyperactivity
is generally more characteristic of P-ADHD than of S-ADHD. Of the 9 participants, 4 met
criteria for the Inattentive subtype, 4 met criteria for the Hyperactive/Impulsive subtype, and 2
met criteria for ADHD Combined subtype, so this conclusion should be tempered by the
relatively small sample size in the S-ADHD group. Although teachers and parents flag ADHD
rather than TBI, primary and secondary forms of ADHD are rated differently, suggesting that at
some level these disorders are recognized as being phenotypically distinct in real-world contexts.
9.2 Rating concordance
Parents and teachers showed moderate to high agreement, suggesting that these informants
reliably identified similar behaviors in children and adolescents. These data are consistent with
previous work that showed high correlations between teacher and parent S-ADHD ratings
(Schachar et al., 2004b). In contrast, concordance between ratings of ADHD symptoms in
children with P-ADHD have exhibited only partial or modest agreement (i.e., low to medium
correlations; DuPaul, Ervin, Hook, & McGoey, 1998; Hartman, Rhee, Willcutt, & Pennington,
2007; Malhi, Singhi, & Sidhu, 2008; Murray et al., 2007; Sprafkin, Gadow, Salisbury, Schneider,
& Loney, 2002; Sullivan & Riccio, 2007; Willcutt, Hartung, Lahey, Loney, & Pelham, 1999),
which may be related to the situational specificity of ADHD symptoms, or the fact that parents
and teachers observe different but equally valid behaviors (Gomez, 2007; Hartman et al., 2007).
Classroom observations may represent a more rule-governed ecology than observations made at
home, resulting in more ADHD behaviors displayed in the home environment.

98
9.3 Self-report IC profile
Generally, there was poor agreement between child and others’ perception of the child’s
behavior. This implies that declarative knowledge about one’s own cognitive and behavioral
(dis)abilities, or metacognitive knowledge, is still relative immature in our sample of participants
aged 7-17 years old. Metacognitive knowledge interacts with other processes such as
metacognitive monitoring, or the conscious awareness and online evaluation of thoughts and
behaviors, and metacognitive control, or the self-regulation and adjustment of cognition and
behavior (Mazzoni & Nelson, 1998; Toglia & Kirk, 2000). Overall competence in each of these
domains increases with age (Schneider, Vise, Lockl, & Nelson, 2000) and is associated with
increased competence in other aspects of cognition (see Hanten et al., 2004).
Adults with TBI do not always acknowledge injury-related deficits (Hart, Whyte, Kim, &
Vaccaro, 2005; O’Keeffe, Dockree, Moloney, Carton, & Robertson, 2007; Vanderploeg,
Belanger, Duchnick, & Curtiss, 2007; Spatt, Zebenholzer & Oder, 1997). We present new
evidence that children with TBI in the chronic phase of recovery exhibit ―awareness‖ of their
behaviors. To be sure, the TBI group performed normally on the Conners 3 subscales. It may be
that these children experienced ―unawareness‖ in the acute phase of injury, but this has since
recovered with time since injury, which would be consistent with findings from the adult TBI
literature (Hart et al., 2009; Lanham, Weissenburger, Schwab, & Rosner, 2000; Powell,
Machamer, Temkin, Dikmen, 2001; Vanderploeg et al., 2007).
In the S-ADHD group, correlations between parent and self-report ratings were small, and
concordance was found only for subscales that measured inattention. Relative to self-report
ratings, parents endorsed a greater number of ADHD symptoms in the S-ADHD group. Thus,
children with S-ADHD exhibit ―unawareness‖ of deficits that are diagnostic of the disorder, in

99
particular for hyperactive/impulsive behaviours. This parallels what is observed in adults with
TBI, who exhibit poor awareness for behavioral and affective difficulties (Bivona et al., 2008;
Hart, Sherer, Whyte, Polansky, & Novack, 2004; Hart et al., 2009; Sherer et al., 1998). Although
acknowledgement of deficits is not always predictive of better outcomes (Bach & David, 2006),
poor self-awareness in TBI populations has been linked to poor rehabilitation and adaptive
outcomes, occupational and relational difficulties, increased maladaptive behaviour, and greater
family distress (Prigatano, Borgaro, Baker, & Wethe, 2005; Sherer et al., 1998; Trudel et al.,
1998; Wise et al., 2005). We did not directly assess these measures here, but note that the
development of S-ADHD is associated with high psychosocial adversity, and poor adaptive and
family functioning (Gerring et al., 1998; Max et al., 2004; Max et al., 2005b).
Crosson and colleagues (Crosson et al., 1989) have proposed a hierarchical approach to
awareness of deficits: emergent awareness, or the ability to detect cognitive and behavioural
deficits as they occur; intellectual awareness, which is similar to metacognitive knowledge; and
anticipatory awareness, or predicting when problems will occur as a result of one’s own deficits.
Previous data has shown that children with TBI are impaired in emergent awareness or
metacognitive monitoring as evidenced by an error monitoring deficit on the SST (Ornstein et
al., 2009); that they overestimate their abilities and competencies is consistent with deficits in
anticipatory awareness (Hanten et al., 2004). We add to this knowledge base in the present study
by showing that metacognitive knowledge is impaired in a subset of children with TBI who also
have S-ADHD. Our data suggest the presence of a monitoring deficit that may be due to an
inability to accurately integrate self-knowledge with self-monitoring (Hanten et al., 2004), and
implies a relationship between poor awareness of behaviors in everyday life with ecologically
valid laboratory-based tasks.

100
Children in the P-ADHD group also exhibited little awareness of deficits, and their ratings
correlated poorly with those of parents and teachers, in agreement with studies that showed that
children with P-ADHD report fewer hyperactive/impulsive symptoms and oppositional
behaviors relative to parents and teachers (Loeber, Green, Lahey, Stouthamer-Loeber, 1991) and
display poor awareness of IC performance on the SST (Stevens, Quittner, Zuckerman, & Moore,
2002). Deficits in metacognitive knowledge may coincide with difficulties that children with P-
ADHD have with metacognitive monitoring and control on the SST (Schachar et al., 2004a).
In sum, discrepancy analyses revealed that children with TBI without S-ADHD did not exhibit
―unawareness of deficits‖, but children with S-ADHD failed to identify a number of problematic
behaviors that parents and teachers flagged. The implication of these results is that multi-
informant ratings can be used to accurately assess the behaviour of children with TBI across
contexts, and ―unawareness of deficits‖ is a symptom of S-ADHD (and P-ADHD) but not
childhood TBI in general.
9.4 Relationship between Multi-Informant Ratings and Inhibitory Control Performance
Cancellation and restraint are fundamentally different forms of IC. Each follows a distinct
developmental trajectory (Williams, Ponesse, Schachar, Logan, & Tannock, 1999; Johnstone et
al., 2007) and is depends on separate, but overlapping neural systems involving the prefrontal
cortex and basal ganglia (e.g., Chevrier, Noseworthy, & Schachar, 2007; Kelly et al., 2004;
Konishi, Nakajima, Uchida, Sekihara, & Miyashita, 1998; Konishi et al., 1999). Slower SSRT in
the cancellation task is a well-documented deficit in children with P-ADHD (see Willcutt, Doyle,
Nigg, Faraone, & Pennington, 2005) and is thought to reflect frontostriatal dysfunction (e.g.,
Aron & Poldrack, 2005; Kieling, Goncalves, Tannock, & Castellanos, 2008). Compared to

101
controls, children with P-ADHD also experience deficient restraint performance as evidenced by
longer SSRT and less percent inhibition (i.e., more commission errors) in the restraint version of
the SST (Schachar et al., 2007; see Chapter 2). Because longer SSRT has been proposed as a
candidate endophenotype for P-ADHD (Crosbie, Perusse, Barr & Schachar; 2008), we selected
this performance measure as a potential predictor of IC ratings. In addition, we examined the
possible relationship between endophenotypic behavior of P-ADHD and ratings of ADHD
symptoms.
Children with TBI exhibited slower cancellation SSRT, but only if they were in the acute phase
of injury or had S-ADHD and/or a severe injury (Konrad et al., 2000a, 2000b; Leblanc et al.,
2005; Schachar et al., 2004b). Conversely, normal restraint performance on the SST was
documented in both children with TBI and those with S-ADHD (see Chapter 3). Therefore, poor
IC is common in P-ADHD and may reflect the complex neuropsychology underlying the
disorder, whereas TBI may confer a time-limited deficit in cancellation that persists beyond the
acute phase of injury only if a child develops S-ADHD.
Greater elevations in parent and teacher ratings of DSM-IV-TR ADHD inattentive and
hyperactivity/impulsivity symptoms were associated with poorer cancellation SSRT, whereas
more hyperactivity/impulsivity symptoms were related to poorer IC on the restraint task, as
reported earlier (Konrad et al., 2000a). Our data suggest that stopping an ongoing response
efficiently requires intact attention, such as paying attention to details, following through on
instructions, keeping one’s mind continually on a task and resisting distraction. These traits may
ensure that the finishing time of the stop process occurs before the finishing time of the go
process, which would result in successful inhibition (Logan, 1994). Our data also suggest that
successful restraint may involve controlled, measured behaviors such as staying seated, not

102
fidgeting or squirming, waiting for the next trial to occur before a response is made, resisting
impulses, and making deliberate movements once a stimulus appears on the screen. These traits
may enable greater top-down control of behavior, which is thought to be required for successful
restraint (e.g., Kelly et al., 2004).
No inhibition variable in the cancellation or restraint version predicted self-report classification
into any ADHD subtype. Cancellation speed consistently predicted parent and teacher
classification of ADHD across subtypes, whereas the speed of restraint predicted teacher
classification of hyperactive/impulsive and combined subtypes. However, cancellation SSRT
only accounted for approximately 6-8% and 8-17% of the variance in parent and teacher
classifications, respectively, and restraint SSRT only accounted for 6-7% of the variance in
teacher classifications. Toplak and colleagues (2009) showed that IC during the SST predicted
ADHD status; however, parent and teacher ratings of inhibition functioning predicted ADHD to
a much greater degree than did SSRT (Toplak, Bucciarelli, Jain, & Tannock, 2009), which
suggests that SSRT alone is an inadequate predictor of parent and teacher ratings of ADHD.
Nevertheless, these relationships indicate that rater classification of diagnosable ADHD subtypes
is predicted by slower IC, just as performance on attention tasks in children with TBI is inversely
related to severity of parent ratings of ADHD symptoms (Yeates et al., 2005).
Agreement between parent and teacher ratings in the classification of children into the combined
subtype was significantly predicted by SSRT in cancellation, accounting for approximately 6%
of the variance. No other indices of IC were significant predictors of agreement of classification.
Cancellation IC predicted the concordance of parent and teacher ratings only if a child was rated
as exhibiting both inattentive and hyperactive/impulsive symptoms, which suggests that SSRT

103
does not reliably predict the agreement between teachers and parents to classify children into
ADHD subtypes.
9.5 Key differences between P-ADHD and S-ADHD
Poor IC is a candidate endophenotype for P-ADHD, reflecting an inheritable trait that represents
the underlying neural dysfunction conferred by the disorder. Poor IC performance was correlated
with ratings of IC from both parents and teachers, with parents endorsing greater deficits across
subscales. On the other hand, children with S-ADHD seem to selectively exhibit atypical
performance on the cancellation version of the SST that is less severe than that in P-ADHD.
Moreover, IC performance in the S-ADHD group is not correlated with IC ratings and, relative
to children with P-ADHD, parents and teachers rate them as exhibiting fewer IC problems.
Considered together, these data suggest that S-ADHD is a distinct disorder from P-ADHD
despite similar expression of DSM-IV-TR symptomology. Lesion data also suggest differences
between these disorders in terms of underlying pathology (e.g., Max et al, 2005b). Congruent
with this idea, stimulants ameliorate IC deficits in P-ADHD, but have a more limited effect in S-
ADHD, helping only certain symptoms within a short time frame (Jin & Schachar, 2004;
Mahalick et al., 1998). Because performance on IC tasks in the S-ADHD group was unrelated to
IC in everyday life, our findings suggest that performance indices of IC are imperfect tools for
characterizing the disorder. Future studies are needed to further elucidate the central deficits of
S-ADHD, and whether or not injury severity, early biomarker, and neuroanatomical variables are
important in the identification and classification of behavioral and neurocognitive IC dysfunction
in these children.

104
Table 6
Participant Characteristics
AGE AT
TEST
AGE AT
INJURY
TIME SINCE
INJURY
WASI IQ
SCORE
SES
CON 12.0 (3.3) -- -- 112.3 (11.0) 52.8 (6.2)
TBI 1.2 (3.4) 8.3 (3.6) 3.7 (1.5) 105.0 (10.5) 44.1 (10.1)
P-ADHD 10.9 (3.2) -- -- 108.3 (17.0) 46.2 (11.5)
S-ADHD 11.8 (2.5) 7.2 (2.4) 4.6 (1.2) 99.0 (14.3) 44.6 (10.5)
All scores represented as means (standard deviation)

105
Table 7
Summary of Group Differences across the Conners-P, Conners-T, and Conners-SR
Conners-P Conners-T Conners-SR
IN CON < TBI < S-ADHD <
P-ADHD
CON = TBI < S-ADHD =
P-ADHD
CON < TBI = S-ADHD =
P-ADHD
HY CON < TBI < S-ADHD =
P-ADHD
CON = TBI < S-ADHD =
P-ADHD
NS
DSM-
AN
CON < TBI < S-ADHD =
P-ADHD
CON = TBI = S-ADHD <
P-ADHD
CON < TBI = S-ADHD =
P-ADHD
DSM-
AH
CON < TBI < S-ADHD =
P-ADHD
CON = TBI < S-ADHD =
P-ADHD
NS
Legend: NS = no significant group differences; < = fewer elevations on the subscale

106
Table 8
Parent-Teacher Discrepancy Ratings (Means and standard deviations)
IN HY DSM-AN DSM-AH
CON -2.1 (10.3) -3.9 (8.8) -2.3 (9.7) -4.0 (7.9)
TBI 6.1 (11.2)* 6.8 (10.9)* 5.8 (11.3)* 7.8 (10.0)*
P-ADHD 12.0 (7.5)* 8.4 (22.7)* 9.6 (11.3)* 8.0 (22.1)*
S-ADHD 3.2 (20.0) 3.2 (10.3) 7.6 (23.8) 2.8 (12.7)
* Significant differences relative to CON group

107
Table 9
Parent-Self-Reports Discrepancy Ratings (Means and standard deviations)
IN HY DSM-AN DSM-AH
CON -4.4 (11.4) -7.8 (11.6) -3.6 (10.9) -8.2 (12.4)
TBI -4.1 (13.6) -4.3 (15.7) -4.1 (12.2) -5.0 (15.6)
P-ADHD 27.3 (14.4)* 27.5 (11.8)* 30.2 (13.6)* 23.5 (16.3)*
S-ADHD 11.0 (12.6)* 16.8 (10.4)* 13.6 (11.1)*A 17.6 (9.3)*
* Significant differences relative to the CON and TBI groups
A Significant differences relative to the P-ADHD group

108
Table 10
Teacher-Self-Reports Discrepancy Ratings (Means and standard deviations)
IN HY DSM-AN DSM-AH
CON -1.6 (9.0) -2.8 (10.1) -1.4 (9.0) -3.8 (10.5)
TBI -9.9 (16.3) -9.8 (12.1) -10.5 (11.5) -11.3 (14.5)
P-ADHD 6.0 (18.2) -5.0 (15.8) 13.5 (14.1)* -3.7 (15.0)
S-ADHD -3.2 (25.3) 10.2 (9.4)* -0.6 (25.5) 8.8 (11.3)*
* Significant differences relative to the CON and TBI groups

109
Table 11
Summary of Discrepancy Ratings
Conners-P > Conners-T Conners-P > Conners-SR Conners-T > Conners-SR
IN
TBI and P-ADHD vs.
CON
P-ADHD and S-ADHD vs.
CON and TBI
P-ADHD vs. S-ADHD
NS
HY
TBI and P-ADHD vs.
CON
P-ADHD and S-ADHD vs.
CON and TBI
S-ADHD vs. CON and TBI
DSM-AN
TBI and P-ADHD vs.
CON
P-ADHD and S-ADHD vs.
CON and TBI
P-ADHD vs. S-ADHD
CON and TBI vs. S-ADHD
DSM-AH
TBI and P-ADHD vs.
CON
P-ADHD and S-ADHD vs.
CON and TBI
P-ADHD vs. S-ADHD
Legend: NS = no significant group differences; < = fewer elevations on the subscale; >
= greater elevations on the subscale

110
Table 12
Correlation Coefficients (r) between SST Performance and Ratings
CANCELLATION RESTRAINT
RATER GROUP SCALE SSRT MRT SSRT PI MRT
Conners-P TBI HY -0.330*
P-ADHD IN 0.587*
DSM-AN -0.621*
Conners-T CON IN 0.578** -0.621**
HY 0.392* -0.460*
DSM-AN 0.477** -0.443*
DSM-AH 0.433* -0.515**
P-ADHD HY 0.696* 0.330** 0.676*
DSM-AH 0.729* 0.767* 0.678*
Conners-SR CON HY -0.416* 0.356*
DSM-AH -0.402* 0.353*
TBI IN -0.427*
* p<0.05, ** p<0.01

111
Table 13
Regression Results
PREDICTOR DV B SE B Β
SSRT PAI -0.001 <0.001 -0.237
Cancellation PAH -0.001 <0.001 -0.236
PAC -0.001 <0.001 -0.286
TAI -0.001 <0.001 -0.412
TAH -0.001 <0.001 -0.274
TAC <0.001 <0.001 -0.266
PI PAC 0.004 0.002 0.200
Restraint TAI 0.007 0.002 0.367
SSRT TAH -0.001 <0.001 -0.244
Restraint TAC -0.001 <0.001 -0.256
Legend: DV = dependent variable; B = unstandardized coefficient; SE B = standard
error of B; β = standardized coefficient; PAI = Parent classification of ADHD inattentive
subtype; PAH = Parent classification of ADHD hyperactive/impulsive subtype; PAC =
Parent classification of ADHD combined subtype; TAI = Teacher classification of ADHD
inattentive subtype; TAH = Teacher classification of ADHD hyperactive/impulsive
subtype; TAC = Teacher classification of ADHD combined subtype

112
Figure 16
Cancellation and Restraint Models of the Stop Signal Task
Trials 1 and 2 represent ―go trials‖. In both versions of the SST, one of two possible go signals
(an X in Trial 1, an O in Trial 2) is presented on a computer screen for 1000 milliseconds (ms)
following a 500 ms fixation point. Participants are instructed to respond to these stimuli as
quickly as possible by making the appropriate button press on a handheld controller. Trial 3
represents a ―stop trial‖. Participants are instructed to inhibit their responses to the go signal
when they hear the auditory stop signal (SS; a 1000 Hz tone), which occurs randomly on 25% of
trials (Logan, 1994). In the restraint version, the go and SS are presented concurrently (i.e., the
delay between the onset of the go and SS was 0 ms). In the cancellation version, the delay
CANCELLATION
X
RESTRAINT
X
O
Stop Signal
FIXATE
TIME
Trial 1 GO
Variable delay
~250 ms
Trial 3
STOP
Trial 2 GO
FIXATE
FIXATE
X
X
O
Stop Signal
FIXATE
FIXATE

113
between the presentation of the go and the SS was varied dynamically to ensure that participants
would inhibit their responses on 50% of the inhibition trials, regardless of whether or not they
slowed their go RT as a strategy to increase successful cancellation (Logan & Cowan, 1984;
Logan, 1994). The initial SS delay was set at 250 ms, and when a participant successfully
inhibited his/her response, the delay was increased by 50 ms on the subsequent stop trial, and
when the participant failed to inhibit his/her response, the delay was decreased by 50 ms on the
subsequent stop trial.

114
Figure 17
Conners-P Ratings across Groups
Ratings of the CON and TBI groups were within the normal range. The ADHD groups were
rated as exhibiting a greater number of deficits across subscales relative to the CON group, with
the P-ADHD group rated as exhibiting greater elevations on the IN subscale relative to the S-
ADHD group.
40
50
60
70
80
90
IN HY DSM-AN DSM-AH
T-S
CO
RE
S (
SE
)
CONNERS-P SUBSCALES
CONTROL
TBI
P-ADHD
S-ADHD

115
Figure 18
Conners-T Ratings across Groups
Ratings of the CON and TBI groups were within the normal range. The ADHD groups were
rated as exhibiting a greater number of deficits across subscales relative to the CON group, with
the P-ADHD group rated as exhibiting greater elevations on the DSM-AN subscale relative to
the S-ADHD group.
40
50
60
70
80
90
IN HY DSM-AN DSM-AH
T-S
CO
RE
S (
SE
)
CONNERS-T SUBSCALES
CON
TBI
P-ADHD
S-ADHD

116
Figure 19
Conners-SR Ratings across Groups
No self-report ratings in any group were considered clinically significant. Similar ratings were
obtained from all groups for the hyperactivity/impulsivity subscales, and participants in the CON
group rated themselves as exhibiting significantly fewer inattention problems relative to the other
groups.
40
50
60
70
80
90
IN HY DSM-AN DSM-AH
T-S
CO
RE
S (
SE
)
CONNERS-SR SUBSCALES
CONTROL
TBI
P-ADHD
S-ADHD

117
Chapter 5 General Discussion
The goal of the trio of studies in this dissertation was to understand IC in children with S-ADHD.
In the Introduction, I outlined a several questions organized in a series of steps designed to
address the general goal. This general discussion concerns what the data mean in terms of a
number of broader issues, including: the developmental course of IC and reward processes; how
IC problems manifest across a range of childhood disorders and the interpretation of IC
behavioral phenotypes and IC neurocognitive phenotypes; the ecological validity of IC tasks;
some avenues for future research; and – the key question - what, if anything is unique about IC
in S-ADHD and how does it differ from P-ADHD? Before discussing these issues, a summary of
the main results will be presented.
10 Summary of Studies
Chapter 2 investigated the effects of reward on cancellation and restraint inhibition in typically
developing children and adolescents. Participants aged 7-17 years old performed both versions of
the SST under 3 reward conditions (NO, LOW, HIGH). Rewards facilitated the speed and
probability of inhibition across task versions without significantly altering response execution.
Compared to children, adolescents exhibited faster and less variable go responses, were more
accurate when responding to go stimuli, and exhibited faster latencies to cancel and restrain a
response when encountering a stop signal.
Following the demonstration of age-related changes in inhibition in typically developing children
and adolescents, Chapter 3 examined how children with S-ADHD cancel and restrain responses
under different reward conditions. Here, the goal was to delineate S-ADHD from both TBI
(without S-ADHD) and P-ADHD, with the aim of elucidating the behavioural characteristics of

118
the S-ADHD group. Children with TBI did not exhibit IC deficits across tasks, and, like the
CON group, their performance improved when successful inhibition was rewarded. The P-
ADHD group exhibited poor cancellation and restraint, and variable performance across tasks
and reward conditions. Although performance improved with increasing reward magnitude, their
IC impairments persisted. The S-ADHD group exhibited normal restraint IC, but moderately
abnormal cancellation IC. Rewards also improved IC performance in this group. Younger age of
injury in the TBI and S-ADHD groups predicted slower and more variable response execution
performance across task versions, and slower restraint IC in the reward conditions of restraint.
No other injury variables were consistently related to performance.
Chapter 4 investigated behavioural ratings of IC and the relationship between ratings and
neurocognitive IC performance on the cancellation and restraint versions of the SST. Parent,
teacher, and self-report ratings from the Conners 3 were analyzed between groups (CON, TBI, S-
ADHD, and P-ADHD). Ratings of inattention and hyperactivity/impulsivity, as well as DSM-IV-
TR ADHD symptoms were examined. Participants in the CON and TBI groups were rated by
parents and teachers as exhibiting behaviours within the typical range. The CON group was rated
as exhibiting fewer problems than either of the ADHD groups, with the P-ADHD group rated as
more inattentive than the S-ADHD group. Moderate to high concordance was found between
parent and teacher reports, each of which was poorly concordant with self-reports suggesting
poor metacognition across development. Relative to children with TBI without S-ADHD, the P-
ADHD and S-ADHD groups were unaware of their own deficits. Ratings of IC deficits were
correlated with poorer IC performance in the P-ADHD group, but not in the S-ADHD group.
Poorer IC predicted parent and teacher classification of participants into ADHD subtypes,
although IC did not predict rating concordance.

119
11 Reward and Inhibitory Control in Normal Children
Adolescents exhibited faster and more accurate IC and response execution relative to younger
children, consistent with previous research (Hale, 1990; Johnstone et al., 2007; Williams et al.,
1999). Improvements in IC are thought to reflect maturation in regulatory control centers of the
brain; specifically in the ventrolateral prefrontal cortex and its connections with subcortical
structures that are involved in the preparation, execution, and coordination of voluntary
behaviour (the basal ganglia; Liston et al., 2006; Rubia et al., 2007). Age-related improvements
may be also supported by the maturation of other regulatory processes such as working memory,
decision-making, and performance monitoring (e.g., Roncadin, Pascual-Leone, Rich, & Dennis,
2007; Velanova, Wheeler, & Luna, 2009).
Reward facilitated both cancellation and restraint, and the lack of interaction between age group
and reward suggests that reward facilitated IC to a similar degree throughout child and
adolescent development. Strikingly, these effects occurred in the absence of a significant
influence of reward on response execution, which confirms that reward motivated the process it
was designed to effect, rather than exerting a global effect on arousal. Previous studies
examining reward and IC contain a variety of limitations such as rewarding both IC and ―go‖
processes, including rewards and punishments within the same paradigm, and not including
appropriate control groups. By solely rewarding successful IC in studies that included carefully
chosen comparison groups (see Chapter 3), the current dissertation avoided these methodological
pitfalls and thereby clarifies the locus of reward effects in two IC paradigms.
Like the IC system, the neural circuits subserving reinforcement learning, including the
dopamine system, are immature in children (Meng, Ozawa, Itoh, & Takashima, 1999; Segawa,
2000; Spear, 2000). Compared to adults, children and adolescents exhibit decreased activation of

120
the ventral striatum when approaching rewards (Bjork et al., 2004), but greater and more diffuse
activity in the ventral striatum and orbitofrontal cortex after they have received the reward (Ernst
et al., 2005; Galvan et al., 2006; May et al., 2004). The dopamine system, responsible for
approach, incentive processing, and prediction errors (Schultz, 1997), continues to develop into
adulthood, with hyperactivity of this system apparent in adolescence (Meng et al., 1999; Seeman
et al., 1987; Segawa, 2000; Spear, 2000). An immature reward system may bias adolescents
toward greater reward-seeking and may undermine a still developing IC system, resulting in poor
decision-making (Galvan, 2010; Geir & Luna, 2009). However, the lack of an interaction effect
between reward and age in Chapter 2 suggests that reward improved IC similarly across the
developmental span studied here. The lack of interaction may be mediated by the relatively less
mature IC system in children, which may have equated the effects of reward on IC processes
between age groups by counteracting the effects of a hyperactive reward system in adolescents.
Despite differences in the development, neural substrates, and inhibition processes assessed by
restraint and cancellation (e.g., Johnstone et al., 2007; Schachar et al., 2007), reward did not
differentially alter these IC processes. The facilitation of reward on IC may be due to the effects
of dopaminergic signals in the striatum and orbitofrontal cortex interacting directly with
substrates of the IC system. Alternatively, there may be an interaction between reward centers
and other areas of the brain that influence the interaction of inhibition and reward (see Padmala
& Pessoa, 2010). As elaborated in Chapter 2, we suggest that reward signals may affect the
preparation of the inhibition response in both cancellation and restraint at the level of the inferior
frontal gyrus (IFG) and/or basal ganglia. Stop signals that signify the potential of reward receipt
are arguably more salient than non-rewarding stop signals, thus facilitating the preparation of the
inhibition response via activation of the IFG (Chikazoe et al., 2009). At the same time,
dopaminergic signals in the ventral and dorsal striatum may have strengthened the strong signals

121
associated with the reward conditions (see Horovitz, 2002), thereby facilitating IC by altering
motor planning or programming prior to the response (Beste et al., 2010).
12 Reward and Inhibitory Control in TBI and ADHD
As with the effects found in Chapter 2, rewards facilitated both cancellation and restraint in
children and adolescents in the TBI, S-ADHD, and P-ADHD groups. The lack of group by
reward interactions reveals that the reinforcing effects of rewards are similar in typical
development and in some acquired and developmental disorders of childhood. These data also
imply that the mesolimbic dopamine system is intact in participants with TBI, with or without S-
ADHD, and is able to interact adaptively with the IC system.
Increasing reward magnitude failed to ―normalize‖ IC performance in the P-ADHD group,
suggesting that their IC deficits might be resistant to reward. To be sure, rewards decreased the
latency of cancellation and commission errors in the P-ADHD group, so these children are not
entirely impervious to reinforcement, which agrees with the idea that children with P-ADHD
may have a higher than normal reward threshold despite a preference for immediate incentives
(Douglas, 1999; Haenlein & Caul, 1987; Quay, 1997; Sergeant et al., 1999; Sonuga-Barke,
2002). Neuroimaging studies corroborate the ―reward hypothesis‖ in P-ADHD, illustrating an
association between ADHD status with the motivational components of approach behaviour:
hypoactivation has been observed in the striatum and orbitofrontal cortex when anticipating
rewards, with normal striatal response and greater activity in the orbitofrontal cortex and left
prefrontal cortex in response to receipt of a reward (Scheres, Milham, Knutson, & Castellanos,
2007; Strohle, Stoy, Wrase, Schwarzer, Schlagenhauf, et al., 2008).
Compared to rewards, punishment may represent a more salient form of reinforcement to
children with P-ADHD, and so may have a greater impact on IC. For example, these children

122
make better decisions on gambling-type tasks when the magnitude and frequency of punishments
(but not rewards) is increased (Luman et al., 2008; Toplak et al., 2005). Indeed, increasing the
magnitude of punishments has been shown to normalize the IC deficit in children with P-ADHD
(Slusarek, Velling, Bunk, & Eggers, 2001); however this study also rewarded correct go trials,
which clouds interpretation of the data. Future studies might clarify the effects of punishment
across cancellation and restraint utilizing the paradigms presented in the current dissertation, but
instead of rewarding successful inhibition, deducting points for failed inhibition. The next step
would be to compare performance under conditions of punishment to performance under
conditions of reward in order to establish whether there are group by condition by task
interactions, which would reveal whether children with P-ADHD behave differently in response
to different forms of reinforcement.
In sum, the data suggests that rewards affected both restraint and cancellation to improve IC
across acquired and developmental disorders in a similar manner. This general effect shows that
reward can be used as an incentive for behavioral control in the classroom where stringent rules
for behavior are present, and perhaps even clinically when aiding children with IC difficulties.
External rewards may provide a means to shape behavior in an adaptive manner in children with
normal and disordered attention, especially if delivered shortly following the desired behaviour.
13 Differences between S-ADHD and TBI without S-ADHD
An important finding is that a diagnosis of S-ADHD presents a different behavioral profile from
TBI without such a diagnosis. Abnormal cancellation performance in the S-ADHD group was
not observed in the TBI group. Relative to participants with TBI, participants with S-ADHD
were rated as exhibiting a significantly greater number of IC behaviours at home and at school.

123
Moreover, ―awareness of deficits‖, as indicated by discrepancy ratings between self and parent
ratings, was present in the S-ADHD but not the TBI group. Thus, the long term sequelae of S-
ADHD are distinct from those following TBI without S-ADHD.
Lesion variables and premorbid familial and behavioral functioning may be responsible for
differences between the TBI groups. A subsequent diagnosis of S-ADHD is associated with
damage to the orbitofrontal cortex, the basal ganglia as a whole or specifically the right putamen,
and the left or bilateral thalamus (Gerring et al., 2000; Herkovits, et al., 1999; Max et al., 2005a).
However, some investigations have failed to find a significant relationship between lesion
location and diagnosis of S-ADHD (e.g., Max et al., 2005b; Max et al., 2004). Children
diagnosed with S-ADHD at 6 months post-TBI were more likely to have poorer SES than those
without S-ADHD (Max et al., 2005a), but not at 12 or 24 months post-TBI (Chapter 3; Max et
al., 2005b). Pre-injury adaptive functioning and psychosocial adversity were not related to S-
ADHD in the acute phase (Max et al., 2005a), but were related to diagnosis in the chronic phase
of injury (Gerring et al., 2000; Max et al., 2005b; Max et al., 2004). It is clear that research
lacunae include an understanding of what makes children susceptible to developing S-ADHD
beyond the consequences of a TBI in childhood.
14 Relationship between Ratings of IC and Neurocognitive measures of IC
One of the objectives of Chapter 4 was to examine whether ratings of IC are related to
neurocognitive IC performance. That is, do individuals perceive IC deficits in children at home
and at school in a manner that reflects poor neurocognitive performance? Are IC variables
predictive of classification into ADHD subtypes (i.e., do they show diagnostic utility)?

124
Correlation analyses revealed that difficulties with impulse control and/or difficulties sitting still
are related only to IC deficits across tasks, whereas additional difficulties with attention are
related only to poor stopping (cancellation). These findings further support the idea that IC is not
a unitary construct. Importantly, the data show that not all children with ADHD experience
deficits across all domains of IC, which have a direct implication in clinical settings when
making predictions of function based on symptomatology.
Poor IC performance on the SST only accounted for a small proportion of the variance in parent
and teacher classification of participants into ADHD subtypes. Moreover, deficits in IC did not
consistently predict greater agreement of ADHD classification between teachers and parents. In
light of these findings, caution is needed when considering neurocognitive measures of IC as
predictors of informant ratings of ADHD subtypes.
15 Future Directions
Problems in the self-regulation of behavior can negatively influence academic, social, and
occupational successes. Recognizing these deficits in TBI is essential for identifying children
who require intervention and treatment after they have returned to home and school activities.
Even better would be identifying, shortly after the TBI, children most likely to develop S-ADHD
and/or persistent IC problems. Although prospective studies of IC after TBI are vital for
examining changes in function over time, children can become more familiar with tasks with
repeated exposure, leading to practice effects. An important future direction then would be to
identify biomarkers in the early acute phase of the injury that can predict future outcomes.
Biomarkers are objectively measured characteristics, such as protein levels present in serum or
electrophysiological activity, that act as surrogate markers of brain injury that can complement
more expensive neuroimaging methods (Haqqani et al., 2007). A good biomarker for S-ADHD

125
and/or IC deficits should reflect the presence of such difficulties, and should inform the
progression of deficits, the severity of prognosis, and the efficacy of any interventions.
In addition to the development of S-ADHD, childhood TBI is also associated with new-onset
disruptive behaviors and behavioral disorders such as oppositional defiant disorder and conduct
disorder. Parent ratings of verbal and physical aggression in children with TBI increase as time
since injury increases, with approximately 20% of patients exhibiting borderline clinical or
clinically significant levels of aggression (Cole et al., 2008). These increases may be due to the
emergence of S-ADHD, as high levels of affective lability and aggression are common in
children who have developed S-ADHD compared to those with TBI without S-ADHD, and these
two traits tend to co-occur (Gerring et al., 1998; Max, Koele, Castillo, et al., 2000). Moreover,
new-onset oppositional defiant disorder/conduct disorder/disruptive behavioural disorder are
apparent in approximately 35% of participants with S-ADHD during the chronic phase of
recovery (Max et al., 2005b), and are the most frequent comorbidities of S-ADHD as measured
by both parental interviews and ratings scales (McKinlay, Grace, Horwood, Fergusson, &
MacFarlane, 2009; Max et al., 1998; Max et al., 2004). Future studies are needed to assess
whether these increases in aggressive behaviors are present across contexts, and whether their
co-occurrence with S-ADHD is related to changes in IC functioning. The Conners 3 may be a
helpful tool for answering these questions, because it includes scales that assess aggression,
oppositionality, and poor conduct.
Current neuroimaging suggests that reward systems may be intersecting with IC systems to
affect behaviour (Padalma & Pesoa, 2010). Therefore, a third major focus of future study would
be to replicate the methods presented in Chapters 2 and 3 under an fMRI protocol in order to
examine this phenomenon in children and adolescents across IC tasks. In particular, the

126
hypotheses presented in Chapter 2 needs to be explicitly tested. That is, does reward facilitate
preparation of the inhibition response via stimulation of the IFG/basal ganglia to affect outcome?
This type of experiment would clarify how rewards affect behaviour, providing insights into
normal brain functioning across development. There would likely be an effect of age, given lags
in the maturation of the frontostriatal system.
Neuroimaging studies, combined with the data from the present study, suggest some directions to
investigate the neural bases of inhibitory control in S-ADHD. Disrupted inhibition in P-ADHD
may be related to abnormalities of frontostriatal circuitry (e.g. Aron & Poldrack, 2005; Kieling,
Goncalves, Tannock, & Castellanos, 2008) including volume reductions and functional
abnormalities in the basal ganglia (caudate nucleus and globus pallidus) and parts of the
prefrontal cortex (e.g., Castellanos et al., 1996; Durston et al., 2004; Filipek et al., 1997; Rubia et
al., 2009; Rubia et al., 1999; Seidman et al., 2006; Sowell et al., 2003; Vaidya, Bunge,
Dudukovic, Zalecki, Elliott, & Gabrieli, 2005). Children with S-ADHD and lesions to the right
ventrolateral prefrontal cortex and basal ganglia (especially the striatum) would be expected to
exhibit longer SSRT on the cancellation task without significant deficits on the go trials (Aron,
Fletcher, Bullmore, Sahakian, & Robbins, 2003; Chambers et al., 2007; Chevrier et al., 2007;
Rieger, Gauggel, & Burmeister, 2003; Rubia et al., 1997, 2000). Conversely, participants with
damage to the dorsal aspects of the prefrontal cortex, especially to the left side, may exhibit
greater impairments with restraint (Levin et al., 1993).
Another important imaging direction would be to assess reward-IC interactions in children with
TBI, S-ADHD, and P-ADHD. Based on predictions from Chapter 2 and the findings from
Chapter 3, one would expect an attenuated preparation response in P-ADHD across tasks, but an
increase in activation during reward trials relative to non-reward trials. The TBI group may

127
exhibit an abnormal pattern of activation despite normal performance on both cancellation and
restraint. Kramer and colleagues (2008) discovered that children with TBI who perform normally
on attention tasks activate similar areas of the brain to controls when performing the task;
however, the TBI group exhibited hyperactivation in these networks (Kramer et al., 2008),
suggesting that normal performance had been effected by neural compensation involving an
over-commitment of resources (McAllister et al., 2001). Thus greater activity in the IFG/basal
ganglia in response to rewards may be observed in the TBI group relative to controls. While this
general pattern of results may also be present in children with TBI and S-ADHD, differences
may exist between the TBI groups in terms of activation of frontostriatal networks during
cancellation, with an attenuated response in the S-ADHD group.
16 Limitations
Limitations of the dissertation include those related to sampling methodology, diagnostic
measures, issues of power and group sizes, and severity of injury in the TBI and S-ADHD
groups.
Participants in the S-ADHD group were selected based on parent or teacher endorsement of
clinically significant ADHD symptoms on the Conners 3, with only those children with TBI who
met DSM-IV-TR criteria for the disorder included into the S-ADHD group. Although it would
have been desirable to conduct psychiatric interviews with the parents of each child in the TBI
group in addition to assessing the child directly in order to determine the presence of ADHD
symptoms, current resources (including financial and time resources) precluded this procedure.
However, a diagnosis of S-ADHD via a psychiatrist or clinical interview does not necessarily
lead to greater identification of children with S-ADHD (Chapter 3 revealed that 18% of children
with chronic phase TBI had developed S-ADHD, consistent with prevalence rates in the

128
literature), nor does it improve the relationship between diagnosis and neurocognitive behaviour
(see Willcutt et al., 2005). Hence, it is felt that the overall findings of the dissertation may not
have been significantly tempered by the sampling and research diagnosis methodology.
The absence of P-ADHD in the S-ADHD and TBI groups was probed via retrospective reports
during a brief telephone interview conducted with each parent during the initial recruitment call.
This interview involved the probing of whether specific DSM-IV-TR symptoms of ADHD were
present pre-injury: if a parent had reported that 6 or more inattentive and/or
hyperactive/impulsive symptoms were present in the child pre-TBI, then the child was not
included in the subsequent experiments. While retrospective reports of behaviour are not ideal,
this procedure has been used in previous studies to exclude children from S-ADHD groups due
to the presence of pre-injury ADHD symptoms (e.g., Konrad et al., 2000a, 2000b; Schachar et
al., 2004). Short of conducting a longitudinal, prospective study, I felt that this was the best way
to avoid including children with both primary and secondary forms of ADHD in the S-ADHD
group.
The final S-ADHD group consisted of 9 participants. This small sample size makes it difficult to
further subdivide the participants into different severity or age groups. In order to achieve a
greater sample size, I would have needed to recruit and test a much larger group of children with
TBI, which would have required much greater financial and time resources than I had available
for the dissertation. One concern with having a small clinical group is that the increased
variability that these children exhibit, similar to the increased variability present in the P-ADHD
group (see Chapter 3), may have led to a liberal F test thus resulting in an increased Type 1 error
rate and an inflated alpha level (Tabachnick & Fidell, 2007). Unequal n’s between groups also
leads to the concern of having insufficient power to detect the presence or absence of an effect. A

129
number of adjustments could have been made, including subtracting cases from cells with greater
n until all cells were equal (Tabachnick & Fidell, 2007). However, because the unequal n in the
current studies was a direct reflection of the population incidence of children with S-ADHD (i.e.,
only represented in 15-20% of cases of TBI), to artificially equalize n is to distort differences
between groups and may result in a loss of the generalizability of results (Tabachnick & Fidell,
2007).
There are a number of statistical approaches that attenuate the influence of unequal and small
group sizes. I felt that conducting non-parametric tests would not have been appropriate, as the
variables of interest were not presented in nominal or ordinal scales. Including covariates in the
analysis, as I did in Chapter 3 (age) and Chapter 4 (SES), act to increase the power of the
analyses (Tabachnick & Fidell, 2007). Another method is to assign heavier weighting to cells
with larger sample sizes when computing marginal means and lower-order interactions
(Tabachnick & Fidell, 2007), and SPSS version 15 (the statistical software used in the
dissertation) conducts this procedure as a default in the general linear model. Thus, the repeated
measures ANOVAs conducted in the current experiments appropriately took into account the
unequal sample sizes across groups when calculating differences across reward conditions,
groups, and behavioural ratings. To be sure that my findings were meaningful beyond being
statistically significant, I explored the effect sizes and power estimates associated with each main
effect (with the level adjusted to 0.0125 to account for multiple group comparisons), and the
results suggested medium effect sizes and power estimates across studies. For example, in
Chapter 3, the main effect of reward condition yielded a small to medium effect size associated
with medium power, and the main effect of group yielded a medium to large effect size
associated with medium to high power. In sum, despite the presence of a small S-ADHD group

130
and unequal n’s in the group comparisons, the results in the dissertation are nevertheless
meaningful as reflected by adjustments made to the general linear model, and by the effect sizes
and estimates of power yielded by each analysis.
Another potential limitation is the distribution of injury severity in the TBI and S-ADHD groups
(see Appendix 2). In the TBI group, 52.5 % of the participants had incurred a mild injury,
whereas 10 % and 37.5 % of participants had incurred a moderate and severe injury,
respectively. While this may appear as though the sample was biased toward those with mild
injury, this distribution reflects the reality that most pediatric TBI patients incur mild injuries,
with some estimates that approximately 76% of hospital admissions for TBI being for mild
injuries (Lescohier & DiScala, 1993). To ensure that the performance of children in the mild TBI
group did not account for the lack of effect between TBI and control groups on the IC measures
(i.e., that their presence did not cause a Type II error), I re-analyzed the SST data limiting the
TBI group to those with moderate and severe injuries, then re-analyzed the data again just
including children with severe TBI. These additional analyses did not change the findings
reported earlier, suggesting that the severity of injury does not influence the manner in which
children with chronic phase TBI without S-ADHD are able to cancel or restrain their responses.
Like children with moderate and severe TBI, children with mild TBI exhibit poor IC acutely
following the injury, but this deficit recovers to normal levels by the chronic phase of injury
(Leblanc et al., 2005).
The severity distribution in the S-ADHD group made it impossible to examine the influence of
severity on SST performance, but one would expect a stronger cancellation deficit in children
with more severe injuries relative to the TBI group (see Schachar et al., 2004b). Thus it remains
unclear whether children with more severe injuries would exhibit poorer IC compared to those

131
with less severe injuries and/or those with P-ADHD. Subsequent studies with larger group sizes
may clarify these issues.
17 S-ADHD: A Separate Disorder from P-ADHD?
The major goal of this dissertation was to better characterize S-ADHD, with a particular
emphasis on comparisons with P-ADHD. Both groups exhibit symptoms of inattention and/or
hyperactivity/impulsivity that are clinically significant, and there is some evidence to suggest
that like P-ADHD, children with severe TBI and a research diagnosis of S-ADHD also
experience problems canceling their ongoing actions (Schachar et al., 2004). However, no study
to date had directly compared these groups of patients, so it was unknown whether children with
S-ADHD present with similar deficits to those with P-ADHD or whether they have a disorder
with a substantially different behavioral profile.
Through principled study of acquired and developmental forms of ADHD, this dissertation has
shown that S-ADHD is not just a form of P-ADHD that develops due to TBI. Rather, S-ADHD
is separable in terms of qualitative IC deficits (they do not exhibit problems with restraint) but
also in terms of quantitative IC deficits (their atypical cancellation performance is not as severe).
This group was also rated by parents and teachers as exhibiting fewer inattention problems
relative to children with P-ADHD, who exhibited the greatest impairments on the Conners 3.
Moreover, poor IC on the SSTs was related to ratings of IC behaviors in the P-ADHD group, but
not in the S-ADHD group.
The differences between S- and P-ADHD concern the nature and magnitude of IC deficits, which
may reflect the underlying mechanisms unique to each disorder. Children with P-ADHD exhibit
a number of neural abnormalities in frontostriatal circuitry (e.g. Aron & Poldrack, 2005; Kieling
et al., 2008) including volume reductions in the basal ganglia (caudate nucleus and globus

132
pallidus), anterior cingulate cortex, and parts of the prefrontal cortex (Castellanos et al., 1996;
Filipek et al., 1997; Seidman et al., 2006), especially the right inferior frontal cortex (Durston et
al., 2004; Sowell et al., 2003). Moreover, poor inhibition displayed by ADHD groups is
correlated with smaller right frontal cortices (Casey et al., 1997), anterior cingulate cortex, and
right lentiform nucleus (McAlonan, Cheung, Chua, Oosterlaan, Hung, et al., 2008), and with
decreased activity in the right IFG (Rubia, Cubillo, Smith, Woolley, Heyman, & Brammer, 2009;
Rubia et al., 1999; Vaidya, Bunge, Dudukovic, Zalecki, Elliott, & Gabrieli, 2005), orbitofrontal
cortex (Rubia et al., 2009), and left caudate nucleus (Durston et al., 2003; Rubia et al., 1999;
Vaidya et al., 1998). Associations between IC performance and brain injury location and volume
in children has yet to be explored in children with S-ADHD, but one would expect that frontal
lesions would be an important focus of investigation.
A child with S-ADHD may exhibit increased activity and impulsive behaviours across contexts,
and have difficulty when trying to stop an ongoing action, leading to selective deficits in self-
control. This child would appear to be qualitatively and quantitatively different from a child with
P-ADHD, who may be severely inattentive in addition to being hyperactive/impulsive, exhibiting
general deficits across different forms of inhibition, leading to overall problems in self-
regulation. The clinical implications of these findings are that children with S-ADHD do not
present with ―classic ADHD‖ difficulties, which means that assessment and treatment procedures
need to be tailored to this group to account for such differences.

133
References
Alderson, R. M., Rapport, M. D., & Kofler, M. J. (2007). Attention-deficit/hyperactivity
disorder and behavioral inhibition: A meta-analytic review of the stop-signal
paradigm. Journal of Abnormal Child Psychology, 35, 745-758.
American Psychological Association (2000). The diagnostic and statistical manual of
mental disorders, 4th
edition text revision (DSM-IV-TR). Washington, DC: Author.
Andersen, S. L., & Gazzara, R. A. (1993). The ontogeny of apomorphine-induced
alterations of neostriatal dopamine release: Effects on spontaneous release.
Journal of Neurochemistry, 61, 2247-2255.
Aron, A. R. & Poldrack, R. A. (2005). The cognitive neuroscience of response inhibition:
relevance for genetic research in attention-deficit/hyperactivity disorder.
Biological Psychiatry, 57, 1285-1292.
Aron, A. R., Fletcher, P. C., Bullmore, E. T., Sahakian, B. J., & Robbins, T. W. (2003). Stop-
signal inhibition disrupted by damage to right inferior frontal gyrus in humans. Nature
Neuroscience, 6, 115-116.
Bach, L. J. & David, A. S. (2006). Self-awareness after acquired and traumatic brain injury.
Neuropsychological Rehabilitation, 16, 397-414.
Band, G. P., van der Molen, M. W., & Logan, G. D. (2003). Horse-race model
simulations of the stop-signal procedure. Acta Psychologica, 112, 105-142.
Berns, G. S., McClure, S. M., Pagnoni, G., & Montague, P. R. (2001). Predictability
modulates human brain response to reward. The Journal of Neuroscience, 21, 2793-2798.

134
Berwid, O. G., Curco Kera, E. A., Marks, D. J., Santra, A., Bender, H. A., & Halperin, J. M.
(2005). Sustained attention and response inhibition in young children at risk for
Attention-Deficit/Hyperactivity Disorder. Journal of Child Psychology and Psychiatry,
and Allied Disciplines, 46, 1219-1229.
Beste, C., Willemssen, R., Saft, C., & Falkstein, M. (2010). Response inhibition
subprocesses and dopaminergic pathways: Basal ganglia disease effects.
Neuropsychologia, 48, 366-373.
Bivona, U., Ciruli, P., Barba, C., Onder, G., Azicnuda, E., Silvestro, D., et al. (2008). Executive
function and metacognitive self-awareness after severe traumatic brain injury. Journal of
the International Neuropsychological Society, 14, 862-868.
Bjork, J. M., Knutson, B., Fong, G. W., Caggiano, D. M., Bennett, S. M., & Hommer, D.
W. (2004). Incentive-elicited brain activation in adolescents: Similarities and
differences from young adults. The Journal of Neuroscience, 24, 1793-1802.
Casey, B. J., Castellanos, F. X., Giedd, J. N., Marsh, W. L., Hamburger, S. D., Schubert, A. B.,
et al. (1997). Implication of right frontostriatal circuitry in response inhibition and
attention-deficit/hyperactivity disorder. Journal of the American Academy of Child and
Adolescent Psychiatry, 36, 374-383.
Castellanos, F. X., Giedd, J. N., Marsh, W. L., Hamburger, S. D., Vaituzis, A. C., Dickstein, D.
P., et al. (1996). Quantitative brain magnetic resonance imaging in attention-deficit
hyperactivity disorder. Archives of General Psychiatry, 53, 607-616.
Carrillo-de-la-Pena, M. T., Otero, J. M., & Romero, E. (1993). Comparison among various

135
methods of assessment of impulsiveness. Perceptual and Motor Skills, 77, 567-575.
Catroppa, C., Anderson, V., & Stargatt, R. (1999). A prospective analysis of the recovery of
attention following pediatric head injury. Journal of the International
Neuropsychological Society, 5, 48-57.
Catroppa, C., Anderson, V. A., Morse, S. A., Haritou, F., & Rosenfeld, J. V. (2007). Children’s
attentional skills 5 years post-TBI. Journal of Pediatric Psychology, 32, 354-369.
Chambers, C. D., Bellgrove, M. A., Gould, I. C., English, T., Garavan, H., McNaught, E.
M., et al. (2007). Dissociable neural mechanisms of cognitive control in prefrontal
and premotor cortex. Journal of Neurophysiology, 98, 3638-3647.
Chevrier, A. D., Noseworthy, M. D., & Schachar, R. (2007). Dissociation of response
inhibition and performance monitoring in the stop signal task using event-related fMRI.
Human Brain Mapping, 28, 1347-1358.
Chikazoe, J., Jimura, K., Hirose, S., Yamashita, K., Miyashita, Y., & Konishi, S. (2009).
Preparation to inhibit a response complements response inhibition during
performance of a stop-signal task. The Journal of Neuroscience, 29, 15870-15877.
Cicerone, K. D. (1996). Attention deficits and dual task demands after mild traumatic brain
injury. Brain Injury, 10, 79-89.
Conners, C. K. (2008). Conners 3rd
edition. Toronto: Milti-Health Systems, Inc.
Crosbie, J., Perusse, D., Barr, C. L., & Schachar, R. J. (2007). Validating psychiatric
endophenotypes: Inhibitory control and attention deficit hyperactivity disorder.
Neuroscience and Biobehavioral Reviews, 32, 40-55.

136
Cole, W. R., Gerring, J. P., Gray, R. M., Vasa, R. A., Salorio, C. F., Grados, M., et al. (2008).
Prevalence of aggressive behaviour after severe paediatric traumatic brain injury. Brain
Injury, 22, 932-939.
Crone, E. A., Jennings, J. R., & van der Molen, M. W. (2003). Sensitivity to interference and
response contingencies in attention-deficit/hyperactivity disorder. Journal of Child
Psychology and Psychiatry, 44, 214-226.
Crosson, C., Barco, P. P., Velozo, C., Bolesta, M. M., Cooper, P. V., Werts, D., et al. (1989).
Awareness and compensation in post-acute head injury rehabilitation. Journal of Head
Trauma Rehabilitation, 4, 46-54.
Delgado, M. R., Locke, H. M., Stenger, V. A., & Fiez, J. A. (2003). Dorsal striatum
responses to reward and punishment: Effects of valence and magnitude manipulations.
Cognitive Affective and Behavioral Neuroscience, 3, 27-38.
Delgado, M. R., Nystrom, L. E., Fissell, C., Noll, D. C., & Fiez, J. A. (2000). Tracking
the hemodynamic responses to reward and punishment in the striatum. Journal
Neurophysiology, 84, 3072-3077.
Dennis, M., Barnes, M. A., Donnelly, R. E., Wilkinson, M., & Humphreys, R. P. (1996).
Appraising and managing knowledge: Metacognitive skills after childhood head injury.
Developmental Neuropsychology, 12, 17-34.
Dennis, M., Barnes, M. A., Wilkinson, M., & Humphreys, R. P. (1998). How children with head
injury represent real and deceptive emotion in short narratives. Brain and Language, 61,
450-483.

137
Dennis, M., Sinopoli, K. J., Fletcher, J. M., & Schachar, R. (2008). Puppets, robots, critics, and
actors within a taxonomy of attention for developmental disorders. Journal of the
International Neuropsychological Society, 14, 673-690.
Dennis, M., Wilkinson, M., Koski, L., & Humphreys, R. (1995). Attention deficits in the long
term after childhood head injury. In S. Broman and M. E. Michel (Eds.), Traumatic head
injury in children (pp. 165-187). New York: Oxford University Press.
Desman, C., Petermann, F., & Hampel, P. (2008). Deficit in response inhibition in
children with attention-deficit/hyperactivity disorder (ADHD): Impact of
motivation? Child Neuropsychology, 14, 483-503.
Dillon, D. G., & Pizzagalli, D. A. (2007). Inhibition of action, thought, and emotion: A
selective neurobiological review. Applied and Preventive Psychology, 12, 99-114.
Downar, J., Crawley, A. P., Mikulis, D. J., & Davis, K. D. (2002). A cortical network
sensitive to stimulus saliene in a neutral behavioural context across multiple
sensory modalities. Journal of Neurophysiology, 87, 615-620.
Douglas, V. I. (1985). The response of ADD children to reinforcement: Theoretical and clinical
implications. In L. Bloomingdale (Ed.), Attention deficit disorder: Identification, course
and treatment rationale (pp. 49-56). New York: Spectrum Press.
Douglas, V. I. (1999). Cognitive control process in Attention-Deficit/Hyperactivity Disorder. In
H. C. Quay & A. E. Hogan (Eds), Handbook of disruptive behavior disorders (pp. 105-
138). New York: Plenum Press.
DuPaul, G. J., Ervin, R. A., Hook, G. J., & McGoey, K. E. (1998). Peer tutoring for children with

138
attention deficit hyperactivity: effects on classroom behavior and academic performance.
Journal of Applied Behavior Analysis, 31, 579-592.
Durston, S., Hulshoff Pol, H. E., Schnack, H. G., Buitelaar, J. K., Steenhuis, M. P., Minderaa, R.
B., et al. (2004). Magnetic resonance imaging of boys with attention-deficit/hyperactivity
disorder and their unaffected siblings. Journal of the American Academy of Child and
Adolescent Psychiatry, 43, 332-340.
Durston, S., Tottenham, N. T., Thomas, K. M., Davidson, M. C., Eigsti, I. M., Yang, Y., et al.
(2003). Differential patterns of striatal activation in young children with and without
ADHD. Biological Psychiatry, 53, 871-878.
Ernst, M., Nelson, E. E., Jazbec, S., McClure, E. B., Monk, C. S., Leibenluft, E., et al.,
(2005). Amygdala and nucleus accumbens in responses to receipt and omission of
gains in adults and adolescents. Neuroimage, 25, 1279-1291.
Ernst, M., Pine, D. S., & Hardin, M. (2006). Triadic model of the neurobiology of
motivated behavior in adolescence. Psychological Medicine, 36, 299-312.
Ewing-Cobbs, L., Fletcher, J. M., Levin, H. S., Iovino, I., & Miner, M. E. (1998). Academic
achievement and academic placement following traumatic brain injury in children and
adolescents: a two-year longitudinal study. Journal of Clinical and Experimental
Neuropsychology, 20, 769-781.
Ewing-Cobbs, L., Fletcher, J. M., Levin, H. S., Francis, D. J., Davidson, K., & Miner, M. E.

139
(1997). Longitudinal neuropsychological outcome in infants and preschoolers with
traumatic brain injury. Journal of the International Neuropsychological Society, 3, 581-
591.
Fareri, D. S., Martin, L. N., & Delgado, M. R. (2008). Reward-related processing in the
human brain: Developmental considerations. Development and Psychopathology,
20, 1191-1211.
Filipek, P. A., Semrud-Clikeman, M., Steingard, R. J., Renshaw, P. F., Kennedy, D. N., &
Biederman, J. (1997). Volumetric MRI analysis comparing subjects having attention-
deficit hyperactivity disorder with normal controls. Neurology, 48,589-601.
Fudge, J. L., & Haber, S. N. (2002). Defining the caudal ventral striatum in primates:
cellular and histochemical features. The Journal of Neuroscience, 22, 10078-10082.
Fuster, J. M. (2002). Frontal lobe and cognitive development. Journal of Neurocytology, 31, 373-
385.
Galvan, A. (2010). Adolescent development of the reward system. Frontiers in Human
Neuroscience, 6, 1-9.
Galvan, A., Hare, T. A., Parra, C. E., Penn, J., Voss, H., Glover, G., et al. (2006). Earlier
development of the accumbens relative to orbitofrontal cortex might underlie risk-
taking behavior in adolescents. The Journal of Neuroscience, 26, 6885-6892.
Garavan, H., Ross, T. J., Murphy, K., Roche, R. A., & Stein, E. A. (2002). Dissociable
executive functions in the dynamic control of behaviour: Inhibition, error
detection, and correction. Neuroimage, 17, 1820-1829.

140
Geir, C., & Luna, B. (2009). The maturation of incentive processing and cognitive
control. Pharmacology, Biochemistry, and Behavior, 93, 212-221.
Gerring, J., Brady, K., Chen, A., Quinn, C., Herskovits, E., Bandeen-Roche, K., et al. (2000)
Neuroimaging variables related to development of Secondary Attention Deficit
Hyperactivity Disorder after closed head injury in children and adolescents. Brain Injury,
14, 205-218.
Gerring, J.P., Brady, K.D., Chen, A., Vasa, R., Grados, M., Bandeen-Roche, K. J., et al. (1998)
Premorbid prevalence of ADHD and development of secondary ADHD after closed head
injury. Journal of the American Academy Child Adolescent Psychiatry, 37, 647-654.
Giedd, J. N., Blumenthal, J., Jeffries, N. O., Castellanos, F. X., Liu, H., Zijdenbos, A., et
al. (1999). Brain development during childhood and adolescence: A longitudinal
MRI study. Nature Neuroscience, 2, 861-863.
Gogtay, N., Giedd, J. N., Lusk, L., Hayashi, K. M., Greenstein, D., Vaituzis, A. C., et al.,
(2004). Dynamic mapping of human cortical development during childhood through
early adulthood. Proceedings of the National Academy of Sciences of the United States of
America, 101, 8174-8179
Gomez, R. (2003). Underlying processes in the poor response inhibition of children with
Attention-Deficit/Hyperactivity Disorder. Journal of Attention Disorders, 6, 111-122.
Gomez, R. (2007). Australian parent and teacher ratings of the DSM-IV ADHD symptoms:
differential symptom functioning and parent-teacher agreement and differences. Journal
of Attention Disorders, 11, 17-27.

141
Haenlein, M. & Caul, W. F. (1987). Attention deficit disorder with hyperactivity: a specific
hypothesis of reward dysfunction. Journal of the American Academy of Child and
Adolescent Psychiatry, 26, 356-362.
Hale, S. (1990). A global developmental trend in cognitive processing speed. Child
Development, 61, 653-663.
Hanten, G., Dennis, M., Zhang, L., Barnes, M., Roberson, G., Archibald, J., et al. (2004).
Childhood head injury and metacognitive processes in language and memory.
Developmental Neuropsychology, 25, 85-106.
Haqqani, A. S., Hutchison, J. S., Ward, R., & Stanimirovic, D. B. (2007). Biomarkers and
diagnosis; protein biomarkers in serum of pediatric patients with severe traumatic brain
injury identified by ICAT-LC-MS/MS. Journal of Neurotrauma, 24, 54-74.
Hart, T., Seignourel, P. J., & Sherer, M. (2009). A longitudinal study of awareness of deficit
after moderate to severe traumatic brain injury. Neuropsycholgical Rehabilitation, 19,
161-176.
Hart, T., Sherer, M., Whyte, J., Polansky, M., & Novack, T. A. (2004). Awareness of behavioral,
cognitive, and physical deficits in acute traumatic brain injury. Archives of physical
Medicine and Rehabilitation, 85, 1450-1456.
Hart, T., Whyte, J., Kim, J., & Vaccaro, M. (2005). Executive function and self-awareness on
―real-world‖ behavior and attention deficits following traumatic brain injury. Journal of
Head Trauma Rehabilitation, 20, 333-347.

142
Hartman, C. A., Rhee, S. H., Willcutt, E. G., & Pennington, B. F. (2007). Modeling rater
disagreement for ADHD: are parents or teachers biased? Journal of Abnormal Child
Psyhcology, 35, 536-542.
Herskovits, E. H., Megalooikonomou, V., Davatzikos, C., Chen, A., Bryan, R. N., & Gerring, J.
P. (1999). Is the spatial distribution of brain lesions associated with closed-head injury
predictive of subsequent development of attention-deficit/hyperactivity disorder?
Analysis with brain-image database. Radiology, 213, 389-394.
Hollingshead, A. B. (1975). Four factor index of social status. New Haven: Department
of Sociology, Yale University.
Horvitz, J. C. (2002). Dopamine gating of glutamatergic sensorimotor and incentive
motivational input signals to the striatum. Behavioural Brain Research, 137, 65-74.
Huang-Pollock, C. L., Mikami, A. Y., Pfiffner, L., & McBurnett, K. (2007). ADHD
subtype differences in motivational responsivity but not inhibitory control: Evidence
from a reward-based variation of the stop signal paradigm. Journal of Clinical Child and
Adolescent Psychology, 36, 127-136.
Iaboni, F., Douglas, V. I., & Baker, A. G. (1995). Effects of reward and response costs on
inhibition in ADHD children. Journal of Abnormal Psychology, 104, 232-240.
Jin, C. & Schachar, R. (2004). Methylphenidate treatment of attention-deficit/hyperactivity
disorder secondary to traumatic brain injury: a critical appraisal of treatment studies. CNS
Spectrums, 9, 217-226.
Johnstone, S. J., Dimoska, A., Smith, J. L., Barry, R. J., Pleffer, C. B., Chiswick, D., et al.
143
(2007). The development of stop-signal and Go/Nogo response inhibition in
children aged 7-12 years: Performance and event-related potential indices. International
Journal of Psychophysiology, 63, 25-38.
Kalff, A. C., De Sonneville, L. M., Hurks, P. P., Hendriksen, J. G., Kroes, M., Feron, F. J., et al.
(2005). Speed, speed variability, and accuracy of information processing in 5 to 6-year
old children at risk for ADHD. Journal of the International Neuropsychological Society,
11, 173-183.
Kelly, A. M., Hester, R., Murphy, K., Javitt, D. C., Foxe, J. J., & Garavan, H. (2004).
Prefrontal-subcortical dissociations underlying inhibitory control revealed by
event-related fMRI. European Journal of Neuroscience, 19, 3105-3112.
Kieling, C., Goncalves, R. R., Tannock, R., & Castellanos, F. X. (2008). Neurobiology of
attention deficit hyperactivity disorder. Child and Adolescent Psychiatry Clinics of North
America, 17, 285-307.
Knutson, B., Adams, C. M., Fong, G. W., & Hommer, D. (2001). Anticipation of
increasing monetary reward selectively recruits nucleus accumbens. The Journal
of Neuroscience, 21, RC159.
Knutson, B., & Cooper, J. C. (2005). Functional magnetic resonance imaging of reward
prediction. Current Opinion in Neurology, 18, 411-417.
Knutson, B., Westdorp, A., Kaiser, E., & Hommer, D. (2000). FMRI visualization of
brain activity during a monetary incentive delay task. Neuroimage, 12, 20-27.
Kohls, G., Peltzer, J., Herpertz-Dahlmann, B., & Konrad, K. (2009). Differential effects

144
of social and non-social reward on response inhibition in children and
adolescents. Developmental Science, 12, 614-625.
Konishi, S., Nakajuma, K., Uchida, I., Kikyo, H., Kameyama, M., & Miyashita, Y.
(1999). Common inhibitory mechanism in human inferior prefrontal cortex
revealed by event-related functional MRT. Brain, 122, 981-991.
Konishi, S., Nakajima, K., Uchida, I., Sekihara, K., & Miyashita, Y. (1998). No-go
dominant brain activity in human inferior prefrontal cortex revealed by functional
magnetic resonance imaging. European Journal of Neuroscience, 10, 1209-1213.
Konrad, K., Gauggel, S., Manz, A., & Scholl, M. (2000a). Inhibitory control in children with
traumatic brain injury (TBI) and children with attention deficit/hyperactivity disorder
(ADHD). Brain Injury, 14, 859-875.
Konrad, K., Gauggel, S., Manz, A., & Scholl, M. (2000b). Lack of inhibition: a motivational
deficit in children with attention deficit/hyperactivity disorder and children with
traumatic brain injury. Child Neuropsychology, 6, 286-296.
Kramer, M. E., Chiu, C. Y., Walz, N. C., Holland, S. K., Yuan, W., Karunanayaka, P., et al.
(2008). Long-term neural processing of attention following early childhood traumatic
brain injury: fMRI and neurobehavioral outcomes. Journal of the International
Neuropsychology Society, 14, 424-435.
Kringelback, M. L. (2005). The human orbitofrontal cortex: Linking reward to hedonic
experience. Nature Reviews Neuroscience, 6, 691-702.
Lanham, R. A. Jr., Weissenburger, J. E., Schwab, K. A., & Rosner, M. M. (2000). A longitudinal

145
investigation of the concordance between individuals with traumatic brain injury and
family or friend ratings on the Katz adjustment scale. Journal of Head Trauma
Rehabilitation, 15, 1123-1138.
Laviola, G., Macri, S., Morley-Fletcher, S., & Adriani, W. (2003). Risk-taking behavior
in adolescent mice: Psychobiological determinants and early epigenetic influence.
Neuroscience and Biobhevioral Reviews, 27, 19-31.
Leblanc, N., Chen, S., Swank, P. R., Ewing-Cobbs, L., Barnes, M., Dennis, M., et al. (2005)
Response inhibition after traumatic brain injury (TBI) in children: impairment and
recovery. Developmental Neuropsychology, 28, 829-848.
Leung, H., & Cai, W. (2007). Common and differential ventrolateral prefrontal activity
during inhibition of hand and eye movements. Neuroscience and Biobehavioral
Reviews, 27, 9893-9900.
Levin, H. H., Culhane, K. A., Hartmann, J., Evankovich, K., & Mattson, A. J. (1991).
Developmental changes in performance on tests of purported frontal lobe
functioning. Developmental Neuropsychology, 7, 377-395.
Levin, H. S., Culhane, K. A., Mendelsohn, D., Lilly, M. A., Bruce, D., Fletcher, J. M., et al.,
(1993). Cognition in relation to magnetic resonance imaging in head-injured children and
adolescents. Archives of Neurology, 50, 897-905.
Levin, H., Hanten, G., Max, J., Li, X., Swank, P., Ewing-Cobbs, L., Dennis, M., et al. (2007).
Symptoms of attention-deficit/hyperactivity disorder following traumatic brain injury in
children. Journal of Developmental and Behavioral Pediatrics, 28, 108-118.

146
Levin, H. S., Hanten, G., Zhang, L., Swank, P. R., & Hunter, J. (2004). Selective impairment of
inhibition after TBI in children. Journal of Clinical and Experimental Neuropsychology,
26, 589-597.
Levy, Y. & Ebstein, R. P. (2008). Research review: crossing syndrome boundaries in the search
for brain endophenotypes. Journal of Child Psychology and Psychiatry, 50, 657-668.
Lijffijt, M., Kenemans, J. L., Verbaten, M. N., & van Engeland, H. (2005). A meta-analytic
review of stopping performance in attention-deficit/hyperactivity disorder: deficient
inhibitory motor control? Journal of Abnormal Psychology, 114, 216-222.
Liston, C., Watts, R., Tottenham, N., Davidson, M. C., Niogi, S., Ulug, A. M., et al.
(2006). Frontostriatal microstructure modulates efficient recruitment of cognitive
control. Cerebral Cortex, 16, 553-560.
Loeber, R., Green, S. M., Lahey, B. B., Stouthamer-Loeber, M. (1991). Differences and
similarities between children, mothers, and teachers as informants on disruptive child
behavior. Journal of Abnormal Child Psychology, 19, 75-95.
Logan, G. D. (1994). On the ability to inhibit thought and action: A users' guide to the
stop signal paradigm. In D. Dagenbach & T. H. Carr (Eds.), Inhibitory processes in
attention, memory, and language, (pp. 189-239). San Diego: Academic Press.
Logan, G. D., & Cowan, W. B. (1984). On the ability to inhibit thought and action: A
theory of an act of control. Psychological Review, 91, 295-327.
Luman, M., Oosterlaan, J., Knol, D. L., & Sergeant, J. A. (2008). Decision-making in ADHD:

147
sensitive to frequency but blind to the magnitude of penalty. Journal of Child Psychology
and Psychiatry, 49, 712-722.
Luman, M., Oosterlaan, J., & Sergeant, J. A. (2005). The impact of reinforcement contingencies
on AD/HD: a review and theoretical appraisal. Clinical Psychology Review, 25, 183-213.
Mahalick, D. M., Carmel, P. W., Greenberg, J. P., Molofsky, W., Brown, J. A., Heary, R. G., et
al. (1998). Psychopharmacologic treatment of acquired attention disorders in children
with brain injury. Pediatric Neurosurgery, 29, 121-126.
Malhi, P., Singhi, P., & Sidhu, M. (2008). Impact of parent and teacher concordance on
diagnosing attention deficit hyperactivity disorder and its sub-types. Indian Journal of
Pediatrics, 75, 223-228.
Mangeot, S., Armstrong, K., Colvin, A. N., Yeates, K. O., & Taylor, H. G. (2002). Long-term
executive function deficits in children with traumatic brain injuries: assessment using the
Behavior Rating Inventory of Executive Function (BRIEF). Child Neuropsychology, 8,
271-284.
Max, J. E., Lansing, A. E., Koele, S. L., Castillo, C. S., Bokura, H., Schachar, R., et al. (2004).
Attention deficit hyperactivity disorder in children and adolescents following traumatic
brain injury. Developmental Neuropsychology, 25, 159-177.
Max, J. E., Lindgren, S. D., Knutson, C., Pearson, C. S., Ihrig, D., & Welborn, A. (1998). Child
and adolescent traumatic brain injury: correlates of disruptive behaviour disorders. Brain
Injury, 12, 41-52.

148
Max, J. E., Schachar, R. J., Levin, H. S., Ewing-Cobbs, L., Chapman, S. B., Dennis, M., et al.
(2005a). Predictors of attention-deficit/hyperactivity disorder within 6 months after
pediatric traumatic brain injury. Journal of the American Academy of Child and
Adolescent Psychiatry, 44, 1032-1040.
Max, J. E., Schachar, R. J., Levin, H. S., Ewing-Cobbs, L., Chapman, S. B., Dennis, M., et al.
(2005b) Predictors of secondary attention-deficit/hyperactivity disorder in children and
adolescents 6 to 24 months after traumatic brain injury. J Am Acad Child Adolesc
Psychiatry 44:1041-1049.
May, J. C., Delgado, M. R., Dahl, R. W., Stenger, V. A., Ryan, N. D., Fiez, J. A., et al.
(2004). Event-related functional magnetic resonance imaging of reward-related
brain circuitry in children and adolescents. Biological Psychiatry, 55, 359-366.
McAllister, T. W., Sparling, M. B., Flashman, L. A., & Saykin, A. J. (2001). Neuroimaging
findings in mild traumatic brain injury. Journal of Clinical and Experimental
Neuropsychology, 23, 775-791.
McAlonan, G. M., Cheung, V., Cheung, C., Chua, S. E., Murphy, D. G., Suckling, J., et al.
(2007). Mapping brain structure in attention deficit-hyperactivity disorder: a voxel-based
MRI study of regional grey and white matter volume. Psychiatry Research, 154, 171-180.
McAuley, T., Chen, S., Goos, L, Schachar, R., & Crosbie, J. (2010). Is the behavior rating
inventory of executive function more strongly associated with measures of impairment or
executive function? Journal of the International Neuropsychological Society, 16, 495-
505.

149
McCauley, S. R., McDaniel, M. A., Pedroza, C., Chapman, S. B., & Levin, H. S. (2009).
Incentive effects on event-based prospective memory performance in children and
adolescents with traumatic brain injury. Neuropsychology, 23, 201-209.
McClure, S. M., Berns, G. S., & Montague, P. R. (2003). Temporal prediction errors in a
passive learning task activate human striatum. Neuron, 38, 339-346.
McKinlay, A., Grace, R., Horwood, J., Fergusson, D., & MacFarlane, M. (2009). Adolescent
psychiatric symptoms following preschool childhood mild traumatic brain injury:
evidence form a birth cohort. Journal of Head Trauma Rehabilitation, 24, 221-227.
Meng, S. Z., Ozawa, Y., Itoh, M., & Takashima, S. (1999). Developmental and age-
related changes of dopamine transporter, and dopamine D1 and D2 receptors in
human basal ganglia. Brain Research, 843, 136-144.
Menon, V., Adleman, N. E., White, C. D., Glover, G. H., & Reiss, A. L. (2001). Error-
related brain activation during a GO/NoGO response inhibition task. Human Brain
Mapping, 12, 131-143.
Miller, E. K., & Cohen J. D. (2001). An integrative theory of prefrontal cortex function. Annual
Review of Neuroscience, 24, 167-202.
Mink, J. (1996). The basal ganglia: focused selection and inhibition of competing motor
programs. Progress in Neurobiology, 50, 381-425.
Murray, D. W, Kollins, S. H., Hardy, K. K., Abikoff, H. B., Swanson, J. M., Cunningham, C., et
al. (2007). Parent and teacher ratings of attention-deficit/hyperactivity disorder symptoms
in the Preschoolers with Attention-Deficit/Hyperactivity Disorder Treatment Study

150
(PATS). Journal of Child and Adolescent Psychopharmacology, 17, 605-620.
O’Doherty, J. P., Deichmann, R., Critchley, H. D., & Dolan, R. J. (2002). Neural
responses during anticipation of a primary taste reward. Neuron, 33, 815-826.
O’Doherty, J. P, Kringelbach, M. L., Rolls, E. T., Hornak, J., & Andrews, C. (2001).
Abstract reward and punishment representations in the human orbitofrontal
cortex. Nature Neuroscience, 4, 95-102.
O’Keeffee, F., Dockree, P., Moloney, P., Caron, S., & Robertson, I. H. (2007). Awareness of
deficits in traumatic brain injury: a multidimensional approach to assessing metacognitive
knowledge and online-awareness. Journal of the International Neuropsychological
Society, 13, 38-49.
Oosterlaan, J., & Sergeant, J. A. (1998). Effects of reward and response cost on response
inhibition in AD/HD, disruptive, anxious, and normal children. Journal of
Abnormal Child Psychology, 26, 161-174.
Ornstein, T. J., Levin, H. S., Chen, S., Hanten, G., Ewing-Cobbs, L., Dennis, M., et al. (2009).
Performance monitoring in children following traumatic brain injury. Journal of Child
Psychology and Psychiatry, 50, 506-513.
Padmala, S., & Pessoa, L. (2010). Interactions between cognition and motivation during
response inhibition. Neuropsychologia, 48, 558-565.
Powell, J. M., Machamer, J. E., Temkin, N. R., Dikmen, S. S. (2001). Self-report of extent of
recovery and barriers to recovery after traumatic brain injury: a longitudinal study.
Archives of Physical Medicine and Rehabilitation, 82, 1025-1030.

151
Prigatano, G. P., Borgaro, S., Baker, J., & Wethe, J. (2005). Awareness and distress after
traumatic brain injury: a relative’s perspective. Journal of Head Trauma Rehabilitation,
20, 359-367.
Quay, H. C. (1997). Inhibition and attention deficit hyperactivity disorder. Journal of Abnormal
Child Psychology, 25, 7-13.
Rieger, M., Gauggel, S., Burmeister, K. (2003). Inhibition of ongoing responses following
frontal, nonfrontal, and basal ganglia lesions. Neuropsychology, 17, 272-282.
Rolls, E. T. (2000). The orbitofrontal cortex and reward. Cerebral Cortex, 10, 284-294.
Roncadin, C., Pascual-Leone, J., Rich, J. B., & Dennis, M. (2007). Developmental
relations between working memory and inhibitory control. Journal of the
International Neuropsychological Society, 13, 59-67.
Rubia, K., Russell, T., Overmeyer, S., Brammer, M. J., Bullmore, E. T., Sharma, T., et
al., (2001). Mapping motor inhibition: Conjuctive brain activations across different
versions of Go/No-Go and Stop tasks. Neuroimage, 12, 250-261.
Rubia, K., Smith, A. B., Brammer, M. J., & Taylor, E. (2003). Right inferior prefrontal
cortex mediates response inhibition while mesial prefrontal cortex is responsible for
error detection. Neuroimage, 30, 351-358.
Rubia, K., Smith, A., & Taylor, E. (2007). Performance of children with attention deficit
hyperactivity disorder (ADHD) on a test battery of impulsiveness. Child
Neuropsychology, 13, 276-304.
Rubia, K., Smith, A. B., Woolley, J., Nosarti, C., Heyman, I., Taylor, E., et al. (2006).

152
Progressive increase of frontostriatal brain activation from childhood to adulthood during
event-related tasks of cognitive control. Human Brain Mapping, 27, 973-993.
Rubia, K., Overmeyer, S., Taylor, E., Brammer, M., Williams, S. C., Simmons, A., et al. (1999).
Hypofrontality in attention deficit hyperactivity disorder during higher-order motor
control: a study with functional MRI. American Journal of Psychiatry, 156, 891-896.
Rubia, K., Cubillo, A., Smith, A. B., Woolley, J., Heyman, I., & Brammer, M. J. (2010).
Disorder-specific dysfunction in right inferior prefrontal cortex during two inhibition
tasks in boys with attention-deficit hyperactivity disorder compared to boys with
obsessive-compulsive disorder. Human Brain Mapping, 31, 287-299.
Schachar, R. J., Chen, S., Logan, G. D., Ornstein, T. J., Crosbie, J., Ickowicz, A. et al. (2004a).
Evidence for an error monitoring deficit in attention deficit hyperactivity disorder. J
Abnormal Child Psychology 32, 285-293.
Schachar, R., Tannock, R., Marriott, M., & Logan, G. (1995). Deficient inhibitory control in
attention deficit hyperactivity disorder. Journal of Abnormal Child Psychology, 23, 411-
437.
Schachar, R., Levin, H. S., Max, J. E., Purvis, K., & Chen, S. (2004b). Attention deficit
hyperactivity disorder symptoms and response inhibition after closed head injury
in children: Do preinjury behavior and injury severity predict outcome?
Developmental Neuropsychology, 25, 179-198.
Schachar, R., Logan, G. D., Robaey, P., Chen, S., Ickowicz, A., & Barr, C. (2007).
Restraint and cancellation: multiple inhibition deficits in attention deficit

153
hyperactivity disorder. Journal of Abnormal Child Psychology, 35, 229-238.
Scheres, A., Oosterlaan, J., & Sergeant, J. A. (2001). Response inhibition in children with
DSM-IV subtypes of AD/HD and related disruptive disorders: the role of reward.
Child Neuropsychology, 7, 172-189.
Schneider, W., Vise, M., Lockl, K., & Nelson, T. O. (2000). Developmental trends in children’s
memory monitoring: Evidence from a judgment-of-learning task. Cognitive Development,
15, 115-134.
Schultz, W. (2000). Multiple reward signals in the brain. Nature Reviews Neurosicence,
1, 199-207.
Schultz, W. (2006). Behavioral theories and the neurophysiology of reward. Annual
Reviews in Psychology, 57, 87-115.
Schultz, W. (1997). Dopamine neurons and their role in reward mechanisms. Current Opinions
in Neurobiology,7, 191-197.
Schultz, W., Dayan, P., & Montague, P. R. (1997). A neural substrate of prediction and
reward. Science, 275, 1593-1599.
Segawa, M. (2000). Development of the nigrostriatal dopamine neuron and the pathways
in the basal ganglia. Brain Development, 22, S1-S4.
Seidman, L. J., Valera, E. M., Makris, N., Monuteaux, M. C., Boriel, D. L., Kelkar, K., et al.
(2006). Dorsolateral prefrontal and anterior cingulate cortex volumetric abnormalities in
adults with attention-deficit/hyperactivity disorder identified by magnetic resonance
imaging. Biological Psychiatry, 60, 1071-1080.

154
Sesma, H. W., Slomine, B. S., Ding, R., McCarthy, M. L., & Children’s Health After Trauma
(CHAT) Study Group (2008). Executive functioning in the first year after pediatric
traumatic brain injury. Pediatrics, 121, e1696-e1695.
Shanahan, M. A., Pennington, B. F., & Willcutt, E. W. (2008). Do motivational
incentives reduce the inhibition deficit in ADHD? Developmental
Neuropsychology, 33, 137-159.
Sherer, M., Bergloff, P., Levin, E., High, W. M. Jr., Oden, K. E., & Nick, T. G (1998). Impaired
awareness and employment outcome after traumatic brain injury. Journal of Head
Trauma Rehabilitation, 13, 52-61.
Shuster, J. & Toplack, M. E. (2009). Executive and motivational inhibition: Associations
with self-report measures related to inhibition. Consciousness and Cognition, 18,
471-480.
Slomine, B. S., Salorio, C. F., Grados, M. A., Vasa, R. A., Christensen, J. R., & Gerring, J. P.
(2005). Differences in attention, executive functioning, and memory in children with and
without ADHD after severe traumatic brain injury. Journal of the International
Neuropsychological Society, 11, 645-653.
Slusarek, M., Velling, S., Bunk, D., & Eggers, C. (2001). Motivational effects on
inhibitory control in children with ADHD. Journal of the American Academy of
Child and Adolescent Psychiatry, 40, 355-363.
Smith, E. E., & Jonides, J. (1998). Neuroimaging analyses of human working memory.

155
Proceedings of the National Academy of Sciences of the United States of America, 95,
12061-12068.
Sonuga-Barke, E. J. (2002). Psychological heterogeneity in AD/HD—a dual pathway model of
behaviour and cognition. Behavioural Brain Research, 130, 29-36.
Sowell, E. R., Thompson, P. M., Holmes, C. J., Jernigan, T. L., & Toga, A. W. (1999). In
vivo evidence for post-adolescent brain maturation in frontal and striatal regions.
Nature Neuroscience, 2, 859-861.
Sowell, E. R., Thompson, P. M., Welcome, S. E., Henkenius, A. L., Toga, A. W., & Peterson, B.
S. (2003) Cortical abnormalities in children and adolescents with attention-deficit
hyperactivity disorder. Lancet, 362, 1699-1707.
Spatt, J., Zebenholzer, K., & Oder, W. (1997). Psychosocial long-term outcome of severe head
injury as perceived by patients, relatives, and professionals. Acta Neurologia
Scandinavica, 95, 173-179.
Spear, L. P. (2000). The adolescent brain and age-related behavioral manifestations.
Neuroscience and Biobehavioral Reviews, 24, 417-463.
Sprafkin, J., Gadow, K. D., Salisbury, H., Schneider, J., & Loney, J. (2002). Further evidence of
reliability and validity of the Child Symptom Inventory-4: parent checklist in clinically
referred boys. Journal of Clinical Child and Adolescent Psychology, 31, 513-524.
Stevens, J., Quittner, A. L., Zuckerman, J. B., & Moore, S. (2002). Behavioral inhibition, self-
regulation of motivation, and working memory in children with attention deficit
hyperactivity disorder. Developmental Neuropsychology, 21, 117-139.

156
Strohle, A., Stoy, M., Wrase, J., Schwarzer, S., Schlagenhauf, F., Huss, M., et al. (2007). Reward
anticipation and outcomes in adult males with attention-deficit/hyperactivity disorder.
Neuroimage, 29, 966-972.
Sullivan, J. R. & Riccio, C. A. (2007). Diagnostic group differences in parent and teacher ratings
on the BRIEF and Conners’ scales. Journal of Attention Disorders, 11I, 398-406.
Tamm, L. & Carlson, C. L. (2007). Task demands interact with the single and combined effects
of medication and contingencies on children with ADHD. Journal of Attention Disorders,
10, 372-380.
Taylor, H. G., Yeates, K. O., Wade, S. L., Drotar, D., Stancin, T., & Minich, N. (2002). A
prospective study of short- and long-term outcomes after traumatic brain injury in
children: behavior and achievement. Neuropsychology, 16, 15-27.
Toglia, J. & Kirk, U. (2000). Understanding awareness deficits following brain injury.
NeuroRehabilitation, 15, 57-70.
Toplak, M. E., Bucciarelli, S. M., Jain, U., & Tannock, R. (2009). Executive functions:
performance-based measures and the behavior rating inventory of executive function
(BRIEF) in adolescents with attention deficit/hyperactivity disorder (ADHD). Child
Neuropsychology, 15, 53-72.
Toplak, M. E., Jain, U., & Tannock, R. (2005). Executive and motivational processes in
adolescents with Attention-Deficit-Hyperactivity Disorder (ADHD). Behavioral Brain
Function, 1, 8.
Tricomi, E. M., Delgado, M. R., & Fiez, J. A. (2004). Modulation of caudate activity by

157
action contingency. Neuron, 41, 281-292.
Vaidya, C. J., Austin, G., Kirkorian, G., Ridlehuber, H. W., Desmond, J. E., Glover, G. H., et al.
(1998)/ Selective effects of methylphenidate in attention deficit hyperactivity disorder: a
functional magnetic resonance study. Proceedings of the National Academy of Science
of the United States of America, 95, 14494-14499.
Vaidya, C. J., Bunge, S. A., Dudukovic, N. M., Zalecki, C. A., Elliott, G. R., & Gabrieli, J. D.
(2005). Altered neural substrates of cognitive control in childhood ADHD: evidence from
functional magnetic resonance imaging. American Journal of Psychiatry, 162, 1605-
1613.
Velanova, K., Wheeler, M. E., & Luna, B. (2009). The maturation of task set-related
activation supports late developmental improvements in inhibitory control. The
Journal of Neuroscience, 29, 12558-12567.
Vanderploeg, R. D., Belanger, H. G., Duchnick, J. D., & Curtiss, G. (2007). Awareness problems
following moderate to severe traumatic brain injury: Prevalence, assessment, methods,
and injury correlates. Journal of Rehabilitation Research and Development, 44, 937-950.
Van Meel, C. S., Oosterlaan, J., Heslenfeld, D. J., & Sergeant, J. A. (2005). Motivational effects
on motor timing in attention-deficit/hyperactivity disorder. American Academy of Child
and Adolescent Psychiatry, 44, 451-460.
Verbruggen, F., & Logan, G. D. (2008). Response inhibition in the stop-signal paradigm.
Trends in Cognitive Sciences, 12, 418-424.
Vriezen, E. R. & Pigott, S. E. (2002). The relationship between parental report on the BRIEF and

158
performance-based measures of executive function in children with moderate to severe
traumatic brain injury. Child Neuropsychology, 8, 296-303.
Wassenberg, R., Max, J. E., Lindgren, S. D. , & Schatz, A. (2004). Sustained attention in
children and adolescents after traumatic brain injury: relation to severity of injury, adaptive
functioning, ADHD and social background. Brain Injury, 18, 751-764.
Watanabe, J., Sugiura, M., Sato, K., Sato, Y., Maeda, Y., Matsue, Y., et al. (2002). The
human prefrontal and parietal association cortices are involved in NO-GO
performances: An event-related fMRI study. Neuroimage, 17, 1207-1216.
Willcutt, E. G., Hartung, C. M., Lahey, B. B., Loney, J., & Pelham, W. E. (1999). Utility of
behavior ratings by examiners during assessments of preschool children with attention-
deficit/hyperactivity disorder. Journal of Abnormal Child Psychology, 27, 463-472.
Willcutt, E. G., Doyle, A. E., Nigg, J. T., Faraone, S. V., & Pennington, B. F. (2005). Validity of
the executive function theory of attention-deficit/hyperactivity disorder: a meta-analytic
review. Biological Psychiatry, 57, 1336-1346.
Williams, B. R., Ponesse, J. S., Schachar, R., J., Logan, G. D., & Tannock, R. (1999).
Development of inhibitory control across the life span. Developmental
Psychology, 35, 205-213.
Wodka, E. L., Mahone, E. M., Blankner, J. G., Gidley Larson, J. C., Fotedar, S., Denckla,
M. B., et al. (2007). Evidence that response inhibition is a primary deficit in
ADHD. Journal of Clinical and Experimental Neuropsychology, 29, 345-356.
Xue, G., Aron, A. R., & Poldrack, R. A. (2008). Common neural substrates for inhibition

159
of spoken and manual responses. Cerebral Cortex, 18, 1923-1932.
Yeates, K. O., Armstrong, K., Janusz, J., Taylor, H. G., Wade, S., Stancin, T., & Drotar, D.
(2005). Long-term attention problems in children with traumatic brain injury. Journal of
the American Academy of Child and Adolescent Psychiatry, 44, 574-584.
Yeates, K. O. (2000). Closed-Head Injury. In K. O. Yeates, H. G. Taylor, M. D. Ris (Eds),
Pediatric Neuropsychology: Research, Theory, and Practice, (pp 92-105). New York: The
Guilford Press.

160
Appendices
Appendix 1
TBI Severity Coding
A. GLASGOW COMA SCALE RATING (lowest post-resuscitation rating, ± sedation)
3-5 Unconscious, coma, TBI grade 3 4
6-8 Clouded awareness to unconscious, TBI grade 2-3 3
9-12 Clouded awareness, cerebral contusion TBI grade 1-2 2
13-14 Cerebral commotion, TBI grade 1 1
15 Conscious 0
B. FOCAL CONTUSION/HEMORRHAGE (based on all available presurgical CT)
Focal intracranial contusion 1
Intraparenchymal/intracerebral 1
Intraventricular bleed 1
Subarachnoid hemorrhage 1
Subdural hemorrhage 1
Epidural hemorrhage 1
Extradural/extra-axial blood 1
None/not reported 0
TOTAL
GCS
(/4)

161
C. DIFFUSE INJURY (based on all available presurgical CT)
Punctate hemorrhage or petechia 1
Swelling/edema/effacement of sulci/attenuation of gray-white matter 1
Ventricles abnormal/compressed/displaced/asymmetric 1
Cisterns abnormal/obliterated/hyperintense 1
Midline shift 1
Brain herniation (uncal, subfalcine, other) 1
Mass effect 1
None/not reported 0
D. SKULL FRACTURE (based on all available presurgical CT)
Linear/depressed/diastased skull # in frontal, parietal, occipital, temporal bone 1
Basilar skull fracture 1
None or not reported 0
SEVERITY
TOTAL
( /20)

162
Appendix 2
A) Injury Severity Characteristics
GROUP SEVERITY DISTRIBUTION OF
GCS SCORES
TBI
MILD
15 (n = 14) 14 (n = 7)
MODERATE
11 (n = 2) 10 (n = 1) 9 (n = 1)
SEVERE
8 (n = 3) 7 (n = 3) 6 (n = 4) 5 (n = 2) 4 (n = 1) 3 (n =2)
S-ADHD MILD 15 (n = 4) 14 (n = 2)
MODERATE 12 (n = 1) 10 (n = 1)
SEVERE 3 (n = 1)

163
B) TBI and S-ADHD Group Characteristics
GROUP SEVERITY N AGE (SD) AGE AT
INJURY (SD)
TIME SINCE
INJURY (SD)
S-ADHD MILD 6 11.03 (2.6) 6.50 (2.5) 4.53 (1.3)
MODERATE 2 13.25 (2.23) 8.95 (2.6) 4.29 (0.4)
SEVERE 1 13.92 8.08 5.84
TBI MILD 21 11.90 (2.9) 8.19 (4.2) 3.71 (1.4)
MODERATE 4 12.17 (4.3) 7.71 (5.1) 4.46 (1.1)
SEVERE 15 11.84 (4.1) 8.51 (4.2) 3.33 (1.6)
Legend: N, number of participants; SD, standard deviation