Inhibition of the autocrine IL-6–JAK2–STAT3–calprotectin axis as ...
19
Inhibition of the autocrine IL-6–JAK2– STAT3–calprotectin axis as targeted therapy for HR - /HER2 + breast cancers Ruth Rodriguez-Barrueco, 1,8 Jiyang Yu, 2,3,8 Laura P. Saucedo-Cuevas, 1 Mireia Olivan, 1 David Llobet-Navas, 1 Preeti Putcha, 4 Veronica Castro, 4 Eva M. Murga-Penas, 4 Ana Collazo-Lorduy, 1 Mireia Castillo-Martin, 1 Mariano Alvarez, 2,3 Carlos Cordon-Cardo, 1 Kevin Kalinsky, 5 Matthew Maurer, 4,5 Andrea Califano, 2,3,6,7 and Jose M. Silva 1 1 Department of Pathology, Icahn School of Medicine at Mount Sinai, New York, New York 10029, USA; 2 Department of Systems Biology, Center for Computational Biology and Bioinformatics, 3 Herbert Irving Comprehensive Cancer Center, Columbia University, New York, New York 10032, USA; 4 Institute for Cancer Genetics, Department of Pathology, Irving Cancer Research Center, Columbia University, New York, New York 10032, USA; 5 Department of Medicine, Columbia University Medical Center, New York, New York 10032, USA; 6 Department of Biomedical Informatics, 7 Department of Biochemistry and Molecular Biophysics, Institute for Cancer Genetics, Columbia University, New York, New York 10032 HER2-positive (HER2 + ) breast adenocarcinomas are a heterogeneous group in which hormone receptor (HR) status influences therapeutic decisions and patient outcome. By combining genome-wide RNAi screens with regulatory network analysis, we identified STAT3 as a critically activated master regulator of HR - /HER2 + tumors, eliciting tumor dependency in these cells. Mechanistically, HR - /HER2 + cells secrete high levels of the interleukin-6 (IL-6) cytokine, inducing the activation of STAT3, which in turn promotes a second autocrine stimulus to increase S100A8/9 complex (calprotectin) production and secretion. Increased calprotectin levels activate signaling pathways involved in proliferation and resistance. Importantly, we demonstrated that inhibition of the IL-6–Janus kinase 2 (JAK2)–STAT3–calprotectin axis with FDA-approved drugs, alone and in combination with HER2 inhibitors, reduced the tumorigenicity of HR - /HER2 + breast cancers, opening novel targeted therapeutic opportunities. [Keywords: genetic screen; HER2; STAT3; tailored therapies; breast cancer] Supplemental material is available for this article. Received March 24, 2015; revised version accepted July 14, 2015. HER2/ERBB2 is a receptor tyrosine kinase found overex- pressed in 15%–20% of breast tumors (HER2 + tumors) (Hynes and Lane 2005). It belongs to a family of four recep- tors (EGFR/HER1, HER2, HER3, and HER4) involved in cell signaling networks regulating cell growth, survival, and differentiation (Hynes and Lane 2005; Lemmon and Schlessinger 2010). In general, EGFR/HER receptors are activated through dimerization, which is promoted by the binding of cognate growth factors. However, HER2 is a unique member of the family and does not rely on direct ligand binding for activation; instead, it is activated through heterodimerization with other EGFR/HER fami- ly members that are ligand-bound (Citri and Yarden 2006). When aberrantly overexpressed, HER2 is able to homodimerize and initiate proliferation and prosurvival signal transduction in a ligand-independent fashion (Citri and Yarden 2006). Despite the existence of several HER2-specific targeted therapies that have drastically improved the treatment of HER2 + patients (trastuzumab, lapatinib, TDM1, and per- tuzumab), tumor progression remains transient (Hynes and Lane 2005; Tagliabue et al. 2010). Thus, there is a need to find complementary, therapeutic targets that hold the potential for more effective treatments. Although, HER2 + tumors are commonly considered as a single entity, there is increasing evidence indicating that important intrinsic differences associated with hor- mone receptor (HR) status exist. Each of the two groups, HR + and HR − , represents about half of all HER2 + breast cancers. Compared with HR + /HER2 + , HR − /HER2 + tumors present worse histopathological characteristics (larger size, lymph node involvement, higher American Joint 8 These authors contributed equally to this work. Corresponding authors: [email protected], [email protected]. edu Article published online ahead of print. Article and publication date are online at http://www.genesdev.org/cgi/doi/10.1101/gad.262642.115. © 2015 Rodriguez-Barrueco et al. This article is distributed exclusively by Cold Spring Harbor Laboratory Press for the first six months after the full-issue publication date (see http://genesdev.cshlp.org/site/misc/ terms.xhtml). After six months, it is available under a Creative Commons License (Attribution-NonCommercial 4.0 International), as described at http://creativecommons.org/licenses/by-nc/4.0/. GENES & DEVELOPMENT 29:1631–1648 Published by Cold Spring Harbor Laboratory Press; ISSN 0890-9369/15; www.genesdev.org 1631 Cold Spring Harbor Laboratory Press on April 9, 2018 - Published by genesdev.cshlp.org Downloaded from
Transcript of Inhibition of the autocrine IL-6–JAK2–STAT3–calprotectin axis as ...
Inhibition of the autocrine IL-6–JAK2–STAT3–calprotectin axis as targetedtherapy for HR−/HER2+ breast cancersRuth Rodriguez-Barrueco,1,8 Jiyang Yu,2,3,8 Laura P. Saucedo-Cuevas,1 Mireia Olivan,1
David Llobet-Navas,1 Preeti Putcha,4 Veronica Castro,4 Eva M. Murga-Penas,4 Ana Collazo-Lorduy,1
Mireia Castillo-Martin,1 Mariano Alvarez,2,3 Carlos Cordon-Cardo,1 Kevin Kalinsky,5
Matthew Maurer,4,5 Andrea Califano,2,3,6,7 and Jose M. Silva1
1Department of Pathology, Icahn School of Medicine at Mount Sinai, New York, New York 10029, USA; 2Department of SystemsBiology, Center for Computational Biology and Bioinformatics, 3Herbert Irving Comprehensive Cancer Center, ColumbiaUniversity, New York, New York 10032, USA; 4Institute for Cancer Genetics, Department of Pathology, Irving Cancer ResearchCenter, ColumbiaUniversity, NewYork,NewYork 10032, USA; 5Department ofMedicine, ColumbiaUniversityMedical Center,New York, New York 10032, USA; 6Department of Biomedical Informatics, 7Department of Biochemistry and MolecularBiophysics, Institute for Cancer Genetics, Columbia University, New York, New York 10032
HER2-positive (HER2+) breast adenocarcinomas are a heterogeneous group in which hormone receptor (HR) statusinfluences therapeutic decisions and patient outcome. By combining genome-wide RNAi screens with regulatorynetwork analysis, we identified STAT3 as a critically activated master regulator of HR−/HER2+ tumors, elicitingtumor dependency in these cells. Mechanistically, HR−/HER2+ cells secrete high levels of the interleukin-6 (IL-6)cytokine, inducing the activation of STAT3, which in turn promotes a second autocrine stimulus to increaseS100A8/9 complex (calprotectin) production and secretion. Increased calprotectin levels activate signaling pathwaysinvolved in proliferation and resistance. Importantly, we demonstrated that inhibition of the IL-6–Janus kinase 2(JAK2)–STAT3–calprotectin axis with FDA-approved drugs, alone and in combination with HER2 inhibitors,reduced the tumorigenicity of HR−/HER2+ breast cancers, opening novel targeted therapeutic opportunities.
[Keywords: genetic screen; HER2; STAT3; tailored therapies; breast cancer]
Supplemental material is available for this article.
Received March 24, 2015; revised version accepted July 14, 2015.
HER2/ERBB2 is a receptor tyrosine kinase found overex-pressed in 15%–20% of breast tumors (HER2+ tumors)(Hynes and Lane 2005). It belongs to a family of four recep-tors (EGFR/HER1, HER2, HER3, and HER4) involved incell signaling networks regulating cell growth, survival,and differentiation (Hynes and Lane 2005; Lemmon andSchlessinger 2010). In general, EGFR/HER receptors areactivated through dimerization, which is promoted bythe binding of cognate growth factors. However, HER2 isa unique member of the family and does not rely on directligand binding for activation; instead, it is activatedthrough heterodimerization with other EGFR/HER fami-ly members that are ligand-bound (Citri and Yarden2006). When aberrantly overexpressed, HER2 is able tohomodimerize and initiate proliferation and prosurvivalsignal transduction in a ligand-independent fashion (Citriand Yarden 2006).
Despite the existence of several HER2-specific targetedtherapies that have drastically improved the treatment ofHER2+ patients (trastuzumab, lapatinib, TDM1, and per-tuzumab), tumor progression remains transient (Hynesand Lane 2005; Tagliabue et al. 2010). Thus, there is aneed to find complementary, therapeutic targets thathold the potential for more effective treatments.Although, HER2+ tumors are commonly considered as
a single entity, there is increasing evidence indicatingthat important intrinsic differences associated with hor-mone receptor (HR) status exist. Each of the two groups,HR+ and HR−, represents about half of all HER2+ breastcancers.Compared with HR+/HER2+, HR−/HER2+ tumors
present worse histopathological characteristics (largersize, lymph node involvement, higher American Joint
8These authors contributed equally to this work.Corresponding authors: [email protected], [email protected] published online ahead of print. Article and publication date areonline at http://www.genesdev.org/cgi/doi/10.1101/gad.262642.115.
© 2015 Rodriguez-Barrueco et al. This article is distributed exclusivelyby Cold Spring Harbor Laboratory Press for the first six months after thefull-issue publication date (see http://genesdev.cshlp.org/site/misc/terms.xhtml). After six months, it is available under a Creative CommonsLicense (Attribution-NonCommercial 4.0 International), as described athttp://creativecommons.org/licenses/by-nc/4.0/.
GENES & DEVELOPMENT 29:1631–1648 Published by Cold Spring Harbor Laboratory Press; ISSN 0890-9369/15; www.genesdev.org 1631
Cold Spring Harbor Laboratory Press on April 9, 2018 - Published by genesdev.cshlp.orgDownloaded from

Committee on Cancer [AJCC] stage, and higher histologi-cal grade) (Vaz-Luis et al. 2012).HR+/HER2+ tumors prefer-entially recur in bones, while there is a strong trend formore visceral metastases in the HR−/HER2+ cancers (Pal-uch-Shimon et al. 2009; Vaz-Luis et al. 2012). Moreover,despite a higher rate of pathologic complete responses(pCRs) to neoadjuvant chemotherapy (Hurley et al. 2006;Vaz-Luis et al. 2012), HR−/HER2+ patients still have an in-creased risk of death within 5 years of diagnosis (Vaz-Luiset al. 2012). Intrinsic differences betweenHR−/HER2+ andHR+/HER2+ breast cancers are also found at themolecularlevel, as highlighted by unsupervised cluster analysis ofgene expression profiles. The latter clearly identifies twodistinctHER2+ subtypes.Most tumors clinically classifiedas HR+/HER2+ fall in the luminal B subtype, while mostHR−/HER2+ tumors are part of the HER2-enriched sub-type (Perou et al. 2000; Sotiriou and Pusztai 2009).
Indeed, while HR+/HER2+ patients benefit from anti-hormonal and HER2 targeted therapies (Kaufman et al.2009), the outcome for HR−/HER2+ patients strongly de-pends on their response to chemotherapy as well as anti-HER2 therapy. Thus, to identify genes that represent nov-el mechanistic dependencies in HR−/HER2+ breast cancercells, we designed an integrative approach that combinesfunctional genomic (RNAi screens) (Luo et al. 2008; Silvaet al. 2008) and computational (Basso et al. 2005;Margolinet al. 2006; Carro et al. 2010; Lefebvre et al. 2010; Piovanet al. 2013) algorithms.
Our integrative analysis identified STAT3 as a de novomaster regulator (MR) gene associated with HER2-medi-ated transformation in HR− breast cancer cells. Impor-tantly, we demonstrate that aberrant STAT3 activity isnecessary to maintain the HR−/HER2+ tumor state, thusrepresenting a nononcogene dependency in these tumors.Mechanistically, we found that HR−/HER2+ breast tu-mors secrete high levels of interleukin-6 (IL-6). This auto-crine mechanism induces the activation of STAT3 via thecanonical Janus kinase 2 (JAK2)/STAT3 pathway. Aber-rant STAT3 activity induces up-regulation and secretionof the S100A8/9 complex (calprotectin), thus triggering asecond autocrine stimulus that enhances proliferationand survival. As a result, disruption of the “IL-6–JAK2–STAT3–S100A8/9 cascade” compromises HR−/HER2+
cell viability, suggesting that the components of this path-way represent putative therapeutic targets in HR−/HER2tumors. Importantly, small molecule inhibitors andblocking antibodies for components of this double auto-crine loop are already FDA-approved or in clinical trials.Here, we demonstrate that blocking the IL-6 receptor(IL-6R) with the humanized monoclonal antibody tocili-zumab (Patel and Moreland 2010; Navarro-Millan et al.2012), STAT3 inactivation with the dual JAK1/2 inhibitorruxolitinib (Mascarenhas and Hoffman 2012; Mesa et al.2012), or calprotectin inhibition with the small moleculeinhibitor tasquinimod (Dalrymple et al. 2007, 2012), aloneor in combination with anti-HER2 therapies, compromis-es the viability of HR−/HER2+ breast cancer cells. Theavailability of FDA-approved inhibitors to target this nov-elmechanism represents an exciting opportunity for rapidtranslation of these findings to the clinics.
Results
Genome-wide RNAi screens and MR analysisidentify STAT3 as an essential MR gene inHR−/HER2+ cells
To identify critical regulators of HR−/HER2+ breastcancer cell homeostasis, we developed an integrative ap-proach that combines pooled, genome-wide loss-of-func-tion studies and systems biology methods for the reverseengineering and interrogation of regulatory networks(Fig. 1A).
RNAi is a powerful genetic strategy to interrogate genefunction by loss-of-function studies. We (Silva et al. 2008;Rodriguez-Barrueco et al. 2013; Yu et al. 2013) and others(Luo et al. 2008; Schlabach et al. 2008) have developedRNAi-based genetic approaches to perform high-through-put (HTP) screens in mammalian systems. Using thistechnology, we performed genome-wide pooled RNAiscreens to find gene functions that are required to main-tain the homeostasis of HR− mammary epithelial cellstransformed by the oncogene HER2. However, RNAi-based screens suffer from high inherent noise and het-erogeneity that can compromise the effective validationof identified hits (Schultz et al. 2011). To reduce the can-didate gene list size while increasing its robustness, wedecided to combine our genetic screens with computa-tional approaches that are highly effective in identifyingMR genes of HR−/HER2+ tumors. These represent tran-scription factors (TFs) and signaling proteins (SPs) thatare mechanistic regulators of the genes that are differen-tially expressed between normal and transformed cellsfrom a repertoire of 780 expressed TFs and 2453 expressedSPs that are expressed in HR−/HER2+ tumors. This isaccomplished by using MARINa (Master Regulator In-ference Algorithm) (Carro et al. 2010; Lefebvre et al.2010; Piovan et al. 2013) to interrogate regulatory net-works (hereafter referred to as interactomes) inferred byARACNe (Algorithm for the Reconstruction of AccurateCellular Networks) (Basso et al. 2005; Margolin et al.2006) from a large, tumor-specific gene expression profiledata set. Importantly, we showed that 20%–30% of theMARINa-inferred MRs are essential for viability of thecells that they regulate (Carro et al. 2010; Piovan et al.2013), thus representing valuable tumor-specific targets.We speculated that inhibiting MRs that are computation-ally identified and also selected by the loss-of-functionscreen would impact HER2-mediated transformation ofHR− mammary epithelial cells.
As the experimental model for the RNAi screens, wechose mammary epithelial MCF-10A cells and an isogen-ic variant transformed with an oncogenic form of HER2(Wang et al. 2006), termed here MCF-10A/ErbB2∗. Thismodel system possesses several characteristics thatmake it useful for our purposes. MCF-10A is a spontane-ously immortalized, but nontransformed, human mam-mary epithelial cell line (Soule et al. 1990; Debnathet al. 2003). These cells exhibit numerous features ofnormal breast epithelium, including diploid chromosomegenotype, lack of tumorigenicity in nude mice, lack of an-chorage-independent growth, and dependence on growth
Rodriguez-Barrueco et al.
1632 GENES & DEVELOPMENT
Cold Spring Harbor Laboratory Press on April 9, 2018 - Published by genesdev.cshlp.orgDownloaded from
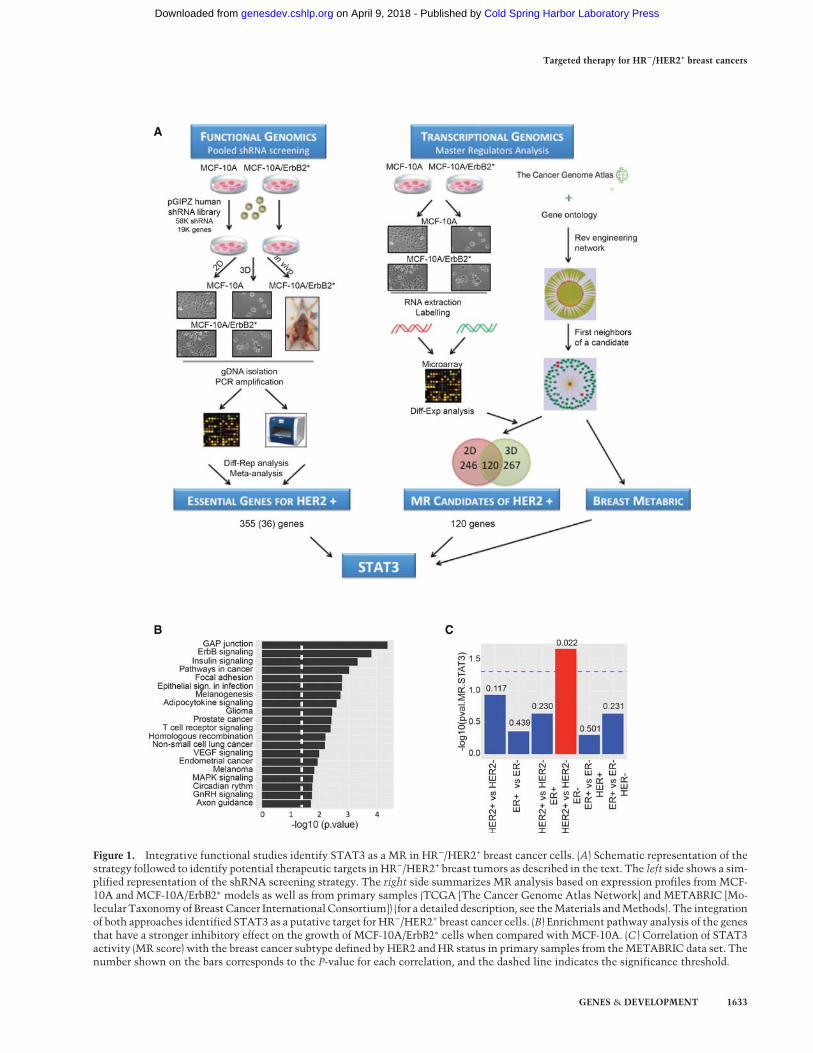
Figure 1. Integrative functional studies identify STAT3 as a MR in HR−/HER2+ breast cancer cells. (A) Schematic representation of thestrategy followed to identify potential therapeutic targets in HR−/HER2+ breast tumors as described in the text. The left side shows a sim-plified representation of the shRNA screening strategy. The right side summarizes MR analysis based on expression profiles from MCF-10A and MCF-10A/ErbB2∗ models as well as from primary samples (TCGA [The Cancer Genome Atlas Network] and METABRIC [Mo-lecular Taxonomyof Breast Cancer InternationalConsortium]) (for a detailed description, see theMaterials andMethods). The integrationof both approaches identified STAT3 as a putative target for HR−/HER2+ breast cancer cells. (B) Enrichment pathway analysis of the genesthat have a stronger inhibitory effect on the growth of MCF-10A/ErbB2∗ cells when compared with MCF-10A. (C ) Correlation of STAT3activity (MR score) with the breast cancer subtype defined by HER2 and HR status in primary samples from theMETABRIC data set. Thenumber shown on the bars corresponds to the P-value for each correlation, and the dashed line indicates the significance threshold.
Targeted therapy for HR−/HER2+ breast cancers
GENES & DEVELOPMENT 1633
Cold Spring Harbor Laboratory Press on April 9, 2018 - Published by genesdev.cshlp.orgDownloaded from
factors for proliferation and survival. In contrast, MCF-10A/ErbB2∗ cells are transformed and form tumors whenxenografted into immunocompromised mice. Important-ly, parental MCF-10A cells are HR−, and, when grownon basement membrane components (BCMs), these cellsactivate a morphogenetic program that induces the devel-opment of organotypic spheroid structures. Remarkably,this three-dimensional (3D) model bears a much closerresemblance to the in vivo epithelial context than classi-cal two-dimensional (2D) cultures (Debnath et al. 2002,2003).
Using this cell model, we completed three complemen-tary RNAi screens (Fig. 1A). In the first screen, wild-typeMCF-10A andMCF-10A/ErbB2∗ cells were grown on stan-dard tissue culture plates. In the second screen, these cellswere grown in the presence of BCM (extracellular matrix[ECM]-Matrigel) to form organotypic structures. Finally,we performed an in vivo screen by transplanting MCF-10A/ErbB2∗ cells into the mammary fat pads of immuno-compromised (SCID) mice. We reasoned that knockdownof genes that specifically compromised the viability ofHER2 transformed cells in all screens may representstrong tumor dependencies that are conserved indepen-dently of the conditions and platform. Metaanalysis iden-tified 355 genes fulfilling this criterion. Thirty-six of themwere TFs and/or signalingmolecules (Supplemental TableS1). Pathway analysis showed that, as expected, silencingcomponents of HER2 as well as canonical MAPK signal-ing have a stronger impact on the growth of MCF-10A/ErbB2∗ cells when compared with nontransformed MCF-10A (Fig. 1B; Supplemental Fig. S1A,B).
We then used MARINa to computationally identifycandidate MRs of HER2-mediated transformation ofMCF-10A/ErbB2∗ breast cancer cells (Fig. 1A). First, weanalyzed 359 gene expression profiles from TCGA (TheCancer Genome Atlas Network) primary breast cancersamples (The Cancer Genome Atlas Network 2012) toconstruct breast cancer-specific regulatory (11,415 nodesand 112,490 edges) and signaling (11,477 nodes and180,220 edges) networks using ARACNe, an informationtheory-based reverse-engineering approach (Basso et al.2005; Margolin et al. 2006). For SPs, we used ARACNeto identify theirmaximum information transfer (MIT) tar-gets, as previously done for the identification of AKT1 asthe MR of glucocorticoid resistance in T acute lympho-blastic leukemia (T-ALL) (Piovan et al. 2013). We then in-terrogated these interactomes with genes differentiallyexpressed in the MCF-10A versus MCF-10A/ErbB2∗ cells(in both 2D and 3D cultures) (see Supplemental TableS2) using MARINa to identify the transcriptional (Carroet al. 2010; Lefebvre et al. 2010; Aytes et al. 2014) and sig-naling (Piovan et al. 2013) MRs that are mechanistic regu-lators of HER2-dependent tumorigenesis in HR− cells.These analyses showed significant overlap ofMARINa-in-ferred MRs between the 2D and 3D experimental models(Fig. 1A). In fact, there was a dramatic increase comparedwith the poor overlap of signature genes, by conventionaldifferential expression analysis (Supplemental Fig. S1C).This suggests that, while the programs that affect HER2-mediated transformation in these two contexts are sub-
stantially different, their transcriptional and signaling reg-ulators are highly conserved.
Integration of 120 MRs predicted by systems biologyanalysis and 36 depleted candidates from metaanalysisof RNAi screens identified STAT3, AGRN, and GLRXas potential MRs of MCF-10A/ErbB2∗ tumorigenesis andthus as candidate therapeutic targets (Supplemental Fig.S1D). We further validated STAT3 andAGRN as essentialgenes in MCF-10A/ErbB2∗ cells using additional shRNAsthat efficiently silence these genes but were not includedin the initial pool library (Supplemental Fig. S1E). Individ-ual gene validation was performed through competitionassays. These assays are based on the ability of the shRNAvectors to coexpress the shRNA of interest and a fluores-cent protein. Cells expressing shRNAs were mixed in a50/50 ratio with parental cells, which did not expressthe hairpin; expression of the fluorescent reporter allowedus to track the ratio of shRNA/non-shRNA cells by flowcytometry (Supplemental Fig. S1E). Interestingly, STAT3and AGRN showed no differential expression in either2D or 3D, and conventional differential expression analy-sis could not identify them; however, MARINa analysissuccessfully inferred them as differentially activated (Sup-plemental Fig. S1D). This is a recurrent theme, as virtuallyall validatedMRs in other tumor contexts were not differ-entially expressed (Carro et al. 2010; Piovan et al. 2013).
Next, we evaluated the MR activity of STAT3 andAGRN in primary breast cancer samples. To avoid overfit-ting, we used a METABRIC (Molecular Taxonomy ofBreast Cancer International Consortium) data set (Curtiset al. 2012) independent of the TCGA data from whichthe networks were derived. When we compared all majorclinical subtypes based on HR and HER2 status, STAT3was the only one of the three MRs that consistentlyemerged as a HR−/HER2+-specific MR (Fig. 1C; Supple-mental Fig. S1F).
STAT3 silencing compromised HR−/HER2+ breast cancercell viability in vitro and in vivo
An increasing amount of evidence suggests a pivotal rolefor STAT3 as a regulator of cancer cell homeostasis (Dar-nell 2005; Weerasinghe et al. 2007). This includes breastcancers, where high levels of phosphorylated STAT3 (p-STAT3) are found in ∼50% of cases and are associatedwith high expression levels of growth factor receptorsEGFR and HER2 (Berclaz et al. 2001; Berishaj et al. 2007;Hartman et al. 2011). The canonical JAK/STAT pathwayconsists of a series of membrane receptors that bind to afamily of cytoplasmic kinases, the JAKs, for signal trans-duction (Rawlings et al. 2004). Association of the receptorwith its respective cytokine/ligand enables the transduc-tion of the intracellular signal by phosphorylating and ac-tivating TFs called STATs.
As shown by interactome analysis and RNAi screens,multiple evidences suggest that the JAK/STAT pathwayis activated in HER2 transformed MCF-10A cells. Indeed,we found that STAT1, STAT3, and STAT5 phosphoryla-tion increased upon overexpression of both wild-typeErbB2 and the mutant ErbB2∗ variant used in our screens
Rodriguez-Barrueco et al.
1634 GENES & DEVELOPMENT
Cold Spring Harbor Laboratory Press on April 9, 2018 - Published by genesdev.cshlp.orgDownloaded from
(Fig. 2A; Wang et al. 2006). Additionally, a reporter assayin which luciferase expression was controlled by the pro-moter of the bona fide endogenous STAT3 target SOCS3(Wormald and Hilton 2004) showed a more than fourfoldincrease in MCF-10A/ErbB2∗ compared with parentalMCF-10A (Fig. 2B). Consistently, we found that endoge-nous SOCS3 mRNA levels increased (fivefold) in ErbB2∗
transformed MCF-10A cells in both 2D and 3D cultures(Fig. 2B). Critically, STAT3 activity was exclusivelylinked to increased phosphorylation and not increasedexpression (Fig. 2A). Remarkably, robust activation ofSTAT3 was observed when MCF-10A cells were trans-formed with HER2 but not any common breast cancerdrivers (Supplemental Fig. S2A). Overall, these data dem-onstrate that HER2 overexpression selectively activatesthe JAK/STAT pathway.Next, we further validated STAT3 essentiality in MCF-
10A/ErbB2∗ cells. To prevent uncontrolled cell viabilityloss when silencing STAT3, we opted for a doxycycline(Dox)-inducible RNAi system. This system coexpressesthe shRNA of interest (shRNA sequence from the poolscreens) and a red fluorescent protein (RFP) under con-trolled conditions (addition of Dox to the culture medi-um). The expression of the fluorescent reporter was usedfor tracking shRNA-expressing cells in competition as-says, as described above (Supplemental Fig. S1E). As be-fore, competition assays showed a progressive loss ofMCF-10A/ErbB2∗ cells following STAT3 silencing, whileno significant effect was observed in MCF-10A cells (Fig.2C). Loss of cell viability was not limited to standard cul-ture conditions and was also evident in in semisolid agarmedium and 3D cultures (Fig. 2D,E). STAT3 silencingaffected MCF-10A/ErbB2∗ cell growth not only in vitrobut also in vivo, and STAT3 knockdown cells showed re-duced tumorigenicity in orthotopic NOD scid mouse xe-nografts (Fig. 2F). Since parental MCF-10A cells are nottumorigenic, we used MDA-MB-231 cells to study the ef-fect of STAT3 silencing on HER2WT cells that lack signifi-cant STAT3 activation in vivo (Supplemental Fig. S2B). Asexpected, tumors generated by transplanting MDA-MB-231 breast cancer cells were not affected by STAT3 knock-down (Fig. 2G; Supplemental Fig. S2C,D).
STAT3 activation in HER2+ breast cancer is mediated byautocrine secretion of IL-6 and JAK2 activation
We next investigated the mechanisms that may mediateaberrant STAT3 activation. By comparing gene expressionprofiles of parental and HER2 transformed MCF-10Acells, we found strong up-regulation of multiple interleu-kin molecules and their receptors (Fig. 3A). Remarkably,the most up-regulated interleukin (>20-fold) was IL-6,a bona fide STAT3 activator (Rawlings et al. 2004; Murray2007). High levels of IL-6 mRNA were reflected in a21-fold increase in the levels of secreted IL-6 into theculture medium (Fig. 3B). Remarkably, incubation ofMCF-10A cells with MCF-10A/ErbB2∗ conditioned medi-um strongly induced STAT3 phosphorylation, an effectthat was abrogated by the presence of IL-6R-blocking anti-bodies (tocilizumab) (Fig. 3C; Supplemental Fig. S3A;
Navarro-Millan et al. 2012). These data confirm previousobservations linkingHER2-mediated transformationwitha profound transcriptional activation of inflammatoryprograms (Hartman et al. 2011).Phosphorylation and activation of STAT proteins is
mostly mediated by JAK family members (Rawlingset al. 2004; Murray 2007). However, in cancer cells withconstitutive growth factor receptor activation, it hasalso been shown that STAT proteins can also be activatedby SRCkinases (Garcia et al. 2001). Thus, we used specificpan-inhibitors of JAK and SRC protein families as wellas the dual EGFR/HER2 inhibitor lapatinib to identifythe specific mechanism of STAT3 activation (Fig. 3D).These experiments showed that, in breast cancer cells,short-term inhibition of JAK proteins completely blockedSTAT3 activation, while inhibition of SRC or HER2did not have any effect. Note that we interrogated bothMCF-10A overexpressing the oncogenic (MCF-10A/ErbB2∗) and the wild-type HER2 (MCF-10A/ErbB2) genebecause the mutant HER2 variant has been found to beresistant to lapatinib (Wang et al. 2006). Next, we usedspecific inhibitors of different JAK family members toidentify which one of them was responsible for aberrantSTAT3 activation, revealing JAK2 as its upstream activat-ing kinase (Fig. 3E).Remarkably, when we studied STAT3 phosphorylation
levels (pY705) and IL-6 expression in primary breast tu-mors using the RPPA and mRNA expression data fromtheTCGAbreast cancer data set (TheCancerGenomeAt-las Network 2012), ER−/HER+ tumors presented both thehighest levels of IL-6 expression (Fig. 3F) and the strongestcorrelation between IL-6 and STAT3 phosphorylation(Fig. 3G).
S100A8 and S100A9 are direct targets of STAT3, playinga critical role in HER2-mediated oncogenesis
When activated, STAT3 works as a TF regulating targetgene expression on the chromatin. In order to identify rel-evant targets of STAT3 in the ER−/HER2+ context, wecompared gene expression profiles of MCF-10A cells fol-lowing STAT3 activation (±IL-6 in the culture mediumfor 6 h) as well as of MCF-10A/ErbB2∗ cells followingshRNA-mediated STAT3 silencing (Fig. 4A; SupplementalFig. S4A). To identify targets that are differentially ex-pressed following STAT3 activation, we selected genesthat fulfill two criteria: (1) They are up/down-regulatedmore than twofold, with P < 0.05 in MCF-10A cellsafter IL-6 exposure, and (2) they showed an opposite trendin MCF-10A/ErbB2∗ cells following RNAi-mediatedSTAT3 silencing. As expected, STAT3 as well as SOCS3were at the top of the list. Remarkably, other top genes in-cluded S100A8 and S100A9 (Fig. 4A; Supplemental Fig.S4B). High mRNA levels of S100A8/9 in our MCF-10Amodel led to high protein levels both in the cell extractand secreted in the medium (Fig. 4B).S100A8 and S100A9 are small cytoplasmic calcium-
binding proteins that heterodimerize to form a complex(calprotectin) that is secreted into the intercellular space(Gebhardt et al. 2006; Ehrchen et al. 2009). Although
Targeted therapy for HR−/HER2+ breast cancers
GENES & DEVELOPMENT 1635
Cold Spring Harbor Laboratory Press on April 9, 2018 - Published by genesdev.cshlp.orgDownloaded from

Figure 2. RNAi-mediated silencing of STAT3 expression reduces the tumorigenicity of HR−/HER2+ breast cancer cells. (A) Western blotanalysis of STAT1, STAT3, and STAT5 phosphorylation in MCF-10A cells and its isogenic variants overexpressing ErbB2 wild type andthe oncogenic ErbB2YVMA mutant (ErbB2∗). (B) The left panel shows a scheme of the SOCS3 promoter subcloned upstream of the fireflyluciferase reporter gene. Blue squares indicate the predicted STAT-binding sequences present in the promoter. The graph below shows thenormalized luciferase signal when the SOCS3 promoter construct was transduced into MCF-10A and MCF-10A/ErbB2∗ cells. The rightpanel shows the comparison of endogenous SOCS3 expression levels between MCF-10A/ErbB2∗ and parental MCF-10A cells grown inplastic culture plates (2D) and Matrigel (3D). (C ) Competition assay to determine the viability of MCF-10A models when STAT3 was si-lenced. Western blot analysis of STAT3 expression after the induction of silencing shRNAs with doxycycline (Dox) is shown in the toppanel. pTRIPZ represents the control vector. The bottom panel shows the relative abundance of MCF-10A and MCF-10A/ErbB2∗ cellsexpressing control or STAT3 shRNAs (RFP+) through time after they were mixed at a 50:50 ratio with nontransduced cells at the initialtime point. Dashed lines correspond to the cells where STAT3 expression has been reduced by the induction of shRNA. Colony formationassay in agar (D) and Matrigel (E) of MCF-10A/ErbB2∗ cells expressing Dox-inducible STAT3 shRNAs or the control vector pTRIPZ. Pic-tures were taken 6 d after plating of the cells. (F ) Tumor growth of MCF-10A/ErbB2∗-expressing control (pTRIPZ) or shRNAs againstSTAT3 (shSTAT3) when orthotopically injected into the intramammary fat pad (IMFP) of immunosuppressed SCID mice (N = 5). Thebox plot represents theweight of the tumors after their extraction. The left panel shows the results whenDox is administered in the drink-ing water immediately after the transplantation. The right panel shows the tumor growth when Dox is added after the tumor reached 0.3cc (indicated by the arrows). (G) Tumor growth and finalweightwhenMDA-MB-231 cells are othotopically injected into the IMFPof SCIDmice and Dox is administered from the day of surgery. n = 5. (∗) P < 0.05.
1636 GENES & DEVELOPMENT
Rodriguez-Barrueco et al.
Cold Spring Harbor Laboratory Press on April 9, 2018 - Published by genesdev.cshlp.orgDownloaded from
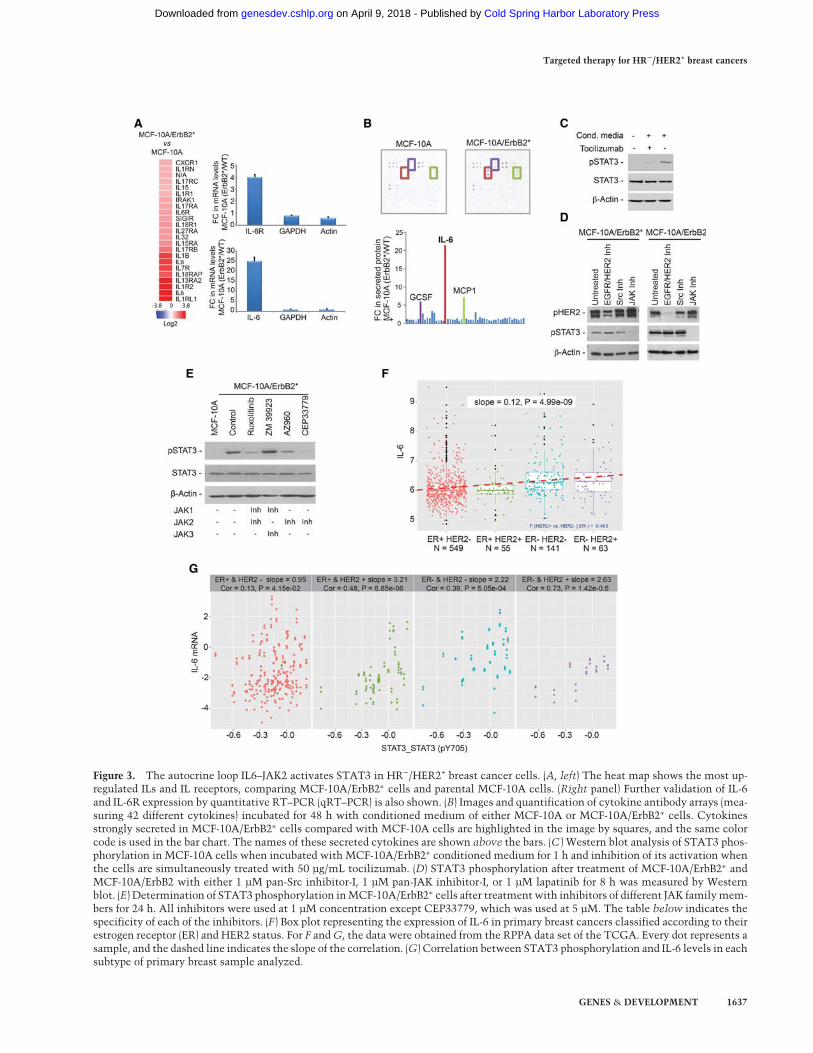
Figure 3. The autocrine loop IL6–JAK2 activates STAT3 in HR−/HER2+ breast cancer cells. (A, left) The heat map shows the most up-regulated ILs and IL receptors, comparing MCF-10A/ErbB2∗ cells and parental MCF-10A cells. (Right panel) Further validation of IL-6and IL-6R expression by quantitative RT–PCR (qRT–PCR) is also shown. (B) Images and quantification of cytokine antibody arrays (mea-suring 42 different cytokines) incubated for 48 h with conditioned medium of either MCF-10A or MCF-10A/ErbB2∗ cells. Cytokinesstrongly secreted in MCF-10A/ErbB2∗ cells compared with MCF-10A cells are highlighted in the image by squares, and the same colorcode is used in the bar chart. The names of these secreted cytokines are shown above the bars. (C ) Western blot analysis of STAT3 phos-phorylation in MCF-10A cells when incubated with MCF-10A/ErbB2∗ conditioned medium for 1 h and inhibition of its activation whenthe cells are simultaneously treated with 50 µg/mL tocilizumab. (D) STAT3 phosphorylation after treatment of MCF-10A/ErbB2∗ andMCF-10A/ErbB2 with either 1 µM pan-Src inhibitor-I, 1 µM pan-JAK inhibitor-I, or 1 µM lapatinib for 8 h was measured by Westernblot. (E) Determination of STAT3 phosphorylation inMCF-10A/ErbB2∗ cells after treatmentwith inhibitors of different JAK familymem-bers for 24 h. All inhibitors were used at 1 µM concentration except CEP33779, which was used at 5 µM. The table below indicates thespecificity of each of the inhibitors. (F ) Box plot representing the expression of IL-6 in primary breast cancers classified according to theirestrogen receptor (ER) and HER2 status. For F andG, the data were obtained from the RPPA data set of the TCGA. Every dot represents asample, and the dashed line indicates the slope of the correlation. (G) Correlation between STAT3 phosphorylation and IL-6 levels in eachsubtype of primary breast sample analyzed.
Targeted therapy for HR−/HER2+ breast cancers
GENES & DEVELOPMENT 1637
Cold Spring Harbor Laboratory Press on April 9, 2018 - Published by genesdev.cshlp.orgDownloaded from
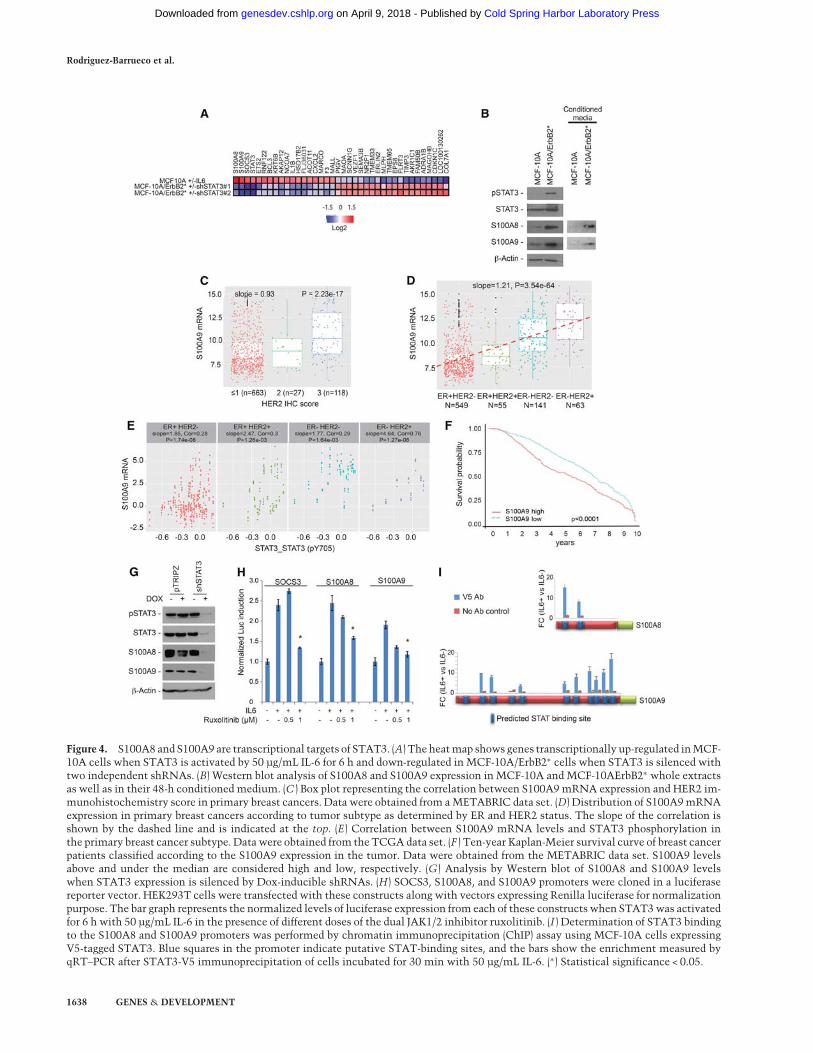
Figure 4. S100A8 and S100A9 are transcriptional targets of STAT3. (A) The heatmap shows genes transcriptionally up-regulated inMCF-10A cells when STAT3 is activated by 50 µg/mL IL-6 for 6 h and down-regulated in MCF-10A/ErbB2∗ cells when STAT3 is silenced withtwo independent shRNAs. (B) Western blot analysis of S100A8 and S100A9 expression in MCF-10A and MCF-10AErbB2∗ whole extractsas well as in their 48-h conditioned medium. (C ) Box plot representing the correlation between S100A9mRNA expression and HER2 im-munohistochemistry score in primary breast cancers. Data were obtained from aMETABRIC data set. (D) Distribution of S100A9mRNAexpression in primary breast cancers according to tumor subtype as determined by ER and HER2 status. The slope of the correlation isshown by the dashed line and is indicated at the top. (E) Correlation between S100A9 mRNA levels and STAT3 phosphorylation inthe primary breast cancer subtype. Datawere obtained from the TCGA data set. (F ) Ten-year Kaplan-Meier survival curve of breast cancerpatients classified according to the S100A9 expression in the tumor. Data were obtained from the METABRIC data set. S100A9 levelsabove and under the median are considered high and low, respectively. (G) Analysis by Western blot of S100A8 and S100A9 levelswhen STAT3 expression is silenced by Dox-inducible shRNAs. (H) SOCS3, S100A8, and S100A9 promoters were cloned in a luciferasereporter vector. HEK293T cells were transfected with these constructs along with vectors expressing Renilla luciferase for normalizationpurpose. The bar graph represents the normalized levels of luciferase expression from each of these constructs when STAT3was activatedfor 6 h with 50 µg/mL IL-6 in the presence of different doses of the dual JAK1/2 inhibitor ruxolitinib. (I ) Determination of STAT3 bindingto the S100A8 and S100A9 promoters was performed by chromatin immunoprecipitation (ChIP) assay using MCF-10A cells expressingV5-tagged STAT3. Blue squares in the promoter indicate putative STAT-binding sites, and the bars show the enrichment measured byqRT–PCR after STAT3-V5 immunoprecipitation of cells incubated for 30 min with 50 µg/mL IL-6. (∗) Statistical significance < 0.05.
1638 GENES & DEVELOPMENT
Rodriguez-Barrueco et al.
Cold Spring Harbor Laboratory Press on April 9, 2018 - Published by genesdev.cshlp.orgDownloaded from
they have been mainly studied in the context of the im-mune system, S100A8/9 have been found to be up-regulat-ed in multiple solid tumors and associated with poorprognosis (Arai et al. 2008; Kawai et al. 2011; Grebhardtet al. 2014).Next, we analyzed the METABRIC data to investigate
whether overexpression of S100A8/9 was observed inER−/HER2+ primary breast tumors. These studies re-vealed that mRNA levels of S100A8 and S100A9 arestrongly correlated (r = 0.94), suggesting coregulation (Sup-plemental Fig. S4C). Furthermore, mRNA expression ofS100A8/9was strongly correlatedwithHER2 pathologicalstatus (Fig. 4C). Importantly, ER−/HER2+ tumors present-ed the highest S100A8/9 expression (Fig. 4D) as well as thehighest correlation between STAT3 phosphorylation andS100A8/9 mRNA expression (the RPPA data set fromthe TCGA breast cancer studywas used here) (Fig. 4E). Re-markably, high S100A8/9 expression was associated withlower breast cancer patient survival (Fig. 4F).Taken together, these data suggest that expression of
S100A8/9 in ER−/HER2+ tumor cells is intimately linkedto aberrant STAT3 activation. To validate the dependencyof S100A8 and S100A9 expression on STAT3 activity,we performed RNAi-mediated STAT3 silencing inMCF-10A/ErbB2∗ cells. As expected, STAT3 knockdownstrongly reduced S100A8 and S100A9 expression (Fig.4G). Both the S100A8 and S100A9 promoters present sev-eral predicted STAT-binding sequences. Thus, we clonedthe S100A8, S100A9, and SOCS3 (positive control) pro-moters to drive expression of a luciferase reporter (Supple-mental Fig. S4D) and evaluated reporter gene inductionupon STAT3 activation. HEK293T cells transfected withthe reporters showed strong induction of luciferase ex-pression after addition of IL-6 to the medium (Fig. 4H;Supplemental Fig. S4E). Importantly, the effect was fullyabrogated when STAT3 activation was prevented by theJAK1/2 inhibitor ruxolitinib (Fig. 4H; Mascarenhas andHoffman 2012; Mesa et al. 2012). To further investigatewhether regulation of S100A8 and S100A9 occurs by di-rect binding of STAT3 to their promoters, we performedchromatin immunoprecipitation (ChIP) assays. For this,we first engineered MCF-10A cells expressing V5-taggedSTAT3. After checking that STAT3-V5 behaves identical-ly to endogenous STAT3 (it is enriched in the nucleus af-ter IL-6 exposure) (Supplemental Fig. S4F), STAT3-V5 wasimmunoprecipitated from MCF-10A cells cultured in theabsence/presence of IL-6. Next, the presence of STAT3 inS100A8 and S100A9 promoters was evaluated by quanti-tative PCR (qPCR). These studies revealed a significantenrichment of STAT3 in both promoters upon IL-6-medi-ated STAT3 activation (Fig. 4I).Since S100A8/9 are part of the transcriptional program
up-regulated by STAT3 in ER−/HER2+ mammary tumors,we asked whether S100A8/9 are relevant for the essentialrole of STAT3 in these cancer cells. Remarkably, shRNAstargeting both S100A8 and S100A9 were also positive hitsin our RNAi screen (Fig. 5A). To study the role of S100A8and S100A9, we first engineeredMCF-10A/ErbB2∗ cells toexpress shRNAs targeting both genes under inducibleconditions (Supplemental Fig. S5A). We then studied
how S100A8/9 silencing impacts the tumorigenic poten-tial of these cells. S100A8/9 silencing phenocopied the le-thal effect induced by STAT3 inhibition in vitro (Fig. 5B,C) and in vivo when MCF-10A/ErbB2∗ variants wereorthotopically injected in NOD scid mice (Fig. 5D).Next, we reasoned that, if STAT3-dependent lethality
in MCF-10A/ErbB2∗ cells is mediated at least in part byloss of S100A8/9 expression, then re-expression of thesegenes should rescue the phenotype. To test this scenario,we first transduced MCF-10A/ErbB2∗-expressing STAT3targeting shRNAs with viral constructs expressingS100A8 and S100A9. As these viral constructs coexpressthe cDNAs and fluorescent reporters, we were able touse FACS to separate the transduced cells in bins express-ing different amounts of S100A8 and S100A9 based onfluorescence intensity (Supplemental Fig. S5B). Finally,we also selected sorted cells expressing S100A8 andS100A9 at the levels found in parental MCF-10A/ErbB2∗
cells (Supplemental Fig. S5B). When the tumorigenic po-tential of these cells was assayed, we found that re-ex-pression of S100A8/9 restored the tumorigenic potentialof MCF-10A/ErbB2∗ cells expressing STAT3 targetingshRNAs in vitro (Fig. 5B) and in vivo (Fig. 5D).Because S100A8/9 are proinflammatory cytokines that
influence the recruitment of immune cells (Gebhardtet al. 2006; Ehrchen et al. 2009), in order to eliminate, asmuch as possible, any contribution of the immune systemin the growth of the tumor cells, we repeated the abovestudies using NOD scidγ mice (deficient in B and T cells,macrofages, NK cells, and complement). These experi-ments confirmed the importance of the autocrine sti-mulus mediated by S100A8/9 (Fig. 5E). Finally, we alsoasked whether up-regulation of S100A8/9 alone in non-transformed cells is able to transform them. Experimentalup-regulation of S100A8 and S100A9 to the levels ob-served in HER2 transformed MCF-10A cells by using theviral cDNA constructs described above did not provide at-tachment-independent growth abilities to MCF-10A cells(Supplemental Fig. S5C).
S100A8 and S100A9 play a pivotal role in HER2-mediated oncogenesis by promoting key proliferativeand survival signal transduction pathways
After demonstrating the critical role of S100A8/9 inHER2-mediated oncogenesis in our HR−/HER2+ model,we decided to investigate the specific mechanism. Expo-sure to S100A8/9 has been shown to activate canonicalsignal transduction pathways that are involved in tumor-igenesis by increasing proliferation, resistance to stress,and protein synthesis (Gebhardt et al. 2006; Hermaniet al. 2006; Ichikawa et al. 2011; Acharyya et al. 2012).As the activation of particular signaling is often context-dependent, we first decided to evaluate the activation ofthese pathways in our model after cells are exposed to re-combinant S100A8/9 protein.In order to expose cells to physiologic S100A8/9 protein
levels, we first measured the amount of S100A8/9proteins in the culture medium of MCF-10A/ErbB2∗
cells. Conditioned media with different numbers of cells
Targeted therapy for HR−/HER2+ breast cancers
GENES & DEVELOPMENT 1639
Cold Spring Harbor Laboratory Press on April 9, 2018 - Published by genesdev.cshlp.orgDownloaded from
growing exponentially for 48 hwere concentrated, and thelevels of S100A8/9 proteins were estimated by titratingrecombinant protein through a standard curve (Supple-mental Fig. S6A). This study revealed that ∼75–150 ng ofS100A8 and S100A9 was present in the conditionedmedia per 1 × 10⁵ cells (Supplemental Fig. S6A). Whenan equivalent amount of recombinant proteins was addedto the culture medium of MCF-10A cells, we observed arobust increase in the phosphorylation levels (activation)of ERK1/2 and AKT and a minor effect on phosphor-
P70S6K (Fig. 6A). Furthermore, MCF-10A cell prolife-ration increased (Fig. 6B). It is well established that activa-tion of the above-mentioned pathways is directly achievedby EGFR/HER familymembers without the need for auto-crine stimulation (Moasser 2007). Thus, it was importantto investigate whether the activation mediated by theS100A8/9 autocrine mechanism is a way to amplifythe signal and achieve the high levels observed in HER2+
cells or is simply redundant. To answer this question,we blocked S100A8/9 activity in MCF-10A/ErbB2∗ cells
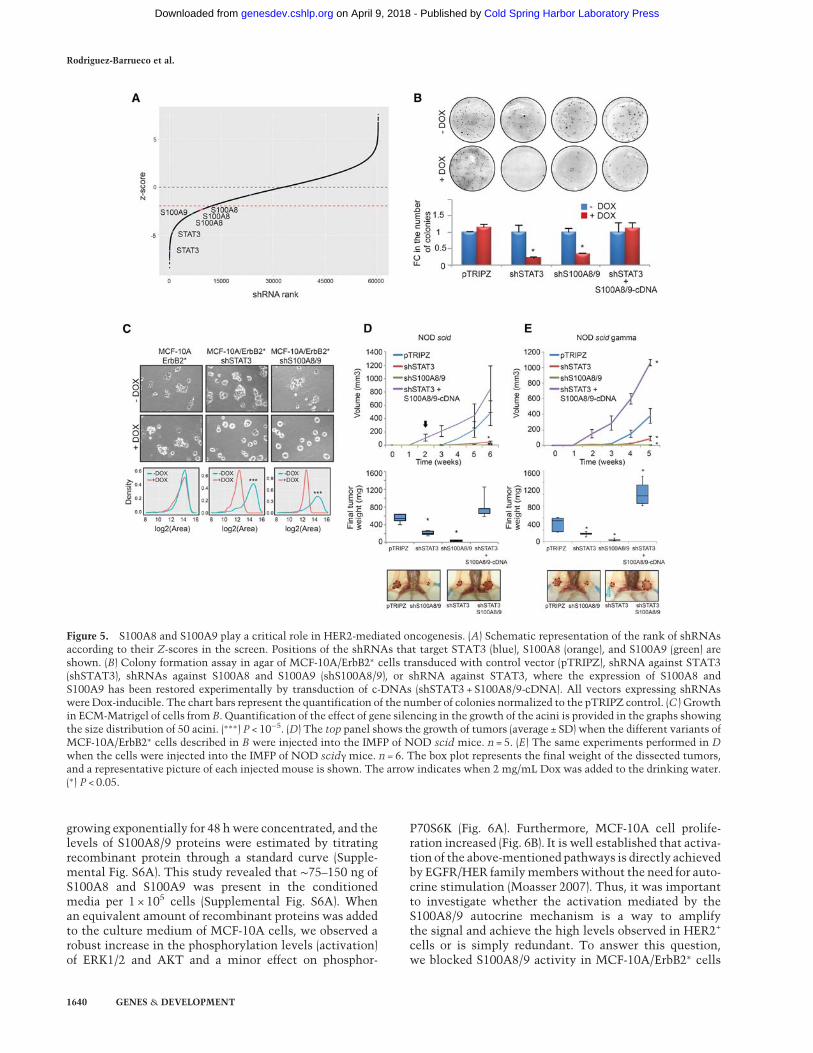
Figure 5. S100A8 and S100A9 play a critical role in HER2-mediated oncogenesis. (A) Schematic representation of the rank of shRNAsaccording to their Z-scores in the screen. Positions of the shRNAs that target STAT3 (blue), S100A8 (orange), and S100A9 (green) areshown. (B) Colony formation assay in agar of MCF-10A/ErbB2∗ cells transduced with control vector (pTRIPZ), shRNA against STAT3(shSTAT3), shRNAs against S100A8 and S100A9 (shS100A8/9), or shRNA against STAT3, where the expression of S100A8 andS100A9 has been restored experimentally by transduction of c-DNAs (shSTAT3 + S100A8/9-cDNA). All vectors expressing shRNAswere Dox-inducible. The chart bars represent the quantification of the number of colonies normalized to the pTRIPZ control. (C ) Growthin ECM-Matrigel of cells fromB. Quantification of the effect of gene silencing in the growth of the acini is provided in the graphs showingthe size distribution of 50 acini. (∗∗∗) P < 10−5. (D) The top panel shows the growth of tumors (average ± SD) when the different variants ofMCF-10A/ErbB2∗ cells described in B were injected into the IMFP of NOD scid mice. n = 5. (E) The same experiments performed in Dwhen the cells were injected into the IMFP of NOD scidγ mice. n = 6. The box plot represents the final weight of the dissected tumors,and a representative picture of each injected mouse is shown. The arrow indicates when 2 mg/mL Dox was added to the drinking water.(∗) P < 0.05.
Rodriguez-Barrueco et al.
1640 GENES & DEVELOPMENT
Cold Spring Harbor Laboratory Press on April 9, 2018 - Published by genesdev.cshlp.orgDownloaded from
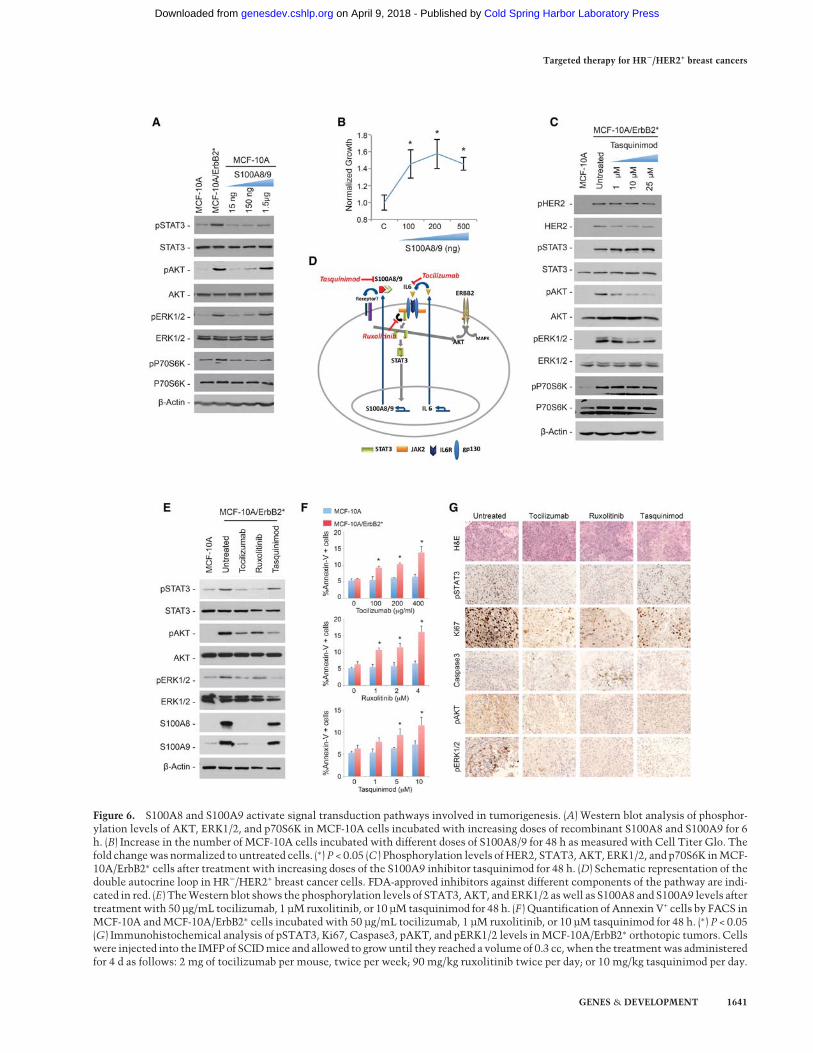
Figure 6. S100A8 and S100A9 activate signal transduction pathways involved in tumorigenesis. (A) Western blot analysis of phosphor-ylation levels of AKT, ERK1/2, and p70S6K in MCF-10A cells incubated with increasing doses of recombinant S100A8 and S100A9 for 6h. (B) Increase in the number of MCF-10A cells incubated with different doses of S100A8/9 for 48 h as measured with Cell Titer Glo. Thefold changewas normalized to untreated cells. (∗) P < 0.05 (C ) Phosphorylation levels of HER2, STAT3, AKT, ERK1/2, and p70S6K inMCF-10A/ErbB2∗ cells after treatment with increasing doses of the S100A9 inhibitor tasquinimod for 48 h. (D) Schematic representation of thedouble autocrine loop in HR−/HER2+ breast cancer cells. FDA-approved inhibitors against different components of the pathway are indi-cated in red. (E) TheWestern blot shows the phosphorylation levels of STAT3,AKT, and ERK1/2 aswell as S100A8 and S100A9 levels aftertreatmentwith 50 µg/mL tocilizumab, 1 µM ruxolitinib, or 10 µM tasquinimod for 48 h. (F ) Quantification of Annexin V+ cells by FACS inMCF-10A andMCF-10A/ErbB2∗ cells incubated with 50 µg/mL tocilizumab, 1 µM ruxolitinib, or 10 µM tasquinimod for 48 h. (∗) P < 0.05(G) Immunohistochemical analysis of pSTAT3, Ki67, Caspase3, pAKT, and pERK1/2 levels inMCF-10A/ErbB2∗ orthotopic tumors. Cellswere injected into the IMFPof SCIDmice and allowed to growuntil they reached a volumeof 0.3 cc, when the treatmentwas administeredfor 4 d as follows: 2 mg of tocilizumab per mouse, twice per week; 90 mg/kg ruxolitinib twice per day; or 10 mg/kg tasquinimod per day.
Targeted therapy for HR−/HER2+ breast cancers
GENES & DEVELOPMENT 1641
Cold Spring Harbor Laboratory Press on April 9, 2018 - Published by genesdev.cshlp.orgDownloaded from

using the specific S100A9 inhibitor tasquinimod (Dalrym-ple et al. 2007, 2012). We found that, despite having thesame HER2+ phosphorylation levels as untreated cells,blocking S100A8/9 significantly reduced the activationlevels of AKT, while less pronounced effects were ob-served for ERK1/2 and P70S6K (Fig. 6C).
Our studies suggest the existence of a critical double au-tocrine stimulus in HR−/HER2+ breast cancer cells. Thefirst stimulus is defined by the secretion of IL-6 to activateSTAT3 through the canonical JAK pathway. Once activat-ed, STAT3 induces up-regulation of the S1008/9 dimer,which is secreted and augments AKT activation and, toa lesser extent, ERK1/2 and P70S6K (Fig. 6D). Importantly,several compounds targeting key players of this double au-tocrine loop are already available in the clinic, providingexciting therapeutic opportunities (Fig. 6D; SupplementalFig. S6B). Tocilizumab is a humanized antibody againstthe IL-6R. It is FDA-approved for the treatment of rheuma-toid arthritis (RA) (Patel and Moreland 2010; Navarro-Millan et al. 2012). Ruxolitinib is a JAK1/2 dual inhibitorthat has been recently FDA-approved to specifically treatpatients with myelofibrosis (Mascarenhas and Hoffman2012;Mesa et al. 2012). Tasquinimod binds to and inhibitsthe interactions of S100A9 and is actively being investi-gated for the treatment of solid tumors, mostly prostatecancers (Dalrymple et al. 2007, 2012).
Thus, we next studied the use of these inhibitors to re-duce the levels of S100A8 and S100A9 proteins as well asthe activation of the signaling cascades described above.As expected, treating MCF-10A/ErbB2∗ cells with tocili-zumab or ruxolitinib strongly inhibited the expressionof S100A8 and S100A9 (Fig. 6E), and each of the three in-hibitors significantly attenuated phosphor-AKT levels.Remarkably, treatment with these inhibitors was asso-ciated with increased apoptosis in MCF-10A/ErbB2∗ cellscompared with the parental MCF-10A line (Fig. 6F). Im-portantly, we observed comparable results in vivo whenorthotopic models of MCF-10A/ErbB2∗ were treated withthe same inhibitors (Fig. 6G; Supplemental Fig. S6C).
Inhibition of IL-6R/JAK2/S100A9 represents a noveltarget for patient-oriented therapies in HR−/HER2+
breast cancers
The studies described above suggest that inhibition ofIL-6R/JAK2/S100A9 represents a novel, mechanisticallymotivated anti-cancer strategy in HR−/HER2+ breast can-cers. In order to further investigate this possibility, wecompleted a series of in vitro and in vivo studies to evalu-ate tumor growth treatment with the above-described in-hibitors. First, we selected a set of nine additional breastcancer cell lines, representing the four subtypes (HR+/HER2−, HR+/HER2+, HR−/HER2−, and HR−/HER2+) (Fig.7A; Supplemental Fig. S7A). In these cells, we studiedSTAT3 phosphorylation as well as S100A8 and S100A9protein expression. Consistent with our model, HR−/HER2+ cell lines presented both the highest phospho-STAT3 levels and the highest S100A8 and S100A9 expres-sion (Fig. 7A). Furthermore, exposing HR−/HER2+ HCC-1954 cells to tocilizumab, ruxolitinib, and tasquinimod
reduced the levels of p-STAT3, P-AKT, and S100A8/9,as seen in the MCF-10A/ErbB2∗ model (SupplementalFig. S7B).
All of these cell models were then plated in Matrigeland individually treated with tocilizumab, ruxolitinib,and tasquinimod. As expected, growth of HR−/HER2+
cells was significantly affected by these treatments, whileminor effects were observed in the remaining cells lines(Fig. 7B shows only HR−/HER2+ cell lines; SupplementalFig. S7C,D shows the full set). Interestingly, in additionto the HR−/HER2+ models, HCC-70 was the only cellline that was strongly affected when treated with ruxoliti-nib.Thiswas not surprising, as these cells have high levelsof p-STAT3 (Fig. 7A). Finally, to transition our studies toan in vivo context,MCF-10A/ErbB2∗ cells were orthotopi-cally transplanted into the mammary glands of NOD scidmice and individually treated with each of the three in-hibitors. As seen in vitro, treatment with tocilizumab,ruxolitinib, and tasquinimod significantly reduced thetumorigenic potential of MCF-10A/ErbB2 cells in vivo(Fig. 7C; Supplemental Fig. S7E). To further completeour preclinical studies, seven different orthotopically in-jected cell lines in NOD scid mice representing the foursubtypes, a patient-derived HR−/HER2+ xenograft, and atransgenic HER2+ breast cancer mouse model, FVB-Tg(MMTV-Erbb2)NK1Mul/J (http://jaxmice.jax.org/strain/005038.html), were treated with ruxolitinib . HER2+mod-els were also treated with the humanized anti-HER2 anti-body trastuzumab (Lewis Phillips et al. 2008) and thecombination of trastuzumab plus ruxolitinib. For thesein vivo studies, ruxolitinib was selected over tasquinimodand tociluzumab because it is already FDA-approved forcancer treatment. These studies confirmed that responseto ruxolitinib as a sole anti-cancer agent in all engraftedHR−/HER2+ cells (MCF-10A/ErbB2∗, HCC-1954, and thepatient-derived xenograft [PDX]) was statistically signifi-cant (Fig. 7D,E; Supplemental Fig. S7G,H). Interestingly,the HR+/HER2+ line MDA-MB-361 showed minimal re-sponse (not statistically significant) to individual treat-ment with ruxolitinib and trastuzumab, which becamestatistically significant when the animals were treatedin combination. The enhanced anti-tumor effect whentrastuzumab and ruxolitinib were used in combinationwas confirmed in both HR+/HER2+ and HR−/HER2+ mod-els in vivo (Fig. 7D,E; Supplemental Fig. S7G,H). As seenin vitro, the HCC-70 model also responded to ruxolitinibtreatment in vivo.
Transgenic FVB-Tg(MMTV-Erbb2)NK1Mul/J femalesdeveloped multifocal tumors after pregnancy, and, con-sistent with the xenograft models, we observed thattreatmentwith ruxolitinib reduced both the number of tu-mors formed and the growth of individual tumor masses(Fig. 7F).
Discussion
Breast cancer is not a homogeneousmalignancy but rathera heterogeneous group of tumor diseases (Bertos andPark 2011). Hyperactivation of HER2 has been classically
Rodriguez-Barrueco et al.
1642 GENES & DEVELOPMENT
Cold Spring Harbor Laboratory Press on April 9, 2018 - Published by genesdev.cshlp.orgDownloaded from
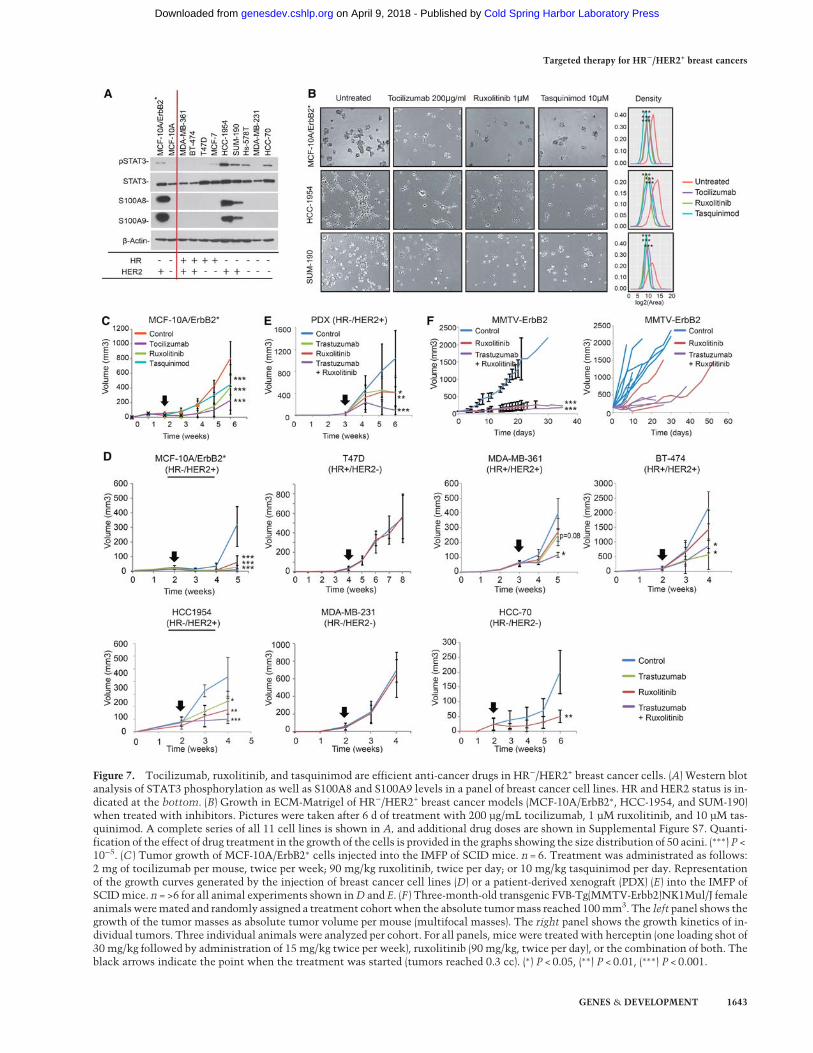
Figure 7. Tocilizumab, ruxolitinib, and tasquinimod are efficient anti-cancer drugs in HR−/HER2+ breast cancer cells. (A) Western blotanalysis of STAT3 phosphorylation as well as S100A8 and S100A9 levels in a panel of breast cancer cell lines. HR and HER2 status is in-dicated at the bottom. (B) Growth in ECM-Matrigel of HR−/HER2+ breast cancer models (MCF-10A/ErbB2∗, HCC-1954, and SUM-190)when treated with inhibitors. Pictures were taken after 6 d of treatment with 200 µg/mL tocilizumab, 1 µM ruxolitinib, and 10 µM tas-quinimod. A complete series of all 11 cell lines is shown in A, and additional drug doses are shown in Supplemental Figure S7. Quanti-fication of the effect of drug treatment in the growth of the cells is provided in the graphs showing the size distribution of 50 acini. (∗∗∗) P <10−5. (C ) Tumor growth of MCF-10A/ErbB2∗ cells injected into the IMFP of SCID mice. n = 6. Treatment was administrated as follows:2 mg of tocilizumab per mouse, twice per week; 90 mg/kg ruxolitinib, twice per day; or 10 mg/kg tasquinimod per day. Representationof the growth curves generated by the injection of breast cancer cell lines (D) or a patient-derived xenograft (PDX) (E) into the IMFP ofSCIDmice. n = >6 for all animal experiments shown inD and E. (F ) Three-month-old transgenic FVB-Tg(MMTV-Erbb2)NK1Mul/J femaleanimalsweremated and randomly assigned a treatment cohort when the absolute tumormass reached 100mm3. The left panel shows thegrowth of the tumor masses as absolute tumor volume per mouse (multifocal masses). The right panel shows the growth kinetics of in-dividual tumors. Three individual animals were analyzed per cohort. For all panels, mice were treated with herceptin (one loading shot of30 mg/kg followed by administration of 15 mg/kg twice per week), ruxolitinib (90 mg/kg, twice per day), or the combination of both. Theblack arrows indicate the point when the treatment was started (tumors reached 0.3 cc). (∗) P < 0.05, (∗∗) P < 0.01, (∗∗∗) P < 0.001.
GENES & DEVELOPMENT 1643
Targeted therapy for HR−/HER2+ breast cancers
Cold Spring Harbor Laboratory Press on April 9, 2018 - Published by genesdev.cshlp.orgDownloaded from
considered one of the determinants that define ∼20% ofall breast cancers, and, consequently, HER2+ breast can-cers have been managed in the clinic as a homogeneousgroup (Hynes and Lane 2005; Lemmon and Schlessinger2010). However, emerging evidence has challenged thisview, revealing important intrinsic differences associatedwith HR status (Perou et al. 2000; Paluch-Shimon et al.2009; Sotiriou and Pusztai 2009; Vaz-Luis et al. 2012).
We and others have previously described screeningstrategies based on genetic (Silva et al. 2008; Marcotteet al. 2012) and small molecule (Gupta et al. 2009; Heiseret al. 2012) inhibitors aimed to identify the Achilles’ heelof tumor cells based on specific aspects of their biology.Similarly, we showed that analysis of regulatory networkscan identify MR genes that are necessary and sufficientfor tumor survival (Carro et al. 2010; Piovan et al. 2013;Aytes et al. 2014). Here, we describe the design and re-sults of the first integrative analysis that combinesboth methodologies to identify novel therapeutic targetsfor HR−/HER2+ breast cancers. Our studies identifiedthat HR−/HER2+ breast cancers robustly activate theIL-6–JAK2–STAT3–calprotectin cascade. Importantly,we also demonstrated that the tumorigenic potential ofthese cells is dependent on the activation of this autocrinecascade.
Activation of STAT3 in metastatic progression is wellestablished and has been associated with myeloid cell re-cruitment (Chang et al. 2013), angiogenesis (Chang et al.2013), epithelial–mesenchymal transition (Wendt et al.2014), and migration (Barbieri et al. 2010a). However, itspotential role in the maintenance of breast cancer cell ho-meostasis is not clear. While STAT3 is dispensable to ini-tiate tumorigenesis in HER2-driven mouse mammarymodels (Barbieri et al. 2010b), blocking STAT3 signalingin some cancer cell models compromises their tumorige-nicity (Marotta et al. 2011; Chang et al. 2013). Arguably,poor understanding of the molecular determinants thatdefine STAT3 activation as an essential hub in some cellsbut not in others prevents us from considering therapiestargeting its activation.
Here, we report that HR−/HER2+ breast cancers areespecially sensitive to inhibition of STAT3 activation.Mechanistically, we identified the downstream targetsof STAT3 (S100A8 and S100A9) as responsible, at leastpartially, for this sensitivity. S100A8 and S100A9 arecalcium-binding proteins that heterodimerize, forminga complex called calprotectin that is secreted (Gebhardtet al. 2006; Ehrchen et al. 2009). While the role ofS100A8/9 as proinflammatory mediators secreted by im-mune cells is well documented, S100A8/9 proteins arealso found up-regulated in multiple solid tumors and as-sociated with poor prognosis characteristics (Arai et al.2008; Kawai et al. 2011; Grebhardt et al. 2014). Indeed, au-tocrine and paracrine exposure to calprotectin activateskey signaling pathways involved in tumorigenesis (Geb-hardt et al. 2006; Hermani et al. 2006; Ichikawa et al.2011; Acharyya et al. 2012). Our data using immuno-compromised mouse models lacking all major immunecells (NOD scidγ) reveal that, in the context of HR−/HER2+ breast cancers, S100A8/9 secreted by the tumor
cells is an important mediator of tumorigenesis thatincreases the phosphorylation of AKT and, to a lesser ex-tent, ERK.
How can the above-mentioned observations explain thesensitivity of HR−/HER2+ breast cancer cells to inhibitionof the IL-6–JAK2–STAT3–calprotectin cascade? AberrantAKT activity is a key event commonly seen in humancancers that positively impacts most cancer hallmarks,including cell cycle, survival, metabolism, motility,genomic instability, angiogenesis, and inflammatory cellrecruitment (Testa and Tsichlis 2005; Fruman and Rom-mel 2014). AKT is directly stimulated by activation ofgrowth factor receptors, including HER2, through canon-ical PI3K–PIP3 signals. Additionally, cross-talkwith otherpathways and feedback loops modulate the final activityof AKT (Testa and Tsichlis 2005; Fruman and Rommel2014). Our results suggest that overexpression and secre-tion of S100A8 and S100A9, as detected in HR−/HER2+
cells, also contribute to aberrant AKT activity. It is thusplausible that inhibiting S100A8/9 secretion may reduceAKT activity (despite an otherwise unchanged stimulusfrom oncogenic HER2) to a point that becomes criticalfor these cancer cells. Although several receptors forS100A8/9 have been identified (RAGE [Turovskaya et al.2008], TLR4 [Kallberg et al. 2012], and EMMPRIM [Hibinoet al. 2013]), how the signal is transmited to AKT is notcharacterized. It will be important to dissect the signalingpathways that connect S100A8/9 with AKT, as additionaltherapeutic alternatives may emerge.
An additional consideration regarding the sensitivityof HR−/HER2+ cells is that STAT3 has been found activat-ed in stem cell-like breast cancer cells, and its inhibitionwas shown to reduce their viability (Marotta et al. 2011;Chung et al. 2014). Thus, the anti-tumor response ob-served may also be a reflex of the inhibition of the stemcells inside HR−/HER2+ cancers. Although HR−/HER2+
cancer cells were the most sensitive to the inhibitionof the IL-6–JAK2–STAT3–calprotectin axis, we observedthat STAT3 blockade with ruxolitinib also affects thegrowth of a HR+/HER2+ model—especially when com-bined with anti-HER2 therapy—as well as some breastcancer cells with high levels of p-STAT3 (see Fig. 7D; Sup-plemental Fig. 7G). Remarkably, the link between HER2,STAT3, and stem cell-like cells has also been described inHR+ breast cancers, which could explain this effect (Mar-otta et al. 2011; Chung et al. 2014). Overall, the studies de-scribed here unveil the IL-6–JAK2–STAT3–calprotectincascade as an Achilles’ heel of HR−/HER2+ tumors. Im-portantly, our preclinical studies demonstrating anti-cancer activity of FDA-approved drugs (ruxolitinib andtociluzumab) as well as of a compound that is currentlybeing evaluated in clinical trials (tasquinimod) open newavenues for a rapid transition of our findings to the clinic.Indeed, our data serve as the basis for investigating thecombination of ruxolitinib and trastuzumab in a phaseI/II, multicenter trial in patients with metastatic breastcancer that has progressed on prior HER2 targeted therapy(ClinicalTrials.gov identifier NCT02066532). If a clinicalbenefit is identified, inhibition of the IL-6–JAK–STAT3–calprotectin axis by ruxolitinib would represent a novel,
Rodriguez-Barrueco et al.
1644 GENES & DEVELOPMENT
Cold Spring Harbor Laboratory Press on April 9, 2018 - Published by genesdev.cshlp.orgDownloaded from
non-chemotherapy-containing, orthogonal anti-cancerstrategy for HER2+ breast cancers.
Materials and methods
Pooled shRNA screening
MCF-10A andMCF-10A/ErbB2∗ cells were infectedwith a pool ofvirus generated from the Open BiosystemGIPZ lentiviral humanshRNA library that comprises 58,493 shRNA targeting 18,651genes. After infection, cells were cultured in triplicate in standardplastic plates for 10 doubling times or embedded in ECM-Matri-gel for 1 wk. In addition, MCF-10A/ErbB2∗ cells were injectedin triplicate into the intramammary fat pad (IMFP) of immuno-compromised mice to perform the in vivo screening. Experimen-tal details are described in Rodriguez-Barrueco et al. (2013). Dataanalysis details are described in Yu et al. (2013).
Data-driven network reconstruction of breast cancer
Weused a data-driven approach,ARACNe, to reconstruct a breastcancer interactome from 359 TCGA breast cancer gene expres-sion profiles. We then applied ARACNe against 1597 probescorresponding to 780 TFs to establish a TF-centered interactomeand against 6434 probes for 2453 signalingmolecule genes to con-struct a SP-focused network. The parameters of the algorithmwere configured as follows: P-value threshold, P = 1 × 10⁻⁷; DPItolerance, e = 0; and number of bootstraps, NB = 100. We usedthe adaptive partitioning algorithm for mutual informationestimation.
Gene expression arrays
For gene expression arrays, MCF-10A and MCF-10A/ErbB2∗
RNAs were extracted using RNeasy extraction kits and labeledusing the low-input QuickAmp labeling kit (Agilent, no. 5190-2331) following the manufacturer’s instructions. Finally, labeledRNAs were hybridized on an Illumina HT12v3 microarray. Theexperiment was performed with an n = 6.MCF-10A cells were treated with 50 µg/mL IL6 for 1 h. In par-
allel, MCF-10A/ErbB2∗ infected with inducible shRNAs againstSTAT3 were incubated with 100 ng/mL Dox for 5 d. RNA fromeach condition was extracted with RNeasy extraction kit, la-beled, and hybridized on a humanGE 4x44K version 2microarraykit (Agilent, no. G4845A).Gene expression data have been uploaded, and the Gene Ex-
pression Omnibus accession number assigned is GSE62251.
MR analysis
We interrogated the TCGA breast cancer interactomes andapplied MARINa to identify key master transcriptional or sig-naling drivers for MCF-10A/ErbB2∗ cells or HR−/HER2+ breastcancer samples in TCGA orMETABRIC data. For the gene set en-richment analysis method in MARINa, we applied the “max-mean” statistic to score the enrichment of the gene set andused a sample permutation to build the null distribution for stat-istical significance.
Viral production and infection
Lentiviral productionwas achieved by transfecting phoenix pack-aging cells with jet-PEI (Polyplus, #101-10N) in combinationwiththe lentiviral plasmids (shRNA listed below, pLOC_S100A8, and
pLX304-Blast-V5_STAT3) and the pCMV-dR8.91 and pMD.Ghelper plasmids at a ratio of 2:1:1, respectively (Rodriguez-Bar-rueco et al. 2013). The same conditionswere employed to produceretroviral particles by combining the retroviral plasmids (pBABE-HERYVMA and pLPCX-RFP_S100A9) with the retroviral helperplasmids Psi and VSVg. A detailed protocol is in the Supplemen-tal Material as well as precious publications (Rodriguez-Barruecoet al. 2013).
S0CS3, S100A8, and S100A9 promoter cloningand luciferase assay
To measure luciferase activity, phoenix cells were plated at 70%confluence in 96-well plates. Twenty-four hours later, cells weretransfected with 50 ng of pGL3 constructs containing the pro-moter sequences in combination with a Renilla normalizationcontrol using jet-PEI transfection reagent. After 24 h, relative lu-ciferase units (RLU) were measured using the Dual-Glo Lucifer-ase assay system (Promega, #E2949).
Soft agar colony formation assay
Cells were plated in semisolid medium as follows: 35-mm plateswere layered with 0.6% agar (Spectrum Chemical, AG110) andmedium, and 5.0 × 10³ cells permilliliter were seeded in triplicatein the second layer of 0.3% agar and medium and cultured inthe appropriate growth medium. Colonies were stained with 1mg/mL MTT (Sigma, M2128) after 3 wk of incubation, photo-graphed, and counted, and the average ± standard deviation wasrepresented.
3D basement membrane cultures
Wells in 24-well low-attachment plates (Corning, no. 3473) wereprecoated with a layer of 200 µL of 100% ECM-Matrigel per well(BD Biosciences, no. 354230) and allowed to gel at 37°C. Cellswere trypsinized and diluted at densities of 1 × 10⁵ or 2 × 10⁵ cellsper milliliter in assay medium (DMEM/F12 supplemented with5% HS, 0.5 µg/mL hydrocortisone, 100 ng/mL cholera toxin,10 µg/mL insulin, 4 ng/mL EGF, 5% ECM-Matrigel). Fresh assaymediumcontaining the drugs at the indicated concentrationswasadded every day. Pictures were taken after 6 d of treatment.
Mice
Animal maintenance and experiments were performed in accor-dance with the animal care guidelines and protocols approvedby the Columbia University animal care unit. Eight-week-old fe-male NOD.CB17-Prkdcs SCID mice (Harlan) were injected with5 × 106 cells resuspended in Matrigel (BD Biosciences):normalgrowth medium (1:1) into the fat pad mammary gland. Dox wasadded to drinking water at a final concentration of 2.0 mg/mL.Tumor growth was monitored twice a week with calipers atthe site of injection. Animals were sacrificed when tumor sizereached 1.5-cm diameter.
ChIP
MCF-10A and MCF-10A/STAT3-V5 cells (untreated cells andcells treated with 50 µg/mL IL6 for 30 min) were grown to80%–90% confluency in 150-mm culture dishes. After washingwith PBS, cells were fixed and cross-linked using a truChIPHighCell chromatin shearing kitwith SDS shearing buffer (Cova-ris, no. 010128) following the manufacturer’s instructions.
Targeted therapy for HR−/HER2+ breast cancers
GENES & DEVELOPMENT 1645
Cold Spring Harbor Laboratory Press on April 9, 2018 - Published by genesdev.cshlp.orgDownloaded from
The next day, anti-V5-conjugated beads were resuspended in1 mL of blocking buffer. Nuclear extracts (100 µL) were addedto the bead solution and incubated overnight at 4°C on a rotator.After 12 h, beads were collected, and DNAwas obtained by stan-dard protocols (detailed in the Supplemental Material).
Acknowledgments
This work was supported by National Institutes of Health grantR01/EUREKA R01CA153233 and the American Associationfor Cancer Research-Stand up to Cancer award (J.M.S.) and theNational Cancer Center (R.R.-B.).
References
Acharyya S, Oskarsson T, Vanharanta S, Malladi S, Kim J, MorrisPG, Manova-Todorova K, Leversha M, Hogg N, Seshan VE,et al. 2012. A CXCL1 paracrine network links cancer chemo-resistance and metastasis. Cell 150: 165–178.
Arai K, Takano S, Teratani T, Ito Y, Yamada T, Nozawa R. 2008.S100A8 and S100A9 overexpression is associated with poorpathological parameters in invasive ductal carcinoma of thebreast. Curr Cancer Drug Targets 8: 243–252.
Aytes A, Mitrofanova A, Lefebvre C, AlvarezMJ, Castillo-MartinM, Zheng T, Eastham JA, Gopalan A, Pienta KJ, Shen MM,et al. 2014. Cross-species regulatory network analysis identi-fies a synergistic interaction between FOXM1 and CENPFthat drives prostate cancer malignancy. Cancer Cell 25:638–651.
Barbieri I, Pensa S, Pannellini T, Quaglino E, Maritano D, Dema-ria M, Voster A, Turkson J, Cavallo F, Watson CJ, et al. 2010a.Constitutively active Stat3 enhances neu-mediatedmigrationandmetastasis in mammary tumors via upregulation of Cten.Cancer Res 70: 2558–2567.
Barbieri I, Quaglino E, Maritano D, Pannellini T, Riera L, CavalloF, Forni G, Musiani P, Chiarle R, Poli V. 2010b. Stat3 is re-quired for anchorage-independent growth and metastasis butnot for mammary tumor development downstream of theErbB-2 oncogene. Mol Carcinog 49: 114–120.
Basso K, Margolin AA, Stolovitzky G, Klein U, Dalla-Favera R,Califano A. 2005. Reverse engineering of regulatory networksin human B cells. Nat Genet 37: 382–390.
BerclazG, AltermattHJ, RohrbachV, SiragusaA,Dreher E, SmithPD. 2001. EGFR dependent expression of STAT3 (but notSTAT1) in breast cancer. Int J Oncol 19: 1155–1160.
Berishaj M, Gao SP, Ahmed S, Leslie K, Al-Ahmadie H, GeraldWL, Bornmann W, Bromberg JF. 2007. Stat3 is tyrosine-phos-phorylated through the interleukin-6/glycoprotein 130/Januskinase pathway in breast cancer. Breast Cancer Res 9: R32.
Bertos NR, Park M. 2011. Breast cancer—one term, many enti-ties? J Clin Invest 121: 3789–3796.
The Cancer Genome Atlas Network. 2012. Comprehensive mo-lecular portraits of human breast tumours.Nature 490: 61–70.
CarroMS, LimWK, AlvarezMJ, Bollo RJ, Zhao X, Snyder EY, Sul-man EP, Anne SL, Doetsch F, ColmanH, et al. 2010. The tran-scriptional network for mesenchymal transformation of braintumours. Nature 463: 318–325.
Chang Q, Bournazou E, Sansone P, Berishaj M, Gao SP, Daly L,Wels J, Theilen T, Granitto S, Zhang X, et al. 2013. The IL-6/JAK/Stat3 feed-forward loop drives tumorigenesis and me-tastasis. Neoplasia 15: 848–862.
Chung SS, Giehl N, Wu Y, Vadgama JV. 2014. STAT3 activationin HER2-overexpressing breast cancer promotes epithelial–
mesenchymal transition and cancer stem cell traits. Int JOncol 44: 403–411.
Citri A, Yarden Y. 2006. EGF–ERBB signalling: towards the sys-tems level. Nat Rev Mol Cell Biol 7: 505–516.
Curtis C, Shah SP, Chin SF, Turashvili G, Rueda OM, DunningMJ, Speed D, Lynch AG, Samarajiwa S, Yuan Y, et al. 2012.The genomic and transcriptomic architecture of 2,000 breasttumours reveals novel subgroups. Nature 486: 346–352.
Dalrymple SL, Becker RE, Isaacs JT. 2007. The quinoline-3-car-boxamide anti-angiogenic agent, tasquinimod, enhances theanti-prostate cancer efficacy of androgen ablation and taxoterewithout effecting serum PSA directly in human xenografts.Prostate 67: 790–797.
Dalrymple SL, Becker RE, Zhou H, DeWeese TL, Isaacs JT. 2012.Tasquinimod prevents the angiogenic rebound induced byfractionated radiation resulting in an enhanced therapeuticresponse of prostate cancer xenografts. Prostate 72: 638–648.
Darnell JE. 2005. Validating Stat3 in cancer therapy. Nat Med11: 595–596.
Debnath J, Mills KR, Collins NL, ReginatoMJ,Muthuswamy SK,Brugge JS. 2002. The role of apoptosis in creating and main-taining luminal spacewithin normal and oncogene-expressingmammary acini. Cell 111: 29–40.
Debnath J,MuthuswamySK, Brugge JS. 2003.Morphogenesis andoncogenesis of MCF-10A mammary epithelial acini grown inthree-dimensional basement membrane cultures. Methods30: 256–268.
Ehrchen JM, Sunderkotter C, Foell D, Vogl T, Roth J. 2009. Theendogenous Toll-like receptor 4 agonist S100A8/S100A9 (cal-protectin) as innate amplifier of infection, autoimmunity, andcancer. J Leukoc Biol 86: 557–566.
Fruman DA, Rommel C. 2014. PI3K and cancer: lessons, chal-lenges and opportunities. Nat Rev Drug Discov 13: 140–156.
Garcia R, Bowman TL, Niu G, Yu H, Minton S, Muro-CachoCA, Cox CE, Falcone R, Fairclough R, Parsons S, et al. 2001.Constitutive activation of Stat3 by the Src and JAK tyrosinekinases participates in growth regulation of human breast car-cinoma cells. Oncogene 20: 2499–2513.
GebhardtC,Nemeth J, Angel P, Hess J. 2006. S100A8 and S100A9in inflammation and cancer. Biochem Pharmacol 72: 1622–1631.
Grebhardt S,Muller-Decker K, Bestvater F, HershfinkelM,MayerD. 2014. Impact of S100A8/A9 expression on prostate cancerprogression in vitro and in vivo. J Cell Physiol 229: 661–671.
Gupta PB, Onder TT, Jiang G, Tao K, Kuperwasser C, WeinbergRA, Lander ES. 2009. Identification of selective inhibitorsof cancer stem cells by high-throughput screening. Cell 138:645–659.
Hartman ZC, Yang XY, Glass O, Lei G, Osada T, Dave SS, MorseMA,ClayTM, LyerlyHK. 2011.HER2 overexpression elicits aproinflammatory IL-6 autocrine signaling loop that is criticalfor tumorigenesis. Cancer Res 71: 4380–4391.
Heiser LM, Sadanandam A, Kuo WL, Benz SC, Goldstein TC, NgS, GibbWJ,WangNJ, Ziyad S, Tong F, et al. 2012. Subtype andpathway specific responses to anticancer compounds in breastcancer. Proc Natl Acad Sci 109: 2724–2729.
Hermani A, De Servi B, Medunjanin S, Tessier PA, Mayer D.2006. S100A8 and S100A9 activate MAP kinase and NF-κBsignaling pathways and trigger translocation of RAGE in hu-man prostate cancer cells. Exp Cell Res 312: 184–197.
Hibino T, Sakaguchi M, Miyamoto S, Yamamoto M, MotoyamaA, Hosoi J, Shimokata T, Ito T, Tsuboi R, Huh NH. 2013.S100A9 is a novel ligand of EMMPRIN that promotesmelano-ma metastasis. Cancer Res 73: 172–183.
Rodriguez-Barrueco et al.
1646 GENES & DEVELOPMENT
Cold Spring Harbor Laboratory Press on April 9, 2018 - Published by genesdev.cshlp.orgDownloaded from

Hurley J, Doliny P, Reis I, Silva O, Gomez-Fernandez C, Velez P,Pauletti G, Powell JE, Pegram MD, Slamon DJ. 2006.Docetaxel, cisplatin, and trastuzumab as primary systemictherapy for human epidermal growth factor receptor 2-posi-tive locally advanced breast cancer. J Clin Oncol 24: 1831–1838.
Hynes NE, Lane HA. 2005. ERBB receptors and cancer: the com-plexity of targeted inhibitors. Nat Rev Cancer 5: 341–354.
Ichikawa M, Williams R, Wang L, Vogl T, Srikrishna G. 2011.S100A8/A9 activate key genes and pathways in colon tumorprogression. Mol Cancer Res 9: 133–148.
Kallberg E, Vogl T, Liberg D, Olsson A, Bjork P, Wikstrom P,Bergh A, Roth J, Ivars F, Leanderson T. 2012. S100A9 interac-tion with TLR4 promotes tumor growth. PLoSOne 7: e34207.
Kaufman B, Mackey JR, ClemensMR, Bapsy PP, Vaid A, WardleyA, Tjulandin S, Jahn M, Lehle M, Feyereislova A, et al. 2009.Trastuzumab plus anastrozole versus anastrozole alone forthe treatment of postmenopausal womenwith human epider-mal growth factor receptor 2-positive, hormone receptor-pos-itive metastatic breast cancer: results from the randomizedphase III TAnDEM study. J Clin Oncol 27: 5529–5537.
Kawai H, Minamiya Y, Takahashi N. 2011. Prognostic impact ofS100A9 overexpression in non-small cell lung cancer.TumourBiol 32: 641–646.
Lefebvre C, Rajbhandari P, Alvarez MJ, Bandaru P, LimWK, SatoM, Wang K, Sumazin P, Kustagi M, Bisikirska BC, et al. 2010.A human B-cell interactome identifies MYB and FOXM1 asmaster regulators of proliferation in germinal centers. MolSyst Biol 6: 377.
Lemmon MA, Schlessinger J. 2010. Cell signaling by receptortyrosine kinases. Cell 141: 1117–1134.
Lewis Phillips GD, Li G, Dugger DL, Crocker LM, Parsons KL,Mai E, Blattler WA, Lambert JM, Chari RV, Lutz RJ, et al.2008. Targeting HER2-positive breast cancer with trastuzu-mab-DM1, an antibody-cytotoxic drug conjugate. CancerRes 68: 9280–9290.
Luo B, Cheung HW, Subramanian A, Sharifnia T, Okamoto M,Yang X, Hinkle G, Boehm JS, Beroukhim R, Weir BA, et al.2008. Highly parallel identification of essential genes in can-cer cells. Proc Natl Acad Sci 105: 20380–20385.
Marcotte R, Brown KR, Suarez F, Sayad A, Karamboulas K, Krzy-zanowski PM, Sircoulomb F,MedranoM, Fedyshyn Y, Koh JL,et al. 2012. Essential gene profiles in breast, pancreatic, andovarian cancer cells. Cancer Discov 2: 172–189.
Margolin AA, Nemenman I, Basso K, Wiggins C, Stolovitzky G,Dalla Favera R, Califano A. 2006. ARACNe: an algorithmfor the reconstruction of gene regulatory networks in a mam-malian cellular context. BMC Bioinformatics 7: S7.
Marotta LL, Almendro V, Marusyk A, Shipitsin M, Schemme J,Walker SR, Bloushtain-Qimron N, Kim JJ, Choudhury SA,MaruyamaR, et al. 2011. The JAK2/STAT3 signaling pathwayis required for growth of CD44+CD24− stem cell-like breastcancer cells in human tumors. J Clin Invest 121: 2723–2735.
Mascarenhas J, Hoffman R. 2012. Ruxolitinib: the first FDA ap-proved therapy for the treatment of myelofibrosis. Clin Can-cer Res 18: 3008–3014.
Mesa RA, Yasothan U, Kirkpatrick P. 2012. Ruxolitinib.Nat RevDrug Discov 11: 103–104.
Moasser MM. 2007. The oncogene HER2: its signaling and trans-forming functions and its role in human cancer pathogenesis.Oncogene 26: 6469–6487.
Murray PJ. 2007. The JAK–STAT signaling pathway: input andoutput integration. J Immunol 178: 2623–2629.
Navarro-Millan I, Singh JA, Curtis JR. 2012. Systematic review oftocilizumab for rheumatoid arthritis: a new biologic agent tar-geting the interleukin-6 receptor. Clin Ther 34: 788–802.
Paluch-Shimon S, Ben-BaruchN,Wolf I, Zach L, Kopolovic J, Kru-glikova A, Modiano T, Yosepovich A, Catane R, Kaufman B.2009. Hormone receptor expression is associated with aunique pattern of metastatic spread and increased survivalamong HER2-overexpressing breast cancer patients. Am JClin Oncol 32: 504–508.
Patel AM, Moreland LW. 2010. Interleukin-6 inhibition for treat-ment of rheumatoid arthritis: a review of tocilizumab therapy.Drug Des Devel Ther 4: 263–278.
PerouCM, Sorlie T, EisenMB, van de RijnM, Jeffrey SS, Rees CA,Pollack JR, Ross DT, Johnsen H, Akslen LA, et al. 2000. Mo-lecular portraits of human breast tumours. Nature 406:747–752.
Piovan E, Yu J, Tosello V, Herranz D, Ambesi-Impiombato A, DaSilva AC, Sanchez-Martin M, Perez-Garcia A, Rigo I, CastilloM, et al. 2013. Direct reversal of glucocorticoid resistance byAKT inhibition in acute lymphoblastic leukemia. CancerCell 24: 766–776.
Rawlings JS, Rosler KM, Harrison DA. 2004. The JAK/STAT sig-naling pathway. J Cell Sci 117: 1281–1283.
Rodriguez-Barrueco R, Marshall N, Silva J. 2013. Pooled shRNAscreenings: experimental approach. Methods Mol Biol 980:353–370.
Schlabach MR, Luo J, Solimini NL, Hu G, Xu Q, Li MZ, Zhao Z,Smogorzewska A, Sowa ME, Ang XL, et al. 2008. Cancer pro-liferation gene discovery through functional genomics. Sci-ence 319: 620–624.
Schultz N, Marenstein DR, De Angelis DA, WangWQ, NelanderS, Jacobsen A, Marks DS, Massague J, Sander C. 2011. Off-tar-get effects dominate a large-scale RNAi screen for modulatorsof the TGF-β pathway and reveal microRNA regulation ofTGFBR2. Silence 2: 3.
Silva JM, Marran K, Parker JS, Silva J, Golding M, Schlabach MR,Elledge SJ, Hannon GJ, Chang K. 2008. Profiling essentialgenes in human mammary cells by multiplex RNAi screen-ing. Science 319: 617–620.
Sotiriou C, Pusztai L. 2009. Gene-expression signatures in breastcancer. N Engl J Med 360: 790–800.
Soule HD, Maloney TM, Wolman SR, Peterson WD Jr, Brenz R,McGrath CM, Russo J, Pauley RJ, Jones RF, Brooks SC.1990. Isolation and characterization of a spontaneously im-mortalized human breast epithelial cell line, MCF-10.CancerRes 50: 6075–6086.
Tagliabue E, Balsari A, Campiglio M, Pupa SM. 2010. HER2 as atarget for breast cancer therapy. Expert Opin Biol Ther 10:711–724.
Testa JR, Tsichlis PN. 2005. AKT signaling in normal and malig-nant cells. Oncogene 24: 7391–7393.
Turovskaya O, Foell D, Sinha P, Vogl T, Newlin R, Nayak J,Nguyen M, Olsson A, Nawroth PP, Bierhaus A, et al. 2008.RAGE, carboxylated glycans and S100A8/A9 play essentialroles in colitis-associated carcinogenesis. Carcinogenesis 29:2035–2043.
Vaz-Luis I, Ottesen RA, Hughes ME, Marcom PK, Moy B, RugoHS, Theriault RL, Wilson J, Niland JC, Weeks JC, et al.2012. Impact of hormone receptor status on patterns of recur-rence and clinical outcomes among patients with human epi-dermal growth factor-2-positive breast cancer in the NationalComprehensive Cancer Network: a prospective cohort study.Breast Cancer Res 14: R129.
Wang SE, Narasanna A, Perez-Torres M, Xiang B, Wu FY, Yang S,Carpenter G, Gazdar AF, Muthuswamy SK, Arteaga CL.
Targeted therapy for HR−/HER2+ breast cancers
GENES & DEVELOPMENT 1647
Cold Spring Harbor Laboratory Press on April 9, 2018 - Published by genesdev.cshlp.orgDownloaded from

2006. HER2 kinase domain mutation results in constitutivephosphorylation and activation of HER2 and EGFR and resis-tance to EGFR tyrosine kinase inhibitors. Cancer Cell 10:25–38.
Weerasinghe P, Garcia GE, ZhuQ, Yuan P, Feng L,Mao L, Jing N.2007. Inhibition of Stat3 activation and tumor growth sup-pression of non-small cell lung cancer by G-quartet oligonu-cleotides. Int J Oncol 31: 129–136.
Wendt MK, Balanis N, Carlin CR, Schiemann WP. 2014. STAT3and epithelial–mesenchymal transitions in carcinomas.JAKSTAT 3: e28975.
Wormald S, Hilton DJ. 2004. Inhibitors of cytokine signal trans-duction. J Biol Chem 279: 821–824.
Yu J, Putcha P, Califano A, Silva JM. 2013. Pooled shRNAscreenings: computational analysis. Methods Mol Biol 980:371–384.
Rodriguez-Barrueco et al.
1648 GENES & DEVELOPMENT
Cold Spring Harbor Laboratory Press on April 9, 2018 - Published by genesdev.cshlp.orgDownloaded from
10.1101/gad.262642.115Access the most recent version at doi: originally published online July 30, 201529:2015, Genes Dev.
Ruth Rodriguez-Barrueco, Jiyang Yu, Laura P. Saucedo-Cuevas, et al.
breast cancers+/HER2−targeted therapy for HR calprotectin axis as−STAT3−JAK2−Inhibition of the autocrine IL-6
Material
Supplemental
http://genesdev.cshlp.org/content/suppl/2015/07/28/gad.262642.115.DC1
References
http://genesdev.cshlp.org/content/29/15/1631.full.html#ref-list-1
This article cites 68 articles, 17 of which can be accessed free at:
License
Commons Creative
.http://creativecommons.org/licenses/by-nc/4.0/at Creative Commons License (Attribution-NonCommercial 4.0 International), as described
). After six months, it is available under ahttp://genesdev.cshlp.org/site/misc/terms.xhtmlsix months after the full-issue publication date (see This article is distributed exclusively by Cold Spring Harbor Laboratory Press for the first
ServiceEmail Alerting
click here.right corner of the article or
Receive free email alerts when new articles cite this article - sign up in the box at the top
© 2015 Rodriguez-Barrueco et al.; Published by Cold Spring Harbor Laboratory Press
Cold Spring Harbor Laboratory Press on April 9, 2018 - Published by genesdev.cshlp.orgDownloaded from