Ingenuity Pathway Analysis Plugin - QIAGEN...
22
Ingenuity Pathway Analysis Plugin USER MANUAL
Transcript of Ingenuity Pathway Analysis Plugin - QIAGEN...
Ingenuity Pathway Analysis Plugin
USER MANUAL

User manual for
Ingenuity Pathway Analysis 2.4Windows, macOS and Linux
November 28, 2018
This software is for research purposes only.
QIAGEN AarhusSilkeborgvej 2PrismetDK-8000 Aarhus CDenmark
Contents
1 Introduction 4
2 Uploading data to IPA using the Pathway Analysis tool 6
2.1 Error handling . . . . . . . . . . . . . . . . . . . . . . . . . . . . . . . . . . . . . 10
3 Using the Workflow Analyze Expression Data and Upload Comparisons to IPA 11
3.1 Running the Workflow . . . . . . . . . . . . . . . . . . . . . . . . . . . . . . . . . 12
4 Uploading data to IPA using the Pathway Analysis (legacy) tool 15
5 Analyzing Data in IPA 18
6 Install and uninstall plugins 20
6.1 Install . . . . . . . . . . . . . . . . . . . . . . . . . . . . . . . . . . . . . . . . . 20
6.2 Uninstall . . . . . . . . . . . . . . . . . . . . . . . . . . . . . . . . . . . . . . . . 21
3
Chapter 1
Introduction
The Ingenuity Pathway Analysis Plugin provides the ability to upload expression data from CLCGenomics Workbench to Ingenuity Pathway Analysis (IPA). It is possible to upload:
• Statistical comparison data generated using the RNA-seq tools, and
• Legacy experiment data.
IPA provides valuable biological insight into the results of gene expression experiments by un-covering enriched signaling and metabolic pathways, activated and inhibited upstream regulatorsand effects on downstream diseases, functions, and phenotypes. IPA can visualize at the isoformlevel for human genes.
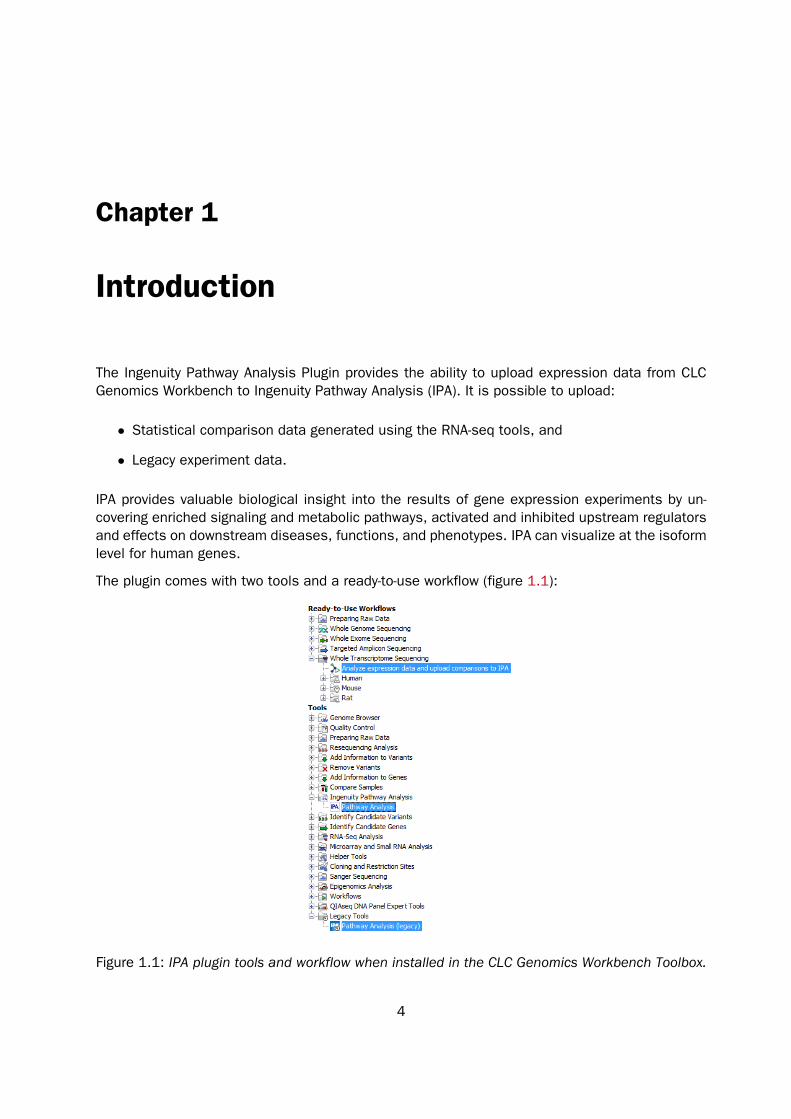
The plugin comes with two tools and a ready-to-use workflow (figure 1.1):
Figure 1.1: IPA plugin tools and workflow when installed in the CLC Genomics Workbench Toolbox.
4
CHAPTER 1. INTRODUCTION 5
• The Pathway Analysis tool uploads statistical comparison data (generated by the toolDifferential Expression for RNA-Seq) to IPA. The Pathway Analysis tool is based on thelegacy Pathway Analysis tool, but has been thoroughly improved on many aspects such asusage of the new IPA API, stability, error handling, and user feedback during the uploadprocess. The tool will output one or more Statistical Comparison tracks.
• The Pathway Analysis (legacy) tool, which can upload legacy experiment data. The tool isprimarily included for backwards compatibility reasons.
• The ready-to-use workflow Analyze Expression Data and Upload Comparisons to IPA, whichtakes expression data as input. The workflow analyzes them using the RNA-Seq Analysistools, and submits the comparisons to IPA using the Pathway Analysis tool.
It is possible to use gene and transcript based RNA-seq experiments as basis for the analysis,but also microarrays from Illumina and Affymetrix are supported. Currently, small RNA basedexperiments are not supported by this integration.
Once the experiment data are ready, it is possible to annotate with any of the supported statistics:
• Transformed and normalized foldchange
• Baggerley’s test
• Kal’s Z test
• ANOVA
• edgeR
Chapter 2
Uploading data to IPA using the PathwayAnalysis tool
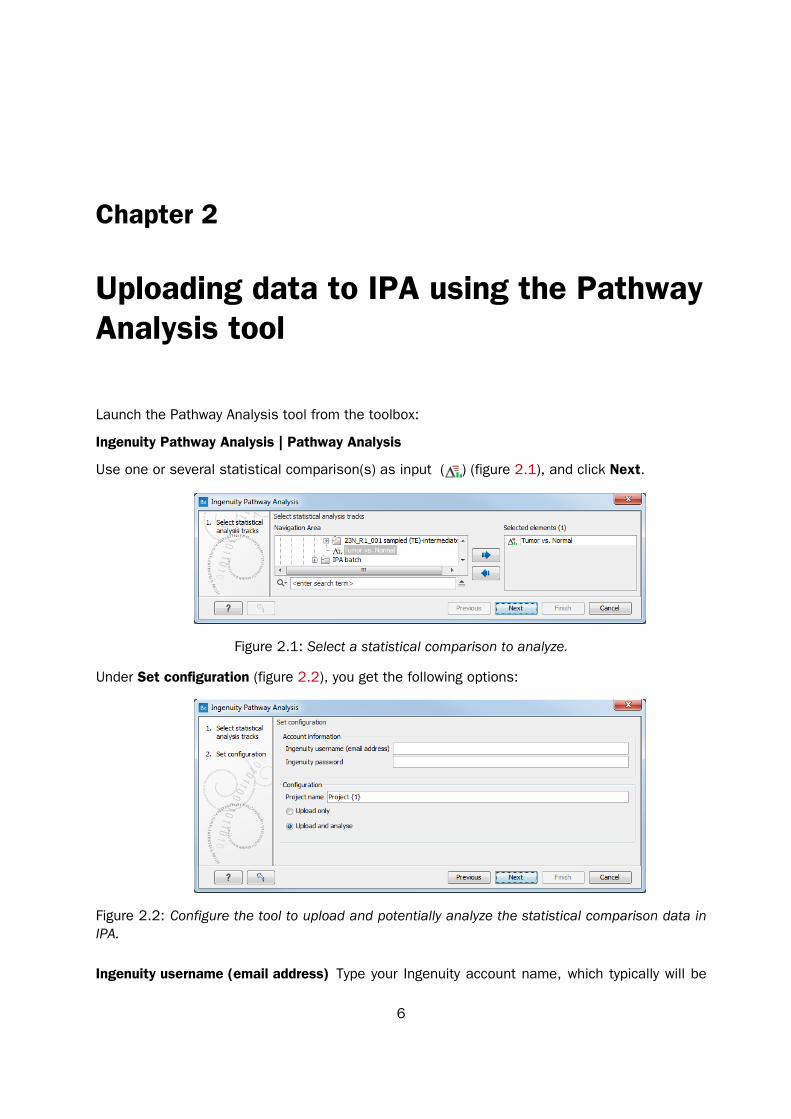
Launch the Pathway Analysis tool from the toolbox:
Ingenuity Pathway Analysis | Pathway Analysis
Use one or several statistical comparison(s) as input ( ) (figure 2.1), and click Next.
Figure 2.1: Select a statistical comparison to analyze.
Under Set configuration (figure 2.2), you get the following options:
Figure 2.2: Configure the tool to upload and potentially analyze the statistical comparison data inIPA.
Ingenuity username (email address) Type your Ingenuity account name, which typically will be
6

CHAPTER 2. UPLOADING DATA TO IPA USING THE PATHWAY ANALYSIS TOOL 7
your email adress.
Ingenuity password Type your Ingenuity password.
Project Name This will be the name of the project in IPA once created. {1} will be substitutedwith a date stamp. It is also possible to create a custom project name by typing in thedesired name in this field.
Upload only / Upload and analyse Select "Upload only", if you only wish to create a dataset inIPA. Select "Upload and analyse", if you want to create an analysis from the dataset aswell.
Click on the button labeled Next to go to the next wizard step (figure 2.3).
Figure 2.3: Configure the parameters for uploading the data to IPA.
In this wizard step, the cutoff values for what should be uploaded to IPA can be specified. Onlyfeatures that pass the cutoffs that have been specified at this step will be sent to IPA and bepart of the dataset that can be seen in IPA.
Under Set upload parameters you get the following options:
Ignore features with mean expression values below This value is used to filter genes/transcriptsbefore uploading them to IPA. Features with values below this limit will not be uploaded.
Upload rows with value <= Maximum p-value for feature (gene or transcript) to be uploaded.Features with a p-value above this number will not be uploaded. It is possible to choosebetween different types of p-Values: Standard, Bonferroni, and FDR.
Upload rows with absolute value >= Minimum absolute fold change for feature to be uploaded.Features with a fold change/log2 ratio below this number will not be uploaded. It is possibleto choose between different types of fold changes: Fold change, and log2-ratio.
CHAPTER 2. UPLOADING DATA TO IPA USING THE PATHWAY ANALYSIS TOOL 8
Upload Summary This summary shows how many features the tool will upload to IPA for eachstatistical comparison. The values are updated, when the user changes any of the uploadparameters. In this way, the user can easily check the effect of the filtering (for instance toavoid setting the filters such that no features will be uploaded)
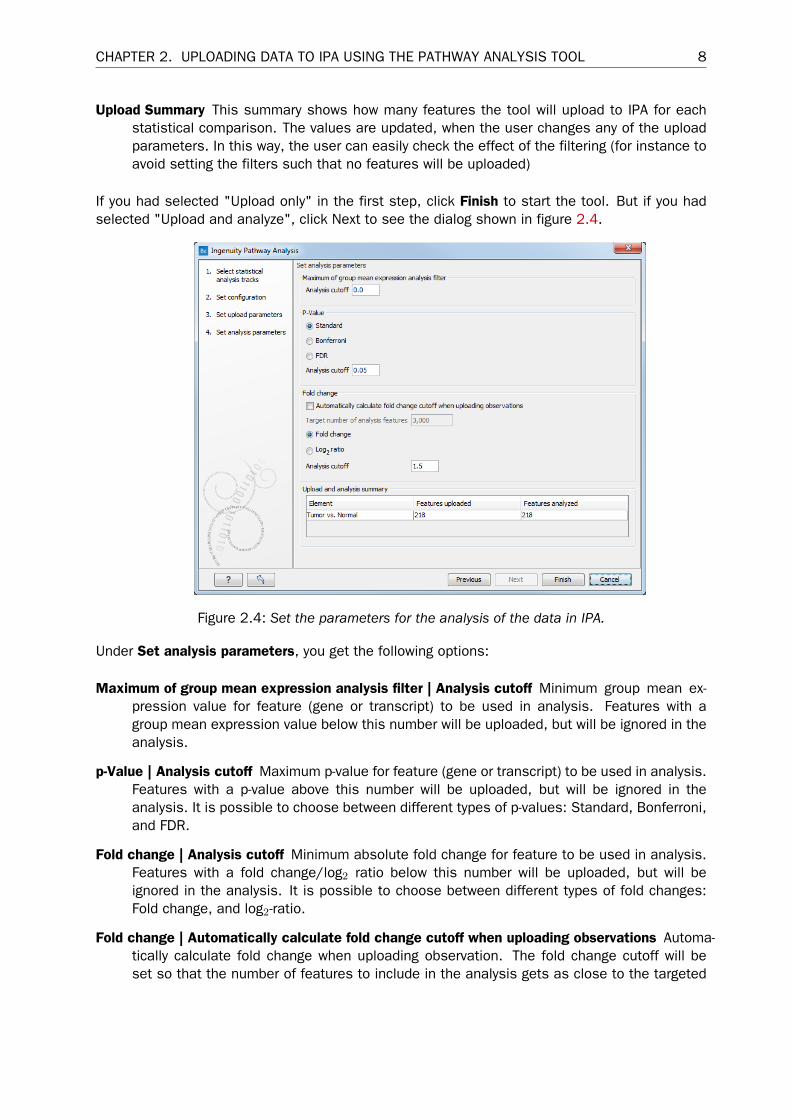
If you had selected "Upload only" in the first step, click Finish to start the tool. But if you hadselected "Upload and analyze", click Next to see the dialog shown in figure 2.4.
Figure 2.4: Set the parameters for the analysis of the data in IPA.
Under Set analysis parameters, you get the following options:
Maximum of group mean expression analysis filter | Analysis cutoff Minimum group mean ex-pression value for feature (gene or transcript) to be used in analysis. Features with agroup mean expression value below this number will be uploaded, but will be ignored in theanalysis.
p-Value | Analysis cutoff Maximum p-value for feature (gene or transcript) to be used in analysis.Features with a p-value above this number will be uploaded, but will be ignored in theanalysis. It is possible to choose between different types of p-values: Standard, Bonferroni,and FDR.
Fold change | Analysis cutoff Minimum absolute fold change for feature to be used in analysis.Features with a fold change/log2 ratio below this number will be uploaded, but will beignored in the analysis. It is possible to choose between different types of fold changes:Fold change, and log2-ratio.
Fold change | Automatically calculate fold change cutoff when uploading observations Automa-tically calculate fold change when uploading observation. The fold change cutoff will beset so that the number of features to include in the analysis gets as close to the targeted
CHAPTER 2. UPLOADING DATA TO IPA USING THE PATHWAY ANALYSIS TOOL 9
number as possible (see below). When this option is used, it is not necessary to set the"Fold change | Analysis cutoff", since it is automatically calculated by the tool for eachstatistical comparison. When using this option, the fold change analysis cutoff can bedifferent for each statistical comparison.
Fold change | Target number of analysis features Enabled ony when using automatically calcu-lated fold change. The fold change cutoff will be set so that the number of features toinclude in the analysis gets as close to the targeted number as possible
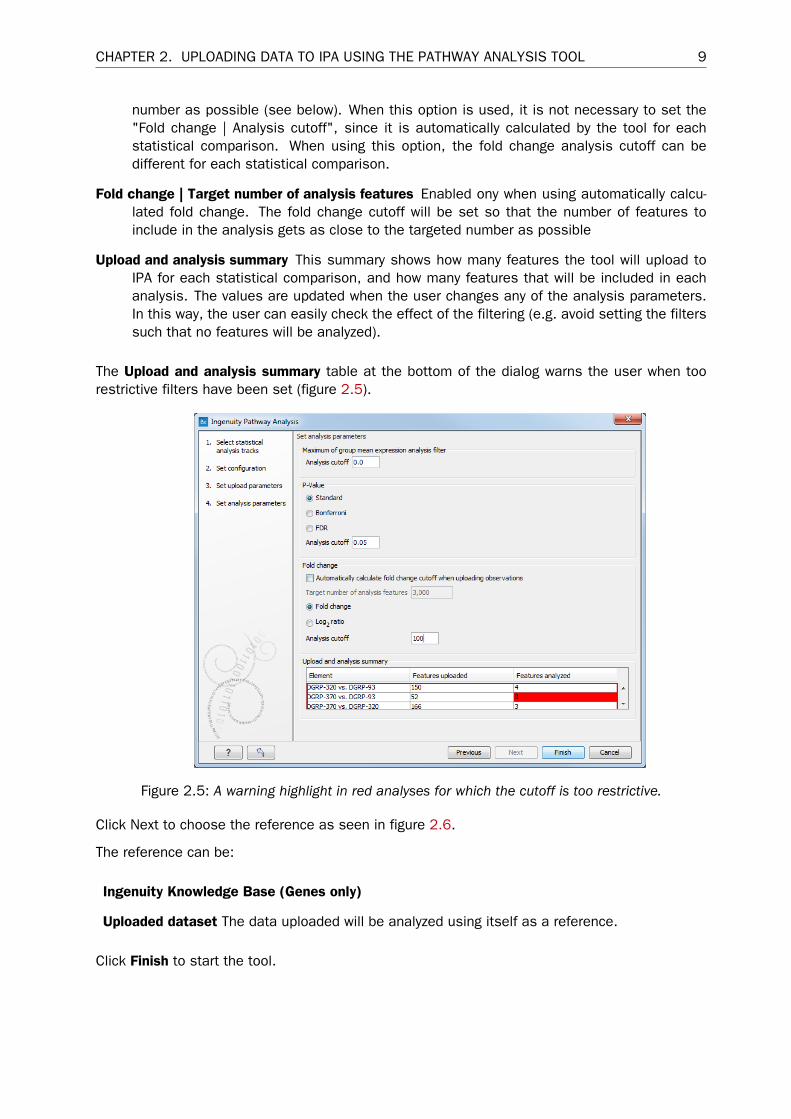
Upload and analysis summary This summary shows how many features the tool will upload toIPA for each statistical comparison, and how many features that will be included in eachanalysis. The values are updated when the user changes any of the analysis parameters.In this way, the user can easily check the effect of the filtering (e.g. avoid setting the filterssuch that no features will be analyzed).
The Upload and analysis summary table at the bottom of the dialog warns the user when toorestrictive filters have been set (figure 2.5).
Figure 2.5: A warning highlight in red analyses for which the cutoff is too restrictive.
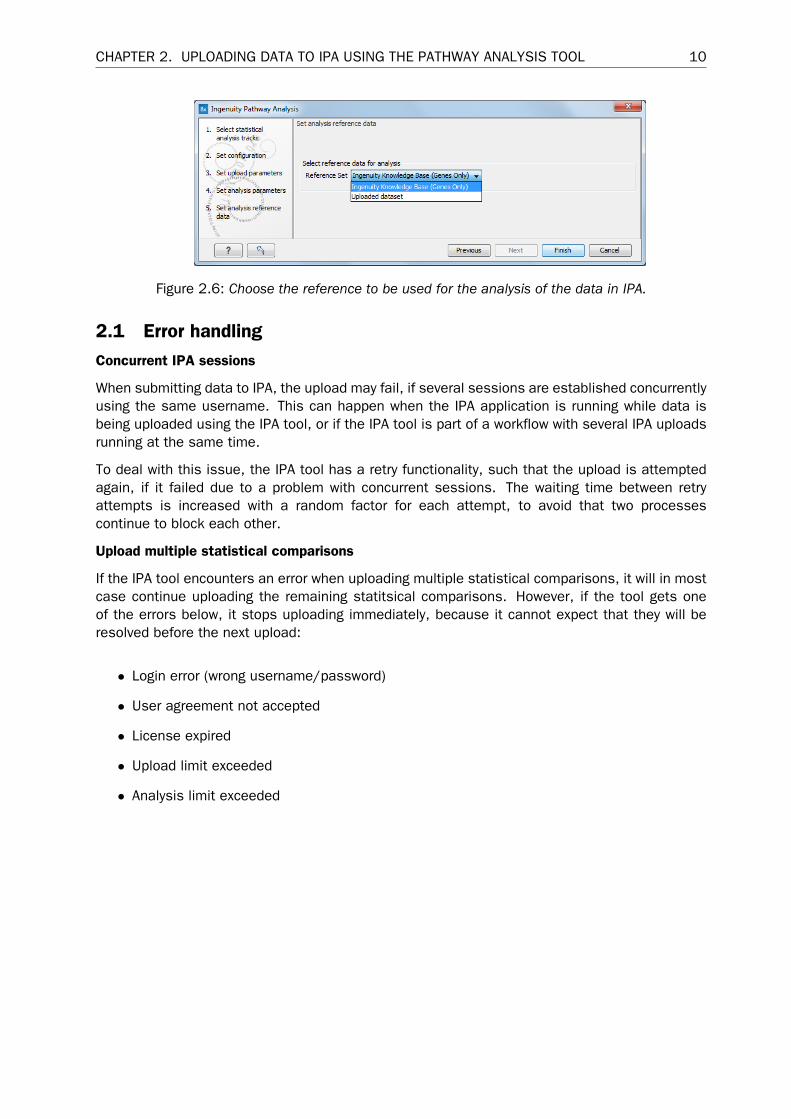
Click Next to choose the reference as seen in figure 2.6.
The reference can be:
Ingenuity Knowledge Base (Genes only)
Uploaded dataset The data uploaded will be analyzed using itself as a reference.
Click Finish to start the tool.
CHAPTER 2. UPLOADING DATA TO IPA USING THE PATHWAY ANALYSIS TOOL 10
Figure 2.6: Choose the reference to be used for the analysis of the data in IPA.
2.1 Error handlingConcurrent IPA sessions
When submitting data to IPA, the upload may fail, if several sessions are established concurrentlyusing the same username. This can happen when the IPA application is running while data isbeing uploaded using the IPA tool, or if the IPA tool is part of a workflow with several IPA uploadsrunning at the same time.
To deal with this issue, the IPA tool has a retry functionality, such that the upload is attemptedagain, if it failed due to a problem with concurrent sessions. The waiting time between retryattempts is increased with a random factor for each attempt, to avoid that two processescontinue to block each other.
Upload multiple statistical comparisons
If the IPA tool encounters an error when uploading multiple statistical comparisons, it will in mostcase continue uploading the remaining statitsical comparisons. However, if the tool gets oneof the errors below, it stops uploading immediately, because it cannot expect that they will beresolved before the next upload:
• Login error (wrong username/password)
• User agreement not accepted
• License expired
• Upload limit exceeded
• Analysis limit exceeded
Chapter 3
Using the Workflow Analyze ExpressionData and Upload Comparisons to IPA
Ingenuity Pathway Analysis Plugin includes the workflow Analyze Expression Data and UploadComparisons to IPA. The workflow takes expression data as input, and analyzes them using thetools in the RNA-Seq Analysis folder. It then submits the comparison to IPA using the PathwayAnalysis tool.
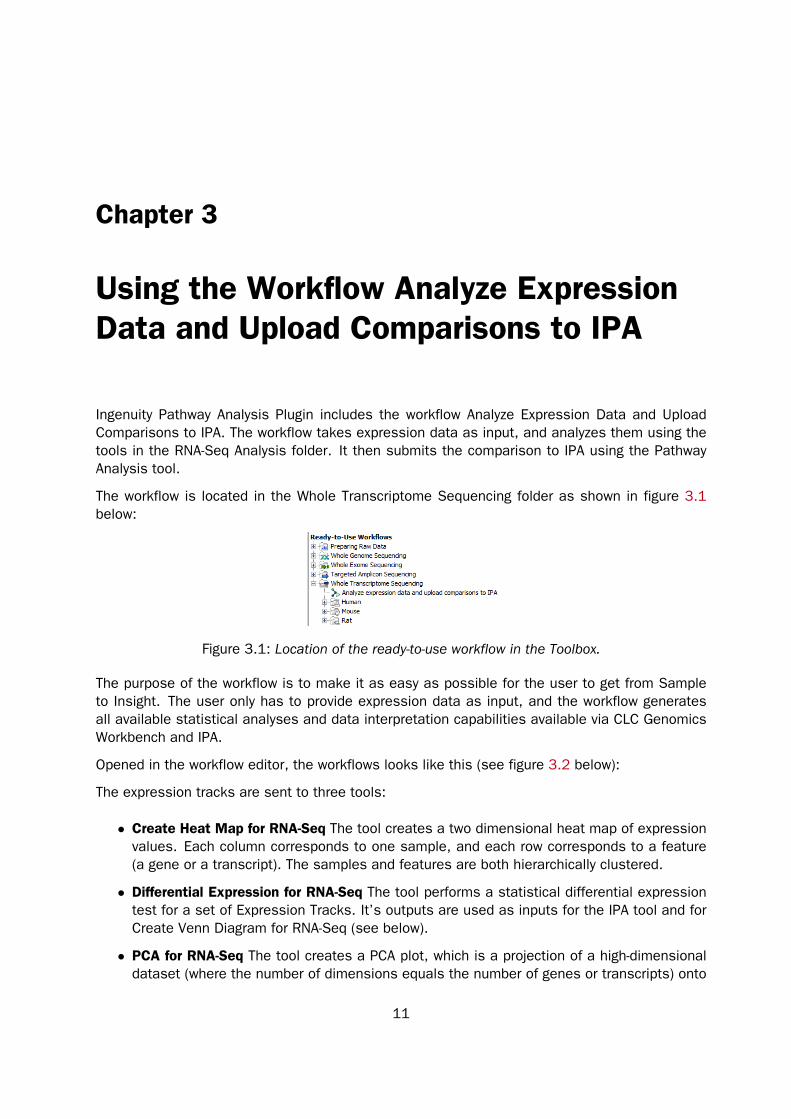
The workflow is located in the Whole Transcriptome Sequencing folder as shown in figure 3.1below:
Figure 3.1: Location of the ready-to-use workflow in the Toolbox.
The purpose of the workflow is to make it as easy as possible for the user to get from Sampleto Insight. The user only has to provide expression data as input, and the workflow generatesall available statistical analyses and data interpretation capabilities available via CLC GenomicsWorkbench and IPA.
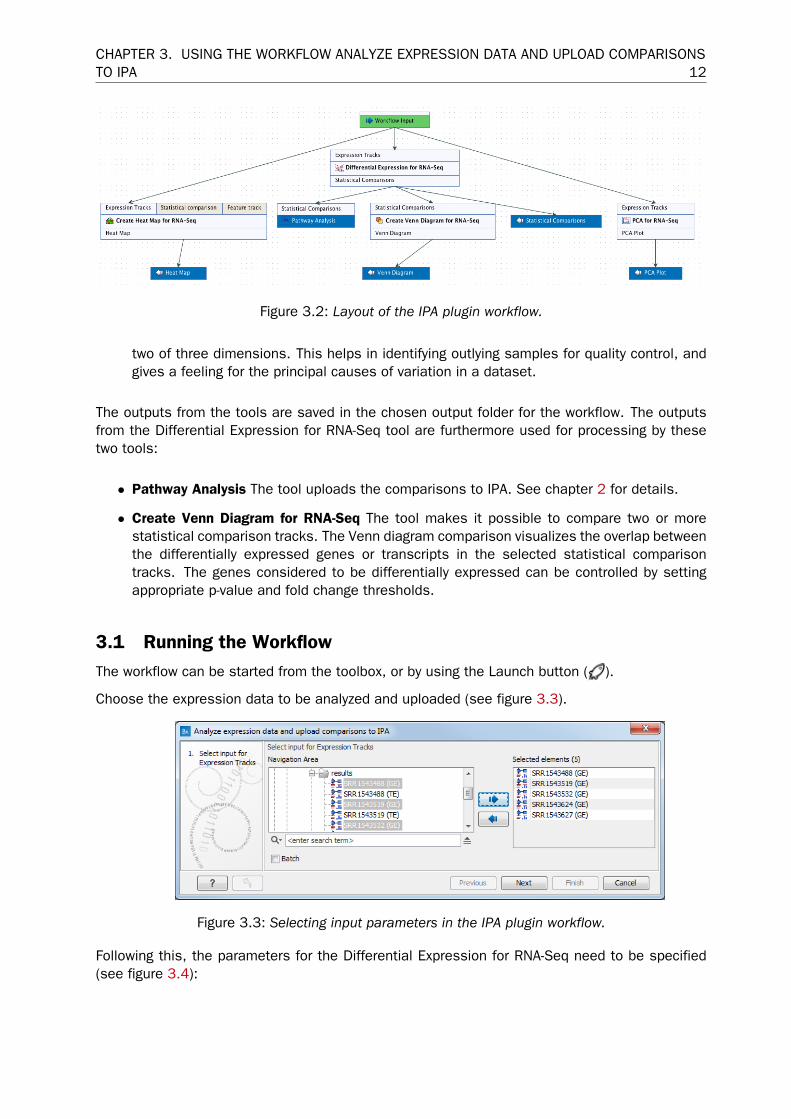
Opened in the workflow editor, the workflows looks like this (see figure 3.2 below):
The expression tracks are sent to three tools:
• Create Heat Map for RNA-Seq The tool creates a two dimensional heat map of expressionvalues. Each column corresponds to one sample, and each row corresponds to a feature(a gene or a transcript). The samples and features are both hierarchically clustered.
• Differential Expression for RNA-Seq The tool performs a statistical differential expressiontest for a set of Expression Tracks. It’s outputs are used as inputs for the IPA tool and forCreate Venn Diagram for RNA-Seq (see below).
• PCA for RNA-Seq The tool creates a PCA plot, which is a projection of a high-dimensionaldataset (where the number of dimensions equals the number of genes or transcripts) onto
11
CHAPTER 3. USING THE WORKFLOW ANALYZE EXPRESSION DATA AND UPLOAD COMPARISONSTO IPA 12
Figure 3.2: Layout of the IPA plugin workflow.
two of three dimensions. This helps in identifying outlying samples for quality control, andgives a feeling for the principal causes of variation in a dataset.
The outputs from the tools are saved in the chosen output folder for the workflow. The outputsfrom the Differential Expression for RNA-Seq tool are furthermore used for processing by thesetwo tools:
• Pathway Analysis The tool uploads the comparisons to IPA. See chapter 2 for details.
• Create Venn Diagram for RNA-Seq The tool makes it possible to compare two or morestatistical comparison tracks. The Venn diagram comparison visualizes the overlap betweenthe differentially expressed genes or transcripts in the selected statistical comparisontracks. The genes considered to be differentially expressed can be controlled by settingappropriate p-value and fold change thresholds.
3.1 Running the WorkflowThe workflow can be started from the toolbox, or by using the Launch button ( ).
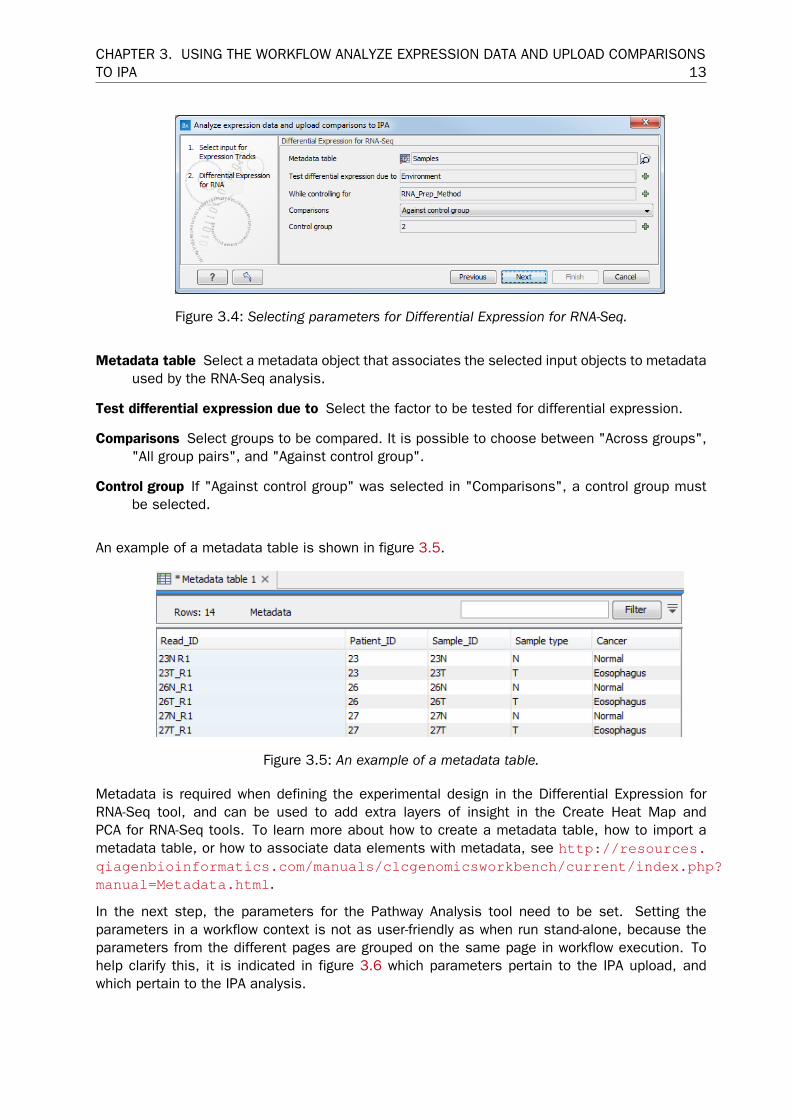
Choose the expression data to be analyzed and uploaded (see figure 3.3).
Figure 3.3: Selecting input parameters in the IPA plugin workflow.
Following this, the parameters for the Differential Expression for RNA-Seq need to be specified(see figure 3.4):
CHAPTER 3. USING THE WORKFLOW ANALYZE EXPRESSION DATA AND UPLOAD COMPARISONSTO IPA 13
Figure 3.4: Selecting parameters for Differential Expression for RNA-Seq.
Metadata table Select a metadata object that associates the selected input objects to metadataused by the RNA-Seq analysis.
Test differential expression due to Select the factor to be tested for differential expression.
Comparisons Select groups to be compared. It is possible to choose between "Across groups","All group pairs", and "Against control group".
Control group If "Against control group" was selected in "Comparisons", a control group mustbe selected.
An example of a metadata table is shown in figure 3.5.
Figure 3.5: An example of a metadata table.
Metadata is required when defining the experimental design in the Differential Expression forRNA-Seq tool, and can be used to add extra layers of insight in the Create Heat Map andPCA for RNA-Seq tools. To learn more about how to create a metadata table, how to import ametadata table, or how to associate data elements with metadata, see http://resources.qiagenbioinformatics.com/manuals/clcgenomicsworkbench/current/index.php?manual=Metadata.html.
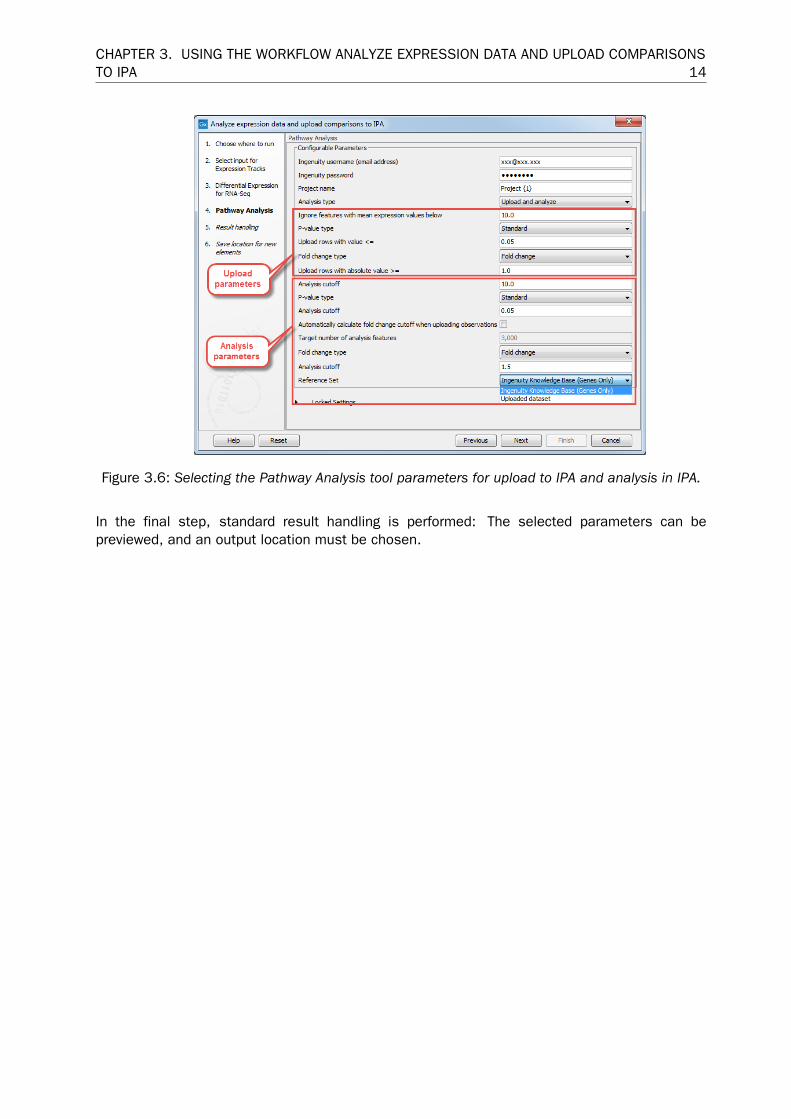
In the next step, the parameters for the Pathway Analysis tool need to be set. Setting theparameters in a workflow context is not as user-friendly as when run stand-alone, because theparameters from the different pages are grouped on the same page in workflow execution. Tohelp clarify this, it is indicated in figure 3.6 which parameters pertain to the IPA upload, andwhich pertain to the IPA analysis.
CHAPTER 3. USING THE WORKFLOW ANALYZE EXPRESSION DATA AND UPLOAD COMPARISONSTO IPA 14
Figure 3.6: Selecting the Pathway Analysis tool parameters for upload to IPA and analysis in IPA.
In the final step, standard result handling is performed: The selected parameters can bepreviewed, and an output location must be chosen.
Chapter 4
Uploading data to IPA using the PathwayAnalysis (legacy) tool
Launch the Pathway Analysis (legacy) tool from
Legacy | Pathway Analysis
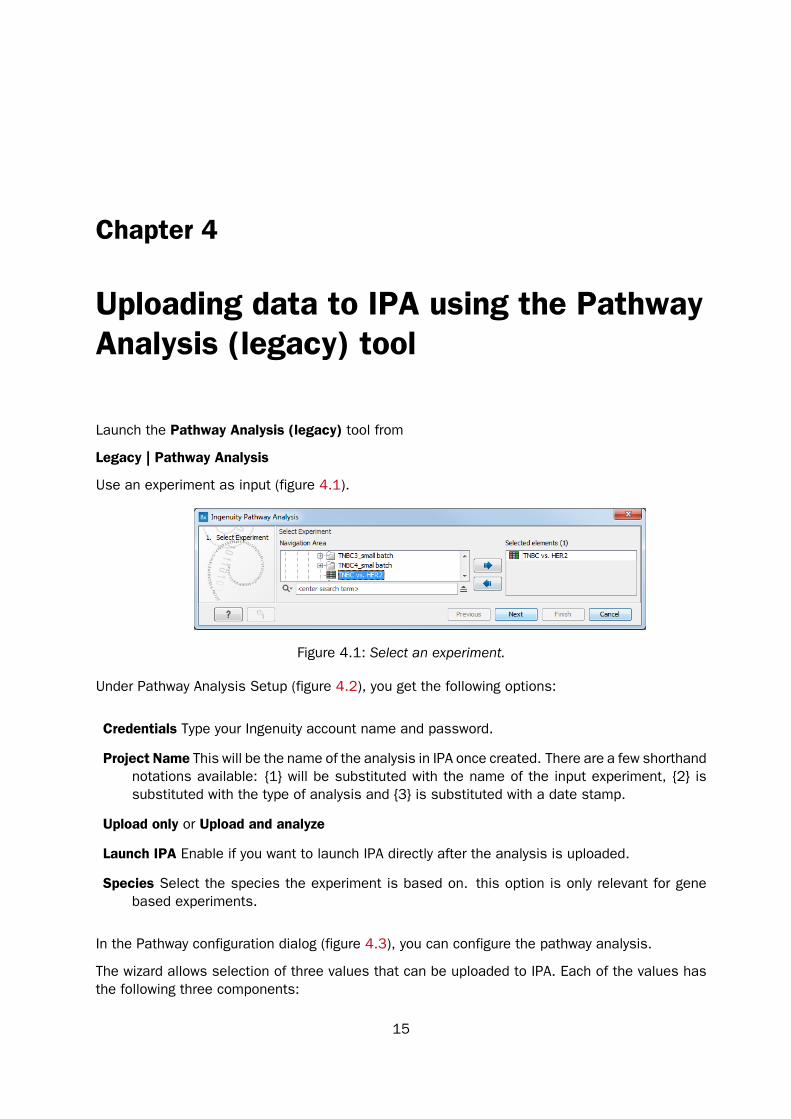
Use an experiment as input (figure 4.1).
Figure 4.1: Select an experiment.
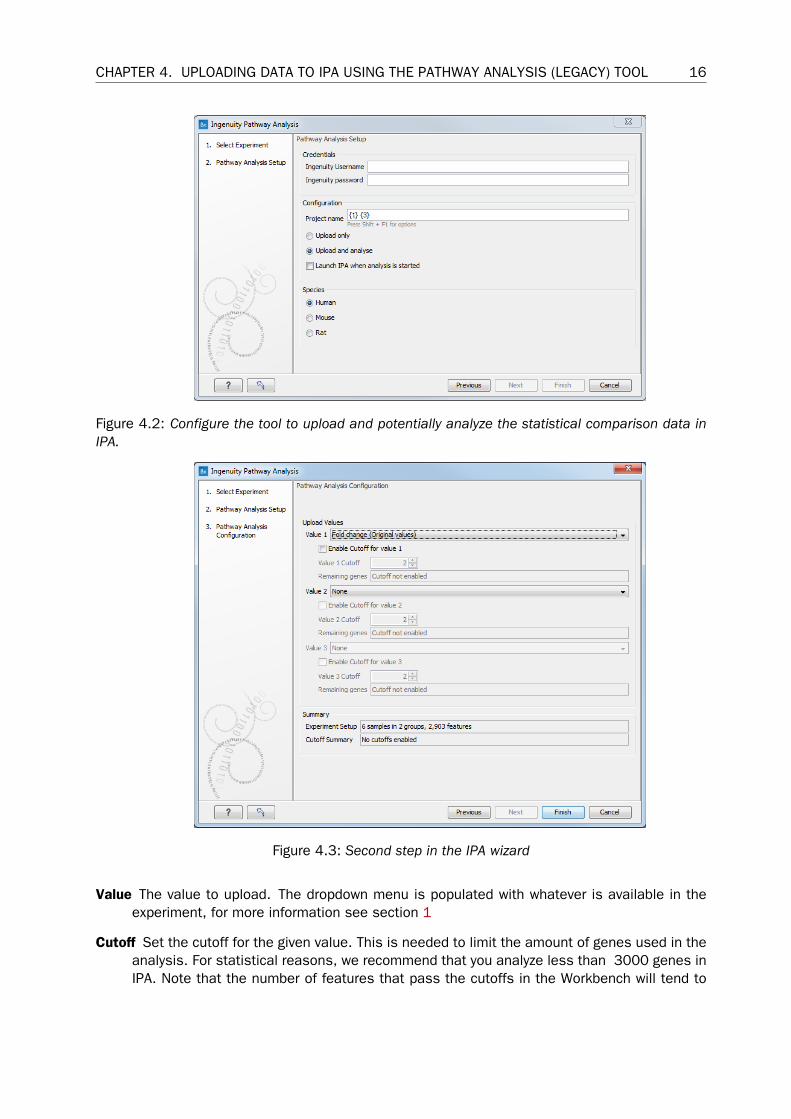
Under Pathway Analysis Setup (figure 4.2), you get the following options:
Credentials Type your Ingenuity account name and password.
Project Name This will be the name of the analysis in IPA once created. There are a few shorthandnotations available: {1} will be substituted with the name of the input experiment, {2} issubstituted with the type of analysis and {3} is substituted with a date stamp.
Upload only or Upload and analyze
Launch IPA Enable if you want to launch IPA directly after the analysis is uploaded.
Species Select the species the experiment is based on. this option is only relevant for genebased experiments.
In the Pathway configuration dialog (figure 4.3), you can configure the pathway analysis.
The wizard allows selection of three values that can be uploaded to IPA. Each of the values hasthe following three components:
15
CHAPTER 4. UPLOADING DATA TO IPA USING THE PATHWAY ANALYSIS (LEGACY) TOOL 16
Figure 4.2: Configure the tool to upload and potentially analyze the statistical comparison data inIPA.
Figure 4.3: Second step in the IPA wizard
Value The value to upload. The dropdown menu is populated with whatever is available in theexperiment, for more information see section 1
Cutoff Set the cutoff for the given value. This is needed to limit the amount of genes used in theanalysis. For statistical reasons, we recommend that you analyze less than 3000 genes inIPA. Note that the number of features that pass the cutoffs in the Workbench will tend to
CHAPTER 4. UPLOADING DATA TO IPA USING THE PATHWAY ANALYSIS (LEGACY) TOOL 17
be larger than the number of total analyzed genes in IPA.
Remaining genes The number of features that pass the cutoff criteria. This is dynamicallyupdated as the cutoff is adjusted.
The last part of the wizard is a summary with information about the sample, but also an overallcutoff summary that shows the number of genes that pass ALL of the cutoff criteria.
When the experiment is uploaded, further analysis is performed in IPA. It is possible to launchIPA in several ways:
From the wizard Check to launch IPA automatically in the wizard. When the analysis is uploadedit will launch IPA
From e-mail When an analysis is complete an e-mail is sent with a link
Manually Go directly to the IPA login page https://analysis.ingenuity.com/pa.
Chapter 5
Analyzing Data in IPA
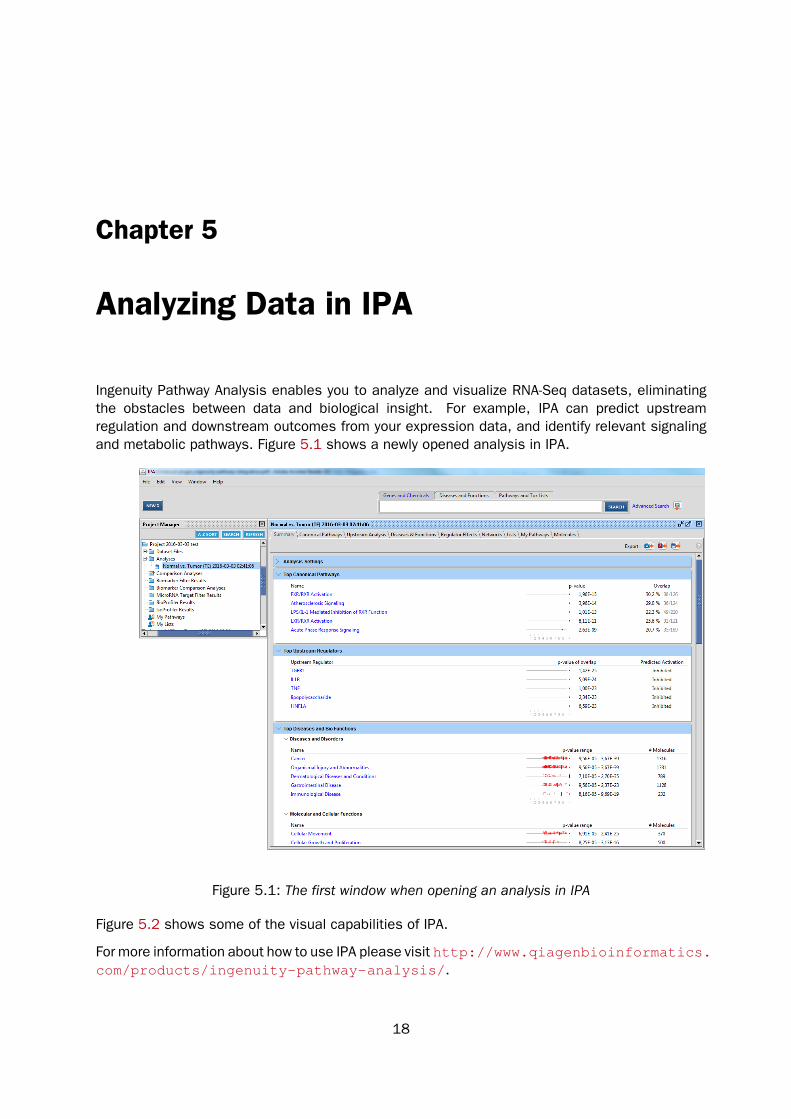
Ingenuity Pathway Analysis enables you to analyze and visualize RNA-Seq datasets, eliminatingthe obstacles between data and biological insight. For example, IPA can predict upstreamregulation and downstream outcomes from your expression data, and identify relevant signalingand metabolic pathways. Figure 5.1 shows a newly opened analysis in IPA.
Figure 5.1: The first window when opening an analysis in IPA
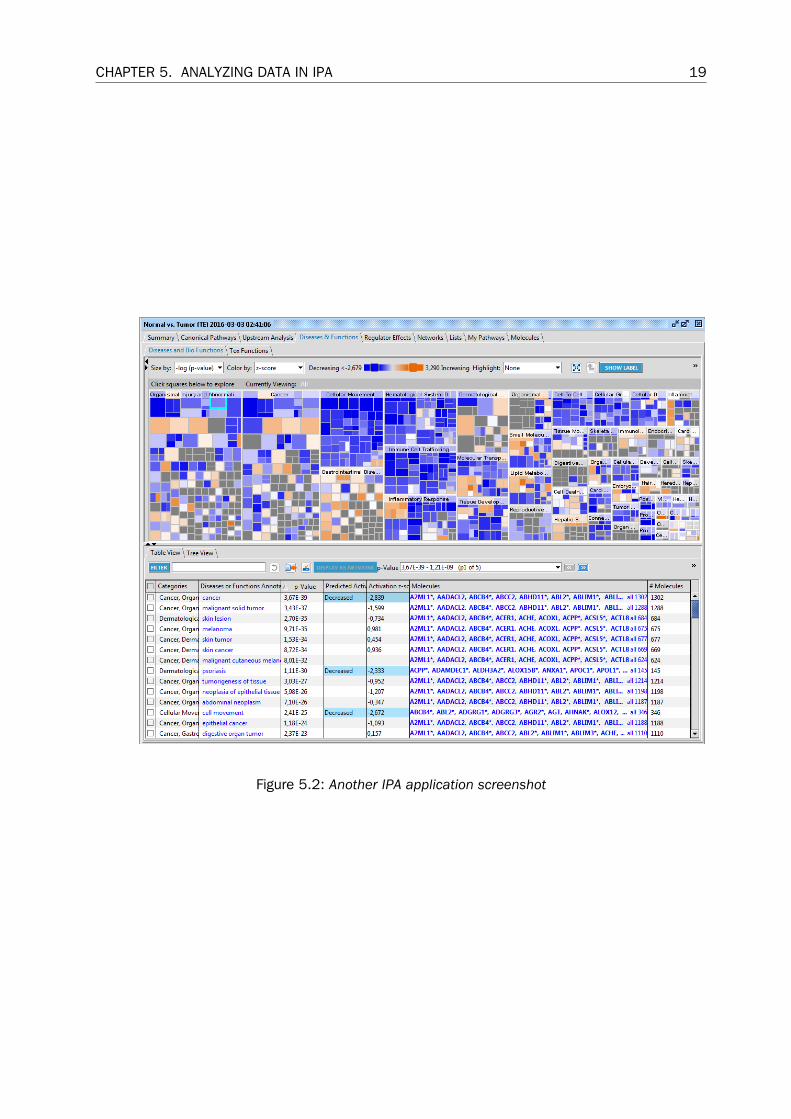
Figure 5.2 shows some of the visual capabilities of IPA.
For more information about how to use IPA please visit http://www.qiagenbioinformatics.com/products/ingenuity-pathway-analysis/.
18
CHAPTER 5. ANALYZING DATA IN IPA 19
Figure 5.2: Another IPA application screenshot
Chapter 6
Install and uninstall plugins
Ingenuity Pathway Analysis is installed as a plugin.
Note: In order to install plugins and modules, the Workbench must be run in administrator mode.On Linux and Mac, it means you must be logged in as an administrator. On Windows, you can dothis by right-clicking the program shortcut and choosing "Run as Administrator".
Plugins are installed and uninstalled using the plugin manager.
Help in the Menu Bar | Plugins... ( ) or Plugins ( ) in the Toolbar
The plugin manager has two tabs at the top:
• Manage Plugins. This is an overview of plugins that are installed.
• Download Plugins. This is an overview of available plugins on QIAGEN Aarhus server.
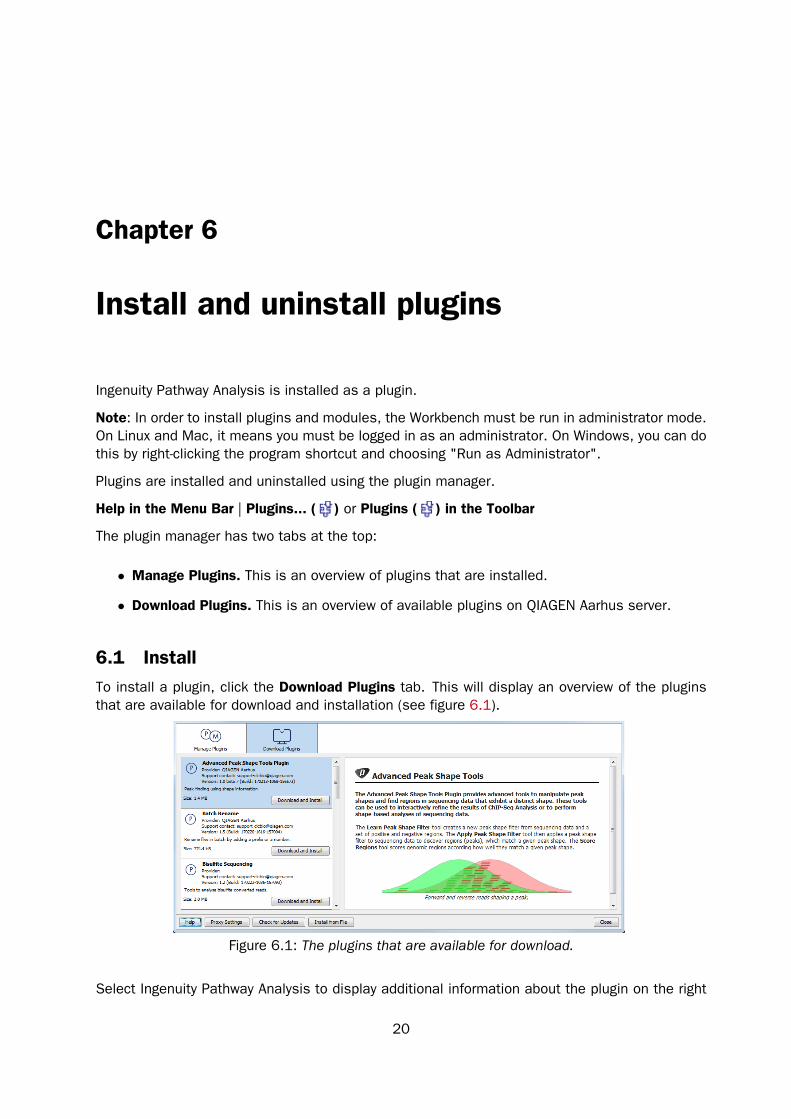
6.1 InstallTo install a plugin, click the Download Plugins tab. This will display an overview of the pluginsthat are available for download and installation (see figure 6.1).
Figure 6.1: The plugins that are available for download.
Select Ingenuity Pathway Analysis to display additional information about the plugin on the right
20
CHAPTER 6. INSTALL AND UNINSTALL PLUGINS 21
side of the dialog. Click Download and Install to add the plugin functionalities to your workbench.
Accepting the license agreement
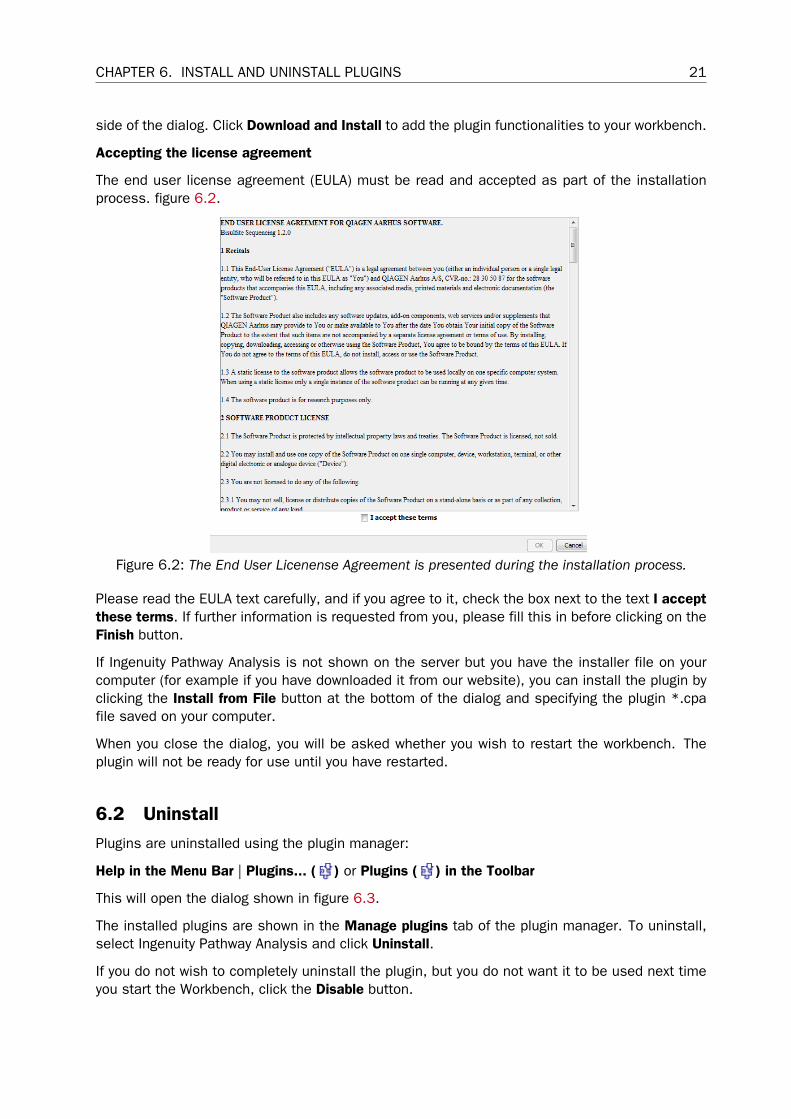
The end user license agreement (EULA) must be read and accepted as part of the installationprocess. figure 6.2.
Figure 6.2: The End User Licenense Agreement is presented during the installation process.
Please read the EULA text carefully, and if you agree to it, check the box next to the text I acceptthese terms. If further information is requested from you, please fill this in before clicking on theFinish button.
If Ingenuity Pathway Analysis is not shown on the server but you have the installer file on yourcomputer (for example if you have downloaded it from our website), you can install the plugin byclicking the Install from File button at the bottom of the dialog and specifying the plugin *.cpafile saved on your computer.
When you close the dialog, you will be asked whether you wish to restart the workbench. Theplugin will not be ready for use until you have restarted.
6.2 UninstallPlugins are uninstalled using the plugin manager:
Help in the Menu Bar | Plugins... ( ) or Plugins ( ) in the Toolbar
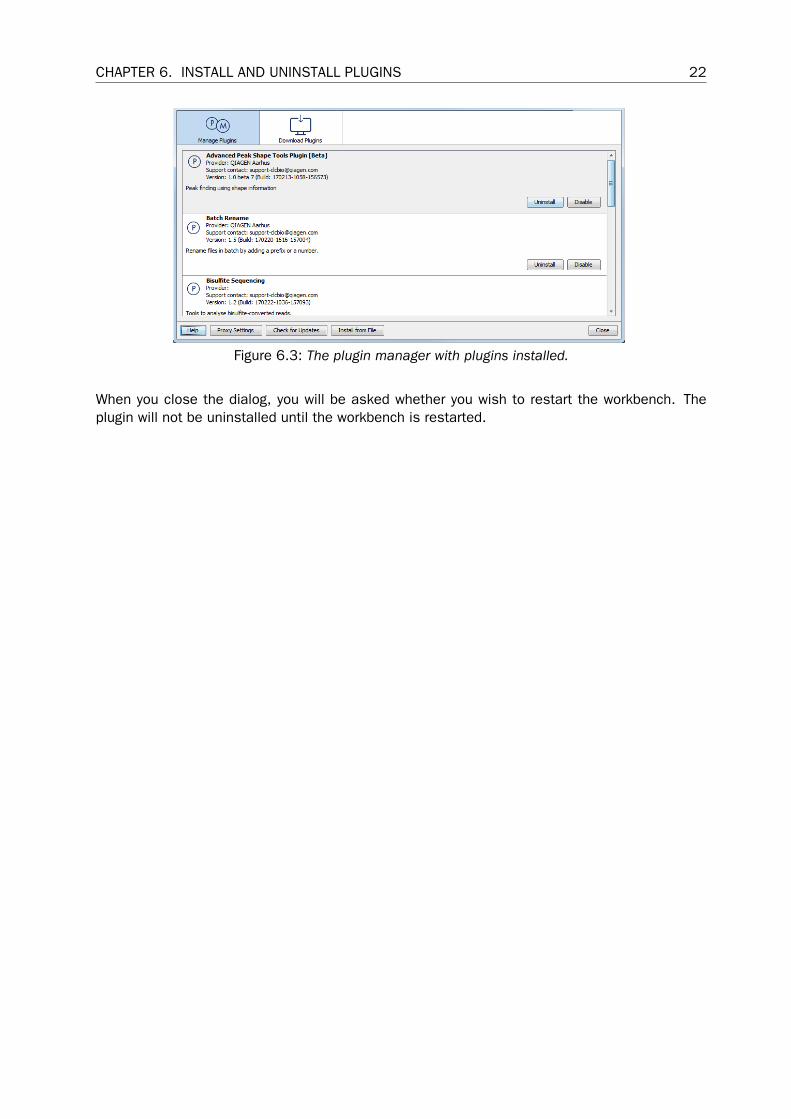
This will open the dialog shown in figure 6.3.
The installed plugins are shown in the Manage plugins tab of the plugin manager. To uninstall,select Ingenuity Pathway Analysis and click Uninstall.
If you do not wish to completely uninstall the plugin, but you do not want it to be used next timeyou start the Workbench, click the Disable button.
CHAPTER 6. INSTALL AND UNINSTALL PLUGINS 22
Figure 6.3: The plugin manager with plugins installed.
When you close the dialog, you will be asked whether you wish to restart the workbench. Theplugin will not be uninstalled until the workbench is restarted.