ING Full Year 2014 Review (Media Presentation)
20
ING Full Year 2014 Review Solid progress on restructuring, strategy and results Ralph Hamers CEO ING Group Amsterdam - 11 February 2014 www.ing.com
-
Upload
ing-group -
Category
Economy & Finance
-
view
2.573 -
download
0
Transcript of ING Full Year 2014 Review (Media Presentation)

ING Full Year 2014 Review Solid progress on restructuring, strategy and results Ralph Hamers CEO ING Group
Amsterdam - 11 February 2014 www.ing.com

Key highlights
2
• We made significant progress in our restructuring programme in 2014
• All State Aid programmes concluded, with the Dutch state fully repaid in November;
• Divestment programme nearly final: NN Group listed, ING stake reduced to 68%; Voya stake sold down to 19%;
• Think Forward Bank strategy launched in March 2014 - embedded throughout the organisation
• More than one million individual customers and half a million primary customers added
• Steady stream of innovations to create a differentiating customer experience introduced during 2014
• Strong full year result reflects higher interest results, strict expense control and lower risk costs
• Underlying net result ING Bank rose to EUR 3,424 in 2014, up 8.5% from 2013
• Fourth quarter results impacted by negative CVA/DVA, redundancy provisions, Dutch Bank tax and seasonality in Financial Markets
• Dividend payments reinstated for 2014; we propose to pay EUR 0.12 per share; guidance confirmed: pay-out a minimum of 40% of ING
Group’s annual net profits, effective from 2015

ING in 2014 paid the final EUR 2.2 billion to the Dutch State
ING has concluded all the State Aid programmes in 2014
• In February 2014 the unwinding of the Back-up facility for the Alt-A portfolio was concluded at a profit of EUR 1.4 billion for the Dutch State
• In March ING redeemed the last Government Guaranteed Bonds issued in 2009. For the programme ING paid EUR 0.4 bn in fees to the State
• In November 2014 ING repaid the final tranche of Core Tier 1 Securities – 6 months ahead of schedule – giving the State a EUR 3.5 bn cash profit
Major steps in 2014 to complete restructuring
3
13,531
EUR 5.5 bn in divestments executed/concluded in 2014
ING has almost completed its divestment programme
• Significant steps taken on the divestment programme with EUR 5.5 billion in proceeds realised in 2014
• NN Group stake reduced to 68% through IPO and conversion of notes sold to anchor investors
• Stake in Voya Financial reduced from 57% to 19%; sale of SulAmerica stake completed
Proceeds in EUR mln as reported at time of closing Payments in EUR mln
10,000
5,000
2,000 750
750
1,500
10,000
1,031
1,000 375
408
717
3,531
Oct2008
2009 2011 2012 2013 2014 Totalpayments
Core Tier 1 Securities Premium & Coupons
170
950
170
1,770
450
900
1,100
1Q - 11.3% of SulAmerica
1Q - 14% of Voya Financial
2Q - 10% of SulAmerica
3Q - 25.2% of NN Group
3Q - 6.5% of NN Group
3Q - 11% of Voya Financial
3Q - 13.5% of Voya Financial

ING Bank made strong progress on strategic initiatives in 2014
4
We launched our Think Forward Bank strategy in March 2014
We added more than 1 mln individual customers in 2014
Individual customers Primary customers*
*Primary customer: payment customer with recurrent income and at least one extra product
+3.8% +6.5%
Creating a differentiating customer experience
• Investment in omni-channel approach in the Netherlands to create consistent customer experience
• Biometrics technology introduced in Belgium allows retail customers to use fingerprints to access their mobile app
• ´Photo Transfer´ introduced in Germany allowing customers to prepare payments in the app by taking a picture of an invoice
• Multi-product and multi-country portal provides Commercial Banking clients integrated access to products and services
31.4 32.6
2013 2014
7.7 8.2
2013 2014

Awards mean recognition from experts and customers
BELGIUM &
THE NETHERLANDS
Best Bank Western Europe, Belgium, the Netherlands
Best Trade Finance Bank the Netherlands, Romania
Best Supply Chain Provider in Central & Eastern Europe
Best T&CM Provider 2015 Belgium, the Netherlands
Best Customer Service Bank, Belgium
Best Corporate Bank Belgium
Most Innovative Bank Poland
In Germany ING DiBa was named
´Best Bank´ for the seventh time in
eleven years. It was also voted the
´most liked bank´ in a poll among
more than 200.000 banking
customers, for the eigth year in a row.
In Australia ING Direct was voted Best
Bank by 25,000 banking customers in
the Mozo People´s Choice Awards. It
also won the awards for Best Bank
Account, Best Debit Card, Best Savings
Account and top-five Home Loan.
• In 2014 ING again won many awards for its banking service, both in Retail and
Commercial Banking
• We are particularly proud of the recognition we got from customer groups like the titles
for ‘Best Bank’ in both Australia and Germany
• Apart from the award and in line with our Think Forward Strategy, we continuously
monitor customer behaviour and satisfaction to adapt our services
5

Sustainability is an integral part of our business
804 769 836
1,065 1,275 1,730 3
223
768
2012 2013 2014
ING Groenbank Renewable Energy Other projects
in EUR mln
Financing sustainable transitions
• As of 2014 we financed EUR 19.5 billion in ´sustainable transitions’
• This growing number covers lending in business areas such as energy, real estate and transport
• EUR 16.1 biliion of this was financing for clients that are ‘Environmental outperformers’ – we will report on this category going forward
• On top of this, the amount of Sustainable Assets ING manages for clients rose to EUR 1.5 billion
Sustainability Efforts recognized
• ING was named the industry leader for
‘Diversified Financials’ in the leading
Dow Jones Sustainability Index
• RobecoSAM gave ING Group the
‘Gold Class’ distinction in the
Diversified Financials industry
• For the 14th year in a row, ING was
included in the FTSE4Good Index
series
• Sustainalytics ranked ING first in a
peer analysis of companies within the
same market capitalisation range
• CDP (formerly the Carbon Disclosure
Project) included ING in their Climate
Performance Leadership Index scoring
97/100
Award winning projects
• In 2012 ING created its Sustainable
Lending team to promote sustainable
business opportunities.
• We financed the 150 MW Burgos wind
farm in the Philippines, winning the
“Asia Pacific Renewable Deal of the
Year” award
• ING participated in the financing of
Sarulla, at 320 MW the world’s largest
single contract geothermal project,
winning the ”Asia Pacific Power Deal of
the Year” award
• In Brazil we financed three 30MW wind
farms in one of the world´s best wind
resource locations
Sustainable Transitions Financed
6
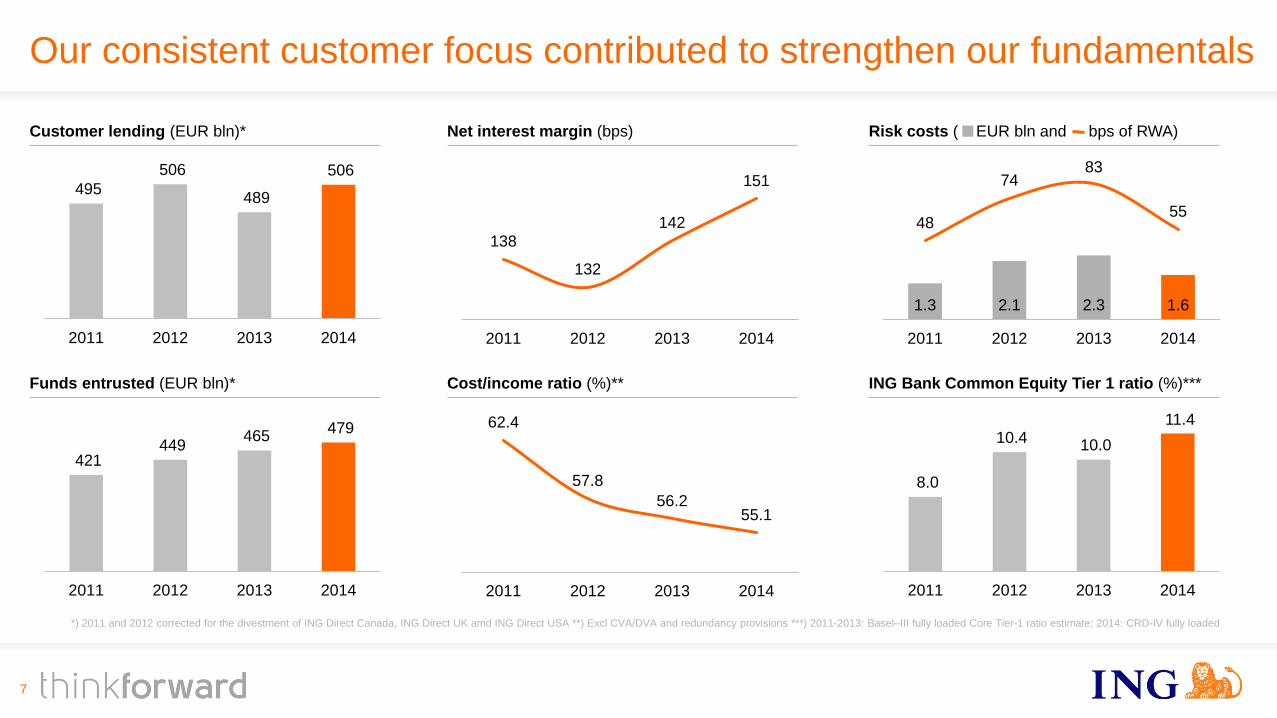
Cost/income ratio (%)**
Our consistent customer focus contributed to strengthen our fundamentals
Risk costs ( EUR bln and bps of RWA)
7
ING Bank Common Equity Tier 1 ratio (%)***
*) 2011 and 2012 corrected for the divestment of ING Direct Canada, ING Direct UK amd ING Direct USA **) Excl CVA/DVA and redundancy provisions ***) 2011-2013: Basel–III fully loaded Core Tier-1 ratio estimate; 2014: CRD-IV fully loaded
Customer lending (EUR bln)*
495
506
489
506
2011 2012 2013 2014
8.0
10.4 10.0
11.4
2011 2012 2013 2014
62.4
57.8
56.2 55.1
2011 2012 2013 2014
421 449
465 479
2011 2012 2013 2014
Funds entrusted (EUR bln)*
Net interest margin (bps)
138
132
142
151
2011 2012 2013 2014
1.3 2.1 2.3 1.6
48
74 83
55
2011 2012 2013 2014

10%
7.0%
9.0%
9.9%10-13%
9.0%
2011 2012 2013 2014 Ambition 2017
… leading to strong financial results in 2014
3,036
2,450
3,1553,424
2011 2012 2013 2014
8
• Underlying net result Banking increased to EUR 3,424 mln, up 8.5% from 2013
• Underlying net result, excluding CVA/DVA and redundancy provisions, increased 22.6% to EUR 3,922 mln
• Healthy income growth spurred by net interest income
• Lower risk costs
• The underlying return on IFRS-EU equity was 9.9% in 2014, or 11.3% excluding CVA/DVA and redundancy provisions
Underlying net result Banking increased 8.5% from 2013 (in EUR mln)
…resulting in underlying RoE of 9.9% in 2014
4Q14 Results
9

Underlying pre-tax result ING Bank (in EUR mln)
Solid fourth quarter result
• Underlying pre-tax result in 4Q14 impacted by one-off/volatile items such as CVA/DVA, redundancy provisions, bank tax and deconsolidation
Vysya
• Pre-tax result adjusted for these items up 20.5% from 4Q13
• Net interest income up 10.9%, supported by volume growth and margin improvement (from 145 bps in 4Q13 to 153 bps in 4Q14)
• Risk costs down from 4Q13
783
1,486
1,2781,176
904
4Q13 1Q14 2Q14 3Q14 4Q14
Pre-tax result ING Bank, excl. adjustments* (in EUR mln)
10
1,142
1,308 1,327 1,376
1,570
4Q13 1Q14 2Q14 3Q14 4Q14
Major adjustments
(in EUR mln)
4Q13 1Q14 2Q14 3Q14 4Q14
CVA/DVA -17 -66 -58 -69 -80
Redundancy provisions
-76 0 0 -24 -375
Bank tax* -160 -94 0 0 -138
Vysya 15 28 9 9 0
Total -238 -132 -49 -84 -593
* Bank tax in the Netherlands and Belgium
+20.5%

Lending Assets ING Bank, 2014 (Client Balances, in EUR bln)
Our core lending franchises grew by 3.8% in 2014, despite de-risking of Russian exposure and higher pre-payment levels of Dutch mortgages
Core lending businesses: EUR 18.5 bln
Our core lending franchises grew by EUR 18.5 bln, or 3.8%, in 2014
• Strong growth in Retail Banking outside of the Netherlands and in Structured Finance and Transaction Services within Commercial Banking
• Retail NL down due to higher pre-payments of Dutch mortgages and reduction in Business Lending NL, reflecting repayments and muted demand
11
489.4
506.0
5.1 1.6
5.4
6.9 2.4 0.5
8.1
-2.0
-1.4 -2.9 -4.0
-3.0
31-12-13 RetailNL
RetailBelgium
RetailGermany
Retail RoW*
CB SF*
CB REF*
CB GL&TS*
CBOther*
WUBrun-off /
transfers**
Vysyadecon-
solidation
Lease andother run
-off/sales***
FX 31-12-14
* RoW is Rest of the World; SF is Structured Finance; REF is Real Estate Finance; GL&TS is General Lending & Transaction Services; Other includes Financial Markets
** WUB run-off was EUR -1.7 bln in 2014 and transfers to NN was EUR -1.2 bln in 2014
*** Lease run-off was EUR -2.1 bln in 2014; Other run-off /sales was EUR -0.9 bln in 2014 and refers to Australian White Label mortgage portfolio that is in run-off and was partly sold in 4Q14

Net interest result continued its upward trend, supported by higher margins on customer lending
2,962
3,1563,208
2,894
2,985
145
150146
153 153
4Q13 1Q14 2Q14 3Q14 4Q14
Net interest result excluding Vysya (in EUR mln)
NIM ING Bank (based on avg Balance Sheet)
Underlying net interest income (excl. Vysya) and net interest margin (in EUR mln and bps)
-2
5
-2
4
-2
2Q14 3Q14 4Q14 4Q13 1Q14
12
Financial Markets contribution to change in NIM can be volatile
Financial Markets impact on NIM Q-on-Q (in bps)
• Net interest result rose 8.9% from 4Q13 (or 10.9% excl. Vysya) and 1.6% from 3Q14, mainly due to higher results on customer lending
• Net interest margin stable at 153 bps in 4Q14, despite lower net interest result in Financial Markets
• Lending margins increased from 3Q14 due to higher margins in Retail Benelux and Structured Finance
• Savings margins declined slightly from 3Q14, as lower client savings rates were more than offset by lower re-investment yields
+10.9%

Deposit rates have come down following a reduction in ECB rates*
ECB rate
Netherlands (profijtrekening) Belgium (Oranje boekje) Germany (core savings rate) Other EU Direct units**
2.10
1.301.10
4Q12 3Q14 4Q14
13
0.75
0.15 0.05
4Q12 3Q14 4Q14
1.75
1.000.80
4Q12 3Q14 4Q14
1.250.80 0.80
4Q12 3Q14 4Q14
-70 bps
-100 bps -95 bps -45 bps
* End of period
** Unweighted average core savings rates France, Italy and Spain
20%28%
28%23%
Retail Netherlands
Retail Belgium
Retail Germany
Retail Rest of the World
EUR
406 bln
Further scope to protect NIM in low interest environment
• In the fourth quarter, we have reduced savings rates in the Netherlands, Belgium, France, Poland and Romania
• ING further reduced client savings rates in 1Q15 in Spain
• We will continue to review our client rate proposition given low interest rate environment
Funds Entrusted Retail Banking, breakdown by business segment (in %, 4Q14)
Savings rates further reduced, but savings margin slightly down due to lower re-investment yields
1.270.90 0.83
4Q12 3Q14 4Q14
-44 bps

We remain vigilant on expenses
14
• Underlying expenses in the fourth quarter were impacted by the redundancy provisions of EUR 375 mln and the Dutch bank tax of EUR 138 mln
• Excluding the provisions and bank tax, operating expenses declined by 2.6% from 4Q13 due to the benefits of ongoing cost-savings initiatives, the deconsolidation of Vysya and a large regulatory provision release in the Corporate Line, which more than offset higher pension costs in the Netherlands and investments in future growth
• The cost/income ratio, excl. CVA/DVA, redundancy provision and bank tax, was 53.7% in 4Q14, down from 4Q13 and up from 3Q14
149138
11
94
76375
2,0592,1102,0982,0802,115
24
4Q13 1Q14 2Q14 3Q14 4Q14
Expenses Dutch bank taxes Belgium bank taxes Restructuring costs
Underlying operating expenses (in EUR bln)
Cost/income ratio excl. CVA/DVA, redundancy provisions and bank tax (in %)
53.7%
52.6%
54.7%
53.6%
55.2%
4Q13 1Q14 2Q14 3Q14 4Q14

…but risk costs Retail Banking trending down (in EUR mln)
Risk costs down from 4Q13; up from 3Q14, which was positively impacted by a release on a large file
70
441866
152
234180 165
79
63
177
34
4Q13 3Q14 4Q14
Retail Netherlands Retail Belgium
Retail International Commercial Banking
• Risk costs Commercial Banking increased to EUR 152 mln in 4Q14, from EUR 34 mln in 3Q14, which was flattered by a release on a large file
• Risk costs in Retail Banking decreased from the previous quarter, driven by Retail Netherlands and Retail Belgium
560
468405
322400
81
65
54
44
55
4Q13 1Q14 2Q14 3Q14 4Q14
In EUR mln In bps of avg RWA (annualised)
560
Risk costs increased in 4Q14… (in EUR mln and bps of avg RWA)
322
400
15

Strong capital position at Bank and Group level…
16
• ING Bank’s CET1 ratio on a fully-loaded basis increased to 11.4% due to retained earnings and higher revaluation reserves
• ING Group CET1 phased-in ratio increased to 13.5% in 4Q14, from 13.2% in 3Q14, largely due to the net profit in 4Q14 after excluding the proposed dividend. This ratio is well in excess of 10.5%, which we understand will be the regulatory guidance level for the Group
• Following the divestment of the Insurance stakes, the pro-forma Group CET1 ratio on a fully loaded basis is 13.1%, well in excess of the Bank
ING Bank CET1 fully-loaded ratio increased to 11.4% ING Group CET1 phased-in ratio increased to 13.5%
13.2% 13.5%
3Q14 4Q14
11.1% 11.4%
3Q14 4Q14

40%
4Q14 2015F
…as well as strong Group results enable us to begin returning capital to our shareholders ahead of schedule
17
• ING Group fourth-quarter net profit EUR 1,176 mln (EUR 0.30 per share), including special items and Insurance results
• ING reinstates dividend payments on ordinary shares and will propose to pay EUR 470 mln or EUR 0.12 per share at the AGM
• Our intention is to pay a minimum of 40% of ING Group’s annual net profits by way of dividend, with effect from 2015
• Furthermore, at the end of each financial year, the Board will recommend whether to return additional capital to shareholders dependent on financial, strategic and regulatory considerations
1,176
530548 -18
2418
226
Underlying net
result Banking
4Q14
Special items
after tax
Net result
Banking
Net result NN
Group
Net result
Voya*
Other Net result ING
Group 4Q14
* ING’s stake in Voya has been reduced to 19% in 4Q14. Consequently, ING lost significant influence and will account for its stake in Voya as an AFS investment going forward. The financial impact of the
sale in 4Q14 is reflected in the EUR 418 mln net result from discontinued operations of Voya
4Q14 net result ING Group includes net results NN Group and Voya (in EUR mln)
Dividend pay-out ratio (in % of Group net profit)
≥ 40%

Our intention is to pay a minimum of 40% of ING Group’s annual net profits by way of dividend
18
2013 2014 Ambition
2017 Guidance
CET1 (CRD IV)* 10.0% 11.4% >10% • We will maintain a comfortable buffer above the minimum 10%
to absorb regulatory changes and potential volatility
Leverage** 3.9% 4.1% ~4%
C/I*** 56.2% 55.1% 50-53% • Aim to reach 50-53% cost/income ratio in 2016. Over time,
improve further towards the lower-end of the range
RoE (IFRS-EU equity)
9.0% 9.9% 10-13%
Dividend pay-out
40% of 4Q Group net profit
40%
• Target dividend pay-out 40% of ING Group’s annual net profit
• Interim and final dividend; final may be increased with additional capital return
* 2013 is pro-forma for CRD IV
** The leverage exposure of 4.1% at the end of 2014 is calculated using the published IFRS-EU balance sheet, in which notional cash pooling activities are netted, plus off-balance-sheet commitments.
In January 2015, the EC formally adopted the Delegated Act for the leverage ratio. The pro-forma leverage ratio of ING Bank, taking into account the combined impact of grossing up the notional cash pool
activities and the alignment with the Delegated Act, is 3.6%.
*** Excluding CVA/DVA and redundancy costs

Wrap up
19
• We made significant progress in our restructuring programme in 2014
• All State Aid programmes concluded, with the Dutch state fully repaid in November;
• Divestment programme nearly final: NN Group listed, ING stake reduced to 68%; Voya stake sold down to 19%;
• Think Forward Bank strategy launched in March 2014 - embedded throughout the organisation
• More than one million individual customers and half a million primary customers added
• Steady stream of innovations to create a differentiating customer experience introduced during 2014
• Strong full year result reflects higher interest results, strict expense control and lower risk costs
• Underlying net result ING Bank rose to EUR 3,424 in 2014, up 8.5% from 2013
• Fourth quarter results impacted by negative CVA/DVA, redundancy provisions, Dutch Bank tax and seasonality in Financial Markets
• Dividend payments reinstated for 2014; we propose to pay EUR 0.12 per share; guidance confirmed: pay-out a minimum of 40% of ING
Group’s annual net profits, effective from 2015
ING Group’s Annual Accounts are prepared in accordance with International Financial Reporting Standards as adopted by the European Union (‘IFRS-EU’).
In preparing the financial information in this document, the same accounting principles are applied as in the 3Q2014 ING Group Interim Accounts. The Financial statements for 2014 are in progress and may be subject to adjustments from subsequent events. All figures in this document are unaudited. Small differences are possible in the tables due to rounding.
Certain of the statements contained herein are not historical facts, including, without limitation, certain statements made of future expectations and other forward-looking statements that are based on management’s current views and assumptions and involve known and unknown risks and uncertainties that could cause actual results, performance or events to differ materially from those expressed or implied in such statements. Actual results, performance or events may differ materially from those in such statements due to, without limitation: (1) changes in general economic conditions, in particular economic conditions in ING’s core markets, (2) changes in performance of financial markets, including developing markets, (3) consequences of a potential (partial) break-up of the euro, (4) the implementation of ING’s restructuring plan to separate banking and insurance operations, (5) changes in the availability of, and costs associated with, sources of liquidity such as interbank funding, as well as conditions in the credit markets generally, including changes in borrower and counterparty creditworthiness, (6) the frequency and severity of insured loss events, (7) changes affecting mortality and morbidity levels and trends, (8) changes affecting persistency levels, (9) changes affecting interest rate levels, (10) changes affecting currency exchange rates, (11) changes in investor, customer and policyholder behaviour, (12) changes in general competitive factors, (13) changes in laws and regulations, (14) changes in the policies of governments and/or regulatory authorities, (15) conclusions with regard to purchase accounting assumptions and methodologies, (16) changes in ownership that could affect the future availability to us of net operating loss, net capital and built-in loss carry forwards, (17) changes in credit ratings, (18) ING’s ability to achieve projected operational synergies and (19) the other risks and uncertainties detailed in the Risk Factors section contained in the most recent annual report of ING Groep N.V. Any forward-looking statements made by or on behalf of ING speak only as of the date they are made, and, ING assumes no obligation to publicly update or revise any forward-looking statements, whether as a result of new information or for any other reason.
This document does not constitute an offer to sell, or a solicitation of an offer to purchase, any securities in the United States or any other jurisdiction. The securities of NN Group have not been and will not be registered under the U.S. Securities Act of 1933, as amended (the “Securities Act”), and may not be offered or sold within the United States absent registration or an applicable exemption from the registration requirements of the Securities Act.
www.ing.com
Important legal information
20