
ING Bank recorded underlying 3Q16 net profit of EUR 1,336 million
34
Third quarter 2016 Results Ralph Hamers, CEO ING Group ING posts 3Q16 underlying net profit of EUR 1,336 million Amsterdam • 3 November 2016
-
Upload
ing -
Category
Economy & Finance
-
view
1.023 -
download
1
Transcript of ING Bank recorded underlying 3Q16 net profit of EUR 1,336 million

ING Orange
RGB= 255, 98, 0
ING Light Grey
RGB= 168, 168, 168
ING Indigo
RGB= 82, 81, 153
ING Sky
RGB= 96, 166, 218
Colour Guidelines
ING Fuchsia
RGB= 171, 0, 102
ING Lime
RGB= 208, 217, 60
ING Leaf
RGB= 52, 150, 81
ING Mid Grey
RGB= 118, 118, 118
Text Colour
RGB= 51, 51, 51
No content below the grey line
ING Orange
RGB= 255, 98, 0
ING Light Grey
RGB= 168, 168, 168
ING Indigo
RGB= 82, 81, 153
ING Sky
RGB= 96, 166, 218
Colour Guidelines
ING Fuchsia
RGB= 171, 0, 102
ING Lime
RGB= 208, 217, 60
ING Leaf
RGB= 52, 150, 81
ING Mid Grey
RGB= 118, 118, 118
Text Colour
RGB= 51, 51, 51
Third quarter 2016 Results
Ralph Hamers, CEO ING Group
ING posts 3Q16 underlying net profit of EUR 1,336 million
Amsterdam • 3 November 2016

ING Orange
RGB= 255, 98, 0
ING Light Grey
RGB= 168, 168, 168
ING Indigo
RGB= 82, 81, 153
ING Sky
RGB= 96, 166, 218
Colour Guidelines
ING Fuchsia
RGB= 171, 0, 102
ING Lime
RGB= 208, 217, 60
ING Leaf
RGB= 52, 150, 81
ING Mid Grey
RGB= 118, 118, 118
Text Colour
RGB= 51, 51, 51
No content below the grey line
Key points
• ING Bank recorded underlying 3Q16 net profit of EUR 1,336 million
• Strong results boosted by steady growth in primary customers (> 400,000 year-to-date), higher net interest income and a relatively low level of risk costs
• ING Group fully-loaded CET1 ratio rose to 13.5%; interim profits not included in capital
• ING Bank underlying return on equity was 11.3% for the first nine months of 2016
• As announced during our recent Investor Day, we intend to invest EUR 800 million over the next five years to create a scalable banking platform to enable:
• Continued commercial growth
• An improved customer experience
• Quicker delivery of products
2

ING Orange
RGB= 255, 98, 0
ING Light Grey
RGB= 168, 168, 168
ING Indigo
RGB= 82, 81, 153
ING Sky
RGB= 96, 166, 218
Colour Guidelines
ING Fuchsia
RGB= 171, 0, 102
ING Lime
RGB= 208, 217, 60
ING Leaf
RGB= 52, 150, 81
ING Mid Grey
RGB= 118, 118, 118
Text Colour
RGB= 51, 51, 51
No content below the grey line
Underlying net result ING Bank (in EUR mln)
Strong results deliver > 11% Bank ROE over first nine months
4,219
3,4243,155
2,450
3,3973,595
2012 2013 2014 2015 9M15 9M16
* Only Core Tier 1 ratios available for 2012, which is not comparable with fully-loaded CET1 ratios
Underlying ROE ING Bank within target range
• ING Bank recorded underlying net profit for the first nine months of 2016 of EUR 3,595 mln, up 5.8% on the same period in 2015, notwithstanding nearly EUR 300 mln of higher regulatory costs in 2016
• Despite a higher fully-loaded ING Bank CET1 ratio of 12.6%, ING Bank’s underlying return on equity for the first nine months of 2016 was 11.3%
3
10%
11.3%10.8%9.9%
9.0%
7.0%
10-13%
10.0%
11.4% 11.6%12.6%
2012 2013 2014 2015 9M16 ROE
Ambition
2017ROE ING Bank fully-loaded CET1 ratio*
+5.8%
ING Orange
RGB= 255, 98, 0
ING Light Grey
RGB= 168, 168, 168
ING Indigo
RGB= 82, 81, 153
ING Sky
RGB= 96, 166, 218
Colour Guidelines
ING Fuchsia
RGB= 171, 0, 102
ING Lime
RGB= 208, 217, 60
ING Leaf
RGB= 52, 150, 81
ING Mid Grey
RGB= 118, 118, 118
Text Colour
RGB= 51, 51, 51
No content below the grey line
12.4
21.7
17.2
25.6
2014 2015 9M15 9M16
15.0 15.2 15.6
12.3
16.3
13.1
2012 2013 2014 2015 9M15 9M16
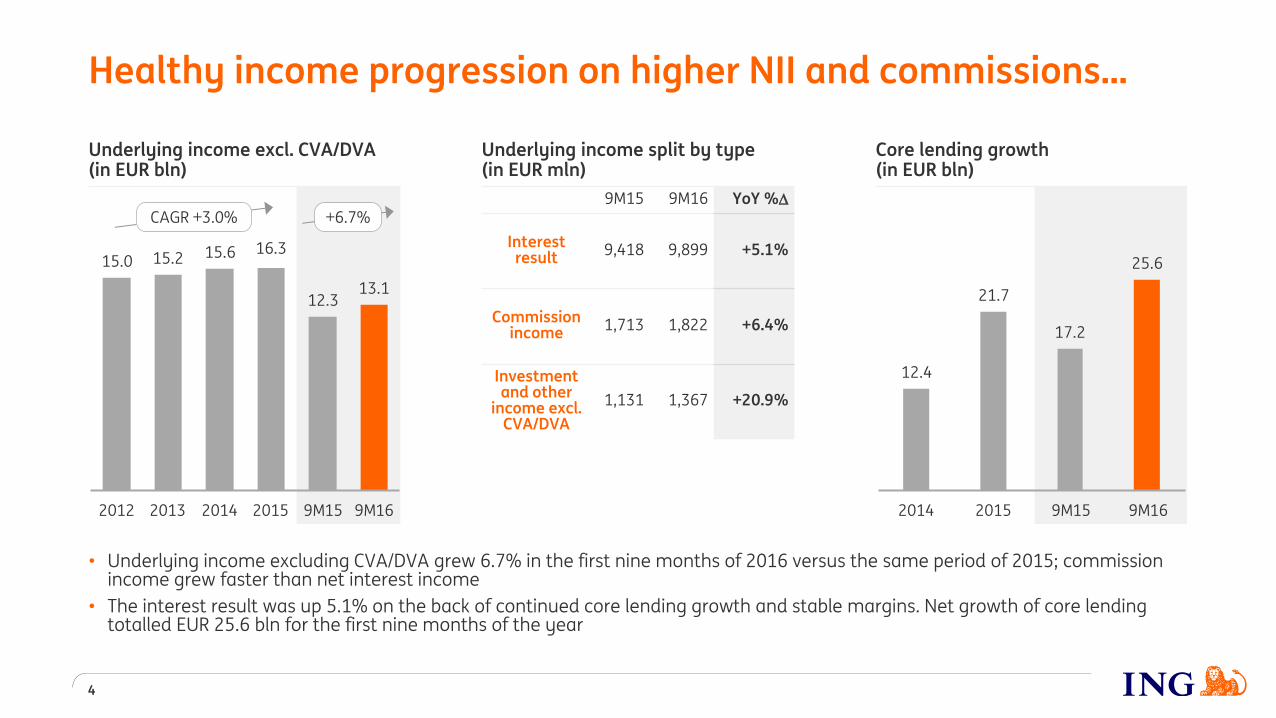
Healthy income progression on higher NII and commissions…
• Underlying income excluding CVA/DVA grew 6.7% in the first nine months of 2016 versus the same period of 2015; commission income grew faster than net interest income
• The interest result was up 5.1% on the back of continued core lending growth and stable margins. Net growth of core lending totalled EUR 25.6 bln for the first nine months of the year
4
Core lending growth (in EUR bln)
Underlying income excl. CVA/DVA (in EUR bln)
Underlying income split by type (in EUR mln)
9M15 9M16 YoY %
Interest result 9,418 9,899 +5.1%
Commission income 1,713 1,822 +6.4%
Investment and other
income excl. CVA/DVA
1,131 1,367 +20.9%
+6.7% CAGR +3.0%

ING Orange
RGB= 255, 98, 0
ING Light Grey
RGB= 168, 168, 168
ING Indigo
RGB= 82, 81, 153
ING Sky
RGB= 96, 166, 218
Colour Guidelines
ING Fuchsia
RGB= 171, 0, 102
ING Lime
RGB= 208, 217, 60
ING Leaf
RGB= 52, 150, 81
ING Mid Grey
RGB= 118, 118, 118
Text Colour
RGB= 51, 51, 51
No content below the grey line
8.3 8.2 8.2 8.5 6.4 6.5
2012 2013 2014 2015 9M15 9M16
ExpensesRegulatory costsRedundancy costs
…as well as stable expense base and low risk costs
• Underlying operating expenses have remained broadly flat due to our cost containment programmes
• Risk costs declined to a relatively low level of EUR 836 mln in the first nine months of 2016, or 35 bps of average RWA
• The large increase in regulatory costs has caused our cost/income ratio to remain above our target range
5
Underlying cost/income ratio**
Risk costs (in EUR bln and bps of average RWA)
Underlying operating expenses (in EUR bln)
57.8% 56.2%
55.1% 55.9%
54.2%
55.5%
53.8% 52.5% 52.1%
49.3%
2012 2013 2014 2015 9M16
Cost/income ratio
Cost/income ratio excl. regulatory costs
* 9M16 risk costs over average RWA (in bps) are annualised ** Excluding CVA/DVA (all years) and disclosed redundancy provisions in 2013, 2014 and 2015
2.1 2.3 1.6 1.3
0.8
74 83
55 44
35
2012 2013 2014 2015 9M16*
ING Orange
RGB= 255, 98, 0
ING Light Grey
RGB= 168, 168, 168
ING Indigo
RGB= 82, 81, 153
ING Sky
RGB= 96, 166, 218
Colour Guidelines
ING Fuchsia
RGB= 171, 0, 102
ING Lime
RGB= 208, 217, 60
ING Leaf
RGB= 52, 150, 81
ING Mid Grey
RGB= 118, 118, 118
Text Colour
RGB= 51, 51, 51
No content below the grey line
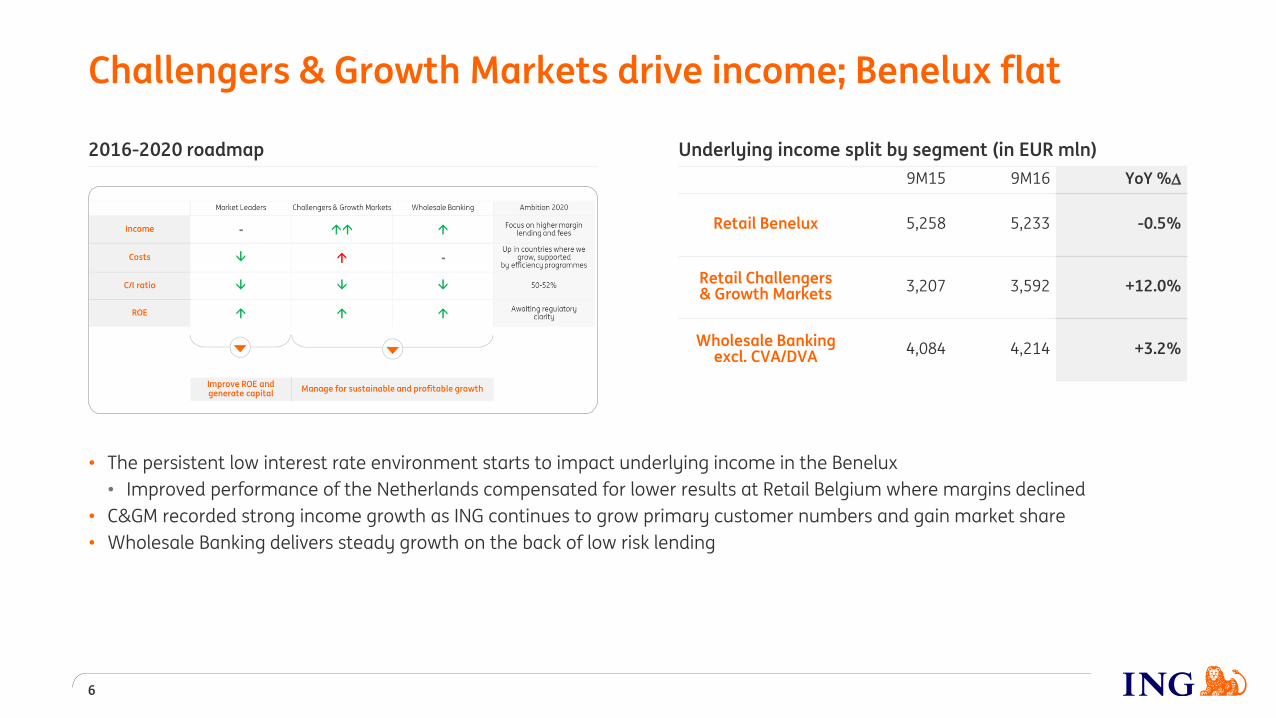
Challengers & Growth Markets drive income; Benelux flat
6
Underlying income split by segment (in EUR mln)
9M15 9M16 YoY %
Retail Benelux 5,258 5,233 -0.5%
Retail Challengers & Growth Markets 3,207 3,592 +12.0%
Wholesale Banking excl. CVA/DVA 4,084 4,214 +3.2%
• The persistent low interest rate environment starts to impact underlying income in the Benelux
• Improved performance of the Netherlands compensated for lower results at Retail Belgium where margins declined
• C&GM recorded strong income growth as ING continues to grow primary customer numbers and gain market share
• Wholesale Banking delivers steady growth on the back of low risk lending
2016-2020 roadmap

ING Orange
RGB= 255, 98, 0
ING Light Grey
RGB= 168, 168, 168
ING Indigo
RGB= 82, 81, 153
ING Sky
RGB= 96, 166, 218
Colour Guidelines
ING Fuchsia
RGB= 171, 0, 102
ING Lime
RGB= 208, 217, 60
ING Leaf
RGB= 52, 150, 81
ING Mid Grey
RGB= 118, 118, 118
Text Colour
RGB= 51, 51, 51
No content below the grey line
EUR 800 mln to be invested in our digital transformation from 2016 to 2021
This investment will allow us to build a scalable platform to cater for: • Continued commercial growth • An improved customer experience • Quicker delivery of products Estimated annual gross cost savings of EUR 900 mln by 2021
We expect to take a pre-tax restructuring provision of approximately EUR 1.1 bln, to be booked as a special item, of which around EUR 1.0 bln in 4Q16. Around 7,000 FTEs impacted, consultations with various stakeholders are underway
ING to invest EUR 800 mln in digital transformation…
7
High Cross-Buy
Direct first Mainly branch-based
“Model Bank”
Converging and optimising operating models… …with a significant investment in digital
“Orange Bridge”
Direct first with high cross-buy
Market Leaders
Germany Challengers
“Welcome”
Bubble size = ING retail client balances as of 2015 Cross-buy = average # of products per active customer All projects described are proposed intentions of ING. No formal decisions will be taken until the information and consultation phases with the Work Councils have been properly finalised Subject to regulatory approval

ING Orange
RGB= 255, 98, 0
ING Light Grey
RGB= 168, 168, 168
ING Indigo
RGB= 82, 81, 153
ING Sky
RGB= 96, 166, 218
Colour Guidelines
ING Fuchsia
RGB= 171, 0, 102
ING Lime
RGB= 208, 217, 60
ING Leaf
RGB= 52, 150, 81
ING Mid Grey
RGB= 118, 118, 118
Text Colour
RGB= 51, 51, 51
No content below the grey line
Cost/income ratio target range
50-52%
150 210 170
120 110 40
100
300
550
700
900
4Q16 2017 2018 2019 2020 2021
Restructuring provision Investments* Accumulated savings
…which will bring further efficiency gains
8
57.8 56.2 55.1 55.9 56.2
55.5 53.8
52.5 52.1 49.7
2012 2013 2014 2015 1H16
Cost/income ratio (%)
Cost/income ratio excl. regulatory costs (%)
Estimated impact of digital transformation programmes (in EUR mln)
• Cost/income ratio at 54.2% year-to-date
• Digital investments should deliver annual gross cost savings of EUR 900 mln by 2021 to reach 50-52% cost/income ratio
57.8% 56.2%
55.1% 55.9%
55.5%
53.8% 52.5% 52.1%
2012 2013 2014 2015 Ambition
2020Cost/income ratio
Cost/income ratio excl. regulatory costs
Cost/income ratio to fall towards 50-52% by 2020**
1,000
All projects described are proposed intentions of ING. No formal decisions will be taken until the information and consultation phases with the Work Councils have been properly finalised * Defined as incremental expenses from new announced programmes and includes project expenses, depreciation and amortisation of new IT assets, as well as impacts from impairments of legacy IT systems. Approx. EUR 90 mln to be taken as a special item in 4Q16 ** Excluding CVA/DVA (all years) and disclosed redundancy provisions in 2013, 2014 and 2015

ING Orange
RGB= 255, 98, 0
ING Light Grey
RGB= 168, 168, 168
ING Indigo
RGB= 82, 81, 153
ING Sky
RGB= 96, 166, 218
Colour Guidelines
ING Fuchsia
RGB= 171, 0, 102
ING Lime
RGB= 208, 217, 60
ING Leaf
RGB= 52, 150, 81
ING Mid Grey
RGB= 118, 118, 118
Text Colour
RGB= 51, 51, 51
No content below the grey line
Targeting > 14 mln primary customers by 2020 (in mln)
Our focus on primary customer relationships drives value
9
Source: ING client data over 2013-2015 from 2 C&G countries and 1 Market Leader (N=5 mln clients)
Title (in EUR mln)
Customer value = Number of
customers Share of primary Cross-buy
Product value
>14
9.47.9 8.4 9.0
>10
2013 2014 2015 3Q16 Ambition
2017
Ambition
2020
Primary customers:
• Generate 2.5x more value
• Are 8x more loyal
• Have 2x more cross-buy
• Increase their value by 3x during their first years at ING

ING Orange
RGB= 255, 98, 0
ING Light Grey
RGB= 168, 168, 168
ING Indigo
RGB= 82, 81, 153
ING Sky
RGB= 96, 166, 218
Colour Guidelines
ING Fuchsia
RGB= 171, 0, 102
ING Lime
RGB= 208, 217, 60
ING Leaf
RGB= 52, 150, 81
ING Mid Grey
RGB= 118, 118, 118
Text Colour
RGB= 51, 51, 51
No content below the grey line
We are working with > 65 fintechs
• In-house accelerators in the Netherlands and Belgium
• Fintech partnerships
• ING is one of the main sponsors of a new fintech hub in Frankfurt
New innovations developed internally and with fintechs
10
ING Virtual Cash Management
Twyp Cash – Spain Yolt Money Management - UK
mPOS – Romania

ING Orange
RGB= 255, 98, 0
ING Light Grey
RGB= 168, 168, 168
ING Indigo
RGB= 82, 81, 153
ING Sky
RGB= 96, 166, 218
Colour Guidelines
ING Fuchsia
RGB= 171, 0, 102
ING Lime
RGB= 208, 217, 60
ING Leaf
RGB= 52, 150, 81
ING Mid Grey
RGB= 118, 118, 118
Text Colour
RGB= 51, 51, 51
No content below the grey line
Sustainability is embedded throughout our business
11
Ranked 1st and Industry Leader of 395 listed banks by Sustainalytics in August 2016
Scored 90 out of 100 by DJSI; ING named among world leaders in Banks category
Top 9% of >2,000 companies assessed by CDP; ING 1 of only 30 financials to receive highest ‘A’ score
Recognition
Sustainable Transitions Financed* (in EUR bln)
19.5 23.8
27.8
35.0
2014 2015 1H16 Ambition
2020
Main Sustainability Themes
• Energy Transition
• Circular Economy
• Water
Notable deal in 3Q16
• ING acted as advisor and underwriter to international waste-to-product business Shanks Group plc’s merger** with leading Dutch waste processor Van Gansewinkel Groep. The merger will create one of Europe’s leading players in recycling
• This transaction clearly strengthens ING’s commitment to the circular economy, as both Shanks and Van Gansewinkel put the circular economy at the heart of their businesses by making new products out of waste
Sustainability at the core
Sustainability Direction
Sustainable Transitions Financed
* STF: measures lending to clients who are environmental and/or social outperformers or financing of transactions for sustainable projects (i.e. renewable energy, low-carbon transport, social welfare) ** The deal is awaiting anti-trust clearance in Belgium and the Netherlands and is expected to close in December

ING Orange
RGB= 255, 98, 0
ING Light Grey
RGB= 168, 168, 168
ING Indigo
RGB= 82, 81, 153
ING Sky
RGB= 96, 166, 218
Colour Guidelines
ING Fuchsia
RGB= 171, 0, 102
ING Lime
RGB= 208, 217, 60
ING Leaf
RGB= 52, 150, 81
ING Mid Grey
RGB= 118, 118, 118
Text Colour
RGB= 51, 51, 51
No content below the grey line
3Q16 results
12

ING Orange
RGB= 255, 98, 0
ING Light Grey
RGB= 168, 168, 168
ING Indigo
RGB= 82, 81, 153
ING Sky
RGB= 96, 166, 218
Colour Guidelines
ING Fuchsia
RGB= 171, 0, 102
ING Lime
RGB= 208, 217, 60
ING Leaf
RGB= 52, 150, 81
ING Mid Grey
RGB= 118, 118, 118
Text Colour
RGB= 51, 51, 51
No content below the grey line
Strong third-quarter results reflecting NII growth
• 3Q16 underlying pre-tax profit up 25.6% year-on-year. Excluding Visa gain in 2Q16, pre-tax result also up 3.9% sequentially
• The overall result driven by net interest income (excl. Financial Markets) which showed a 1.8% increase versus 2Q16 due to:
• Higher volumes in both mortgages and non-mortgage lending
• Slightly higher lending and savings margins, though interest margin on current accounts further declined
13
2001,878
1,4951,202
1,186
1,808
3Q15 4Q15 1Q16 2Q16 3Q16
Underlying pre-tax result Visa sale
Underlying pre-tax result ING Bank (in EUR mln) Net interest income excl. Financial Markets (in EUR mln)
2,009
3,0493,124
3,1913,247
2,9323,011 3,040 3,007
3,074
3Q14 4Q14 1Q15 2Q15 3Q15 4Q15 1Q16 2Q16 3Q16

ING Orange
RGB= 255, 98, 0
ING Light Grey
RGB= 168, 168, 168
ING Indigo
RGB= 82, 81, 153
ING Sky
RGB= 96, 166, 218
Colour Guidelines
ING Fuchsia
RGB= 171, 0, 102
ING Lime
RGB= 208, 217, 60
ING Leaf
RGB= 52, 150, 81
ING Mid Grey
RGB= 118, 118, 118
Text Colour
RGB= 51, 51, 51
No content below the grey line
153 153
147 143 146
147 151 150
155
149 151
150 149 147
146 147 148 150
3Q14 4Q14 1Q15 2Q15 3Q15 4Q15 1Q16 2Q16 3Q16
NIM NIM (4-quarter rolling average)
Net interest margin up from 2Q16
14
* Excl. CVA/DVA
150
155+2
+3
2Q16 Retail Banking Financial
Markets
3Q16
67123 124
76138
196139 121
303114
3Q15 4Q15 1Q16 2Q16 3Q16
Interest income Non-interest income
263 262 245
379
252
Business segment contribution to NIM (in bps) NIM trend reflects volatility in FM interest result (in bps)
Underlying income Financial Markets* (in EUR mln) Net interest margin up from 2Q16
• Interest margin up from 2Q16 by 5 bps, mostly driven by Financial Markets as well as Retail Germany and Retail Other Challengers & Growth Markets
• Savings margins up from 2Q16, reflecting the reduction in client savings rates in several countries, offset by lower margins on current accounts
• Lending margins slightly up on the prior quarter

ING Orange
RGB= 255, 98, 0
ING Light Grey
RGB= 168, 168, 168
ING Indigo
RGB= 82, 81, 153
ING Sky
RGB= 96, 166, 218
Colour Guidelines
ING Fuchsia
RGB= 171, 0, 102
ING Lime
RGB= 208, 217, 60
ING Leaf
RGB= 52, 150, 81
ING Mid Grey
RGB= 118, 118, 118
Text Colour
RGB= 51, 51, 51
No content below the grey line
Our core lending franchises grew by EUR 3.6 bln in 3Q16
551.0
554.9-0.31.31.7
1.21.2
0.1 1.6-0.9
-1.6
-0.5
30/06/16 Retail NL Retail
Belgium
Retail
Germany
Retail
Other
C&GM*
WB IL* WB GL&TS* WB Other* Lease run-
off / WUB
run-off &
transfers**
Bank
Treasury
FX / Other 30/09/16
Customer lending ING Bank 3Q16 (in EUR bln)
Core lending businesses: EUR 3.6 bln
• Our core lending franchises grew by EUR 3.6 bln in 3Q16:
• Wholesale Banking increased by EUR 1.2 bln which is driven by Industry Lending
• Retail Banking increased by EUR 2.4 bln (EUR 1.5 bln mortgages and EUR 0.9 bln other customer lending), mainly in C&G countries
15
* C&GM is Challengers & Growth Markets; IL is Industry Lending; GL&TS is General Lending & Transaction Services; WB Other includes Financial Markets ** Lease run-off was EUR -0.2 bln, WUB run-off was EUR -0.5 bln and WUB transfer to NN was EUR -0.2 bln

ING Orange
RGB= 255, 98, 0
ING Light Grey
RGB= 168, 168, 168
ING Indigo
RGB= 82, 81, 153
ING Sky
RGB= 96, 166, 218
Colour Guidelines
ING Fuchsia
RGB= 171, 0, 102
ING Lime
RGB= 208, 217, 60
ING Leaf
RGB= 52, 150, 81
ING Mid Grey
RGB= 118, 118, 118
Text Colour
RGB= 51, 51, 51
No content below the grey line
Robust commission income driven by C&G countries
92 100 108 110 132
218 229 249 228 230
216251 251 273 244
3Q15 4Q15 1Q16 2Q16 3Q16
Retail Banking C&GM Retail Banking BeneluxWholesale Banking One-off
• Commission income grew over the past quarters. The increase was visible in all segments year-on-year
• Compared to 2Q16, commissions are broadly stable as an increase in Retail C&GM fees was offset by a decline in Wholesale Banking fees
16
Bank-wide initiatives to drive fee income
Lending fees
• Wholesale Banking growth in Industry and General Lending
• Acceleration of Consumer Lending
• Volume growth in SME/MidCorp
Fee products
• Offer more investment products, e.g. via Robo advice
• Insurance distribution linked to lending and stand-alone via mobile
• Increasing Financial Markets cross-sell with Debt Capital Markets
Payment fees
• Selectively increase lending and payment fees to corporate clients
• Review of daily banking fees across our different markets
New sources
• E.g. referral of loans to third parties, comparison engines, attracting third parties to our platforms
607 524
607 610 605
Commission income* remaining roughly flat (in EUR mln)
* Corporate Line not visible in breakdown, therefore Retail Banking and Wholesale Banking do not add up to totals

ING Orange
RGB= 255, 98, 0
ING Light Grey
RGB= 168, 168, 168
ING Indigo
RGB= 82, 81, 153
ING Sky
RGB= 96, 166, 218
Colour Guidelines
ING Fuchsia
RGB= 171, 0, 102
ING Lime
RGB= 208, 217, 60
ING Leaf
RGB= 52, 150, 81
ING Mid Grey
RGB= 118, 118, 118
Text Colour
RGB= 51, 51, 51
No content below the grey line
Underlying operating expenses remained stable
2,141 2,139 2,140 2,157 2,155
3Q15 4Q15 1Q16 2Q16 3Q16
Expenses Regulatory costs Redundancy costs
Underlying operating expenses (in EUR mln)
17
Regulatory costs skewed to first and fourth quarters* (in EUR mln)
174
61105
279
75 65
260
496
1Q 2Q 3Q 4Q
2015 2016E
22%
24%
13%
19%
22%
Retail Netherlands
Retail Belgium
Retail Germany
Retail Other C&GM
Wholesale Banking
Estimated regulatory costs by segment (2016)* • Underlying expenses remained broadly flat year-on-year
• 2016 regulatory costs estimated at approximately EUR 900 mln, down slightly from previous estimate of EUR 940 mln
• Lower regulatory costs in Germany on decision to fulfil some DGS contributions via Irrevocable Payment Commitments
EUR 900 mln
* 4Q16 numbers are estimates and subject to change

ING Orange
RGB= 255, 98, 0
ING Light Grey
RGB= 168, 168, 168
ING Indigo
RGB= 82, 81, 153
ING Sky
RGB= 96, 166, 218
Colour Guidelines
ING Fuchsia
RGB= 171, 0, 102
ING Lime
RGB= 208, 217, 60
ING Leaf
RGB= 52, 150, 81
ING Mid Grey
RGB= 118, 118, 118
Text Colour
RGB= 51, 51, 51
No content below the grey line
Risk costs (in EUR mln)
153 140 82 59 49 50 43
48 40
16 65 32 57 51
59 62
66 80
67 77 74
173 111
97 97
117 123
97
1Q15 2Q15 3Q15 4Q15 1Q16 2Q16 3Q16
Wholesale Banking
Retail Challengers & Growth Markets
Retail Belgium
Retail Netherlands
Risk environment benign; NPLs keep trending down
265 261 301
• Risk costs were EUR 265 mln, or 34 bps of RWA, well below 40-45 bps through-the-cycle average
• NPL ratio down slightly to 2.2%, with improvements in both Retail Banking and Wholesale Banking
• NPL ratio of Oil & Gas related exposure dropped to 2.5%, from 2.8% in 2Q16
307 265
3.0%
2.6%
2.3% 2.2%
3.3%
2.9%
2.6%
2.4% 2.8%
2.5%
2.2% 2.1%
1Q15 2Q15 3Q15 4Q15 1Q16 2Q16 3Q16
NPL ratio ING Bank
NPL ratio Wholesale Banking
NPL ratio Retail Banking
NPL ratio
18
353
432
9M16: EUR 836 mln 2015: EUR 1,347 mln

ING Orange
RGB= 255, 98, 0
ING Light Grey
RGB= 168, 168, 168
ING Indigo
RGB= 82, 81, 153
ING Sky
RGB= 96, 166, 218
Colour Guidelines
ING Fuchsia
RGB= 171, 0, 102
ING Lime
RGB= 208, 217, 60
ING Leaf
RGB= 52, 150, 81
ING Mid Grey
RGB= 118, 118, 118
Text Colour
RGB= 51, 51, 51
No content below the grey line
Commission income (in EUR mln) Net interest income and net interest margin
1,079 1,096 1,149 1,140 1,203
3Q15 4Q15 1Q16 2Q16 3Q16
NII (in EUR mln) NIM (in bps)
Challengers & Growth Markets show strong results progression
19
139 155 163 166 186
27
3Q15 4Q15 1Q16 2Q16 3Q16
Commission income One-off
51% 53%
58%
46% 46%
47% 48% 48%
42% 44%
3Q15 4Q15 1Q16 2Q16 3Q16
Cost/income ratio Cost/income ratio excl. regulatory costs
91 93 94 96
89
36 36 35 36 33
3Q14 4Q15 1Q16 2Q16 3Q16
Risk costs (in EUR mln) Risk costs (in bps of average RWA)
Cost/income ratio Risk costs
+11% +34%
All numbers on the slide represent Challengers & Growth Markets incl. Wholesale Banking

ING Orange
RGB= 255, 98, 0
ING Light Grey
RGB= 168, 168, 168
ING Indigo
RGB= 82, 81, 153
ING Sky
RGB= 96, 166, 218
Colour Guidelines
ING Fuchsia
RGB= 171, 0, 102
ING Lime
RGB= 208, 217, 60
ING Leaf
RGB= 52, 150, 81
ING Mid Grey
RGB= 118, 118, 118
Text Colour
RGB= 51, 51, 51
No content below the grey line
Poland delivering on our Think Forward strategy
20
LtD ratio trending upwards* Good income progression (in EUR mln)
Increasingly digital banking market
Channel usage
High customer satisfaction aided by Omnichannel approach
Strong primary customer growth (individual customers, in thousands)
Growth in lending balances (in EUR bln)
956 1,059 1,171 1,233
3,089 3,279 3,508 3,638
2013 2014 2015 3Q16
Primary customers Total customers
All disclosed financials concern ING Group management accounting figures, which might deviate from local disclosures * Excluding securities at amortised cost
71% 73% 77%
81%
2013 2014 2015 3Q16 4Q17 2013 2014 2015 9M15 9M16
Other income Commission income
Interest income
CAGR +8%
#1 NPS Score in Poland
Moje ING platform
78% 70% 65%
19% 27% 32%
4Q14 4Q15 3Q16
Web Mobile Branch Call
CAGR +10%
2.8 3.1 4.1 4.0
9.0 10.0 12.1 13.5
2013 2014 2015 3Q16
Wholesale Banking Retail Banking
CAGR +5%
823 889
668 726 756
+9%
CAGR +13% CAGR +16%

ING Orange
RGB= 255, 98, 0
ING Light Grey
RGB= 168, 168, 168
ING Indigo
RGB= 82, 81, 153
ING Sky
RGB= 96, 166, 218
Colour Guidelines
ING Fuchsia
RGB= 171, 0, 102
ING Lime
RGB= 208, 217, 60
ING Leaf
RGB= 52, 150, 81
ING Mid Grey
RGB= 118, 118, 118
Text Colour
RGB= 51, 51, 51
No content below the grey line
0.1%2.0%
3.0%
0.3% 13.5%13.1%
18.5%
2Q16 Group CET1 Equity stakes RWA & Other 3Q16 Group CET1 Additional Tier 1 Tier 2 3Q16 Total capital
ratio
Capital position strengthened; ING Group to be resolution entity
• ING Group’s 3Q16 fully-loaded CET1 ratio rose to 13.5% on lower RWA; interim profits not included in capital
• Post the 2016 interim dividend payment in August, interim profits not included in capital amount to EUR 3.0 bln
• The final dividend proposal will reflect considerations including expected future capital requirements and growth opportunities
• Subject to final SRB confirmation, we have concluded that ING Group should be our designated resolution entity
* ING Group fully-loaded capital ratios are based on RWAs of EUR 313 bln and include grandfathered securities
ING Group 3Q16 fully-loaded capital ratios*
21

ING Orange
RGB= 255, 98, 0
ING Light Grey
RGB= 168, 168, 168
ING Indigo
RGB= 82, 81, 153
ING Sky
RGB= 96, 166, 218
Colour Guidelines
ING Fuchsia
RGB= 171, 0, 102
ING Lime
RGB= 208, 217, 60
ING Leaf
RGB= 52, 150, 81
ING Mid Grey
RGB= 118, 118, 118
Text Colour
RGB= 51, 51, 51
No content below the grey line
Ambition 2020 - Financial Targets
22
Actual 9M16 - Group Ambition 2020 – Group*
Capital
• CET1 ratio (%) 13.5% > Prevailing fully-loaded requirements**
• Leverage ratio (%) 4.4% > 4%
Profitability
• Underlying C/I ratio (%) 54.5% 50-52%
• Underlying ROE (%) (IFRS-EU Equity)
9.8% Awaiting regulatory clarity
Dividend • Dividend (per share) EUR 0.24;
2016 interim dividend paid in August
Progressive dividend over time; > EUR 0.65 per share
* Ambition 2020 financial targets based on assumption of low-for-longer interest rate environment in the eurozone ** Currently 12.5%

ING Orange
RGB= 255, 98, 0
ING Light Grey
RGB= 168, 168, 168
ING Indigo
RGB= 82, 81, 153
ING Sky
RGB= 96, 166, 218
Colour Guidelines
ING Fuchsia
RGB= 171, 0, 102
ING Lime
RGB= 208, 217, 60
ING Leaf
RGB= 52, 150, 81
ING Mid Grey
RGB= 118, 118, 118
Text Colour
RGB= 51, 51, 51
No content below the grey line
Wrap up
23

ING Orange
RGB= 255, 98, 0
ING Light Grey
RGB= 168, 168, 168
ING Indigo
RGB= 82, 81, 153
ING Sky
RGB= 96, 166, 218
Colour Guidelines
ING Fuchsia
RGB= 171, 0, 102
ING Lime
RGB= 208, 217, 60
ING Leaf
RGB= 52, 150, 81
ING Mid Grey
RGB= 118, 118, 118
Text Colour
RGB= 51, 51, 51
No content below the grey line
Wrap up
24
• ING Bank recorded underlying 3Q16 net profit of EUR 1,336 million
• Strong results boosted by steady growth in primary customers (> 400,000 year-to-date), higher net interest income and a relatively low level of risk costs
• ING Group fully-loaded CET1 ratio rose to 13.5%; interim profits not included in capital
• ING Bank underlying return on equity was 11.3% for the first nine months of 2016
• As announced during our recent Investor Day, we intend to invest EUR 800 million over the next five years to create a scalable banking platform to enable:
• Continued commercial growth
• An improved customer experience
• Quicker delivery of products

ING Orange
RGB= 255, 98, 0
ING Light Grey
RGB= 168, 168, 168
ING Indigo
RGB= 82, 81, 153
ING Sky
RGB= 96, 166, 218
Colour Guidelines
ING Fuchsia
RGB= 171, 0, 102
ING Lime
RGB= 208, 217, 60
ING Leaf
RGB= 52, 150, 81
ING Mid Grey
RGB= 118, 118, 118
Text Colour
RGB= 51, 51, 51
No content below the grey line
Appendix
25

ING Orange
RGB= 255, 98, 0
ING Light Grey
RGB= 168, 168, 168
ING Indigo
RGB= 82, 81, 153
ING Sky
RGB= 96, 166, 218
Colour Guidelines
ING Fuchsia
RGB= 171, 0, 102
ING Lime
RGB= 208, 217, 60
ING Leaf
RGB= 52, 150, 81
ING Mid Grey
RGB= 118, 118, 118
Text Colour
RGB= 51, 51, 51
No content below the grey line
1,6511,504
1,600
1,897 1,919
3Q15 4Q15 1Q16 2Q16 3Q16
Underlying pre-tax result ING Bank (in EUR mln)
Pre-tax result excl. volatile items and regulatory costs (in EUR mln)
Solid third-quarter results with fewer one-off and volatile items
Volatile items and regulatory costs (in EUR mln)
3Q15 4Q15 1Q16 2Q16 3Q16
CVA/DVA 40 -22 35 -54 -72
Capital gains/losses -64 -5 62 165 66
Hedge ineffectiveness -27 4 -15 59 30
Other items* 17
Total -51 -23 82 187 24
Regulatory costs -105 -279 -496 -75 -65
1,495
1,202 1,186
2,0091,878
3Q15 4Q15 1Q16 2Q16 3Q16
26
• In recent quarters, pre-tax results were impacted by the volatile items shown in the table and regulatory costs
• Excluding these volatile items, 3Q16 pre-tax result up strongly from 3Q15 and slightly up from 2Q16
* In 2Q16, sum of procured cost saving Belgium (EUR 116 mln), provision for SME and REF clients in the Netherlands with interest rate derivatives (EUR -137 mln) and EUR 38 mln of Visa gains recorded under Other income

ING Orange
RGB= 255, 98, 0
ING Light Grey
RGB= 168, 168, 168
ING Indigo
RGB= 82, 81, 153
ING Sky
RGB= 96, 166, 218
Colour Guidelines
ING Fuchsia
RGB= 171, 0, 102
ING Lime
RGB= 208, 217, 60
ING Leaf
RGB= 52, 150, 81
ING Mid Grey
RGB= 118, 118, 118
Text Colour
RGB= 51, 51, 51
No content below the grey line
9M16 underlying pre-tax result by Wholesale Banking segment excl. CVA/DVA
9M16 underlying pre-tax result by Retail Banking segment
62%
22%
9%
7%
Industry Lending
General Lending & Transaction Services
Financial Markets
Bank Treasury & Other
36%
21%
22%
7%
14%
Netherlands
Belgium
Germany
Other Challengers
Growth Markets
1,104907
766
1,275 1,288
85144 394
6772
3Q15 4Q15 1Q16 2Q16 3Q16
Reported pre-tax result Regulatory costs
Underlying pre-tax result Wholesale Banking excl. CVA/DVA (in EUR mln)
Underlying pre-tax result Retail Banking (in EUR mln)
Robust quarterly results for both Retail and Wholesale Banking
EUR 3,329 mln
EUR 1,996 mln
27
501 454 501815 680
100 10220
2
-23Q15 4Q15 1Q16 2Q16 3Q16
Reported pre-tax result Regulatory costs

ING Orange
RGB= 255, 98, 0
ING Light Grey
RGB= 168, 168, 168
ING Indigo
RGB= 82, 81, 153
ING Sky
RGB= 96, 166, 218
Colour Guidelines
ING Fuchsia
RGB= 171, 0, 102
ING Lime
RGB= 208, 217, 60
ING Leaf
RGB= 52, 150, 81
ING Mid Grey
RGB= 118, 118, 118
Text Colour
RGB= 51, 51, 51
No content below the grey line
Group capital position strengthened further
Bank fully-loaded CET1 ratio development during 3Q16 (amounts in EUR bln and %)
Capital RWA Ratio Change
Actuals June 2016 38.8 317.0 12.2%
Interim profit included in CET1* - -
Equity stakes** 0.1 -1.0 +0.05%
FX -0.1 -0.9 +0.02%
RWA & Other*** 0.2 -4.6 +0.25%
Actuals September 2016 39.0 310.5 12.6% +0.32%
Group fully-loaded CET1 ratio development during 3Q16 (amounts in EUR bln and %)
Capital RWA Ratio Change
Actuals June 2016 41.9 319.1 13.1%
Interim profit included in CET1* - -
Equity stakes** 0.1 -0.8 +0.05%
FX -0.1 -0.9 +0.02%
RWA & Other*** 0.2 -4.5 +0.25%
Actuals September 2016 42.1 312.8 13.5% +0.33%
* 3Q16 net result Bank (EUR 1,345 mln) to be upstreamed to Group and not included in Bank CET1 capital; also interim profits year-to-date Group (EUR 2,970 mln) not included in Group CET1 capital ** Mainly impacted by the partial sale of ING´s stake in Kotak Mahindra Bank as well as the valuation of our stake in Bank of Beijing *** Lower RWA includes the positive impact from positive risk migration (+13 bps), lower market risk-weighted assets (+8 bps) and other items which are mainly driven by regulatory deductions (+8 bps), partly offset by model updates (-4 bps)
28

ING Orange
RGB= 255, 98, 0
ING Light Grey
RGB= 168, 168, 168
ING Indigo
RGB= 82, 81, 153
ING Sky
RGB= 96, 166, 218
Colour Guidelines
ING Fuchsia
RGB= 171, 0, 102
ING Lime
RGB= 208, 217, 60
ING Leaf
RGB= 52, 150, 81
ING Mid Grey
RGB= 118, 118, 118
Text Colour
RGB= 51, 51, 51
No content below the grey line
Client savings rates
Netherlands (Oranje Spaarrekening)**
Belgium (Oranje boekje) Germany (core savings rate) Other EU Direct units***
We further reduced client savings rates to align with record low interest rates
30%
18% 28%
24%
Netherlands
Belgium
Germany
Other Challengers & Growth Markets
We further reduced savings rates in 3Q16
• In September, we reduced savings rates by another 10 bps in the Netherlands following an earlier 10 bps reduction at the end of June
• During the quarter, we also reduced savings rates in Australia, France, Poland and Romania
EUR 453 bln
3Q16 retail customer deposits, breakdown by segment*
0.11%0.11%0.11%0.20%
3Q15 2Q16 3Q16 Oct. 16
0.50%0.30% 0.27% 0.27%
3Q15 2Q16 3Q16 Oct. 16
0.60%0.35% 0.35% 0.35%
3Q15 2Q16 3Q16 Oct. 16
* Around 80% are savings/deposits and around 20% are current accounts ** Rate for savings up to EUR 25,000 is 30 bps, for savings between EUR 25,000-75,000 is 40 bps and for savings higher than EUR 75,000 is 50 bps *** Unweighted average core savings rates in France, Italy and Spain
29
0.80%
0.40%0.30% 0.30%
3Q15 2Q16 3Q16 Oct. 16

ING Orange
RGB= 255, 98, 0
ING Light Grey
RGB= 168, 168, 168
ING Indigo
RGB= 82, 81, 153
ING Sky
RGB= 96, 166, 218
Colour Guidelines
ING Fuchsia
RGB= 171, 0, 102
ING Lime
RGB= 208, 217, 60
ING Leaf
RGB= 52, 150, 81
ING Mid Grey
RGB= 118, 118, 118
Text Colour
RGB= 51, 51, 51
No content below the grey line
Retail Banking*
31%
9%
9% 12%
16%
3%
14%
6%
Mortgages Netherlands
Other lending Netherlands
Mortgages Belgium
Other lending Belgium
Mortgages Germany
Other lending Germany
Mortgages Other C&GM
Other lending Other C&GM
ING Bank* Wholesale Banking*
* 30 September 2016 lending and money market credit risk outstanding, including guarantees and letters of credit, but excluding undrawn committed exposures (off-balance sheet positions)
• ING Bank has a well-diversified and collateralised loan book with a strong focus on own-originated mortgages
• 65% of the portfolio is retail-based
65%
35%
Retail Banking
Wholesale Banking
43%
13%
22%
13%
7% 2%
Structured Finance
Real Estate Finance
General Lending
Transaction Services
FM, Bank Treasury & Other
General Lease run-off
EUR 620 bln
EUR 404 bln
EUR 216 bln
30
Lending credit outstandings ING Bank are well diversified

ING Orange
RGB= 255, 98, 0
ING Light Grey
RGB= 168, 168, 168
ING Indigo
RGB= 82, 81, 153
ING Sky
RGB= 96, 166, 218
Colour Guidelines
ING Fuchsia
RGB= 171, 0, 102
ING Lime
RGB= 208, 217, 60
ING Leaf
RGB= 52, 150, 81
ING Mid Grey
RGB= 118, 118, 118
Text Colour
RGB= 51, 51, 51
No content below the grey line
19%
15%
12% 20%
8%
1%
3%
22% JapanChina***Hong KongSingaporeSouth KoreaTaiwanIndiaRest of Asia
13%
8%
4%
12%
8% 7% 9%
3%
14%
3%
18%
1% NLBeluxGermanyOther ChallengersGrowth MarketsUKEuropean network (EEA**)European network (non-EEA)North AmericaRest of AmericasAsiaAfrica
3% 6%
9%
6%
4%
5%
14% 5%
15%
5%
5%
11%
5% 7% Builders & ContractorsCentral BanksCommercial BanksNon-Bank Financial InstitutionsFood, Beverages & Personal CareGeneral IndustriesNatural Resources Oil & GasNatural Resources Other****Real EstateServicesTelecom, Media & TechnologyTransportation & LogisticsUtilitiesOther
Loan portfolio is well diversified across geographies…
Lending Credit O/S Wholesale Banking (3Q16)*
Lending Credit O/S Asia (3Q16)*
Lending credit outstandings Wholesale Banking well diversified by geography and sector
* Data is based on country of residence, Lending Credit O/S include guarantees and letters of credit ** Member countries of the European Economic Area (EEA) *** Excluding our stake in Bank of Beijing (EUR 2.5 bln at 30 September 2016) **** Mainly Metals & Mining
EUR 216 bln
EUR 40 bln
…and sectors
Lending Credit O/S Wholesale Banking (3Q16)*
EUR 216 bln
31

ING Orange
RGB= 255, 98, 0
ING Light Grey
RGB= 168, 168, 168
ING Indigo
RGB= 82, 81, 153
ING Sky
RGB= 96, 166, 218
Colour Guidelines
ING Fuchsia
RGB= 171, 0, 102
ING Lime
RGB= 208, 217, 60
ING Leaf
RGB= 52, 150, 81
ING Mid Grey
RGB= 118, 118, 118
Text Colour
RGB= 51, 51, 51
No content below the grey line
Wholesale Banking NPL ratio continued to improve in 3Q16
Selected lending portfolios
Lending credit O/S 3Q16
NPL ratio 3Q16
Lending credit O/S 2Q16
NPL ratio 2Q16
Lending credit O/S 3Q15
NPL ratio 3Q15
Wholesale Banking 215,779 2.4% 214,059 2.5% 199,807 2.9%
Industry Lending 121,257 2.4% 119,120 2.5% 107,252 3.2%
Of which Structured Finance 92,941 2.3% 91,909 2.4% 80,976 2.4%
Of which Real Estate Finance 28,316 2.9% 27,211 3.0% 26,002 5.2%
Of which UK Real Estate Finance 2,348 0% 2,444 0% 2,581 0.2%
Selected industries*
Oil & Gas related 31,335 2.5% 30,746 2.8% 27,550 1.8%
Metals & Mining** 13,885 5.6% 14,541 5.9% 13,275 6.4%
Shipping & Ports*** 13,498 4.9% 12,857 4.4% 12,168 4.5%
Selected countries
Turkey**** 18,875 2.5% 19,917 2.3% 18,403 1.8%
China***** 6,148 0% 6,719 0% 7,687 0%
Russia 5,614 2.8% 5,851 2.7% 5,696 2.8%
Ukraine 1,138 56% 1,223 57% 1,168 55.2%
32
* Includes WB Industry Lending, General Lending (CFIL) and Transaction Services ** Excluding Ukrainian and Russian Metals & Mining exposure, the NPL ratio would be just 1.8% *** Shipping & Ports includes Coastal and Inland Water Freight which is booked within Retail Netherlands. Excluding this portfolio, NPL ratio is only 1.4% **** Turkey includes Retail Banking activities (EUR 10.3 bln) ***** China exposure is excluding Bank of Beijing stake

ING Orange
RGB= 255, 98, 0
ING Light Grey
RGB= 168, 168, 168
ING Indigo
RGB= 82, 81, 153
ING Sky
RGB= 96, 166, 218
Colour Guidelines
ING Fuchsia
RGB= 171, 0, 102
ING Lime
RGB= 208, 217, 60
ING Leaf
RGB= 52, 150, 81
ING Mid Grey
RGB= 118, 118, 118
Text Colour
RGB= 51, 51, 51
No content below the grey line
Lending to the Oil & Gas industry is well diversified
86% of lending is not directly exposed to oil price risk
On EUR 3.6 bln of exposure, we may see higher loan losses due to the oil price decline in the past year
Lending credit O/S
In EUR bln In %
Trade and Commodity Finance
• Trade-related exposure; short-term self-liquidating trade finance, generally for major trading companies, either pre-sold or price hedged, not exposing the Bank to oil price risk
13.2 42%
Export Finance • ECA covered loans in Oil & Gas: typically 95-100% credit
insured 1.7 5%
Corporate Lending • Corporate Loans in Oil & Gas sector: predominantly loans
to investment grade integrated oil companies 6.8 22%
Midstream • E.g. pipelines, tank farms, LNG terminals, etc.: these assets
typically generate revenues from long-term tariff-based contracts, not affected by oil price movements
5.3 17%
Other Offshore Services Companies
• Diversified portfolio of companies active in pipe laying, heavy lifting, subsea services, etc., corporate guaranteed
0.7 2%
Offshore Drilling Companies
• Loans to finance drilling rigs, generally backed by 2-5 yr charter contracts and corporate guaranteed
0.9 3%
Reserve Based Lending*
• Financing based on borrower’s Oil & Gas assets. Loans secured by reserves of Oil & Gas. Includes smaller independent Oil & Gas producers
2.7 9%
Total Oil & Gas related exposure
EUR 31.3 bln
• The EUR 0.6 bln quarter-on-quarter increase in lending credit outstandings is mainly due to higher Corporate Lending which is partly offset by lower Trade and Commodity Finance volumes
* Individual RBL clients have different combinations of oil and gas but overall portfolio composition is approximately 60% oil and 40% gas
Somewhat exposed to oil price risk
33

ING Orange
RGB= 255, 98, 0
ING Light Grey
RGB= 168, 168, 168
ING Indigo
RGB= 82, 81, 153
ING Sky
RGB= 96, 166, 218
Colour Guidelines
ING Fuchsia
RGB= 171, 0, 102
ING Lime
RGB= 208, 217, 60
ING Leaf
RGB= 52, 150, 81
ING Mid Grey
RGB= 118, 118, 118
Text Colour
RGB= 51, 51, 51
No content below the grey line
Important legal information
34
ING Group’s annual accounts are prepared in accordance with International Financial Reporting Standards as adopted by the European Union (‘IFRS-EU’). In preparing the financial information in this document, except as described otherwise, the same accounting principles are applied as in the 2015 ING Group consolidated annual accounts. All figures in this document are unaudited. Small differences are possible in the tables due to rounding.
Certain of the statements contained herein are not historical facts, including, without limitation, certain statements made of future expectations and other forward-looking statements that are based on management’s current views and assumptions and involve known and unknown risks and uncertainties that could cause actual results, performance or events to differ materially from those expressed or implied in such statements. Actual results, performance or events may differ materially from those in such statements due to, without limitation: (1) changes in general economic conditions, in particular economic conditions in ING’s core markets, (2) changes in performance of financial markets, including developing markets, (3) consequences of a potential (partial) break-up of the euro, (4) potential consequences of European Union countries leaving the European Union, (5) changes in the availability of, and costs associated with, sources of liquidity such as interbank funding, as well as conditions in the credit markets generally, including changes in borrower and counterparty creditworthiness, (6) changes affecting interest rate levels, (7) changes affecting currency exchange rates, (8) changes in investor and customer behaviour, (9) changes in general competitive factors, (10) changes in laws and regulations, (11) changes in the policies of governments and/or regulatory authorities, (12) conclusions with regard to purchase accounting assumptions and methodologies, (13) changes in ownership that could affect the future availability to us of net operating loss, net capital and built-in loss carry forwards, (14) changes in credit ratings, (15) ING’s ability to achieve projected operational synergies and (16) the other risks and uncertainties detailed in the most recent annual report of ING Groep N.V. (including the Risk Factors contained therein) and ING’s more recent disclosures, including press releases, which are available on www.ing.com. Any forward-looking statements made by or on behalf of ING speak only as of the date they are made, and, ING assumes no obligation to publicly update or revise any forward-looking statements, whether as a result of new information or for any other reason.
This document does not constitute an offer to sell, or a solicitation of an offer to purchase, any securities in the United States or any other jurisdiction.
www.ing.com


