
INFSO-ICT-224557 BeAware Boosting Energy Awareness with ...
16
INFSO-ICT-224557 BeAware Boosting Energy Awareness with Adaptive Real-time Environments Instrument: CA STREP IP NOE ICT - Information and Communication Technologies Theme D3.9 Implementation of load fingerprinting Due date of deliverable (as in Annex 1): April 30th, 2011 Actual submission date: July 1st, 2011 Start date of project: May 1 st 2008 Duration: 36 months Organisation name of lead contractor for this deliverable: BaseN Revision: 1 Project co-funded by the European Commission within the Seventh Framework Programme (2007-2013) Dissemination Level PU Public PP Restricted to other programme participants (including the Commission Services) RE Restricted to a group specified by the consortium (including the Commission Services) CO Confidential, only for members of the consortium (including the Commission Services)
Transcript of INFSO-ICT-224557 BeAware Boosting Energy Awareness with ...

INFSO-ICT-224557
BeAware
Boosting Energy Awareness with Adaptive Real-time Environments
Instrument:
CA STREP IP NOE
ICT - Information and Communication Technologies Theme
D3.9 Implementation of load fingerprinting
Due date of deliverable (as in Annex 1): April 30th, 2011
Actual submission date: July 1st, 2011
Start date of project: May 1st 2008 Duration: 36 months
Organisation name of lead contractor for this deliverable: BaseN
Revision: 1
Project co-funded by the European Commission within the Seventh Framework Programme (2007-2013)
Dissemination Level
PU Public
PP Restricted to other programme participants (including the Commission Services)
RE Restricted to a group specified by the consortium (including the Commission Services)
CO Confidential, only for members of the consortium (including the Commission Services)
BeAware – Boosting Energy Awareness with Adaptive Real-time Environments
IMPLEMENTATION OF LOAD FINGERPRINTING 2 [Confidential] – [D3.9 Version 1.2]
Programme Name: ICT
Project Number: 224557
Project Title: Boosting Energy Awareness with Adaptive Real-time Environments
Partners: COORDINATOR: TKK (FI)
CONTRACTORS: Helsinki University of Technology, TKK BaseN Corporation, BaseN Interactive Institute II AB, II Engineering Ingegneria Informatica, ENG University of Padova, UNIPD Enel.si, ENELSI IES Solutions, IES Vattenfall Research and Development AB, VRD
Document Number: D3.9
Work-Package: wp3
Deadline Date: 30th April 2011
Date of Delivery: 5th May 2011
Title of Document: Implementation of load fingerprinting
Author(s): Topi Mikkola
Responsible Partner: BaseN
Reviewer: Erik Bunn, Tatu Nieminen
History: 1.0 - Reviewed by Tatu Nieminen
1.1 - Updated summary - Topi Mikkola
1.2 - Language check - Erik Bunn
Availability: [restricted]
BeAware – Boosting Energy Awareness with Adaptive Real-time Environments
IMPLEMENTATION OF LOAD FINGERPRINTING 3 [Confidential] – [D3.9 Version 1.2]
Table of Contents
Executive Summary ............................................................................................... 4 1. Introduction ................................................................................................... 5 2. Implementation of previous work ........................................................................ 5 2.1. Steady state detection..................................................................................... 5 2.2. Fingerprint creation and matching....................................................................... 7 2.3. K-nearest neighbours....................................................................................... 7 3. Subtype detection ........................................................................................... 8 4. Multimodal devices .......................................................................................... 8 5. Load disaggregation ........................................................................................12 6. Library models...............................................................................................15
BeAware – Boosting Energy Awareness with Adaptive Real-time Environments
IMPLEMENTATION OF LOAD FINGERPRINTING 4 [Confidential] – [D3.9 Version 1.2]
Executive Summary
This prototype description gives the overview of fingerprinting process implementation in
BeAware.
BeAware fingerprinting consist of fundamental and harmonic frequency analysis based on
detected steady operational states. System extracts a so called load fingerprint from detected
steady states and compares it against library of known fingerprints via k-nearest neighbours
clustering. This allows system to differentiate between main load types - resistive, motor-
inductive and power electronics.
Some devices have multiple possible operational states, none of which alone is enough to identify
the device. (Example being washing machine, which has resistive fingerprint while heating
water, motor when spinning etc) We demonstrate that it is possible to recognize these devices by
the sequence of such fingerprints, by again comparing against library of known chains. It this
case a markov chain inspired approach is used where each transition between set of states is
assigned a probability.
Finally we present an initial version of fingerprinting for situation where single sensor is
measuring multiple loads. In this approach new steady states are detected and a heuristic
algorith, comparing fundamental power components ratios and harmonic frequencies between
old and new combination load are compared. When loads are of roughly similar magnitude and
exhibit steady state, we demonstrate a system that can give a good indication what type of load
was added.
This document also contains the library models used for load and multistate fingerprints.
BeAware – Boosting Energy Awareness with Adaptive Real-time Environments
IMPLEMENTATION OF LOAD FINGERPRINTING 5 [Confidential] – [D3.9 Version 1.2]
1. Introduction
This document briefly discusses the implementation of research done in D3.8 and the further research on the topic. The researched system was based on steady state analysis on power channel to detect when a new steady operational state was reached and then harmonic component analysis to estimate the main type of the load via k-‐nearest neighbors clustering.
Further research was initially done on device subtype detection within a main category. Unfortunately this mainly reinforced the results from original research that detecting new types of loads based on limited load library is not feasible, as fingerprints even between same types of devices differ too much.
Multistate devices like washing machines, microwave ovens and dishwashers were of particular interest to BeAware project as guiding users to use them in more economical mode would allow them also to save energy without too much impacting standards of living. A system to detect the type and state of such machines was developed, based on markov chains and chain probabilities.
Finally several attempts at combined load signal disaggregation were made. This is a research subject that would allow, if successful, the project to use only mains sensors instead of several individual sensors, meaning a cheaper solution. The current system allows for a partial solution, able to detect resistive loads (heating, old lights) to a good degree and rest of loads to some degree.
It is assumed that reader has read D3.8 Analysis of load signatures and knows about the basic load types, their characteristics etc.
2. Implementation of previous work
2.1. Steady state detection
The steady state detection is based on analyzing the power channel for states where the values are not fluctuating and can thus be considered stable, signifying a separate operational mode of a device has been reached. This algorithm is based on several steps:
1. Time series is filtered of noise via median filter -‐ a small window of 7 (3 steps on each side of measurement) point is used. This step might seem non-‐necessary, but is particularly useful in removing the startup noise (spike) from motor type loads and random measurement errors.
2. Unstable measurement values are filtered. If the change between adjacent states is greater that the local variance, point is not considered stable -‐ meaning that previous state has ended, or point belongs to an undefined state. Mathematically

BeAware – Boosting Energy Awareness with Adaptive Real-time Environments
IMPLEMENTATION OF LOAD FINGERPRINTING 6 [Confidential] – [D3.9 Version 1.2]
this can be formulated as
€
ddtf (t) >σ(t) , where f(t) is value at time t and
€
σ(t) is
the local variance at that point.
3. State transitions are detected. Values are assumed to be normally distributed, so at each step a confidence interval is calculated and it is determined if the value is within such interval, meaning inside the state, or outside the interval, meaning a new state has been reached. Because the local variance of the data is estimated using the data itself, Gaussian distribution cannot be used, but we must apply Student’s t-‐distribution with m -‐ 1 degrees of freedom, where m denotes the number of samples used for variance estimation. Instead of using the average value of the data as the expected value, it makes more sense to use the last value of the data as the expected value. This allows data to vary ”globally” inside the state keeping the local rapid changes as state transitions. The condition can be presented mathematically. Mathematically this can be represented as f(t)~t(m-‐1),
€
f (t −1) − tα2
*σ(t −1) < f (t) < f (t −1) + tα2
*σ(t −1)
4. If possible new stable state is reached, new samples are checked, until minimum required number is reached. So it t=k was not inside the last state, a potential start is signaled and at t=k+n (where n is the minimum length of state) if all values are still stable, a new state has been reached and marked as starting from t=k. This removes the very small "stable" fluctuations from data.
5. Update the state information. Averages and local variance are updated. Local variance is a weighted sum of current estimated and previous variance as given by
€
σ(t) =θ *σ(t −1) + (1−θ ) *σ(χ) where
€
σ(t −1) is previous values local variance and
€
σ(χ) variance of last m samples.
The detailed algorithm is available in class StateChangeDetector in project SVN repository. An example of dishwasher power consumption and associated states is given below. Figure 1 Raw power shows the actual power measurements and Figure 2 shows the detected states -‐ as can be seen, some states are split into two as signal has some noise.
Figure 1 Raw power

BeAware – Boosting Energy Awareness with Adaptive Real-time Environments
IMPLEMENTATION OF LOAD FINGERPRINTING 7 [Confidential] – [D3.9 Version 1.2]
Figure 2 Detected states
2.2. Fingerprint creation and matching
From each detected state, an average of power and each power quality value is calculated and added to event information. That information can then be compared to known fingerprints in load library. A distance between a fingerprint x and measurement y is given by the function, where j is the number of attributes in fingerprint (see D3.8) and
€
σ is the standard deviation for attribute j.
€
d(x,y) = ( 1
j2σ)
2( jx − jy )j=1
n∑
This is a very simplistic distance function, which as shown below, should probably be adjusted for more/less important attributes. As for example now the standard deviation of power is such that within bracket of 20-‐100W, for most devices the value for power will be meaningless for overall distance.
Fingerprints themselves are stored in excel format and read once when fingerprinting process is started.
Fingerprints, load library reading and distance functions are found in classes FingerprintMeasurement and FingerprintFactory.
2.3. K-nearest neighbors
After the steady state analysis on the power channel, each found state and associated power variables are compared against the load library, using a simple k-‐nearest neighbors clustering for determining the main type of load. The algorithm for event X can be described
1. Calculate distance value between X and each fingerprint value
2. Choose k nearest fingerprints

BeAware – Boosting Energy Awareness with Adaptive Real-time Environments
IMPLEMENTATION OF LOAD FINGERPRINTING 8 [Confidential] – [D3.9 Version 1.2]
3. Each chosen fingerprint has one "vote" and type is assigned as one with most votes. If there is a tie, closest fingerprint wins.
The algorithm presented here has over 90% hit rate on single mode applications, when trial2 sensor data (50 sensors measuring varying single and combination loads) was compared against load library. The problematic cases were all either microwave ovens or computers, both of which seemingly have large variations between models. 100% of multimodal devices were detected to have several fingerprints.
K-‐NN clustering can be found from class FingerprintClusterer.
3. Subtype detection As stated in D3.8, the above algorithm has only 60% hit probability inside a known group of devices and even less with unknown devices -‐ reasons for this are many, in particular device operational state not staying the same over longer periods of time, external environment and slight differences in machines even of same type and manufacturer. It looks very probable that correctly detecting exact type would need both transitional characteristics analysis and far larger load library. Some attempts were made to have further information about device. These included:
• For resistive loads, using heuristics. As resistive loads are mainly of 3 categories:
o lights (below 200W)
o Space heating (over 500W), long cycle, very little harmonic distortion
o Cooking (over 500W), short cycle
A simple heuristic was developed to classify loads to these categories based on their power usage and detected cycle length. This was mainly as an example of combining heuristic analysis to cluster result in case where determining the heuristic was obvious and data used for it not available in fingerprint.
• Additional round of distance calculation (k == 1) within the cluster, using the standard deviation of devices inside the same main type. This did not yield any significant increase in accuracy
Also, detecting of unknown device is not in normal case possible, as the distance values are usually reasonably similar for known and unknown devices (as the attributes inside a group do not usually vary that much).
Examples can be found in TypeDetector -‐class.
4. Multimodal devices The initial fingerprint actually does not give an answer to question "what type of device is this" but to "what type of load is this" -‐ many devices actually have several operational states, which themselves might contain substates. A good example of this would be washing machine, which includes heating water (mainly resistive), spinning (motor) and various smaller components, which are on/off independent of each other, meaning that device has several different characteristic states.

BeAware – Boosting Energy Awareness with Adaptive Real-time Environments
IMPLEMENTATION OF LOAD FINGERPRINTING 9 [Confidential] – [D3.9 Version 1.2]
Analyzing these states, it quickly becomes obvious that different devices have different sequences of states -‐ below are examples of dishwasher in speed 65C program and normal washing machine in 60C program.
Figure 3 Washing machine 60C
Figure 4 Washing machine 60C, sequence of types
Figure 5 Dishwasher 65C speed

BeAware – Boosting Energy Awareness with Adaptive Real-time Environments
IMPLEMENTATION OF LOAD FINGERPRINTING 10 [Confidential] – [D3.9 Version 1.2]
Figure 6 , sequence of types
As these quite clearly form a system of state transitions, a Markov Chain inspired approach was chosen. In Markov chains, each state transition has a probability attached and each transition only depends on current state, not a history of states. From these, a probability can be estimated for any series of state transitions. For BeAware case, it is quite obvious that state transition has some dependency on previous states also, so system is not a simple Markov's model.
As the state analysis is based on steady states, it was necessary to add two new kinds of states to system. Undefined for periods between valid states where power is consumed, but state is not stable, as particularly washing machines have these states. And Switchoff for ending a chain when power consumption goes to 0.
The initial version just consisted of several example chains from measured device and from those a probability of each state transition was calculated. It became obvious that in examples above, there are so many transitions, that probabilities became almost meaninglessly low and slight noise in measurement might mean that single state was split into two introducing a new transition and thus lower probability.
The next version considered adjacent same states as one, reducing the number of transitions. This helped separate different devices, but the mode inside the device is hard to detect as most devices tend to cycle inside same sequences of state transitions regardless of their mode.
The final version introduced an idea of superstate, where basically a recurring cycle of states is considered one. For example in dishwasher, sequence of "electronic-‐motor-‐resistive-‐electronic" repeats twice in 65C speed mode and several times in normal 65C mode. This reduces number of transitions and also makes sure that false positives between devices are rarer.
The current system uses just greedy matching to checking if chain matches to a chain fingerprint preferring most probable transition without look ahead -‐ in production system this should be changed to regular expression style of evaluation, which does not produce non-‐match because of a greedy algorithm getting stuck in local maximum.

BeAware – Boosting Energy Awareness with Adaptive Real-time Environments
IMPLEMENTATION OF LOAD FINGERPRINTING 11 [Confidential] – [D3.9 Version 1.2]
Current system is also favors giving an "unknown" result instead of false positive by using superstate approach -‐ this is a desired effect.
Examples of superstates and transitions could be thus written for eco-‐mode dish washer:
start: motor
transition: resistive-electronic
Probability: 50%
Whereas for 65C it could be
start: motor
transition: resistive-electronic-motor-resistive-electronic
Probability: 50%
Where in both cases the state actually described is "transition over the heating cycle". Also, with this system of "super states" it is much easier to detect unknown chains that do not match any known chain fingerprint.
The system has been tested only inside the project internal installations, with 1 washing machine, 1 dishwasher plus one microwave oven. From washing machine 60C and 40C and dishwasher’s 65C and 65Cspeed modes were fingerprinted and other states were used for testing unknown state, with microwave being used to test for unknown device.
With dishwasher, system has over 95% hit rate with both device and known mode, as device exhibits very little noise. With washing machine, device type is detected over 95%, but mode is detected only with roughly 50% probability, with many false positives, even with this approach.
For unknown modes from known device, dishwasher is able to flag both eco mode and "wash only" as unknown, whereas washing machine almost always provides false positive. This is due to fact that in washing machine, difference is mainly in resistive heating cycle length, and the current system does not take even length into account.
From these results, it seems very likely that this approach is usable for device mode detection with few modifications :
• event length must be taken into account
• Number of total transitions should be taken into account
• event chains should be able to have "switchoff" as internal transition, too, as some devices like microwave do almost stop when on low power mode
• chain matching algorithm should provide a look ahead estimation functionality
This functionality is available in class EventChain, EventChainFingerprint and EvenChainMatcher

BeAware – Boosting Energy Awareness with Adaptive Real-time Environments
IMPLEMENTATION OF LOAD FINGERPRINTING 12 [Confidential] – [D3.9 Version 1.2]
5. Load disaggregation
Load disaggregation in this context means separating unique loads from one common signal, detecting when one load has been switched on and off. In traditional approaches, this is done only on power channel as either a simple combinatorial problem (which known load would be closest to this change) or time series analysis (which combination of probabilistic time series would give a series most resembling this one). The first one is able to approximate large loads with very simple system, whereas the latter needs a lot of a priori knowledge of possible load types, their variance etc to give a good estimate. In BeAware's case we have also load quality information available, so the last task was to check what could be done with that in regards to load disaggregation.
In ideal case, load disaggregation should be done at sensor level, as there measurements are available at 1 kHz granularity and analysis could be done at actual waveform. Unfortunately current sensor does not have CPU capability for that (as already CPU utilization is over 90%).
Even on 1/2 Hz data available to base station and overall system, the task is in principle simple, as all current waveforms aggregated to one signal have same 50 Hz base frequency so when loads are added one at a time, individual waves could be separated from base. Unfortunately real-‐world devices also introduce phase shift, which means that the waveforms do not simply add to each other, but can also cancel each other out at varying frequencies.
From sensor data we have active power (P), total power factor (PF) and fundamental power factor (cosphi), so based on those we can also calculate reactive (Q), apparent (S) and disruptive power (D) with following equations:
€
Q = tan(acos(cos phi))*P
S =PPF
D = S2 − P 2 −Q2
Based on these, we can approximate if new load has more reactive or disruptive components (Q/S, D/S ratio) in new combination than in old. As we know that in resistive loads both Q and D are close to zero, we can make an estimate if newly added load was resistive or not. (It is of course possible that some cancellation happens in both of these values, so it is just an estimate).
To make an estimate about non-‐resistive loads, harmonic variables are also considered. Initially a similar system just comparing the ratios of HFx to S was tried, but it very quickly became obvious that harmonic content very often ended up canceling some parts out, so system was very unreliable.
BeAware – Boosting Energy Awareness with Adaptive Real-time Environments
IMPLEMENTATION OF LOAD FINGERPRINTING 13 [Confidential] – [D3.9 Version 1.2]
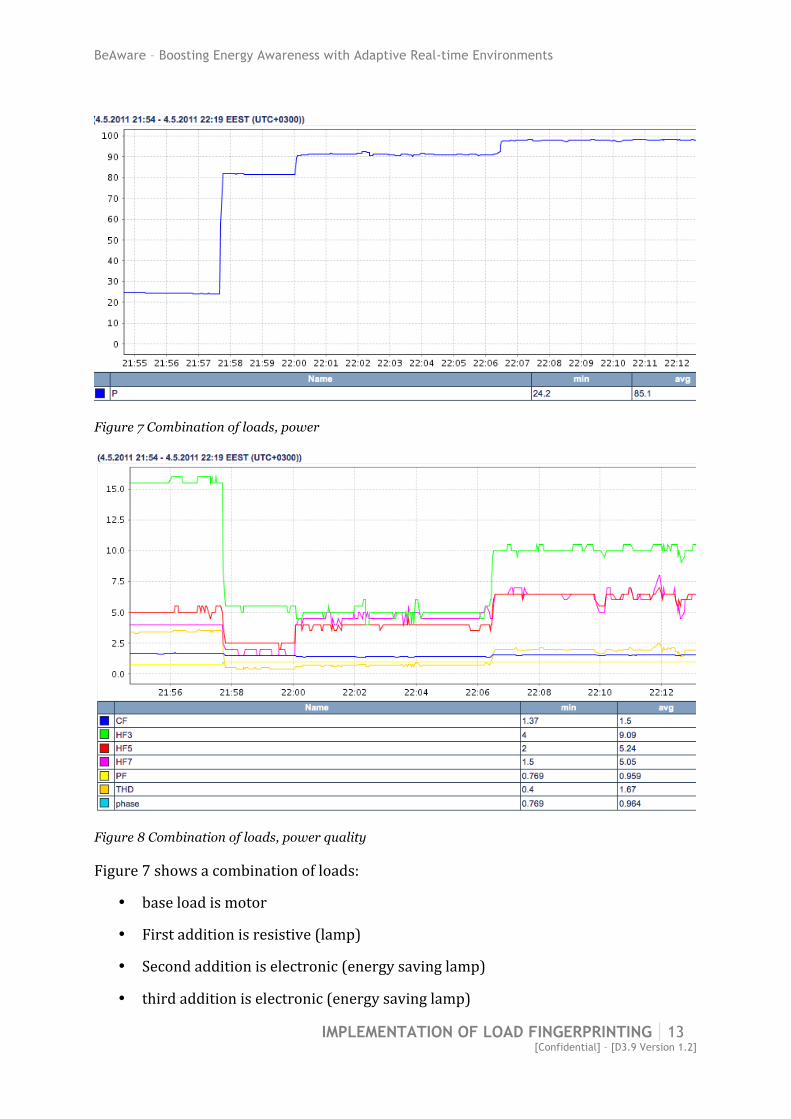
Figure 7 Combination of loads, power
Figure 8 Combination of loads, power quality
Figure 7 shows a combination of loads:
• base load is motor
• First addition is resistive (lamp)
• Second addition is electronic (energy saving lamp)
• third addition is electronic (energy saving lamp)

BeAware – Boosting Energy Awareness with Adaptive Real-time Environments
IMPLEMENTATION OF LOAD FINGERPRINTING 14 [Confidential] – [D3.9 Version 1.2]
And Figure 8 shows the associated power variables. It can be seen that HF3 does not react to first energy saving lamp even if we know from previous measurements that it does have a very significant HF3 component, probably signifying that some harmonic frequencies did cancel each other out.
Based on these observations, a heuristic approach was developed, which first tries to estimate if new load was resistive via Q and D ratio to S. And if load was not resistive, harmonic components are analyzed.
Harmonic components HF3,HF5 and HF7 are relative to apparent power (ratio), thus when waveforms do not cancel each other out in ideal case, we could for each harmonic frequency use
€
HFsum =P1 *HF1 + P2 *HF2
P1 + P2, where
€
P2 is average apparent power of load 2 and
€
HF2 is
average harmonic frequency ratio of load 2. Thus when new steady state is detected, its' power is
€
Pdev = Pnew − Pold and from the equation above, the harmonic distortion for each
frequency can be estimated to be
€
HFdev =(HFnew *Pnew −HFold *Pold )
Pdev.
In cases where this would mean that HF component of new load is significantly negative, we must assume that waveforms are canceling each other out.
We also know that resistive loads have no noticeable harmonic content, in motor-‐inductive cases HF3 dominates whereas for power electronics there is significant component in HF3,HF5 and HF7.
Thus these rules combined when a new load is added:
• If relative disruptive and reactive power goes down (or stays at near zero), load was resistive
• Check each harmonic frequency for following:
o If there is relative increase, flag HFx as having increased.
o If relative value stayed same, flag as HFx not having increased
o If relative value dropped more that above equation would suggest for resistive load with HFx==0, flag HFx as having increased. This is a case of waves canceling eaxh other
• If only HF3 was flagged or if HF3 is much higher than HF5 and HF7 combined, load was motor inductive, otherwise electric.
In each case, we use a parameter to control to check if change in ratio is considered significant. In testing, HF value of over 10% was considered significant.
As this approach was developed in the very end of the project it has not yet been tested extensively, but at least the initial results would suggest that it has some merit. It can detect large resistive loads, enabling the system to estimate heating based ebnergy usage and on smaller loads it at least gives a good indication what machine might have

BeAware – Boosting Energy Awareness with Adaptive Real-time Environments
IMPLEMENTATION OF LOAD FINGERPRINTING 15 [Confidential] – [D3.9 Version 1.2]
been added. In production system, it probably could be combined with a library of household's known devices, aiding in task of detecting what devices were turned on.
Main drawbacks are:
• As it depends on the steady state analysis described above, it does not detect small new states when loads are big. Thus masking new devices and introducing a new source of noise to system.
• It is based on rough estimates on harmonic frequency currents, so as the amount of noise (number of loads) grows, its' ability to separate them diminishes.
• It is very susceptible to systems which do not have steady states or that within a power-‐wise steady state exhibit several different states in harmonics. Computers are prime examples of these and their "noisy" data very easily masks other loads.
• Analysis to differentiate devices is done mainly in HF3-‐HF5-‐HF7 (as they also contribute to D), so devices that do have fingerprints not consistent with their group’s normal HF behavior are tagged incorrectly. Prime examples would be washing machine's heating cycle (resistive, but has harmonic components) and microwave ovens (motor, some models have significant HF5 and HF7).
Examples of these can be found in LoadDisaggregation-‐class.
6. Library models Both the load and event chain libraries are published as part of the BeAware website. Their formats are included here for future reference.
The fingerprint used consists of the following variables:
• Active power (P)
• Fundamental power factor (FPF)
• Total power factor (TPF)
• Total harmonic distortion (THDI)
• Crest factor (CF)
• 3rd harmonic current
• 5th harmonic current
• 7th harmonic current
These variables are explained in more detail in D3.8. All values are the average of variable over the whole steady state event. Device can have several such fingerprints attached, if it is multimodal.
Load library will be available as part of the BeAware website later as an excel file. A whole load library entry consists of

BeAware – Boosting Energy Awareness with Adaptive Real-time Environments
IMPLEMENTATION OF LOAD FINGERPRINTING 16 [Confidential] – [D3.9 Version 1.2]
• Device name
• Unique id (assigned by BeAware team, basically a counter)
• Fingerprint data, with at least one decimal accuracy, preferably more
• Type of load (electronic|resistive|motor)
• Usage category
For the chain fingerprint, format is
DeviceModeName;StartState1:transition-transition-..-end:probability;..;StartStateN:transition-end:probability
Where at least one transition should end in "switchoff". All state names are in lower case and options are:
• resistive
• electronic
• motor
• switchoff
• undefined