INFSCI 2140 - Home | University of Pittsburghpeterb/2140-051/L10.pdf · INFSCI 2140 Information...
20
1 INFSCI 2140 Information Storage and Retrieval Lecture 10: Search Interface and Information Visualization Peter Brusilovsky http://www2.sis.pitt.edu/~peterb/2140-051/ The ad-hoc search process Query Search / Matching Ordered results Formulates Processes Analyzes
Transcript of INFSCI 2140 - Home | University of Pittsburghpeterb/2140-051/L10.pdf · INFSCI 2140 Information...

1
INFSCI 2140Information Storage and RetrievalLecture 10: Search Interface
and Information Visualization
Peter Brusilovskyhttp://www2.sis.pitt.edu/~peterb/2140-051/
The ad-hoc search process
Query Search /Matching
Orderedresults
Formulates Processes Analyzes

2
Stepdiagramfortraditionalinformationaccessprocess
Search interfaces
Classic ad-hoc search is oriented to oldteletype/command line interface style– Query is typed in– Results are returned as a flow of text
Interfaces has got better over years– Rich text presentation with formatting– Graphical user interfaces
Can we improve search interfaces too?

3
Better query formulation interface
Shneiderman identifies five primary HCIstyles:– Command language– Natural language– Form filling– Menu selection– Direct manipulation
We distinguish– GUI– Direct manipulation
Form-based query formulationAND
OR
ANDNOT
4
Graphical User Interface I Venn
diagramswereproposed toimproveBooleanqueryformulation
Graphical User Interface IIFilterflowmodelTwo ormore filterinsequencecreate thesemanticsof aconjunct(AND)Two ormore inparallelcreate adisjunct(OR)

5
Direct manipulation for search?
How we can use direct manipulation inthe classic ad-hoc search process?
The case of Stanford Digital Library(CHI’97)
Why to bother about presentation?
Looking through the search results is apart of the process of finding relevantdocuments
The overall process could be improvedif this part is improved
The standard presentation is theordered list of matched documents
What can we improve?

6
What can we do?
Decide what to present for a document Show context Explain relevance to the query Group the results Present results not in a linear list Present results graphically Let the user explore the results
interactively
Documents and surrogates
Digitally stored, used forsearch, presentation, andselection
Digitally stored, used forpresentation and selection,not used for search
Externally stored, not usedfor search
Metadata,Content data
Digital Document
Externally stored document / object

7
What to present?
Document ID
Metadata, content data• Metadata: author, title, year, source
• Keywords
• Abstract
An extract of the full document• First paragraph
• Thumbnail
Full document
Why it is a bad idea?
Why it is a bad idea?
Two-step / three-step presentation
Two steps:– Level 1 - list with minimal information
– Level 2 - full information by request
Three steps:– Level 1 - list with minimal information
– Level 2 - more detailed information byrequest
– Level 3 - full information by request

8
Example: Photo archive
Photos are stored, but are notsearchable
Searchable are descriptions
Description: what, when, where– Content (abstract vs. classifier)
– Time (granularity!)
– Location (coding scheme vs words)
What to present?
Case study: Movie rental store

9
The case of search engines
The choice:– Header
– URL
– Content
Core elements: Header and URL– Why they are important?
– Why they are not enough?
What else except the core?
Classic design: Excite, 2 steps– Start of the document
Modern design: Lycos, AltaVista– KWAC (keywords and context)
Advanced design:– NorthernLight: relevance, category
– Google: Link to cashed document

10
Some systems try to show the results ina proper context– Cha-Cha system collect the Web pages
that satisfy a query, then come up to theirhome pages and collect also them. This ismade in order to show to the user ahierarchy (or a path) that goes to the queryresults and helps to give them a context
Showing the Context (tree)
Show the context (path)
Cha-Chashows theuser apath toeachqueryresulthelping tosee thecontext

11
Relevance and Context (links!)
Mappuccino allowsthe user to searchon a specific website. The pages thatsatisfy the query areshown together withthe other linkedpages. The idea isthat the user will findwhat he needs inthe results pages orin the linked pages
Relevance and Context (sctructure!) WIDAS shows relevant documents
in the context of a Web site -showing relevance, links, andstructure

12
Relationship between results andthe query
The motivation: to show how thedocument relates to the query– If there was a year restriction -> show year– If there were keywords - show which are
found (KWOC - KWIC - KWAC)
Some efforts to better show keywordrelevance between document and query– Semantic Highlighting / Google– TileBars
The systemshows the degreeof match for eachquery word in thedocuments(darker squaresrepresent morefrequent matches)
TileBars

13
Semantic Grouping
Semantic grouping: the idea is to groupdocuments together by a semanticfeature (taken from metadata or mined)– Source / Author– Media– Date / Time
If no metadata is available the categorycan be deduced using automaticclassification
Hierarchical Classification Dumais and
Chenapproach topresentsearch results
Usesautomaticclassificationwith CVM

14
Clustering
If no category for classification is available,documents can be simply grouped by theirsimilarity
The idea of clustering is to group togetherdocuments with similar content– Based on keywords-level similarity between
documents– There are many clustering algorithms that differ in
speed, precision, presentation power– Hierarchical and 2D clustering– The problem of cluster naming
Managing quantity
More is better?
Quantity and quality
Let the user choose
Setting standard cut-off point
Adaptation to the user’s task andbackground– Adaptive filtering
– Adaptive cut-off

15
Information Visualization forsearch result presentation
Present results not in a linear list (2-3D)– Table: Envision, SenseMaker
– 2D or 3D space: VIBE, InfoCrystal,LyberWorld, Lighthouse
Let the user explore the results bymanipulation with visualization– VIBE, BIRD, GUIDO, LyberWorld, Envision
Graphical results presentation
Most graphical presentation approachesare based on the same ideas– Group similar documents
– Show relevance to the query
In a table similar documents can beshown in the same cell– Metadata-based: Envision
– Similarity-based: SOM

16
Present results not in a linear list
Envision– Virginia Tech Digital Libraries projecthttp://www.dlib.vt.edu/projects/Envision/
2-D Table interface for data exploration– This user-controlled system facilitates
examining very large data sets, displayingmultiple aspects of the data simultaneouslyand efficiently, and interactive discovery ofpatterns in the data

17
Query terms hits between documents
Vibe system places the query terms at the boundaries of aspace and the documents are scattered inside this space
Information visualization beyondpresentation of search results
Information visualization can provide analternative to search and used as adifferent information access paradigm
Information visualization– Similar to browsing: finding documents by
navigation and manipulation– Uses more expressive 2D and 3D
representation– Allows to see “the whole picture”

18
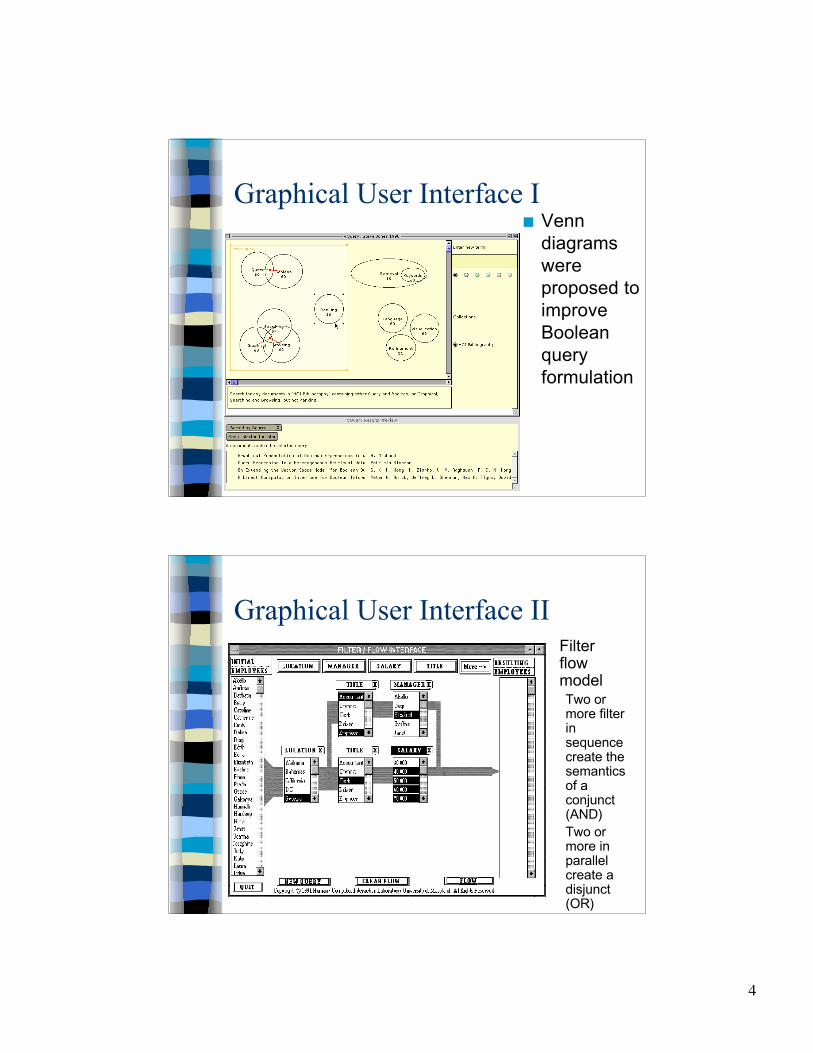
Some examples of informationvisualization Presenting “the whole picture”
– Tabular– 2D or 3D
Interfaces for exploration of specificallyorganized data (tables, hierarchies…)– TableLens, LifeLines
Visualization of hypertext and the Web– Hyperbolic Browser
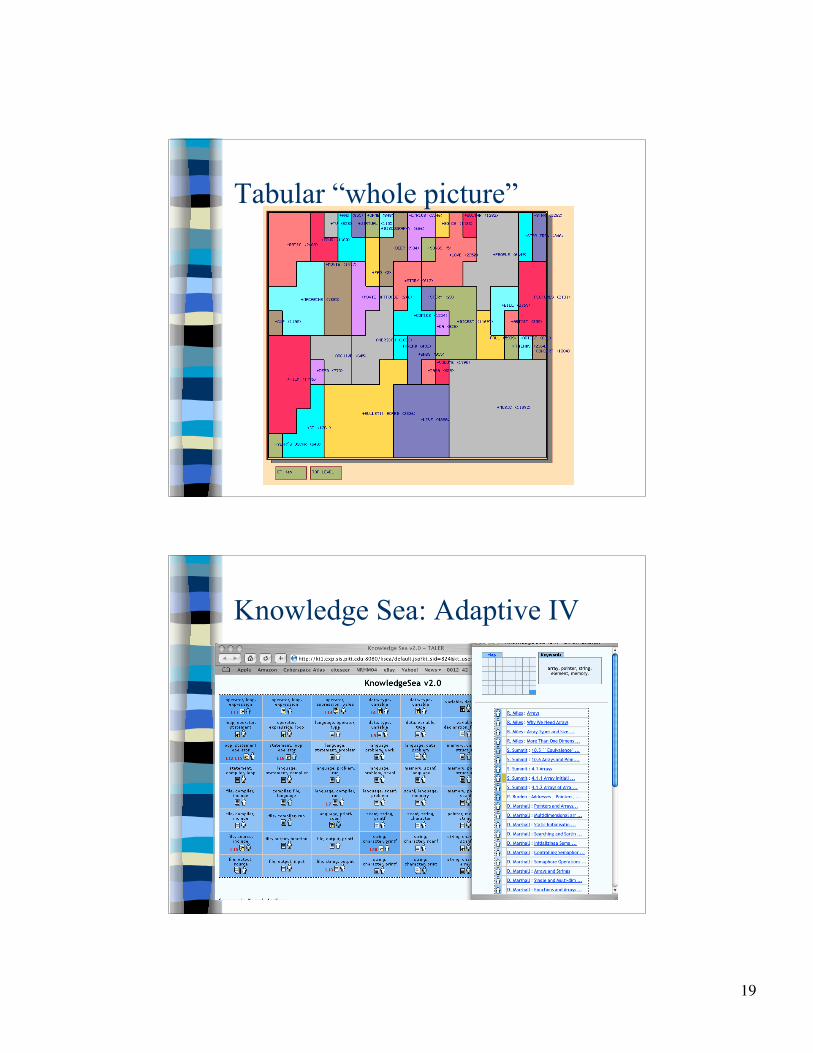
Adaptive Information Visualization– Lighthouse, Knowledge Sea
Graphical “whole picture”
19
Tabular “whole picture”
Knowledge Sea: Adaptive IV
20
Dynamic Queries
Query is issued using GUI controls Query response is visible and visualized
immediately Query can be dynamically modified Attributes can be explored There is tight coupling between displays
and controls Examples: MovieFinder, LifeLines...
Dynamic queries: where else?
Name 3 possible application areas