Infrastructure Investments Fund (“IIF”) · strictly private | confidential. 2 | for...
34
STRICTLY PRIVATE | CONFIDENTIAL 1 | FOR INSTITUTIONAL/WHOLESALE/PROFESSIONAL CLIENTS AND QUALIFIED INVESTORS ONLY - NOT FOR RETAIL USE OR DISTRIBUTION For the exclusive use of the City of Fresno Employees Retirement System only Infrastructure Investments Fund (“IIF”) City of Fresno Employees Retirement System August 9 th , 2017 0903c02a813894a7 For the exclusive use of the City of Fresno Employees Retirement System only
Transcript of Infrastructure Investments Fund (“IIF”) · strictly private | confidential. 2 | for...
STRICTLY PRIVATE | CONFIDENTIAL
1 | FOR INSTITUTIONAL/WHOLESALE/PROFESSIONAL CLIENTS AND QUALIFIED INVESTORS ONLY - NOT FOR RETAIL USE OR DISTRIBUTION
For the exclusive use of the City of Fresno Employees Retirement System only
Infrastructure Investments Fund (“IIF”)City of Fresno Employees Retirement System
August 9th, 2017
0903c02a813894a7
For the exclusive use of the City of Fresno Employees Retirement System only
pattiel
Text Box
Agenda Item: 9:00 am Special Joint Meeting of the Retirement Boards Meeting Date: August 9, 2017

STRICTLY PRIVATE | CONFIDENTIAL
2 | FOR INSTITUTIONAL/WHOLESALE/PROFESSIONAL CLIENTS AND QUALIFIED INVESTORS ONLY - NOT FOR RETAIL USE OR DISTRIBUTION
For the exclusive use of the City of Fresno Employees Retirement System only
BiographiesPaul Ryan, Managing Director, is the Portfolio Manager of the J.P. Morgan Asset Management Infrastructure Investments Group. The combined strategiesrepresent over $12 billion of assets under management. Paul currently serves on the boards of Southern Water Services, Electricity North West, North QueenslandAirports Noatum Ports and Corridor Energy. Prior to his current role, Paul was the co-head of Public Finance Banking at J.P. Morgan with primary coverage fortransport and energy infrastructure. In that role, Paul structured and financed many of the largest deals in the infrastructure sector. He advised governments,municipalities and infrastructure funds on acquisitions, disposals, equity and debt raises, advising on and raising capital for over $25 billion of U.S. infrastructuretransactions. Earlier in his career, Paul ran Equity Capital Markets for JPMorgan in Australia, with a strong focus on the real estate and infrastructure sectors. Paulreceived an undergraduate degree in economics from Macquarie University and an MBA from Yale University.
Matthew LeBlanc, Managing Director, is the Chief Investment Officer of J.P. Morgan Asset Management Infrastructure Investments Group. Matt is responsiblefor identifying, executing and managing investments for the OECD infrastructure equity platform. Matt has 23 years of power, utility and energy finance and privateequity experience in the development and acquisition of power generation facilities, natural resources production, distributed cogeneration assets, regulateddistribution assets, alternative fuels companies, as well as pipelines, midstream and other transportation, storage and logistics assets. Matt currently serves on theboards for Sonnedix, Nieuport Aviation Infrastructure Partners, Summit Utilities, Zephyr Wind, SouthWest Water Company and Southwest Generation. Prior to J.P.Morgan, Matt spent nearly eleven years at ArcLight Capital Partners, LLC where he was a Principal and responsible for the origination, execution andmanagement of power and energy investments in the U.S. and Europe. Prior to ArcLight, Matt was a Vice President at Berenson Minella & Company's energyadvisory practice, where he focused on mergers and acquisitions and private equity transactions. From 1998 to 2000, Matt was an Associate in the Global PowerGroup at Salomon Smith Barney. He began his career at The NorthBridge Group, an economic and strategic consulting firm serving the electric power and naturalgas industries. Matt earned a Bachelor of Arts in Government and Economics from Dartmouth College and a Master of Business Administration from the YaleSchool of Management. In addition to his responsibilities for the infrastructure investment portfolio, he also serves on the Advisory Board of the Yale Center forBusiness and the Environment.
Nicholas Moller, Executive Director, is a Client Portfolio Manager (Product Specialist) within the Infrastructure Investments Group (“IIG”) at J.P. MorganAsset Management focused on informing clients regarding the opportunities, risks and considerations with investing in infrastructure. Nick has over 10 years ofexperience in the infrastructure sector. Prior to joining IIG Nick was a member of the J.P. Morgan Investment Bank’s Public Finance Transportation andInfrastructure Group. In that role Nick advised both public sector and private sector clients on executing infrastructure and Public Private Partnership transactions.In addition, Nick structured and executed several billion dollars of taxable and tax-exempt financings both for publicly and privately owned infrastructure assets.Earlier in his career Nick was a member of J.P. Morgan Australia’s Equity Capital Markets team which included a strong focus on the Real Estate andInfrastructure sectors. Nick graduated from the University of Auckland (New Zealand) with a Bachelor of Commerce in Finance (First Class Honors).
Todd Evans, Executive Director, is a Relationship Manager within J.P. Morgan Asset Management, where he works with defined benefit, defined contribution, operating asset, union labor and endowment/foundation clients. Prior to joining JPMAM in 2013, Todd was a Vice President within BlackRock's Global Institutional business, specializing in designing and implementing investment strategies for multinational corporate pension plans and union-labor organizations. Todd joined BlackRock via its merger with Barclays Global Investors (BGI) in 2009, and worked for Barclays in both San Francisco and London during his tenure with the firm. Prior to BGI, Todd was a graduate research fellow with the California Public Employees Retirement System (CalPERS) and the manager of investor relations for an NYSE-listed software company in Southern California. Todd received a B.A. in Communications and a MBA from the Haas School of Business in finance and capital markets, both from the University of California, Berkeley.

STRICTLY PRIVATE | CONFIDENTIAL
3 | FOR INSTITUTIONAL/WHOLESALE/PROFESSIONAL CLIENTS AND QUALIFIED INVESTORS ONLY - NOT FOR RETAIL USE OR DISTRIBUTION
For the exclusive use of the City of Fresno Employees Retirement System only
Executive Summary - Key differentiators of Infrastructure Investments Fund (IIF)
• Immediate access to an established, stable, and diversified $6.1B portfolio; no J-curve
• IIF grew out of the JPM Real Estate Group, which has many years of experience working with US pension investors in open end, private market funds
Open-Ended Structure
• Active management of current portfolio assets through being largest or co-largest shareholder in every investment1
• Comprehensive ESG approach to investment and management
• Supported by over 42 independent board directors
Active Asset Management
• Focus on typically less competitive mid-market and platform add-ons
• 29 out of 36 new acquisitions were sourced outside of traditional auction processes since 20132
Mid-Market Platform Investing
• Local assets with unique risk/return drivers that differ from broader economy and financial markets
• Existing USD $6.1B NAV portfolio2
• 214 assets (15 portfolio companies), 15 countries, 9 sectors
ImmediateDiversification
• IIF has raised $3.4B since the start of 2016, all of which has been deployed
• Currently estimated queue of 3 months or less
• Weighted-average queue of approximately 2 months for capital committed in 20163
Short Queue
• Visibility to 5-7% target cash distributions (yield) with 6.2% for trailing 12 months2
Cash Yield
1 Excludes Coastal Winds due to the unique tax equity flip structure of the investment.2 Forecast based upon transaction activity closed and announced, as of June 30, 2017. 3 Based on date of capital called versus commitment date in 2016.There is no guarantee that the target will be achieved.
STRICTLY PRIVATE | CONFIDENTIAL
4 | FOR INSTITUTIONAL/WHOLESALE/PROFESSIONAL CLIENTS AND QUALIFIED INVESTORS ONLY - NOT FOR RETAIL USE OR DISTRIBUTION
For the exclusive use of the City of Fresno Employees Retirement System only
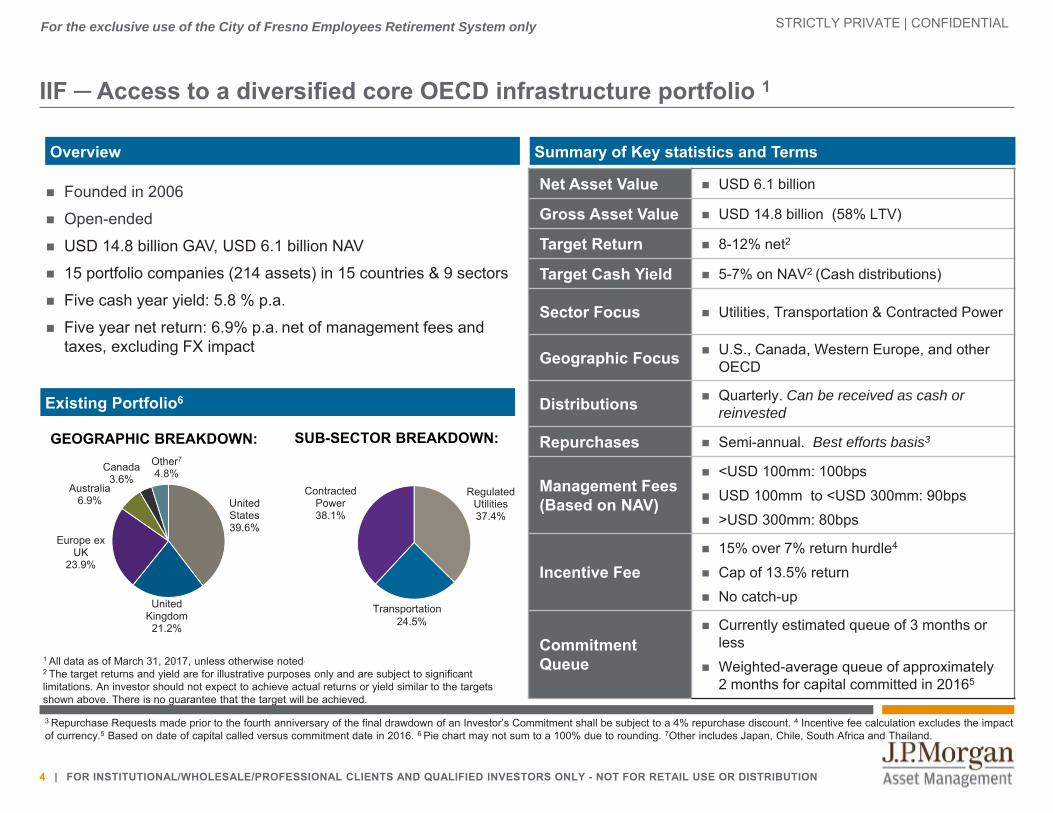
United States39.6%
United Kingdom
21.2%
Europe ex UK
23.9%
Australia6.9%
Canada3.6%
Other7
4.8%
IIF ─ Access to a diversified core OECD infrastructure portfolio 1
Founded in 2006
Open-ended
USD 14.8 billion GAV, USD 6.1 billion NAV
15 portfolio companies (214 assets) in 15 countries & 9 sectors
Five cash year yield: 5.8 % p.a.
Five year net return: 6.9% p.a. net of management fees and taxes, excluding FX impact
SUB-SECTOR BREAKDOWN:GEOGRAPHIC BREAKDOWN:
1 All data as of March 31, 2017, unless otherwise noted.
2 The target returns and yield are for illustrative purposes only and are subject to significant limitations. An investor should not expect to achieve actual returns or yield similar to the targets shown above. There is no guarantee that the target will be achieved.
Net Asset Value USD 6.1 billion
Gross Asset Value USD 14.8 billion (58% LTV)
Target Return 8-12% net2
Target Cash Yield 5-7% on NAV2 (Cash distributions)
Sector Focus Utilities, Transportation & Contracted Power
Geographic Focus U.S., Canada, Western Europe, and other OECD
Distributions Quarterly. Can be received as cash or reinvested
Repurchases Semi-annual. Best efforts basis3
Management Fees (Based on NAV)
<USD 100mm: 100bps USD 100mm to <USD 300mm: 90bps >USD 300mm: 80bps
Incentive Fee 15% over 7% return hurdle4
Cap of 13.5% return No catch-up
CommitmentQueue
Currently estimated queue of 3 months or less
Weighted-average queue of approximately 2 months for capital committed in 20165
3 Repurchase Requests made prior to the fourth anniversary of the final drawdown of an Investor’s Commitment shall be subject to a 4% repurchase discount. 4 Incentive fee calculation excludes the impact of currency.5 Based on date of capital called versus commitment date in 2016. 6 Pie chart may not sum to a 100% due to rounding. 7Other includes Japan, Chile, South Africa and Thailand.
Summary of Key statistics and TermsOverview
Existing Portfolio6
Regulated Utilities37.4%
Contracted Power38.1%
Transportation24.5%
STRICTLY PRIVATE | CONFIDENTIAL
5 | FOR INSTITUTIONAL/WHOLESALE/PROFESSIONAL CLIENTS AND QUALIFIED INVESTORS ONLY - NOT FOR RETAIL USE OR DISTRIBUTION
For the exclusive use of the City of Fresno Employees Retirement System only
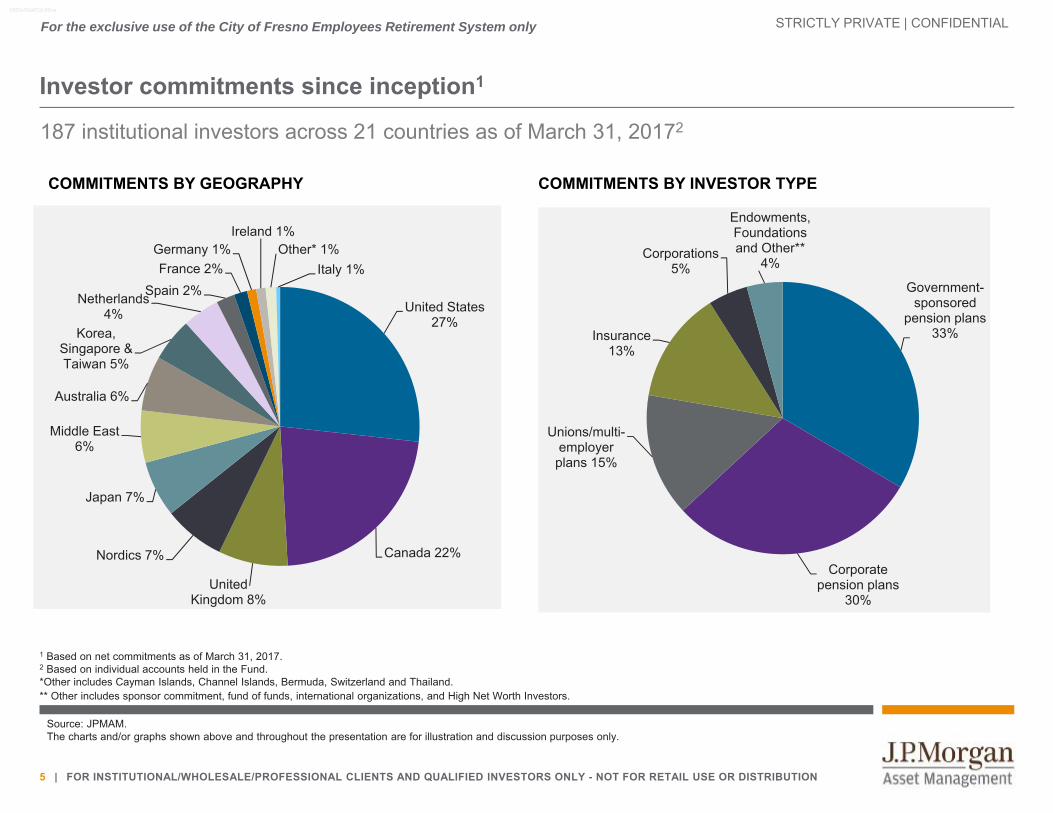
Investor commitments since inception1
187 institutional investors across 21 countries as of March 31, 20172
1 Based on net commitments as of March 31, 2017.2 Based on individual accounts held in the Fund.*Other includes Cayman Islands, Channel Islands, Bermuda, Switzerland and Thailand. ** Other includes sponsor commitment, fund of funds, international organizations, and High Net Worth Investors.
COMMITMENTS BY GEOGRAPHY COMMITMENTS BY INVESTOR TYPE
0903c02a812c56ca
United States 27%
Canada 22%
United Kingdom 8%
Nordics 7%
Japan 7%
Middle East 6%
Australia 6%
Korea, Singapore & Taiwan 5%
Netherlands 4%
Spain 2%France 2%
Germany 1%Ireland 1%
Other* 1%Italy 1%
Government-sponsored
pension plans 33%
Corporate pension plans
30%
Unions/multi-employer plans 15%
Insurance 13%
Corporations 5%
Endowments, Foundations and Other**
4%
Source: JPMAM. The charts and/or graphs shown above and throughout the presentation are for illustration and discussion purposes only.
STRICTLY PRIVATE | CONFIDENTIAL
6 | FOR INSTITUTIONAL/WHOLESALE/PROFESSIONAL CLIENTS AND QUALIFIED INVESTORS ONLY - NOT FOR RETAIL USE OR DISTRIBUTION
For the exclusive use of the City of Fresno Employees Retirement System only
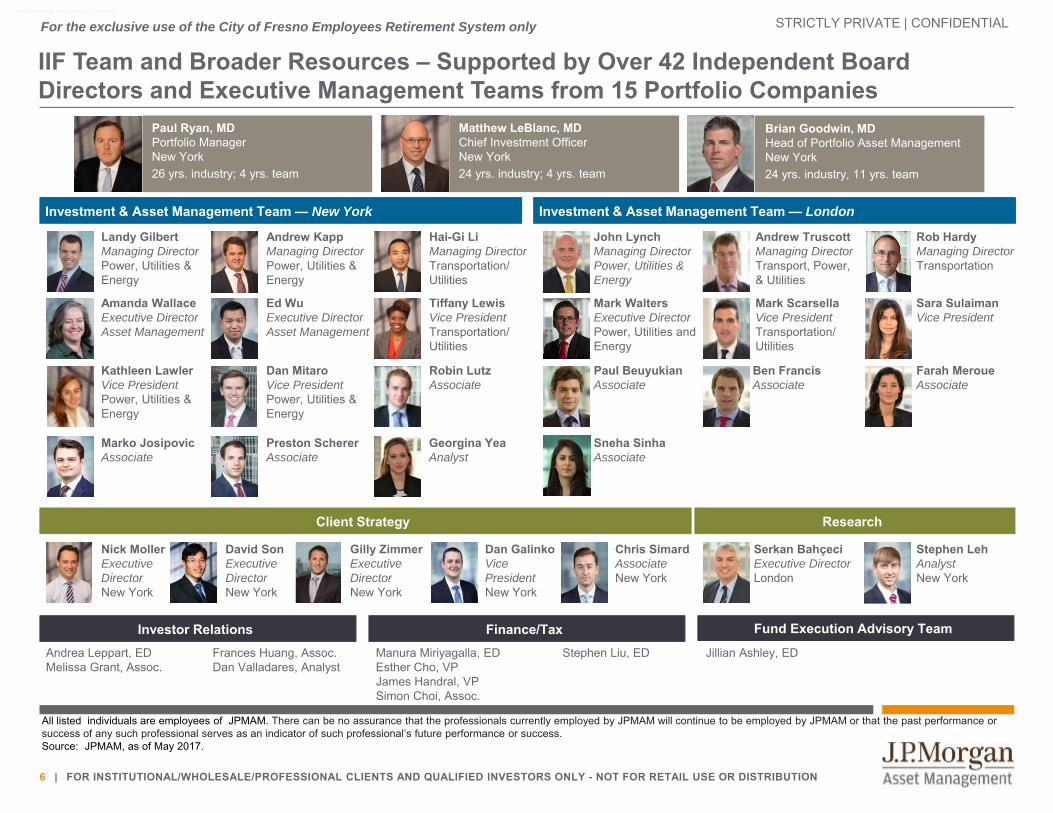
IIF Team and Broader Resources – Supported by Over 42 Independent Board Directors and Executive Management Teams from 15 Portfolio Companies
Investment & Asset Management Team — New York Investment & Asset Management Team — London
Brian Goodwin, MDHead of Portfolio Asset ManagementNew York24 yrs. industry, 11 yrs. team
All listed individuals are employees of JPMAM. There can be no assurance that the professionals currently employed by JPMAM will continue to be employed by JPMAM or that the past performance or success of any such professional serves as an indicator of such professional’s future performance or success. Source: JPMAM, as of May 2017.
Paul Ryan, MDPortfolio ManagerNew York26 yrs. industry; 4 yrs. team
Matthew LeBlanc, MDChief Investment OfficerNew York24 yrs. industry; 4 yrs. team
Landy GilbertManaging DirectorPower, Utilities & Energy
Hai-Gi LiManaging DirectorTransportation/Utilities
Amanda Wallace Executive DirectorAsset Management
Kathleen LawlerVice PresidentPower, Utilities & Energy
Robin LutzAssociate
Andrew KappManaging DirectorPower, Utilities & Energy
Tiffany Lewis Vice PresidentTransportation/Utilities
Ed WuExecutive DirectorAsset Management
Dan MitaroVice PresidentPower, Utilities & Energy
Andrew TruscottManaging DirectorTransport, Power, & Utilities
Mark WaltersExecutive DirectorPower, Utilities and Energy
Ben FrancisAssociate
Georgina YeaAnalyst
Rob HardyManaging DirectorTransportation
Mark ScarsellaVice PresidentTransportation/Utilities
Paul BeuyukianAssociate
Research
Serkan BahçeciExecutive DirectorLondon
Stephen LehAnalystNew York
Client Strategy
David SonExecutive DirectorNew York
Gilly ZimmerExecutive DirectorNew York
Nick MollerExecutive DirectorNew York
Marko JosipovicAssociate
Preston SchererAssociate
Fund Execution Advisory TeamInvestor RelationsJillian Ashley, EDAndrea Leppart, ED
Melissa Grant, Assoc.Frances Huang, Assoc.Dan Valladares, Analyst
Finance/Tax Manura Miriyagalla, EDEsther Cho, VPJames Handral, VPSimon Choi, Assoc.
Stephen Liu, ED
John LynchManaging DirectorPower, Utilities & Energy
Sneha SinhaAssociate
a1ac83c0-84ba-11e6-9c26-005056960c63
Farah MeroueAssociate
Sara SulaimanVice President
Dan GalinkoVice PresidentNew York
Chris SimardAssociateNew York
STRICTLY PRIVATE | CONFIDENTIAL
7 | FOR INSTITUTIONAL/WHOLESALE/PROFESSIONAL CLIENTS AND QUALIFIED INVESTORS ONLY - NOT FOR RETAIL USE OR DISTRIBUTION
For the exclusive use of the City of Fresno Employees Retirement System only
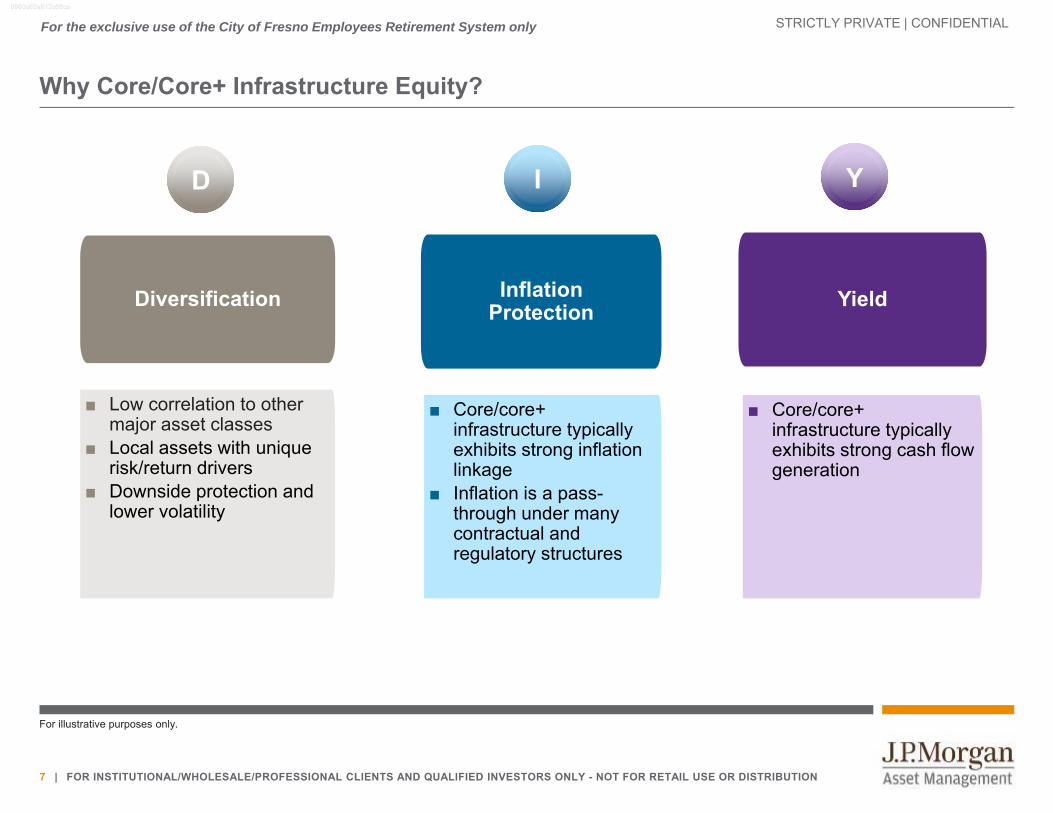
Why Core/Core+ Infrastructure Equity?
YieldInflation Protection
I Y
Diversification
2D
For illustrative purposes only.
■ Low correlation to other major asset classes
■ Local assets with unique risk/return drivers
■ Downside protection and lower volatility
■ Core/core+ infrastructure typically exhibits strong inflation linkage
■ Inflation is a pass-through under many contractual and regulatory structures
■ Core/core+ infrastructure typically exhibits strong cash flow generation

STRICTLY PRIVATE | CONFIDENTIAL
8 | FOR INSTITUTIONAL/WHOLESALE/PROFESSIONAL CLIENTS AND QUALIFIED INVESTORS ONLY - NOT FOR RETAIL USE OR DISTRIBUTION
For the exclusive use of the City of Fresno Employees Retirement System only
Diversification & Inflation Protection Visibility into stable cash flows
Attractive allowed real rates of return
Fair and transparent regulatory frameworks
Direct inflation exposure
Higher Expected Returns & Yield Long-term contracts to mitigate volume risk
Higher expected returns due to GDP exposure
How do we define core infrastructure? Cash yield is criticalWe believe the strongest sign that an asset is core is that the majority of the total return is yield on a long term sustainable basis. This yield underpins the diversification of core infrastructure.
REGULATED ASSETS Water and wastewater
Electricity distribution/transmission
Natural gas distribution
TRANSPORTATION ASSETS Airports
Seaports
Toll Roads
LONG-TERM CONTRACTED ASSETS Conventional generation
Renewable generation
Storage
Midstream
For illustrative purposes only.
Diversification & Yield Long-term contracts with volume minimums
Stable cash flow with yield approximating total return
Diverse demand and counter-party exposure
0903c02a813894a7
STRICTLY PRIVATE | CONFIDENTIAL
9 | FOR INSTITUTIONAL/WHOLESALE/PROFESSIONAL CLIENTS AND QUALIFIED INVESTORS ONLY - NOT FOR RETAIL USE OR DISTRIBUTION
For the exclusive use of the City of Fresno Employees Retirement System only
10.1%
9.2%
7.2%
6.9%
4.0%
7.4%
6.8%
6.7%
3.6%
13.1%
11.1%
4.8%
4.6%3.0%1.5%
0%
10%
20%
30%
40%
50%
60%
70%
80%
90%
100%
Southern Water
Summit Utilities
Electricity Northwest
SouthWestWater
Koole Terminals
Noatum Ports
NQA
Nieuport
Novatus
Sonnedix
Zephyr
SWGenCoastal
Pio Pico
Varma
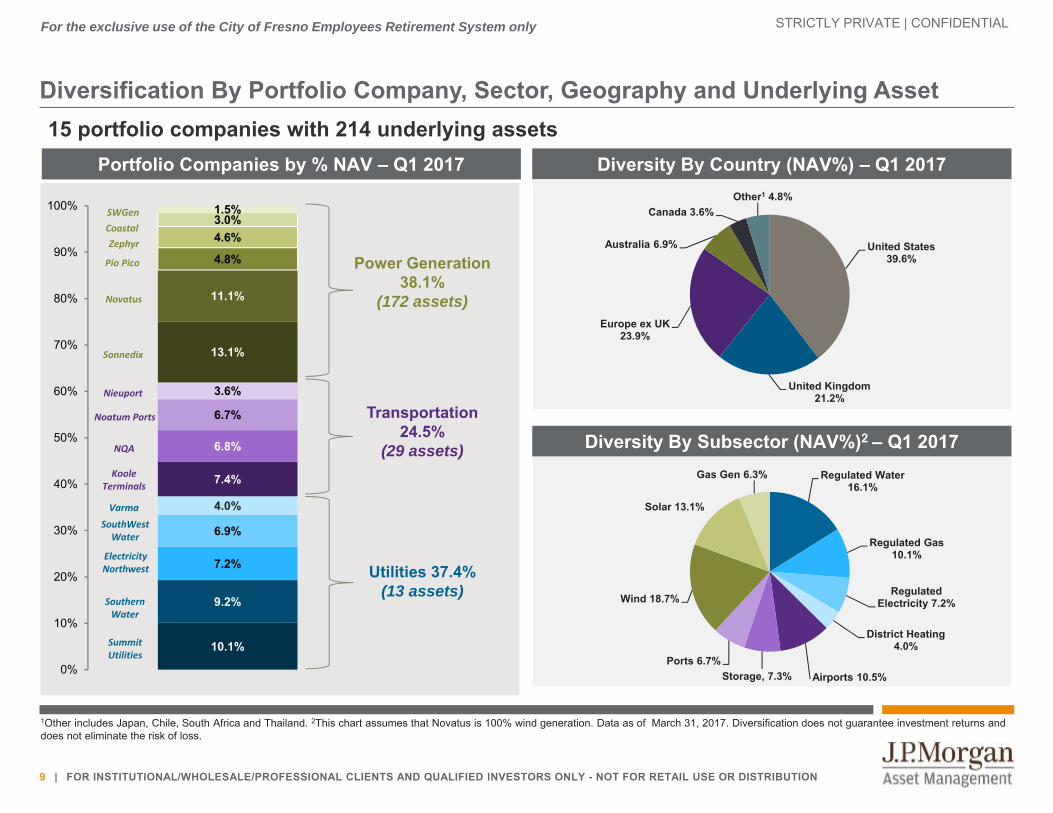
15 portfolio companies with 214 underlying assets
Diversification By Portfolio Company, Sector, Geography and Underlying Asset
Diversity By Country (NAV%) – Q1 2017Diversity By Country (NAV%) – Q1 2017
Utilities 37.4% (13 assets)
Portfolio Companies by % NAV – Q1 2017Portfolio Companies by % NAV – Q1 2017
Transportation 24.5%
(29 assets)
Power Generation 38.1%
(172 assets)
Diversity By Subsector (NAV%)2 – Q1 2017Diversity By Subsector (NAV%)2 – Q1 2017
1Other includes Japan, Chile, South Africa and Thailand. 2This chart assumes that Novatus is 100% wind generation. Data as of March 31, 2017. Diversification does not guarantee investment returns and does not eliminate the risk of loss.
United States 39.6%
United Kingdom 21.2%
Europe ex UK 23.9%
Australia 6.9%
Canada 3.6%Other1 4.8%
Regulated Water 16.1%
Regulated Gas 10.1%
Regulated Electricity 7.2%
District Heating 4.0%
Airports 10.5%Storage, 7.3%Ports 6.7%
Wind 18.7%
Solar 13.1%
Gas Gen 6.3%

STRICTLY PRIVATE | CONFIDENTIAL
10 | FOR INSTITUTIONAL/WHOLESALE/PROFESSIONAL CLIENTS AND QUALIFIED INVESTORS ONLY - NOT FOR RETAIL USE OR DISTRIBUTION
For the exclusive use of the City of Fresno Employees Retirement System only
UTILITIES (37%)1UTILITIES (37%)1
TRANSPORTATION (25%)TRANSPORTATION (25%)
CONTRACTED POWER (38%)CONTRACTED POWER (38%)
Existing portfolio
Assets identified for future potential equity capital deployment. The companies above are shown for illustrative purposes only. Their inclusion should not be interpreted as a recommendation to buy or sell.
SUMMITUTILITIES
Regulated natural gas distribution utilities with operations in Colorado,
Missouri and Maine
SOUTHERN WATER SERVICESRegulated water and
wastewater network in southeast England serving over 7mm
customers
KOOLETERMINALS
European liquid bulk storage company with
c.2m cubic meter capacity focused in
ARA region
NORTH QUEENSLAND AIRPORTS
Cairns and Mckay Airports, serving the Great Barrier Reef and Bowen Basin, one of the largest coal deposits in the world.
SOUTHWEST GENERATION
IPP owning 868 MW of gas fired generation facilities in California,
Colorado, and New Mexico
SONNEDIX POWER
HOLDINGS96.5% interest in global solar developer, owner
and operator
ZEPHYR WIND
Diversified portfolio of 17 contracted
wind farms totaling 391 MW along the
west coast of the U.K.
NOVATUS ENERGY
More than 1200 MW of wind and
solar projects in the US
NOATUM PORTSLeading operator in
the Iberian Peninsula comprised of 18 terminals
in Spain, along with Marmedsa, the largest Iberian port services
group
SOUTHWEST WATER COMPANYRegulated water and wastewater utilities
serving over 350,000 people in California, Texas, Alabama and
South Carolina
ELECTRICITY NORTH WESTRegulated electric
distribution network providing power to
6mm people in northwest England
TORONTO CITY AIRPORT
Located in Toronto, it is Canada’s fastest
growing airport, serving 2.5mm passengers
in 2015
Denotes Platform Investments
PIO PICO
323 MW simple cycle natural gas fired power
Plant in California
1 Data as of March 31, 2017. Diversification does not guarantee investment returns and does not eliminate the risk of loss.
VÄRMEVÄRDEN
Leading District Heating company in Sweden
COASTAL WINDS
North American wind portfolio in Texas,
Oregon and New York totalling 354 MW’s

STRICTLY PRIVATE | CONFIDENTIAL
11 | FOR INSTITUTIONAL/WHOLESALE/PROFESSIONAL CLIENTS AND QUALIFIED INVESTORS ONLY - NOT FOR RETAIL USE OR DISTRIBUTION
HALF IMAGE PLACEMENT HOLDER (VERTICAL)Resize image to cover grey box
For the exclusive use of the City of Fresno Employees Retirement System only
Strategy and Risk: UN Principles for Responsible Investing and ESG QualificationsIIF incorporates core ESG principles throughout its investment and ongoing asset management processes
United Nations Principles for Responsible Investing (UNPRI) signatory1
Global Real Estate Sustainability Benchmark (GRESB) member2 and ranked 4th out of 51 responding funds globally in its inaugural infrastructure assessment
13 out of 14 portfolio companies and the Fund itself participated in inaugural GRESB assessment
National Association of Corporate Directors membership across all board members in IIF
Commonsense Governance Principles signed by J.P. Morgan Chase and JPMAM3
1 JPMAM is the signatory to UNPRI.
2 J.P. Morgan Asset Management is a member of GRESB Infrastructure. 3 Please visit http://www.governanceprinciples.org for more information. Socially Responsible Investments are subject to the risk that because social criteria excludes securities of certain issuers for non-financial reasons, investors may forgo some market opportunities available to those that don’t use these criteria.
a1ac83c0-84ba-11e6-9c26-005056960c63
STRICTLY PRIVATE | CONFIDENTIAL
12 | FOR INSTITUTIONAL/WHOLESALE/PROFESSIONAL CLIENTS AND QUALIFIED INVESTORS ONLY - NOT FOR RETAIL USE OR DISTRIBUTION
For the exclusive use of the City of Fresno Employees Retirement System only
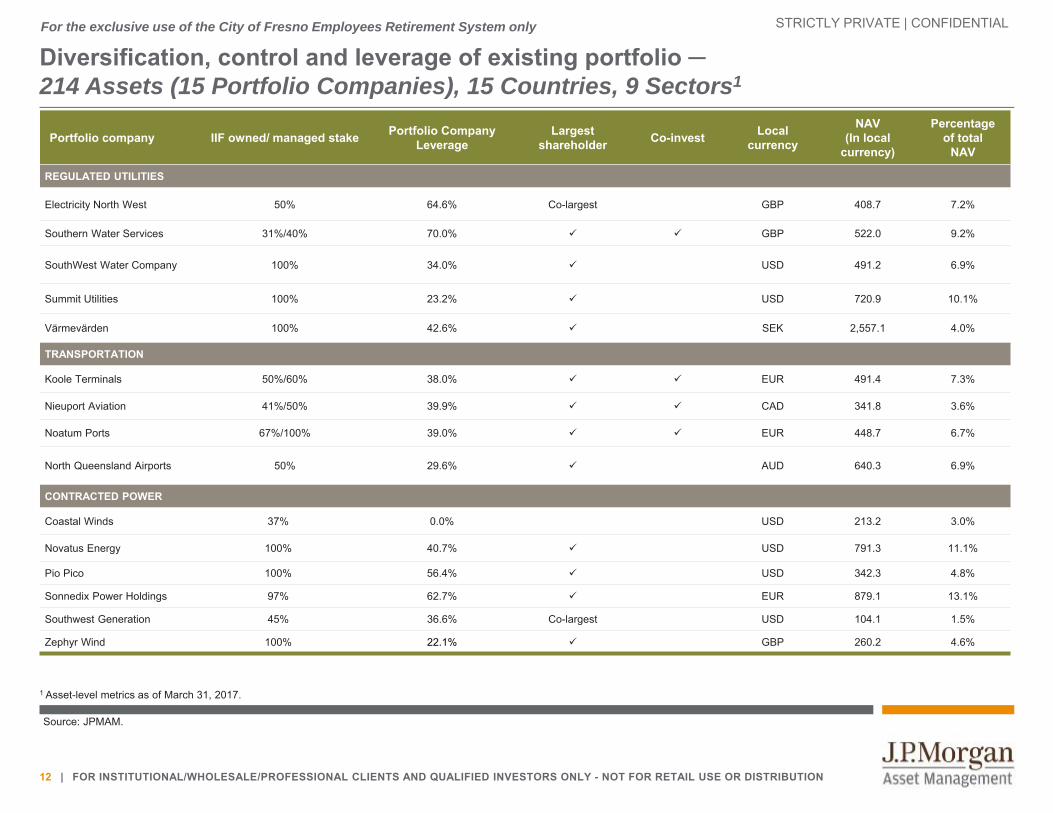
Diversification, control and leverage of existing portfolio ─214 Assets (15 Portfolio Companies), 15 Countries, 9 Sectors1
Portfolio company IIF owned/ managed stake Portfolio CompanyLeverage
Largest shareholder Co-invest Local
currency
NAV(In local
currency)
Percentage of total
NAV
REGULATED UTILITIES
Electricity North West 50% 64.6% Co-largest GBP 408.7 7.2%
Southern Water Services 31%/40% 70.0% GBP 522.0 9.2%
SouthWest Water Company 100% 34.0% USD 491.2 6.9%
Summit Utilities 100% 23.2% USD 720.9 10.1%
Värmevärden 100% 42.6% SEK 2,557.1 4.0%
TRANSPORTATION
Koole Terminals 50%/60% 38.0% EUR 491.4 7.3%
Nieuport Aviation 41%/50% 39.9% CAD 341.8 3.6%
Noatum Ports 67%/100% 39.0% EUR 448.7 6.7%
North Queensland Airports 50% 29.6% AUD 640.3 6.9%
CONTRACTED POWER
Coastal Winds 37% 0.0% USD 213.2 3.0%
Novatus Energy 100% 40.7% USD 791.3 11.1%
Pio Pico 100% 56.4% USD 342.3 4.8%
Sonnedix Power Holdings 97% 62.7% EUR 879.1 13.1%
Southwest Generation 45% 36.6% Co-largest USD 104.1 1.5%
Zephyr Wind 100% 22.1% GBP 260.2 4.6%
1 Asset-level metrics as of March 31, 2017.
Source: JPMAM.
STRICTLY PRIVATE | CONFIDENTIAL
13 | FOR INSTITUTIONAL/WHOLESALE/PROFESSIONAL CLIENTS AND QUALIFIED INVESTORS ONLY - NOT FOR RETAIL USE OR DISTRIBUTION
For the exclusive use of the City of Fresno Employees Retirement System only
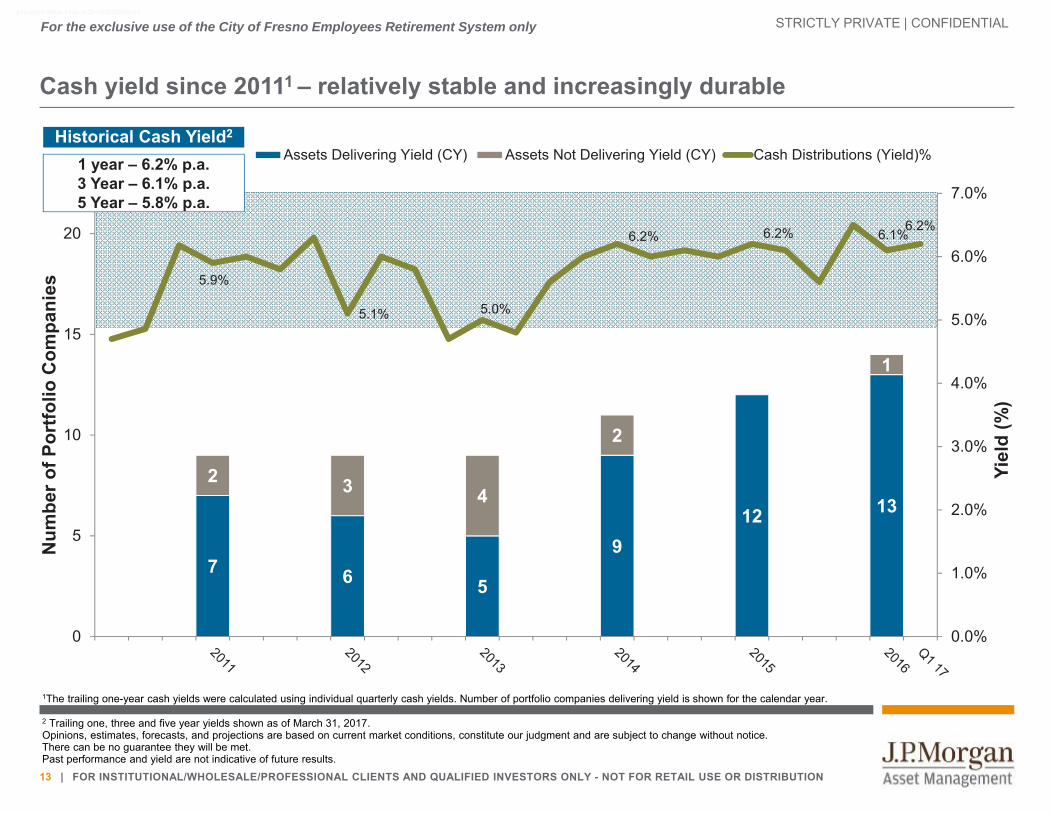
Cash yield since 20111 – relatively stable and increasingly durable
7 6 5
912 13
2 3 4
2
1
5.9%
5.1% 5.0%
6.2% 6.2% 6.1%6.2%
0.0%
1.0%
2.0%
3.0%
4.0%
5.0%
6.0%
7.0%
0
5
10
15
20
Yiel
d (%
)
Num
ber o
f Por
tfolio
Com
pani
es
Assets Delivering Yield (CY) Assets Not Delivering Yield (CY) Cash Distributions (Yield)%
2 Trailing one, three and five year yields shown as of March 31, 2017.Opinions, estimates, forecasts, and projections are based on current market conditions, constitute our judgment and are subject to change without notice. There can be no guarantee they will be met.Past performance and yield are not indicative of future results.
1 year – 6.2% p.a.3 Year – 6.1% p.a.5 Year – 5.8% p.a.
Historical Cash Yield2
1The trailing one-year cash yields were calculated using individual quarterly cash yields. Number of portfolio companies delivering yield is shown for the calendar year.
a1ac83c0-84ba-11e6-9c26-005056960c63

STRICTLY PRIVATE | CONFIDENTIAL
14 | FOR INSTITUTIONAL/WHOLESALE/PROFESSIONAL CLIENTS AND QUALIFIED INVESTORS ONLY - NOT FOR RETAIL USE OR DISTRIBUTION
For the exclusive use of the City of Fresno Employees Retirement System only
IIF outperformed major asset classes with less volatility since inception
EVOLUTION OF $1 INVESTED IN Q2 2007 TO Q1 2017
Global equities, global listed infrastructure, global bonds, and US real estate are measured by MSCI World, S&P Global Infrastructure Index, Barclays Global Agg, and NFI-ODCE, respectively. Sources: Bloomberg, NCREIF, J.P.Morgan Asset Management. All series are based on gross of fees total return indices, and denominated in USD. As of March 31, 2017Past performance is not indicative of future results. Indices do not include fees or operating expenses and are not available for actual investment.
Downside protection during financial crisis consistent with providing diversification
Stable performance post crisis consistent with core/core+ risk profile
Annualized VolatilityGlobal
equitiesGlobal listed infrastructure
IIF(USD)
IIF(local)
Since inception 17.7% 17.4% 9.3% 5.2%5-year 8.5% 9.4% 5.0% 1.5%
$0.5
$1.0
$1.5
$2.0
Jun‐07 Jun‐08 Jun‐09 Jun‐10 Jun‐11 Jun‐12 Jun‐13 Jun‐14 Jun‐15 Jun‐16
IIF in local currency IIF in USD Global equities Listed infrastructure Global bonds US private real estate
STRICTLY PRIVATE | CONFIDENTIAL
15 | FOR INSTITUTIONAL/WHOLESALE/PROFESSIONAL CLIENTS AND QUALIFIED INVESTORS ONLY - NOT FOR RETAIL USE OR DISTRIBUTION
For the exclusive use of the City of Fresno Employees Retirement System only
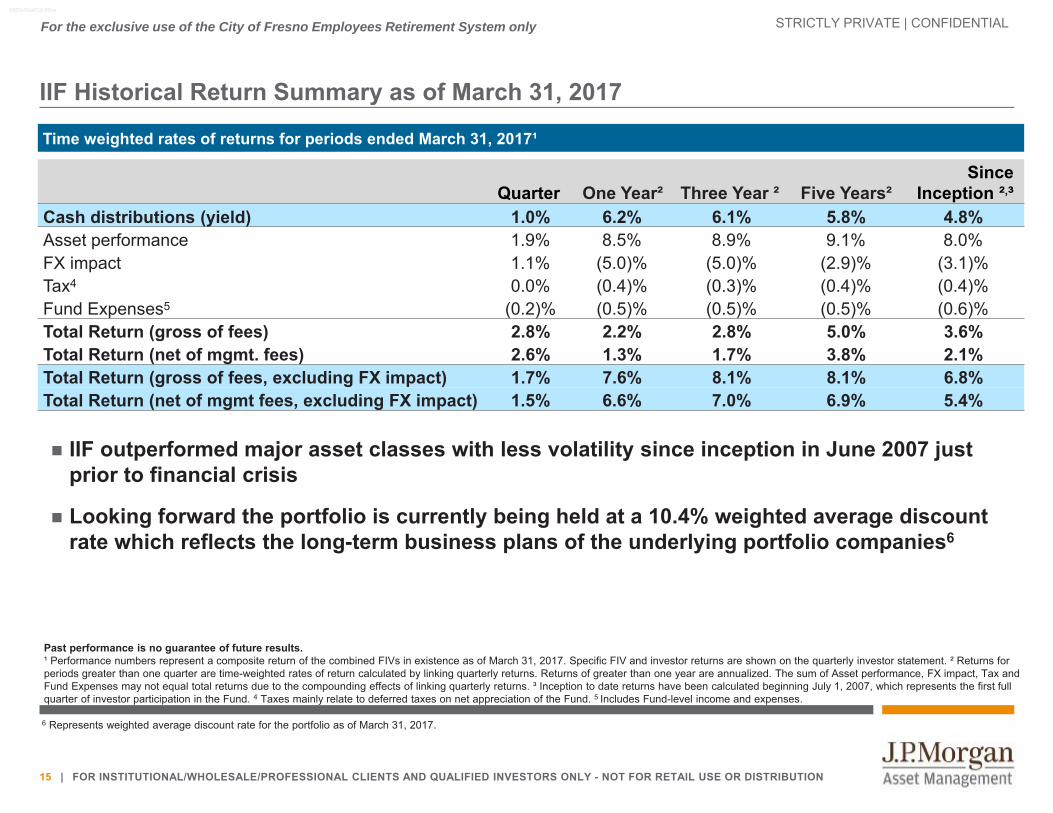
IIF Historical Return Summary as of March 31, 2017
Quarter One Year² Three Year ² Five Years²Since
Inception ²,³Cash distributions (yield) 1.0% 6.2% 6.1% 5.8% 4.8%Asset performance 1.9% 8.5% 8.9% 9.1% 8.0%FX impact 1.1% (5.0)% (5.0)% (2.9)% (3.1)%Tax4 0.0% (0.4)% (0.3)% (0.4)% (0.4)%Fund Expenses5 (0.2)% (0.5)% (0.5)% (0.5)% (0.6)%Total Return (gross of fees) 2.8% 2.2% 2.8% 5.0% 3.6%Total Return (net of mgmt. fees) 2.6% 1.3% 1.7% 3.8% 2.1%Total Return (gross of fees, excluding FX impact) 1.7% 7.6% 8.1% 8.1% 6.8%Total Return (net of mgmt fees, excluding FX impact) 1.5% 6.6% 7.0% 6.9% 5.4%
Past performance is no guarantee of future results.¹ Performance numbers represent a composite return of the combined FIVs in existence as of March 31, 2017. Specific FIV and investor returns are shown on the quarterly investor statement. ² Returns for periods greater than one quarter are time-weighted rates of return calculated by linking quarterly returns. Returns of greater than one year are annualized. The sum of Asset performance, FX impact, Tax and Fund Expenses may not equal total returns due to the compounding effects of linking quarterly returns. ³ Inception to date returns have been calculated beginning July 1, 2007, which represents the first full quarter of investor participation in the Fund. 4 Taxes mainly relate to deferred taxes on net appreciation of the Fund. 5 Includes Fund-level income and expenses.
0903c02a812c56ca
Time weighted rates of returns for periods ended March 31, 2017¹
IIF outperformed major asset classes with less volatility since inception in June 2007 just prior to financial crisis
Looking forward the portfolio is currently being held at a 10.4% weighted average discount rate which reflects the long-term business plans of the underlying portfolio companies6
6 Represents weighted average discount rate for the portfolio as of March 31, 2017.
STRICTLY PRIVATE | CONFIDENTIAL
16 | FOR INSTITUTIONAL/WHOLESALE/PROFESSIONAL CLIENTS AND QUALIFIED INVESTORS ONLY - NOT FOR RETAIL USE OR DISTRIBUTION
For the exclusive use of the City of Fresno Employees Retirement System only
0
1,000
2,000
3,000
4,000
5,000
6,000
0
1,000
2,000
3,000
4,000
5,000
6,000
KEY:
Privately Negotiated
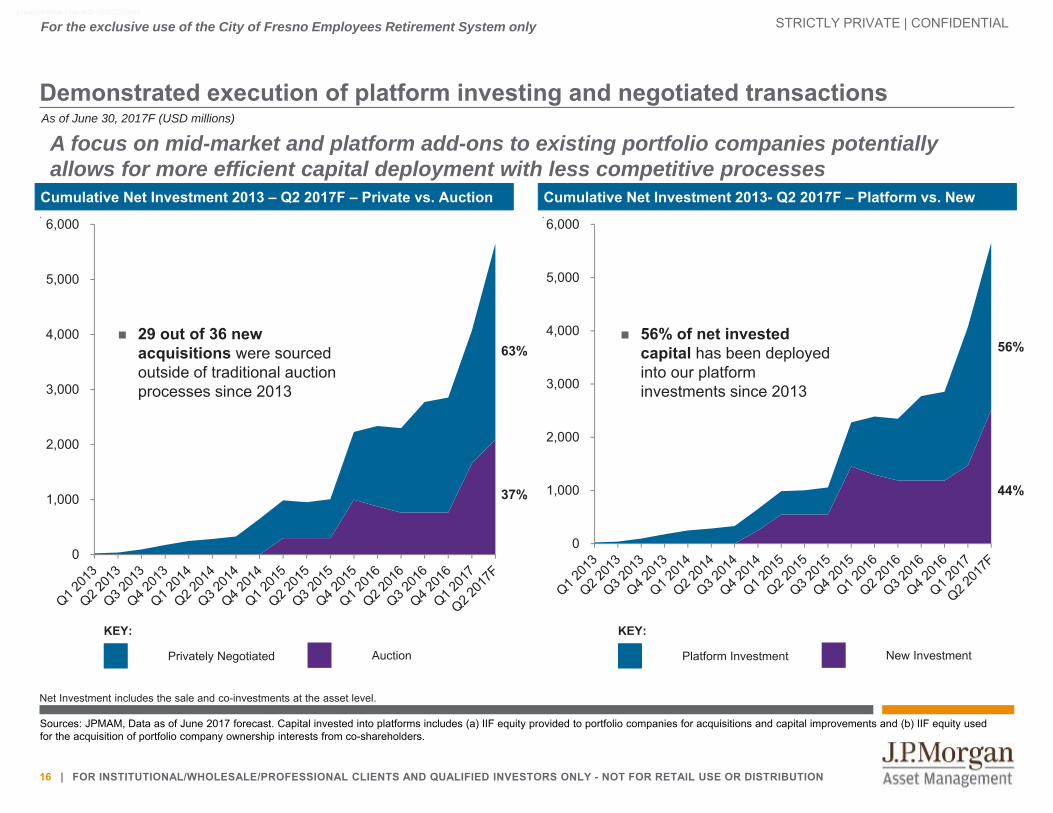
Demonstrated execution of platform investing and negotiated transactions
Auction
As of June 30, 2017F (USD millions)
Cumulative Net Investment 2013 – Q2 2017F – Private vs. Auction
KEY:
Platform Investment New Investment
Cumulative Net Investment 2013- Q2 2017F – Platform vs. New
63%
37% 44%
56%
Sources: JPMAM, Data as of June 2017 forecast. Capital invested into platforms includes (a) IIF equity provided to portfolio companies for acquisitions and capital improvements and (b) IIF equity used for the acquisition of portfolio company ownership interests from co-shareholders.
Net Investment includes the sale and co-investments at the asset level.
a1ac83c0-84ba-11e6-9c26-005056960c63
29 out of 36 new acquisitions were sourced outside of traditional auction processes since 2013
56% of net invested capital has been deployed into our platform investments since 2013
A focus on mid-market and platform add-ons to existing portfolio companies potentially allows for more efficient capital deployment with less competitive processes

STRICTLY PRIVATE | CONFIDENTIAL
17 | FOR INSTITUTIONAL/WHOLESALE/PROFESSIONAL CLIENTS AND QUALIFIED INVESTORS ONLY - NOT FOR RETAIL USE OR DISTRIBUTION
For the exclusive use of the City of Fresno Employees Retirement System only
Recent Investment Activity – 2017 Closed and Announced TransactionsTransportation
There can be no guarantee that the expected sales listed above will be concluded within the specified time line. These opportunities do not represent the Fund's investmentsand should not be used to predict the Fund's return, liquidity, revenue or credibility. The Fund's performance may be volatile. The Fund is subject to various other risk factorsand conflicts of interest.
These examples represent some of the investments of the Fund. However, you should not assume that these types of investments will be available to or, if available, will be selected for investment by the Fund in the future.
Contracted PowerInfinis
409 MW of wind generating capacity Diversified across 20 sites in the
UK 20-year PPA’s under management
with an average remaining life of 9 years
NovatusOver 1,500 MW of wind & solar in the US Closed the acquisition of 120MWac
solar project located in Colorado Operating under 25-year PPA and
expected to close in Q2 2017
Pio Pico323 MW natural gas fired power Plant in California 323 MW simple cycle gas facility
completed in 2016 located in Southern California
Operating under a 25-year PPA
SonnedixGlobal solar developer, owner and operator – Over 500 MW in 9 countries Entered into or closed on
transactions to acquire 52 solar PV projects across Spain, Japan and Italy with capacity of 314 MW
Utilities
SouthWest WaterRegulated water/wastewater company serving ~357,000 customers in 4 states Pending acquisition of four
regulated water and unregulated wastewater utilities in Oregon
VärmevärdenLeading District Heating company in Sweden Acquired new platform company
operating in a monopolistic position and supportive regulator and political environment
Platform for further consolidation
Summit UtilitiesRegulated natural gas distribution utilities in 5 U.S. states Closed the acquisition of Arkansas
Oklahoma Gas Corporation, which serves nearly 60,000 customers in Arkansas & Oklahoma
Beacon RailPan-European rail leasing company Strong presence in UK and
Continental Europe Passenger and Freight businesses
Diversification through operations in 15 countries and customer base of 28 lessees
NaturgasGas distribution company servicing Northern Spain Represents a unique opportunity to
carve out a mature business of scale in a bilateral negotiation with a major utility
Signed; pending close
Capital called in 2017 YTD of ~ USD 1.4 bn with USD 2.3 bn of
closed and pending transactions
STRICTLY PRIVATE | CONFIDENTIAL
18 | FOR INSTITUTIONAL/WHOLESALE/PROFESSIONAL CLIENTS AND QUALIFIED INVESTORS ONLY - NOT FOR RETAIL USE OR DISTRIBUTION
For the exclusive use of the City of Fresno Employees Retirement System only
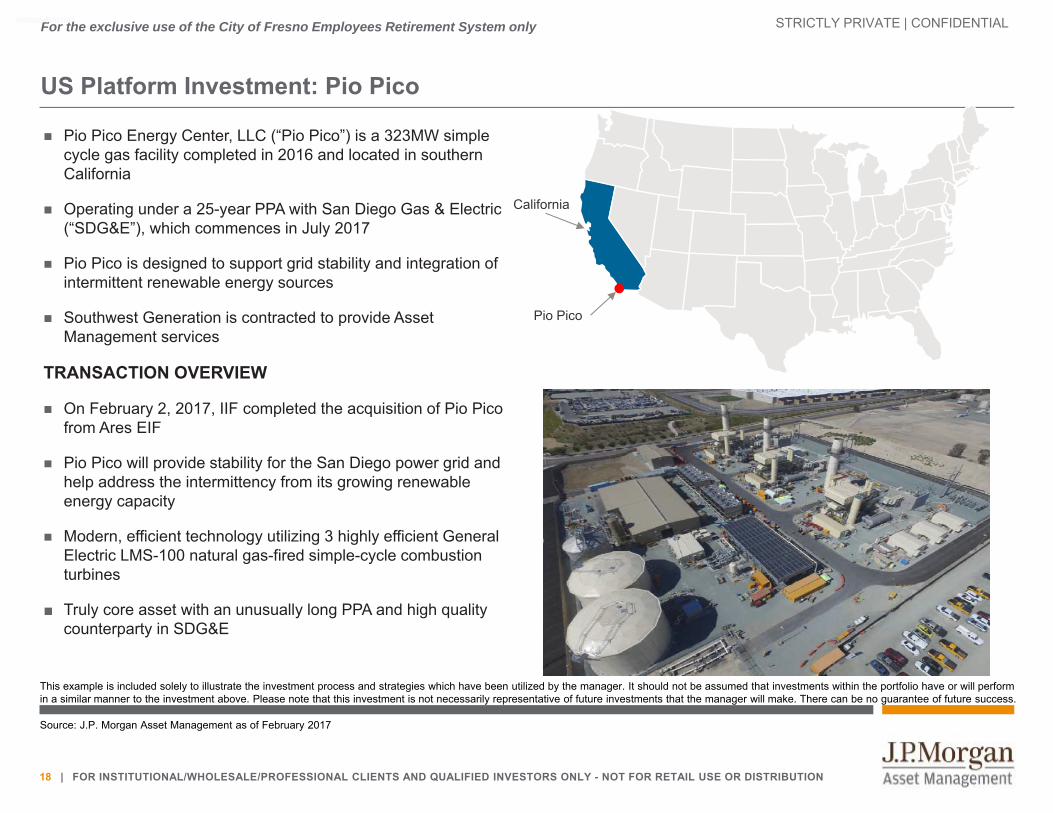
US Platform Investment: Pio Pico
Pio Pico Energy Center, LLC (“Pio Pico”) is a 323MW simple cycle gas facility completed in 2016 and located in southern California
Operating under a 25-year PPA with San Diego Gas & Electric (“SDG&E”), which commences in July 2017
Pio Pico is designed to support grid stability and integration of intermittent renewable energy sources
Southwest Generation is contracted to provide Asset Management services
TRANSACTION OVERVIEW
On February 2, 2017, IIF completed the acquisition of Pio Pico from Ares EIF
Pio Pico will provide stability for the San Diego power grid and help address the intermittency from its growing renewable energy capacity
Modern, efficient technology utilizing 3 highly efficient General Electric LMS-100 natural gas-fired simple-cycle combustion turbines
■ Truly core asset with an unusually long PPA and high quality counterparty in SDG&E
Source: J.P. Morgan Asset Management as of February 2017
0903c02a81027c87
This example is included solely to illustrate the investment process and strategies which have been utilized by the manager. It should not be assumed that investments within the portfolio have or will perform in a similar manner to the investment above. Please note that this investment is not necessarily representative of future investments that the manager will make. There can be no guarantee of future success.
California
Pio Pico

STRICTLY PRIVATE | CONFIDENTIAL
19 | FOR INSTITUTIONAL/WHOLESALE/PROFESSIONAL CLIENTS AND QUALIFIED INVESTORS ONLY - NOT FOR RETAIL USE OR DISTRIBUTION
For the exclusive use of the City of Fresno Employees Retirement System only
Summary terms and conditionsFund Infrastructure Investments Fund – Incepted July 1, 2007. Open-ended indefinite term
Currency Denominated in USD; the Fund does not hedge currencyStrategy Focus on core and core-plus infrastructure assets in developed marketsTarget Return1 IIF targets a net return of 8-12% over a medium-term investment horizon of five to seven years, excluding
foreign currency1
Target Cash Yield Target cash distribution (yield) is 5-7% over the next few years1
Distributions Quarterly — Paid out or reinvested at investors’ preferenceManagement Fee (4-Year Soft Lock)
The Management Fee commences when capital is drawn and Units issued. The Fee Rate is based initially on aggregate Commitment until fully drawn, and thereafter on NAV <USD 100mm – 1.00% USD 100mm to USD <300mm – 0.90% USD 300mm and above – 0.80%
Incentive Fee Hurdle Return: 7% (with no catch-up)2
Incentive Fee: 15% Cap: 13.5% net of fees and expenses
Hold Back: Yes Incentive Period: 3 years Sharing: 50% J.P. Morgan/50% Investment Team
Repurchases/ Redemptions*
Repurchase requests can be submitted semi-annually Over USD 1.2 bn in redemption requests paid out since inception
Tax 12 Fund investor vehicles (“FIVs”) designed to address certain financial, tax or regulatory needs of prospective investors
Reporting Snapshot: ~30 days after quarter end Client Statement: ~37 days after quarter end Quarterly Report: ~60 days after quarter end Annual Report: ~90 days after quarter end
1The target returns and yield are for illustrative purposes only and are subject to significant limitations. An investor should not expect to achieve actual returns similar to the target returns shown above. See full Target Return Disclosure for more details.2 7% hurdle excludes the impact of currency.
Note: The above summary terms are qualified in entirety by the Memorandum. Prospective investors should carefully consider the summary in conjunction with relevant sections of the Memorandum and should consult with their own financial, legal and tax advisors with respect thereto.*Repurchase Requests made prior to the fourth anniversary of the final drawdown of an Investor’s Commitment shall be subject to a 4% repurchase discount.
0903c02a812c56ca

STRICTLY PRIVATE | CONFIDENTIAL
20 | FOR INSTITUTIONAL/WHOLESALE/PROFESSIONAL CLIENTS AND QUALIFIED INVESTORS ONLY - NOT FOR RETAIL USE OR DISTRIBUTION
For the exclusive use of the City of Fresno Employees Retirement System only
Why IIF?
■ Open-ended structure consistent with long lived asset investment profile■ No J-curve for investors■ Highly diversified portfolio – 214 assets (15 portfolio companies)
Open-Ended Structure
■ Active asset management through control positions■ Use of non-executive directors on portfolio company boards■ ESG focus inherent in many assets (e.g. governance)
Control
■ 5-7% year-end cash yield range consistently since 2011■ Yield of 6.2% for last 12 months1Stable Cash Yield
■ Material portion of new capital expected to be deployed through existing portfolio companies
Differentiated Strategy: Platform & Mid-Market
Investing
■ Access to the resources of JPMAMJ.P. Morgan
21
22
23
24
25
7
26
■ Extensive and diverse infrastructure experienceExperienced Team
Short Queue■ Currently estimated investment queue of 3 months or less■ Weighted-average queue of approximately 2 months for capital committed in
20162
1 As of March 31, 2017. The Investment Advisor seeks to achieve the stated objectives. There can be no guarantee the objectives will be met. 2 Based on date of capital called versus commitment date in 2016.
STRICTLY PRIVATE | CONFIDENTIAL
21 | FOR INSTITUTIONAL/WHOLESALE/PROFESSIONAL CLIENTS AND QUALIFIED INVESTORS ONLY - NOT FOR RETAIL USE OR DISTRIBUTION
For the exclusive use of the City of Fresno Employees Retirement System only
Currency Hedging
0903c02a812c56ca

STRICTLY PRIVATE | CONFIDENTIAL
22 | FOR INSTITUTIONAL/WHOLESALE/PROFESSIONAL CLIENTS AND QUALIFIED INVESTORS ONLY - NOT FOR RETAIL USE OR DISTRIBUTION
For the exclusive use of the City of Fresno Employees Retirement System only
We do not hedge within the fund, however, hedging outside the fund is availableDue to the anticipated mean reversion of currency rates in a diversified portfolio, the potential costs, and our global investor base, IIF does not hedge currency
Source: Bloomberg, JPMAM. Data as of June 30, 2017. *Data for 2017 is year-to-date.
A hypothetical portfolio consisting of 40% USD, 20% GBP, 20% EUR, 10% AUD, and 10% CAD would have experienced the following currency impacts on a 1-year and 5-year basis in USD terms.
‐15%
‐10%
‐5%
0%
5%
10%
15%
One‐Year Currency Impact
‐15%
‐10%
‐5%
0%
5%
10%
15%
1983‐1987 1988‐1992 1993‐1997 1998‐2002 2003‐2007 2008‐2012 2013‐2017*
Annualized Five‐Year Currency Impact
Recent appreciation of USD, has begun to turn in 2017 YTD
The annualized currency impact diminishes as longer time frames are considered
STRICTLY PRIVATE | CONFIDENTIAL
23 | FOR INSTITUTIONAL/WHOLESALE/PROFESSIONAL CLIENTS AND QUALIFIED INVESTORS ONLY - NOT FOR RETAIL USE OR DISTRIBUTION
For the exclusive use of the City of Fresno Employees Retirement System only
Currency hedging for IIF clients - overview
Source: J.P. Morgan Asset Management.
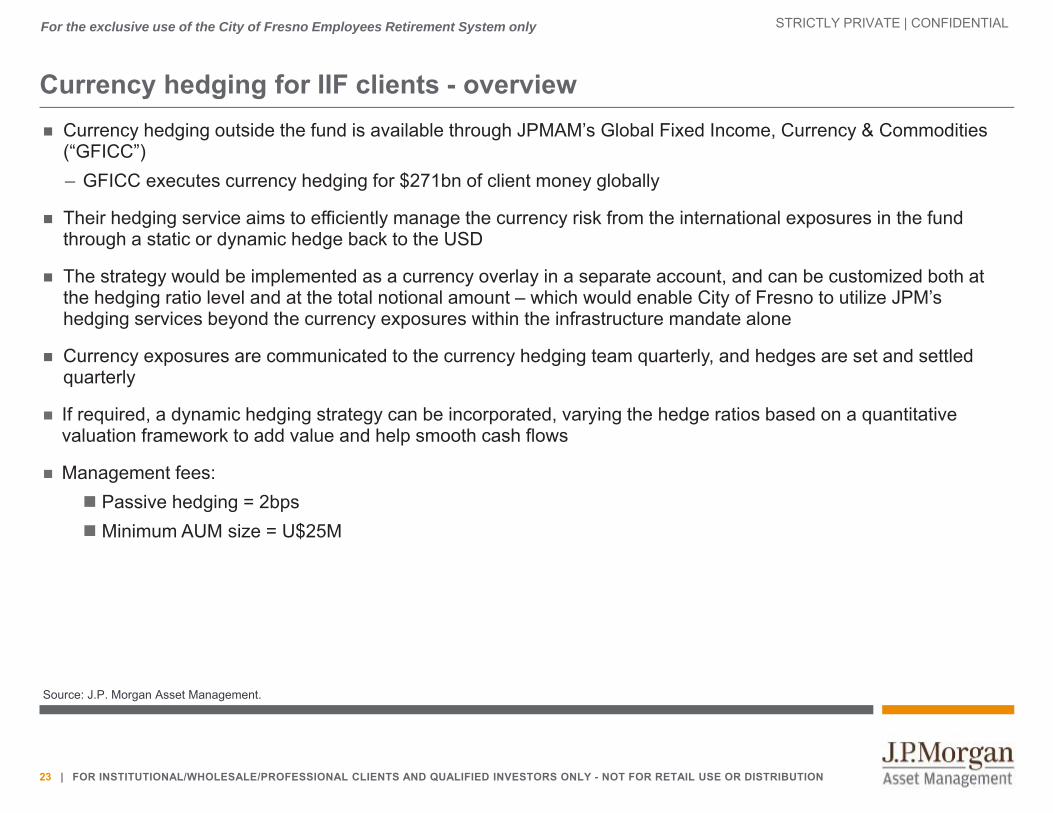
Currency hedging outside the fund is available through JPMAM’s Global Fixed Income, Currency & Commodities (“GFICC”)– GFICC executes currency hedging for $271bn of client money globally
Their hedging service aims to efficiently manage the currency risk from the international exposures in the fund through a static or dynamic hedge back to the USD
The strategy would be implemented as a currency overlay in a separate account, and can be customized both at the hedging ratio level and at the total notional amount – which would enable City of Fresno to utilize JPM’s hedging services beyond the currency exposures within the infrastructure mandate alone
Currency exposures are communicated to the currency hedging team quarterly, and hedges are set and settled quarterly
If required, a dynamic hedging strategy can be incorporated, varying the hedge ratios based on a quantitative valuation framework to add value and help smooth cash flows
Management fees: Passive hedging = 2bps Minimum AUM size = U$25M

STRICTLY PRIVATE | CONFIDENTIAL
24 | FOR INSTITUTIONAL/WHOLESALE/PROFESSIONAL CLIENTS AND QUALIFIED INVESTORS ONLY - NOT FOR RETAIL USE OR DISTRIBUTION
For the exclusive use of the City of Fresno Employees Retirement System only
IIF Portfolio currency mix since inception
As at March 31, 2017 based on the underlying currencies in the portfolio.
GBP
USD
EURCAD
AUD
GBP
GBP
USD
EUR
CADAUD
GBP
USD
EURCAD
AUDSEK
0%
10%
20%
30%
40%
50%
60%
70%
80%
90%
100%

STRICTLY PRIVATE | CONFIDENTIAL
25 | FOR INSTITUTIONAL/WHOLESALE/PROFESSIONAL CLIENTS AND QUALIFIED INVESTORS ONLY - NOT FOR RETAIL USE OR DISTRIBUTION
For the exclusive use of the City of Fresno Employees Retirement System only
Summary of key GFICC currency strategies
Source: J.P. Morgan Asset Management.The manager seeks to achieve the stated objectives. There can be no guarantee the objectives will be met.
Passive Currency Hedging Dynamic ‘Intelligent’ Currency Hedging Active ‘Alpha’ Currency Overlay
Risk Control Risk Control and Value Added Multi-factor Excess Returns
Objective Reduce currency volatility from FX movements in the underlying assets
Reduce currency volatility from FX movements in the underlying assets
Add longer-term value relative to the strategic currency benchmark
Produce positive absolute returns via investing in currency markets
Add longer-term value relative to the strategic currency benchmark
Strategy Establish optimal strategic hedge ratio (static) and currency benchmark
Implement currency forward hedges to minimise tracking error, control transactions costs and efficiently manage cash flows
Establish optimal strategic hedge ratio and currency benchmark
Utilise a proprietary quantitative framework to assess whether a foreign currency is cheap or expensive relative to the base currency and supported by its economic cycle
Reflect significant mis-valuation and economic momentum signals by systematically increasing or decreasing the strategic currency hedge on a bi-lateral basis
Utilise a proprietary multi-factor economic assessment of the foreign currencies relative to each other
Increase exposure to currencies assessed as likely to outperform vs decrease exposure to currencies likely to underperform
Strategy returns are not correlated with typical market drivers (e.g. risk sentiment, bond yields)
Can be combined with management of strategic hedge ratio
Benefits Low cost and effective A medium-term quantitative approach to currency hedging that is low turnover and value added
Positive absolute returns that can enhance overall portfolio performance and provide a diversifying source of alpha
Expected performance
Minimise T.E. Annual return = 75bps, T.E. = 1.5-2.0% Annual return = 125bps, T.E. = 2.0-2.5%

STRICTLY PRIVATE | CONFIDENTIAL
26 | FOR INSTITUTIONAL/WHOLESALE/PROFESSIONAL CLIENTS AND QUALIFIED INVESTORS ONLY - NOT FOR RETAIL USE OR DISTRIBUTION
For the exclusive use of the City of Fresno Employees Retirement System only
Appendix
0903c02a812c56ca

STRICTLY PRIVATE | CONFIDENTIAL
27 | FOR INSTITUTIONAL/WHOLESALE/PROFESSIONAL CLIENTS AND QUALIFIED INVESTORS ONLY - NOT FOR RETAIL USE OR DISTRIBUTION
For the exclusive use of the City of Fresno Employees Retirement System only
0%
10%
20%
30%
40%
50%
60%
Transportation Regulated Utilities Contracted PowerAssets
Target Range Current Allocation
0%
10%
20%
30%
40%
50%
60%
North America Western Europe Other
Target Range Current Allocation
Fund diversification guidelines
Guidelines As a % of Fund NAV1Sector/Geographic Guidelines and Current Allocation1
1Based on net asset values as of March 31, 2017. The diversification targets have been established by JPMAM based on its assumptions and calculations using data available to it and in light of current market conditions and available investment opportunities.
2Western Europe denotes EU-15, members of the European Union before 2004: Austria, Belgium, Denmark, Finland, France, Germany, Greece, Ireland, Italy, Luxembourg, Netherlands, Portugal, Spain, Sweden and United Kingdom. 3Other includes Australia, Japan, Chile, South Africa and Thailand. 4Represents the aggregate asset level leverage.
25%
37%
38%
43%
45%
12%
2 3
No more than 20% in a Single Investment 11.1%
40-60% in North America 43.2%
30-50% in Western Europe 45.1%
10-30% in other OECD Countries 11.7%
No more than 25% in Canada 3.6%
No more than 25% in Australia and Asia 11.7%
No more than 30% invested in power generation 38.1%
The Fund intends for the consolidated leverage on average to not exceed 75% of the Fund’s GAV4
58%
STRICTLY PRIVATE | CONFIDENTIAL
28 | FOR INSTITUTIONAL/WHOLESALE/PROFESSIONAL CLIENTS AND QUALIFIED INVESTORS ONLY - NOT FOR RETAIL USE OR DISTRIBUTION
For the exclusive use of the City of Fresno Employees Retirement System only
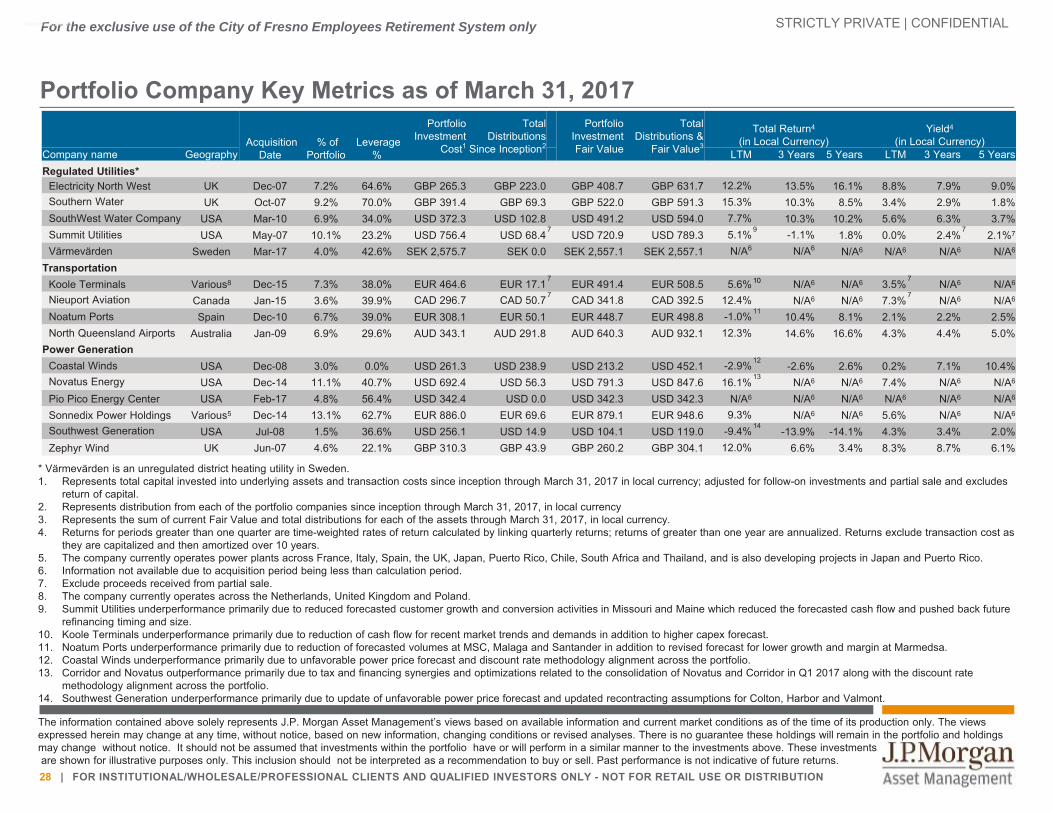
Portfolio Company Key Metrics as of March 31, 2017
* Värmevärden is an unregulated district heating utility in Sweden.1. Represents total capital invested into underlying assets and transaction costs since inception through March 31, 2017 in local currency; adjusted for follow-on investments and partial sale and excludes
return of capital.2. Represents distribution from each of the portfolio companies since inception through March 31, 2017, in local currency 3. Represents the sum of current Fair Value and total distributions for each of the assets through March 31, 2017, in local currency.4. Returns for periods greater than one quarter are time-weighted rates of return calculated by linking quarterly returns; returns of greater than one year are annualized. Returns exclude transaction cost as
they are capitalized and then amortized over 10 years.5. The company currently operates power plants across France, Italy, Spain, the UK, Japan, Puerto Rico, Chile, South Africa and Thailand, and is also developing projects in Japan and Puerto Rico.6. Information not available due to acquisition period being less than calculation period.7. Exclude proceeds received from partial sale. 8. The company currently operates across the Netherlands, United Kingdom and Poland.9. Summit Utilities underperformance primarily due to reduced forecasted customer growth and conversion activities in Missouri and Maine which reduced the forecasted cash flow and pushed back future
refinancing timing and size.10. Koole Terminals underperformance primarily due to reduction of cash flow for recent market trends and demands in addition to higher capex forecast.11. Noatum Ports underperformance primarily due to reduction of forecasted volumes at MSC, Malaga and Santander in addition to revised forecast for lower growth and margin at Marmedsa.12. Coastal Winds underperformance primarily due to unfavorable power price forecast and discount rate methodology alignment across the portfolio.13. Corridor and Novatus outperformance primarily due to tax and financing synergies and optimizations related to the consolidation of Novatus and Corridor in Q1 2017 along with the discount rate
methodology alignment across the portfolio.14. Southwest Generation underperformance primarily due to update of unfavorable power price forecast and updated recontracting assumptions for Colton, Harbor and Valmont.
The information contained above solely represents J.P. Morgan Asset Management’s views based on available information and current market conditions as of the time of its production only. The views expressed herein may change at any time, without notice, based on new information, changing conditions or revised analyses. There is no guarantee these holdings will remain in the portfolio and holdings may change without notice. It should not be assumed that investments within the portfolio have or will perform in a similar manner to the investments above. These investmentsare shown for illustrative purposes only. This inclusion should not be interpreted as a recommendation to buy or sell. Past performance is not indicative of future returns.
0903c02a812f6b3a
Acquisition Date
% of Portfolio
Leverage %
Portfolio Investment
Cost1
Total Distributions
Since Inception2
Portfolio Investment Fair Value
Total Distributions &
Fair Value3
Total Return4
(in Local Currency)Yield4
(in Local Currency)Company name Geography LTM 3 Years 5 Years LTM 3 Years 5 YearsRegulated Utilities*
Electricity North West UK Dec-07 7.2% 64.6% GBP 265.3 GBP 223.0 GBP 408.7 GBP 631.7 12.2% 13.5% 16.1% 8.8% 7.9% 9.0%Southern Water UK Oct-07 9.2% 70.0% GBP 391.4 GBP 69.3 GBP 522.0 GBP 591.3 15.3% 10.3% 8.5% 3.4% 2.9% 1.8%SouthWest Water Company USA Mar-10 6.9% 34.0% USD 372.3 USD 102.8 USD 491.2 USD 594.0 7.7% 10.3% 10.2% 5.6% 6.3% 3.7%Summit Utilities USA May-07 10.1% 23.2% USD 756.4 USD 68.4
7USD 720.9 USD 789.3 5.1%9 -1.1% 1.8% 0.0% 2.4%
72.1%7
Värmevärden Sweden Mar-17 4.0% 42.6% SEK 2,575.7 SEK 0.0 SEK 2,557.1 SEK 2,557.1 N/A6 N/A6 N/A6 N/A6 N/A6 N/A6
TransportationKoole Terminals Various8 Dec-15 7.3% 38.0% EUR 464.6 EUR 17.1
7EUR 491.4 EUR 508.5 5.6%10 N/A6 N/A6 3.5%
7N/A6 N/A6
Nieuport Aviation Canada Jan-15 3.6% 39.9% CAD 296.7 CAD 50.77 CAD 341.8 CAD 392.5 12.4% N/A6 N/A6 7.3%7
N/A6 N/A6
Noatum Ports Spain Dec-10 6.7% 39.0% EUR 308.1 EUR 50.1 EUR 448.7 EUR 498.8 -1.0%1110.4% 8.1% 2.1% 2.2% 2.5%
North Queensland Airports Australia Jan-09 6.9% 29.6% AUD 343.1 AUD 291.8 AUD 640.3 AUD 932.1 12.3% 14.6% 16.6% 4.3% 4.4% 5.0%Power Generation
Coastal Winds USA Dec-08 3.0% 0.0% USD 261.3 USD 238.9 USD 213.2 USD 452.1 -2.9%12-2.6% 2.6% 0.2% 7.1% 10.4%
Novatus Energy USA Dec-14 11.1% 40.7% USD 692.4 USD 56.3 USD 791.3 USD 847.6 16.1%13
N/A6 N/A6 7.4% N/A6 N/A6
Pio Pico Energy Center USA Feb-17 4.8% 56.4% USD 342.4 USD 0.0 USD 342.3 USD 342.3 N/A6 N/A6 N/A6 N/A6 N/A6 N/A6
Sonnedix Power Holdings Various5 Dec-14 13.1% 62.7% EUR 886.0 EUR 69.6 EUR 879.1 EUR 948.6 9.3% N/A6 N/A6 5.6% N/A6 N/A6
Southwest Generation USA Jul-08 1.5% 36.6% USD 256.1 USD 14.9 USD 104.1 USD 119.0 -9.4%14-13.9% -14.1% 4.3% 3.4% 2.0%
Zephyr Wind UK Jun-07 4.6% 22.1% GBP 310.3 GBP 43.9 GBP 260.2 GBP 304.1 12.0% 6.6% 3.4% 8.3% 8.7% 6.1%

STRICTLY PRIVATE | CONFIDENTIAL
29 | FOR INSTITUTIONAL/WHOLESALE/PROFESSIONAL CLIENTS AND QUALIFIED INVESTORS ONLY - NOT FOR RETAIL USE OR DISTRIBUTION
For the exclusive use of the City of Fresno Employees Retirement System only
Comprehensive and transparent quarterly valuation processA systematic process which requires input, evaluation, and sign-off by 5 internal and 2 external parties
1Staggered throughout the year. The information above is given for illustrative purposes. It is considered to be accurate at the time of writing, but no warranty of accuracy is given and no liability in respect of any error or omission is accepted. The information is included solely to illustrate the valuation process which is or may be utilized by the Fund.
INDEPENDENT ANNUAL EXTERNAL
VALUATION1
IndependentExternal Audit
Operating Committee review and sign offOperating Committee review and sign off
QUARTERLY IIG REVIEW QUARTERLY INDEPENDENT REVIEWS
ANNUAL AUDITED FINANCIAL STATEMENTS
DCF MODELLING
EXTERNALINPUTS AND
CHECKS
BUDGET PROJECTIONS
MODEL REVIEW
Updated for Most Recent Company Results and Projections
Economic/Market Assumptions Vetted With External Market Sources
Approvedby IIG,
Management, and Company
Board
Review of Model Outputs by
Managementand IIG ALTS INDEPENDENT
VALUATION TEAM

STRICTLY PRIVATE | CONFIDENTIAL
30 | FOR INSTITUTIONAL/WHOLESALE/PROFESSIONAL CLIENTS AND QUALIFIED INVESTORS ONLY - NOT FOR RETAIL USE OR DISTRIBUTION
For the exclusive use of the City of Fresno Employees Retirement System only
Risk and disclosuresSupplementary InformationThe Target Return and Target Yield have been established by J.P. Morgan Investment Management Inc. (“J.P. Morgan”) based on its assumptions and calculations using data available to it and in light of current market conditions and available investment opportunities and is subject to the risks set forth herein and as set forth more fully in the current Private Placement Memorandum of the Infrastructure Investments Fund (“The Memorandum”). The Target Returns and Target Yield are for illustrative purposes only and are subject to significant limitations. An investor should not expect to achieve actual returns similar to the Target Returns and Target Yield shown above. Because of the inherent limitations of the Target Returns or Target Yield, potential investors should not rely on them when making a decision on whether or not to invest in the strategy. The Target Returns and Target Yield cannot account for the impact that economic, market, and other factors may have on the implementation of an actual investment program. Unlike actual performance, the Target Returns and Target Yield do not reflect actual trading, liquidity constraints, fees, expenses, and other factors that could impact the future returns of the strategy. The manager’s ability to achieve the target returns is subject to risk factors over which the Investment Advisor may have no or limited control. There can be no assurance that the Fund will achieve its investment objective, the Target Return, the Target Yield or any other objectives. The return achieved may be more or less than the Target Return. The data supporting the Target Returns and Target Yield is on file with J.P. Morgan and is available for inspection upon request.
Infrastructure investments are subject to significant risks. While J.P. Morgan believes that infrastructure investments have compelling risk and return characteristics, past performance is no guarantee of future results, and any risk or return analyses should not be relied upon. Risk/return continuums and other relative comparisons are based on J.P. Morgan's analysis of information available to it on project developments in the referenced asset classes, and such information may not be accurate or complete. Specific investments shown are for illustrative purposes only, and you should not assume that similar investments will be available to or, if available, will be selected for investment by the Fund.
Information contained in this Booklet, except where otherwise indicated, solely represents J.P. Morgan's views based on available information and current market conditions. The views expressed herein may change at any time based on new information, changing conditions or revised analyses.
The deduction of an advisory fee reduces an investor’s return. Actual account performance will vary on individual portfolio security selection and the applicable fee schedule. Fees are available upon request.
The following is an example of the effect of compounded advisory fees over a period of time on the value of a client’s portfolio: A portfolio with a beginning value of $100 million, gaining an annual return of 10% per annum would grow to $259 million after 10 years, assuming no fees have been paid out. Conversely, a portfolio with a beginning value of $100 million, gaining an annual return of 10% per annum, but paying a fee of 1% per annum, would only grow to $235 million after 10 years. The annualized returns over the 10 year time period are 10.00% (gross of fees) and 8.91% (net of fees). If the fee in the above example was 0.25% per annum, the portfolio would grow to $253 million after 10 years and return 9.73% net of fees. The fees were calculated on a monthly basis, which shows the maximum effect of compounding.
KEY RISK FACTORS FROM THE MEMORANDUM AND OTHER DISCLOSURES
The following summarizes certain key risk factors that are fully set out, along with other risk factors, in the Memorandum. Defined terms used herein shall have the meanings ascribed thereto in the Memorandum. Prospective investors should carefully consider the summaries below in conjunction with the risk factors section of the Memorandum and should consult with their own financial, legal and tax advisors with respect thereto. The different organizational structures of the Fund Investor Vehicles are likely to result in different actual returns to Investors investing in different Fund Investor Vehicles. In certain circumstances, the variation in returns between Fund Investor Vehicles may be material. Before deciding to invest in the Fund or any Fund Investor Vehicle, all prospective investors are strongly urged to seek independent advice as to the most appropriate Fund Investor Vehicle through which to invest in the Fund. J.P. Morgan does not provide tax or regulatory advice. It is the sole responsibility of each prospective investor to ensure that it invests in a Fund Investor Vehicle that suits its personal circumstances and status.
General risk: There can be no assurance that the Fund will succeed in meeting its investment objective or Portfolio Target Return, or that there will be any return on capital or of the original capital invested. Investors will only have recourse to the assets of their particular Fund Investor Vehicle for any losses suffered.
0903c02a812c56ca
STRICTLY PRIVATE | CONFIDENTIAL
31 | FOR INSTITUTIONAL/WHOLESALE/PROFESSIONAL CLIENTS AND QUALIFIED INVESTORS ONLY - NOT FOR RETAIL USE OR DISTRIBUTION
For the exclusive use of the City of Fresno Employees Retirement System only
Risk and disclosures (cont’d)Supplementary InformationRisks associated with infrastructure investments generally: Investing in infrastructure assets involves a variety of risks, not all of which can be foreseen or quantified, and which include, among others: the burdens of ownership of infrastructure; local, national and international economic conditions; the supply and demand for services from and access to infrastructure; the financial condition of users and suppliers of infrastructure assets; risks related to construction, regulatory requirements, labor actions, health and safety matters, government contracts, operating and technical needs, capital expenditures, demand and user conflicts, bypass attempts, strategic assets, changes in interest rates and the availability of funds which may render the purchase, sale or refinancing of infrastructure assets difficult or impracticable; changes in environmental laws and regulations, investments in other funds, troubled infrastructure assets and planning laws and other governmental rules; changes in energy prices; negative developments in the economy that may depress travel activity; force majeure acts, terrorist events, under-insured or uninsurable losses; and other factors which are beyond the reasonable control of the Fund or the Investment Adviser. Many of these factors could cause fluctuations in usage, expenses and revenues, causing the value of the Investments to decline and negatively affecting the Fund’s returns.
Lack of liquidity of interests: The Interests are subject to restrictions on transferability and resale under various securities laws and may not be Transferred or resold except in compliance with those laws and with the prior written approval of the applicable General Partner or Board of Directors (which generally may be withheld or conditioned in its absolute discretion). There will be no public market for the Interests.
The Portfolio Target Return is subject to market conditions: The Portfolio Target Return is based on current available investment opportunities and predictions of the infrastructure market and economic conditions generally. Because the Fund has an indefinite term and current estimates of market conditions are likely to change over time, prospective investors should note that the actual realized return over the term of the Fund may vary materially from the Portfolio Target Return. The Investment Adviser reserves the right to amend the Portfolio Target Return without the consent of Investors in the event the Investment Adviser determines, in its absolute discretion, that such amendment is warranted by a material change in circumstances.
Appraisals and valuations: Most of the Fund’s Investments will be highly illiquid, and will most likely not be publicly traded or readily marketable. The Investment Adviser, therefore, will not have access to readily-ascertainable market prices when establishing valuations for the Investments, and the Investment Adviser and the Fund can provide no assurance that any given Investment will be valued or sold at a price equal to the value ascribed by the Investment Adviser to such Investment.
Regulatory and tax risks: The operation of the Fund and the tax consequences of an investment in the Fund are substantially affected by legal requirements, including those imposed by ERISA, the Code and regulations promulgated under these and other applicable U.S. laws, and by the laws, including tax laws, of the Cayman Islands, Canada, Germany and any other jurisdiction in which an Entity may be organized, formed or incorporated or in which an Investment may be made. To ensure compliance with such regulations and laws that may affect a group of Investors, the Investment Adviser may, acting reasonably and in good faith, take actions to ensure compliance with such regulations and laws. Such actions or omissions may have an adverse effect on certain Investors. J.P. Morgan does not provide tax or regulatory advice.
Distributions: Unless an Investor has elected to receive cash distributions of Distributable Cash, all Distributable Cash will be reinvested on that Investor’s behalf to purchase additional Interests in the Fund Investor Vehicle in which that Investor is invested at the most recent NAV per Interest for that Fund Investor Vehicle. As a result, Investors may incur tax liabilities arising from the activities of the Fund without necessarily receiving cash distributions from the Fund to meet such tax liabilities.
Environmental risks: The Fund may become liable for substantial costs from remedying environmental problems associated with the properties it holds. The costs of any such remediation may exceed the value of the relevant property and/or the aggregate assets of the Fund. Environmental problems may also affect the use and operation of such properties.
Future investments; inability to invest committed capital: Investments that will be acquired by the Fund in the future have not yet been identified. The activity of identifying, completing and realizing attractive Investments is highly competitive and involves a high degree of uncertainty. The Fund will be competing for investments with other infrastructure investment vehicles, as well as financial institutions and other institutional investors. No assurance can be given that the Fund will be successful in obtaining suitable investments.
Risks associated with Non-U.S. investments: The Fund expects to invest a substantial portion of the Fund’s assets outside of the U.S. Such investments involve certain risk factors not typically associated with investing in infrastructure in the U.S. including, but not limited to, risks relating to (i) currency exchange matters, (ii) differences between U.S. and non-U.S. infrastructure markets, the absence of uniform accounting, auditing and financial reporting standards, practices and disclosure requirements, and differences in government supervision and regulation, (iii) certain economic and political risks, including potential exchange-control regulations and potential restrictions on non-U.S. investments, (iv) changes in tax legislation, treaties, administrative practices or understandings, and (v) certain geographically specific risks (such as weather).
0903c02a812c56ca

STRICTLY PRIVATE | CONFIDENTIAL
32 | FOR INSTITUTIONAL/WHOLESALE/PROFESSIONAL CLIENTS AND QUALIFIED INVESTORS ONLY - NOT FOR RETAIL USE OR DISTRIBUTION
For the exclusive use of the City of Fresno Employees Retirement System only
Risk and disclosures (cont’d)Hedging: While under no obligation to do so, the Fund may enter into transactions or investments in relation to any or all of currency exchange, interest rate, inflation rate, commodity or other risks in connection with Investments. It may not be practical or cost-effective to hedge such risks precisely, especially where the magnitude and timing of future cash flows are not known with certainty. Accordingly, there can be no assurance, in such cases, that (a) such hedges will (i) be available, (ii) be available at a reasonable cost, (iii) be sufficient to mitigate the relevant risk or (iv) actually eliminate the risk of fluctuation in rates being hedged or (b) counterparties to any hedging transaction would perform as expected. There is also no certainty that any hedging transaction will prove beneficial to the Fund.
Leverage: The Fund intends to leverage its investments with recourse and non-recourse debt and may also obtain credit facilities or subscription lines. Although the use of leverage can enhance returns and increase the number of Investments that can be made, it can also substantially increase the risk of loss for such leveraged investments.
Diversification: Given the concentration of the Fund’s assets in the infrastructure industry, the Fund will be more susceptible to adverse economic or regulatory occurrences affecting that industry than a fund that is not concentrated in a single industry. Such possibly limited degree of diversification means the performance of the Fund may be more susceptible to a single economic, political or social event.
Conflicts of interest: J.P. Morgan engages in activities in the normal course of its investment banking, asset management and other businesses that may conflict with the interests of the Fund and/or its Investors.
No offer: This presentation is being communicated solely for the purposes of ascertaining levels of interest in the Fund. Accordingly, this presentation is not, and should not be construed as, an offer to invest in the Fund.
Basis for any investment in the Fund: Any investment in the Fund will be accepted solely on the basis of the Memorandum and the applicable Charter Documents for the Fund. Accordingly, this presentation, in whole or in part, will not form the basis of, and should not be relied upon in connection with, any subsequent investment in the Fund (when established and offered). To the extent that any statements are made in this presentation, they are qualified in their entirety by the terms of the Memorandum and other Fund documents. A copy of the Memorandum and Charter Documents must be reviewed prior to making a decision to invest in the Fund.
Confidentiality: This presentation is being made and communicated by J.P. Morgan Institutional Investments Inc., member FINRA & SIPC to selected Eligible Investors on a confidential basis exclusively for the benefit and internal use of the recipient in order to indicate, on a preliminary basis, the feasibility of a possible transaction or transactions. By accepting delivery of this presentation, each recipient undertakes not to reproduce or distribute this presentation in whole or in part, nor to disclose any of its contents (except to its professional advisors), without the prior written consent of the Placement Agent, who the recipient agrees has the benefit of this undertaking. The recipient and its professional advisors will keep permanently confidential information contained herein and not already in the public domain. Notwithstanding anything herein to the contrary, each recipient of this presentation, and each employee, representative or other agent of such recipient may disclose to any and all persons, without limitation of any kind, the U.S. federal and state income tax treatment and the U.S. federal and state income tax structure of the transactions discussed in the Memorandum and all materials of any kind (including opinions or other tax analyses) that are provided to such recipient relating to such tax treatment and tax structure insofar as such treatment and/or structure relates to a U.S. federal or state income tax strategy provided to such recipient by J.P. Morgan and its subsidiaries.
Eligible investors: Only “Eligible Investors” as defined in the Memorandum may invest in the Fund. Accordingly, each Investor must accept and be able to bear the risks attaching to an investment in the Fund, and acknowledges that any recourse it may have is limited, in substance, to the assets of the Fund.
No reliance: No reliance may be placed for any purpose whatsoever on the information contained in this presentation or on its completeness. The information set out herein may be subject to updating, completion, revision, verification and amendment and such information may change materially. No person has been authorized by J.P. Morgan or the Placement Agent to give any information or to make any statement or representation concerning the Fund other than as set forth in this presentation and the Memorandum. This presentation should not be considered as a recommendation by J.P. Morgan or the Placement Agent or any of their affiliates that the Fund is a suitable investment for any recipient of this presentation.
0903c02a812c56ca
STRICTLY PRIVATE | CONFIDENTIAL
33 | FOR INSTITUTIONAL/WHOLESALE/PROFESSIONAL CLIENTS AND QUALIFIED INVESTORS ONLY - NOT FOR RETAIL USE OR DISTRIBUTION
For the exclusive use of the City of Fresno Employees Retirement System only
Risk and disclosures (cont’d)Forward-looking statements: The statements herein containing words such as "may," "will," "should," "expect," "anticipate," "estimate," "intend," "continue" or "believe" or the negatives thereof or other variations thereon or comparable terminology are forward-looking statements and not historical facts. For example, the Portfolio Target Return noted herein is a forward-looking statement. Due to various risks, uncertainties and assumptions, including, without limitation, those set forth herein and in the Memorandum, actual events or results or the actual performance of the Fund may differ materially from those reflected in or contemplated by such forward-looking statements. Among the factors that could cause actual results to differ materially are: the general economic climate, inflationary trends, competition and the supply of, and demand for, property investments in the target markets, interest rate levels, the availability of financing, potential environmental liability and other risks associated with the ownership, development and acquisition of infrastructure assets, changes in the legal or regulatory environment, and greater than anticipated construction or management costs.
Own Investigation: This presentation is provided for information only and is not intended to be and must not alone be taken as the basis for an investment decision. Prospective investors should conduct their own investigation and analysis of an investment in the Fund (including, without limitation, their consideration and review of the documents referred to herein) and make an assessment of the offering independently and without reliance on J.P. Morgan, the Fund, the Investment Adviser, any Placement Agent or their respective employees, agents and affiliates. In addition, prospective investors are strongly urged to consult their own legal counsel and financial, accounting, regulatory and tax advisers regarding the implications for them of investing in the Fund.
Interests in the Fund: None of the Fund's Interests (i) constitute a deposit or an obligation, (ii) are in any way guaranteed by J.P. Morgan or any other bank, or (iii) have been approved or disapproved by the SEC, by the securities regulatory authority of any U.S. state or by any similar authority of any other country or jurisdiction, and neither the SEC nor any such authority has passed upon the accuracy or adequacy of this presentation or the Memorandum, nor is it intended that the SEC or any such authority will do so. None of the Interests will be registered under the Securities Act or the securities laws of any other country or jurisdiction. It is anticipated that the offering and sale of the Interests pursuant to the Memorandum will be exempt from registration pursuant to Regulation D. There will be no public market for any of the Interests.
J.P. Morgan Group: J.P. Morgan members or representatives may act as Placement Agent for the Interests and may be employees of J.P. Morgan Asset Management or any other J.P. Morgan affiliate that is providing services to the Fund.
U.S. Recipients: This presentation has been prepared for prospective Investors who qualify to invest in the types of investments described in this presentation. Generally they would include individuals or entities that are both “Accredited Investors” for purposes of the U.S. Securities Act of 1933 and are “Qualified Purchasers” for purposes of the U.S. Investment Company Act of 1940. This presentation may not be reproduced or used as sales literature with members of the general public.
0903c02a812c56ca

STRICTLY PRIVATE | CONFIDENTIAL
34 | FOR INSTITUTIONAL/WHOLESALE/PROFESSIONAL CLIENTS AND QUALIFIED INVESTORS ONLY - NOT FOR RETAIL USE OR DISTRIBUTION
For the exclusive use of the City of Fresno Employees Retirement System only
Risk and disclosures (cont’d)NOT FOR RETAIL DISTRIBUTION: This communication has been prepared exclusively for institutional, wholesale, professional clients and qualified investors only, as defined by local laws and regulations.This is a promotional document and is intended to report solely on investment strategies and opportunities identified by J.P. Morgan Asset Management and as such the views contained herein are not to be taken as advice or a recommendation to buy or sell any investment or interest thereto. This document is confidential and intended only for the person or entity to which it has been provided. Reliance upon information in this material is at the sole discretion of the reader. The material was prepared without regard to specific objectives, financial situation or needs of any particular receiver. Any research in this document has been obtained and may have been acted upon by J.P. Morgan Asset Management for its own purpose. The results of such research are being made available as additional information and do not necessarily reflect the views of J.P. Morgan Asset Management. This presentation is qualified in its entirety by the offering memorandum, which should be carefully read prior to any investment in a fund. The purchase of shares of a fund is suitable only for sophisticated investors for whom an investment in such fund does not constitute a complete investment program and who fully understand and are willing to assume the risks involved in such fund’s investment program. An investment in the funds involves a number of risks. For a description of the risk factors associated with an investment in a fund, please refer to the section discussing risk factors in the offering memorandum (available upon request). Shares of the funds are not deposits, obligations of, or endorsed or guaranteed by, JPMorgan Chase Bank, NA or any other bank and are not insured by the FDIC, the Federal Reserve Board or any other government agency.Any forecasts, figures, opinions, statements of financial market trends or investment techniques and strategies expressed are those of J.P. Morgan Asset Management, unless otherwise stated, as of the date of issuance. They are considered to be reliable at the time of production, but no warranty as to the accuracy and reliability or completeness in respect of any error or omission is accepted, and may be subject to change without reference or notification to you.
Investments in Alternative Investment Funds (AIFs) involves a high degree of risks, including the possible loss of the original amount invested. The value of investments and the income from them may fluctuate in accordance with market conditions and taxation agreements. Changes in exchange rates may have an adverse effect on the value, price or income of the products or underlying investment. Both past performance and yield are not a reliable indicator of current and future results. There is no guarantee that any forecast will come to pass.
Any investment decision should be based solely on the basis of any applicable local offering documents such as the prospectus, annual report, semi-annual report, private placement or offering memorandum. For further information, any questions and for copies of the offering material you can contact your usual J.P. Morgan Asset Management representative. Any reproduction, retransmission, dissemination or other unauthorized use of this document or the information contained herein by any person or entity without the express prior written consent of J.P. Morgan Asset Management is strictly prohibited.
In the United Kingdom, the Funds are categorized as a Non-Mainstream Pooled Investment as defined by the Financial Conduct Authority (FCA). The Funds are not available to the general public and may only be promoted in the UK to limited categories of persons pursuant to the exemption to Section 238 of the Financial Services and Markets Act 2000 (FSMA 2000). This information is only directed to persons believed by JPMorgan Asset Management (UK) Limited to be an eligible counterparty or a professional client as defined by the FCA. Persons who do not have professional experience in matters relating to investments should not rely on it and any other person should not act on such information.Investors should note that there is no right to cancel an agreement to purchase shares under the Rules of the Financial Conduct Authority and that the normal protections provided by the UK regulatory system do not apply and compensation under the Financial Services Compensation Scheme is not available.
J.P. Morgan Asset Management and/or any of its affiliates and employees may hold positions or act as a market maker in the financial instruments of any issuer discussed herein or act as the underwriter, placement agent or lender to such issuer. The investments and strategies discussed herein may not be suitable for all investors and may not be authorized or its offering may be restricted in your jurisdiction, it is the responsibility of every reader to satisfy himself as to the full observance of the laws and regulations of the relevant jurisdictions. Prior to any application investors are advised to take all necessary legal, regulatory and tax advice on the consequences of an investment in the products.
Investing in infrastructure assets or debt associated with infrastructure involve a variety of risks, not all of which can be foreseen or quantified, and which include, among others: the burdens of ownership of infrastructure; local, national and international economic conditions; the supply and demand for services from and access to infrastructure; the financial condition of users and suppliers of infrastructure assets; risks related to construction, regulatory requirements, labor actions, health and safety matters, government contracts, operating and technical needs, capital expenditures, demand and user conflicts, bypass attempts, strategic assets, changes in interest rates and the availability of funds which may render the purchase, sale or refinancing of infrastructure assets difficult or impracticable; changes in environmental laws and regulations, investments in other funds, troubled infrastructure assets and planning laws and other governmental rules; changes in energy prices; negative developments in the economy that may depress travel activity; force majeure acts, terrorist events, under-insured or uninsurable losses; and other factors which are beyond the reasonable control of the Fund or the Investment Adviser. Many of these factors could cause fluctuations in usage, expenses and revenues, causing the value of the Investments to decline and negatively affecting the Fund’s returns.
Securities products, if presented in the U.S., are offered by J.P. Morgan Institutional Investments, Inc., member FINRA/SIPC.J.P. Morgan Asset Management is the brand for the asset management business of JPMorgan Chase & Co. and its affiliates worldwide. This communication is issued by the following entities: in the United Kingdom by JPMorgan Asset Management (UK) Limited, which is authorized and regulated by the Financial Conduct Authority; in other European jurisdictions by JPMorgan Asset Management (Europe) S.à r.l.; in Hong Kong by JF Asset Management Limited, or JPMorgan Funds (Asia) Limited, or JPMorgan Asset Management Real Assets (Asia) Limited; in Singapore by JPMorgan Asset Management (Singapore) Limited (Co. Reg. No. 197601586K), or JPMorgan Asset Management Real Assets (Singapore) Pte Ltd (Co. Reg. No. 201120355E); in Taiwan by JPMorgan Asset Management (Taiwan) Limited; in Japan by JPMorgan Asset Management (Japan) Limited which is a member of the Investment Trusts Association, Japan, the Japan Investment Advisers Association, Type II Financial Instruments Firms Association and the Japan Securities Dealers Association and is regulated by the Financial Services Agency (registration number “Kanto Local Finance Bureau (Financial Instruments Firm) No. 330”); in Australia to wholesale clients only as defined in section 761A and 761G of the Corporations Act 2001 (Cth) by JPMorgan Asset Management (Australia) Limited (ABN 55143832080) (AFSL 376919); in Brazil by Banco J.P. Morgan S.A.; in Canada for institutional clients’ use only by JPMorgan Asset Management (Canada) Inc., and in the United States by JPMorgan Distribution Services Inc. and J.P. Morgan Institutional Investments, Inc., both members of FINRA/SIPC.; and J.P. Morgan Investment Management Inc.
Copyright 2017 JPMorgan Chase & Co. All rights reserved.
0903c02a812c56ca