Infrastructure for a Seamless Asia - Asian … for a Seamless Asia Tokyo: Asian Development Bank...
283
A Joint Study of the Asian Development Bank and the Asian Development Bank Institute INFRASTRUCTURE SEAMLESS ASIA for a
Transcript of Infrastructure for a Seamless Asia - Asian … for a Seamless Asia Tokyo: Asian Development Bank...

i
A Joint Study of the Asian Development Bank and the Asian Development Bank Institute
INFRASTRUCTURE
SEAMLESSASIA
for a

ii
© 2009 Asian Development Bank and Asian Development Bank Institute
ISBN: 978-4-89974-028-5
Infrastructure for a Seamless Asia Tokyo: Asian Development Bank Institute, 2009.
1. Regional infrastructure 2. Regional cooperation 3. Economic development 4. AsiaI. Asian Development Bank and Asian Development Bank Institute.
The views expressed in this book are those of the authors and do not necessarily reflect the views or policies of the Asian Development Bank Institute (ADBI), the Asian Development Bank (ADB), its Board of Directors, or the governments they represent. ADB and ADBI do not guarantee the accuracy of the data included in this publication and accepts no responsibility for any consequence of their use. Use of the term “country” does not imply any judgment by the authors, ADB, or ADBI as to the legal or other status of any territorial entity. The symbol “$” represents the United States dollar unless otherwise indicated.
ADB and ADBI encourage printing and copying information exclusively for personal and noncommercial use with proper acknowledgement of ADB and ADBI. Users are restricted from reselling, redistributing, or creating derivative works for commercial purposes without the express, written consent of ADB and ADBI.
Asian Development Bank6 ADB Avenue Mandaluyong, 1550 Metro ManilaPhilippinesTel: +632 632 [email protected]
Asian Development Bank InstituteKasumigaseki Building 8F3-2-5 Kasumigaseki, Chiyoda-kuTokyo 100-6008JapanTel: +813 3593 [email protected]
e co ec S

iii
Asia is huge and has vast natural and human resources. It is the largest region in the world in population and size, being home to more than half of the world’s people, and occupying more than a quarter of the world’s land area. Over the last decade, Asian economies have grown
rapidly and have become increasingly connected, to each other and to the rest of the world, through greater integration.
The competitiveness of Asia’s trade—and of its increasingly sophisticated production networks in particular—depends on efficient, fast, reliable, and seamless infrastructure connections. Vast parts of Asia—inland and remote areas, landlocked countries, and distant islands—are isolated economically as well as geographically; so much of the region’s huge potential remains untapped. While some of the existing infrastructure in the region is world class, most of it is below average. Rapid economic growth in recent years has put enormous pressure on Asia’s infrastructure, particularly in transport and energy, but also in communications. Unless it can be significantly improved, infrastructure will continue to be a bottleneck to growth, a threat to competitiveness, and an obstacle to poverty reduction. Better connectivity with inland areas, for instance, would boost trade and economic growth in coastal areas, as well as inland ones. These issues present an opportunity for the region to take collective action to further enhance regional cooperation, particularly in environmentally sustainable and greener infrastructure development. The challenge is to build better and seamless connections across Asia and thus to the rest of the world.
In view of the region’s diversity, wherein countries differ in size, income levels, population, natural resources, and access to both regional and global markets, connectivity is being enhanced through several subregional infrastructure programs begun in the last few
Foreword

iv
decades. Now is the time to move even further toward a vision of a seamless Asia by building pan-Asian connectivity.
The current global financial and economic crisis may have major repercussions on Asian economies. Following the 1997–1998 Asian crisis, countries with significant investment in infrastructure recovered faster than others. If the current crisis is prolonged, demand from advanced economies for Asian exports will decelerate in a marked fashion, thus slowing down Asia’s production. To mitigate the medium-term consequences of the ongoing crisis, Asia will need to put greater emphasis on increasing regional demand. This will have strong implications for regional infrastructure, which will need to be geared more toward supporting Asian production networks and regional supply chains for intraregional trade to meet the rising regional demand.
Amid weak global demand, Asian economies need to rely more on regional demand to sustain growth. Several Asian countries have been making efforts to stimulate domestic demand, and to alleviate the further impact of the spiraling crisis, by setting aside resources for infrastructure investment under their stimulus packages. At this stage, enhanced regional cooperation has the potential to be an important platform that could complement these country-level efforts. By working together, countries in Asia can unlock their vast economic potential; achieve sustained, rapid, and inclusive growth; and reduce poverty. The need for regional collective action in developing Asia-wide physical connectivity is becoming increasingly important, particularly in this time of global financial and economic crisis.
This study looks at regional infrastructure in Asia up to 2020 by presenting the major issues and challenges in developing regional infrastructure through the fostering of regional cooperation. It evaluates the existing infrastructure programs, policies, and institutions, and makes recommendations on how to develop and increase their effectiveness. It looks at broad, pan-Asian initiatives, as well as sector-specific subregional efforts, particularly in transport and energy. It discusses both hard infrastructure (i.e., the long-term physical structures, equipment, and facilities [including maintenance], and the economic services they provide) and soft infrastructure (i.e., the policy,

v
regulatory, and institutional frameworks that support the development and operation of physical infrastructure). Quite obviously, the book will serve as a definitive knowledge product for researchers, policymakers, business leaders, and other stakeholders in the region and beyond.
This study, led by the Asian Development Bank Institute (ADBI), is a joint flagship project conducted by the Asian Development Bank (ADB) and ADBI. Many individuals contributed to the study. I greatly appreciate the efforts of the excellent team of authors, advisers, reviewers, editors, and researchers, from both outside and within ADB and ADBI. ADBI Dean Masahiro Kawai and ADB Managing Director General Rajat M. Nag provided overall guidance. The task manager, Biswa Nath Bhattacharyay, Special Advisor to the Dean, ADBI, coordinated, managed, and finalized the study.
Connecting the diversity of Asia through seamless infrastructure will help in sustaining an integrated, poverty-free, prosperous, and peaceful Asia. This will require exemplary and visionary leadership as well as firm and unflinching commitment, which I am confident Asia is eminently capable of providing.
Haruhiko KurodaPresident
Asian Development Bank

vi
The study benefited from 26 background papers prepared and reviewed by distinguished scholars. Five workshops were held in Bangkok, Beijing, New Delhi, and Tokyo in 2008 to exchange views on background papers and draft chapters of the book. This ADB and ADBI joint study
was led by ADBI and conducted in collaboration with ADB under the overall guidance of Masahiro Kawai (Dean, ADBI) and Rajat M. Nag (Managing Director General, ADB).
Biswa Nath Bhattacharyay (Special Advisor to the Dean, ADBI) served as the task manager and coordinated, managed, and finalized the study. In addition, he played a leading and pivotal role in preparing the final book, as well as drafting Chapter 1 (Infrastructure Needs and Regional Cooperation), Chapter 4 (Developing Effective Policies and Institutions), and Chapter 6 (Toward a Seamless Asia). Chapter 2 (Supporting Regional Trade and Investment) was drafted by ADB’s Douglas Brooks, and Chapter 3 (Harnessing the Benefits of Regional Infrastructure) by ADBI’s Susan Stone. Vito Tanzi drafted an earlier version of Chapter 4, and Centennial Group’s Harinder Kohli drafted Chapter 5 (Financing Regional Infrastructure). Philippe Legrain drafted the executive summary and served as the economics editor.
Many individuals from ADBI’s and ADB’s management and staff contributed to the book. The study was conducted under the guidance of a steering committee chaired by Messrs. Kawai and Nag and comprising Philip Erquiaga, Klaus Gerhaeusser, Jeremy H. Hovland, Jong-Wha Lee, Juan Miranda, Sultan Rahman, Kazu Sakai, Kunio Senga, Arjun Thapan, and Xianbin Yao. A working group—comprising Ashok Bhargava, Ronnie Butiong, A. Barend Frielink, Robert Guild, David Kruger, Jayant Menon, Kala Mulqueeny, Soo Nam Oh, Graham Settle, Ajay Sagar, Diwesh Sharan, Anil Terway, and Jo Yamagata—reviewed background papers and draft chapters, and provided detailed
Acknowledgements

vii
comments. Mario Lamberte and Rita Nangia also provided useful comments on the book.
An external advisory board reviewed draft chapters and provided very useful comments. The board consisted of the following members: Isher Judge Ahluwalia (Indian Council for Research on International Economic Relations), Mahani Zainal Abidin (Institute of Strategic and International Studies Malaysia), Masahisa Fujita (Research Institute of Economy Trade and Industry, Japan), Mark Johnson (Asia-Pacific Economic Cooperation Business Advisory Council and Australian Gas Light Company), Johannes F. Linn (Wolfensohn Center for Development, The Brookings Institution), Peter Petri (International Business School, Brandeis University), Surin Pitsuwan (Association of Southeast Asian Nations [ASEAN] Secretariat), and Weimin Ren (Division of Bilateral and Regional Affairs, Department of International Cooperation, Ministry of Cooperation, People’s Republic of China). Masaki Omura (Japan Bank for International Cooperation) and Masakazu Sakaguchi (ADB) also provided valuable comments. Richard Pomfret (The University of Adelaide) was the external reviewer.
Stephen Banta was the manuscript editor. Ainslie Smith coordinated the production. Vu Anh Tuan and Marie Danielle V. Guillen assisted in research and administration. Prabir De assisted in reviewing the prepublication version. Michael Cortes of FandMDesign Inc. designed the book layout and cover artwork. Kazumi Hasegawa and Hideki Miura assisted with administrative matters.

viii
ABF – Asian Bond FundsABMI – Asian Bond Market InitiativeADB – Asian Development BankADBI – Asian Development Bank InstituteAH – Asian HighwaysAIF – Asian infrastructure fundALTID – Asian Land Transport Infrastructure DevelopmentASEAN – Association of Southeast Asian NationsASEAN+3 – ASEAN plus PRC, Japan, and KoreaASEAN+6 – ASEAN+3 plus Australia, New Zealand, and IndiaBIMP-EAGA – Brunei Darussalam Indonesia Malaysia Philippines – East ASEAN Growth AreaBIMSTEC – Bay of Bengal Initiative for Multi-Sectoral Technical and Economic CooperationBNDES – Brazil National Development BankCAF – Corporacion Andina de FomentoCAREC – Central Asia Regional Economic CooperationCBTA – Cross-Border Transport AgreementCGE – computable general equilibriumCNY – yuan (PRC currency)DMC – developing member countryEC – European CommissionEdL – Electricite du LaosEGAT – Electricity Generating Authority of ThailandEIB – European Investment BankEIRR – economic internal rate of returneTEN – Trans-European Telecommunications NetworkEU – European UnionEWEC – East-West Economic Corridor
Abbreviations and Acronyms

ix
FDI – foreign direct investmentFONPLATA – Fondo Financiero para el Desarollo de la Cuenca del PlataGDP – gross domestic productGMS – Greater Mekong SubregionGTAP – Global Trade Analysis ProjectICT – information and communication technologyIDB – Inter-American Development BankIEA – International Energy AgencyIGA – Inter-Governmental AgreementIIRSA – Initiative for the Integration of Regional South American InfrastructureIMT–GT – Indonesia-Malaysia-Thailand Growth TriangleISN – information superhighway networkJBIC – Japan Bank for International CooperationJICA – Japan International Cooperation Agencykm – kilometerkm/h – kilometers per hourkWh – kilowatt-hourLao PDR – Lao People’s Democratic RepublicLCR – London and Continental RailwayLINK – Linkedua Malaysia BerhadMDB – multilateral development bankMOU – memorandum of understandingMRC – Mekong River CommissionNIE – newly industrialized economyNSEC – North-South Economic CorridorNTFC – national transport facilitation committeeOECD – Organisation for Economic Co-operation and DevelopmentPAIF – Pan-Asia Infrastructure ForumPASO – Pacific Aviation Safety OfficePIF – Pacific Island ForumPLPP – Plan Puebla PanamaPPA – Power Purchase AgreementPPP – public-private partnershipPRC – People’s Republic of ChinaRPTCC – Regional Power Trade Coordination CommitteeSASEC – South Asia Subregional Economic Cooperation

x
SECSCA – Subregional Economic Cooperation in South and Central AsiaSWF – sovereign wealth fundTAR – Trans-Asian RailwayTEA – Transport Executive AgencyTEN – Trans-European NetworkTEN-E – Trans-European Energy NetworkTEN-T – Trans-European Transport NetworkTEU – twenty-foot equivalent unitTHPC – Theun Hinboun Power CompanyUEM – United Engineers Malaysia BerhadUK – United KingdomUNCTAD – United Nations Conference on Trade and DevelopmentUNESCAP – United Nations Economic and Social Commission for Asia and the PacificUS – United StatesWEF – World Economic Forum

xi
ContentsForeword iiiAcknowledgements viAbbreviations and Acronyms viiiExecutive Summary 1
Infrastructure Needs and Regional Cooperation 11. 3
Scope, Coverage, and Definitions 11.1. 9Why Regional Infrastructure? 21.2. 1Framework for Regional Infrastructure Cooperation 21.3. 4Overview of Asia’s Regional Infrastructure Initiatives 21.4. 7Plan of the Study 31.5. 6
Supporting Regional Trade and Investment 32. 9
Overview of Asia’s Infrastructure 42.1. 4Trends in Asian Trade 52.2. 2Infrastructure for Trade and Investment 52.3. 9Enhancing Regional Energy Trade 72.4. 2Toward Greater Trade 72.5. 5
Harnessing the Benefits of Regional Infrastructure 73. 9
Economics of Infrastructure Network 83.1. 3Empirical Evidence 93.2. 1Regional Case Studies 93.3. 6Potential Negative Impacts 103.4. 8Overall Gains from Pan-Asian Connectivity 113.5. 1Conclusions 113.6. 6
Developing Effective Policies and Institutions 114. 7
Components of Effective Policies and Institutions 124.1. 0European and Latin American Experience 124.2. 4Asia’s Regional Infrastructure Programs: Policies and Institutional 4.3. Arrangements 134Addressing the Major Challenges 144.4. 9Conclusions 164.5. 0
Financing Regional Infrastructure 165. 3
Financing Needs 165.1. 6Challenges in Financing Regional Infrastructure 175.2. 2International Experience 175.3. 9Development of Asian Financial Markets 185.4. 4Financing Options 185.5. 8Conclusions 195.6. 5
Toward a Seamless Asia 196. 7
A Framework for Regional Infrastructure Cooperation 206.1. 3Main Findings and Recommendations 206.2. 7The Way Forward 216.3. 3
Appendix 215References and Bibliography 261

xii
Boxes
Box 1.1. What Is Regional Infrastructure? 20Box 3.1. Estimating the Benefits of Energy Cooperation in the GMS 94Box 3.2. Greening the GMS Transport Corridors 110Box 3.3. Methodology for Estimating Overall Gains from Pan-Asian
Connectivity 112Box 4.1. The Greater Mekong Subregion Cross-Border Transport
Agreement 140Box 4.2. Pacific Aviation Safety Office 147Box 5.1. Theun Hinboun Hydropower Project, the Lao PDR 174Box 5.2. Malaysia-Singapore Second Link: Railway 176Box 5.3. Perpignan–Figueiras Rail Concession 177Box 5.4. Channel Tunnel Rail Link 178Box 5.5. Islamic Financial Instruments 192
Figures
Figure 1.1. Asian Highway Network 28Figure 1.2. Trans-Asian Railway Network 29Figure 2.1. Road Network Indicators by Region, 1996 and 2005 46Figure 2.2. Railway Indicators by Region, 1996 and 2005 47Figure 2.3. ICT Indicators by Region, 1996 and 2005 48Figure 2.4. Electricity Consumption Per Capita, kWh, 1996 and 2005 49Figure 2.5. Intraregional Trade Flows in Asia, 2007 (as a percentage of
Asia’s total trade) 56Figure 2.6. International Logistics Performance Index 69Figure 3.1. Gateways and Multimodal Corridors in Southeast Asia 90Figure 3.2. Household Real Income Effects in Kazakhstan 100Figure 3.3. Trends in Real Income Gains During 2010–2020 115Figure 4.1. Role of EU Institutions in TENs’ Decision Making and
Management 128Figure 4.2. Architecture of Subregional Infrastructure Cooperation
in Asia 150Figure 4.3. Policy and Institutional Framework for a Seamless Asia 152Figure 6.1. A Framework for Pan-Asian Infrastructure Cooperation 206

xiii
Tables
Table 1.1. Subregional Cooperation Programs in Asia 31Table 2.1. Comparison of Asian Infrastructure Quality with the World,
2008 51Table 2.2. Trade Growth in Asia’s 10 Leading Exporters, 1987–2007 52Table 2.3. Trade in Asian Subregions and Other World Regions,
1990–2007 54Table 2.4. Border Trade Costs, 2009 65Table 2.5. Proven Energy Reserves in Million Tons of Oil Equivalent and
Percent of World Total, 2006 73Table 2.6. Pattern of Asia’s Energy Exports and Imports, by Country and
Commodity (in percent) 74Table 3.1. Impacts on the PRC and Thailand from Electricity
Infrastructure Investment 95Table 3.2. Real GDP Growth Premium (percentage of baseline GDP) 97Table 3.3. Sources of Real Household Income Growth (percentage
change from baseline) 98Table 3.4. Aggregate Impacts of Pipeline Extension, 2020 (in 2002
$ million) 99Table 3.5. Aggregate Outcomes in South Asia 101Table 3.6. Household Welfare Impact of Transport Cost Reductions
($ million) 102Table 3.7. Aggregate Impacts of Reduced Costs of Road Transport in
the GMS 105Table 3.8. Change in Poverty Headcount (by stratum and country) 107Table 3.9. Accumulated Reduction in Trade Costs Resulting from
Infrastructure Investment, 2010–2020 (percentage of trade value) 113
Table 3.10. Present Discounted Value of Net Income Gains from Pan-Asian Connectivity (in 2008 $ billion) 114
Table 4.1. Key Characteristics of Regional and Subregional Institutions and Programs Involved in Infrastructure 136
Table 5.1. Asia’s Total Infrastructure Investment Needs by Sector, 2010–2020 (in 2008 $ million) 167
Table 5.2. Indicative Investment Needs for Regional Identified and Pipeline Infrastructure Projects, 2010–2020 169
Table 5.3. Twenty-One High Priority “Flagship” Regional Projects 171Table 5.4. Characteristics of Major Regional and National Financial
Institutions 181Table 5.5. Structure of Financial Systems in Selected Asian Economies
(percent of GDP) 185Table 5.6. Asia’s Gross Domestic Savings and Foreign Exchange
Reserves, 2007 ($ billion) 189
xiv
Appendix
Table A1.1. GDP Growth, 2004–2010 (percentage per year) 216Table A1.2. Population and Population Density, 2007–2020 218Table A2.1. Land Transport Indicators in Selected Asian Countries 220Table A2.2. Air Transport Indicators in Selected Asian Countries 221Table A2.3. Global Competitiveness and Infrastructure Quality Index of
Asian Economies 222Table A2.4. Primary Energy Consumption in Asia and Other Regions
(million TOE) 223Box A3.1. Measuring the Benefits of Infrastructure Projects 224Table A3.1. Household Categories in the Model 226Box A4.1. Trans-European Energy Network Development 227Box A4.2. Mekong River Commission (MRC) 228Figure A4.1. GMS Institutional Arrangements 229Figure A4.2. Institutional Framework of the GMS CBTA 229Figure A4.3. CAREC’s Institutional Framework 230Table A5.1. Current Investment Needs for the Asian Highway Network 231Table A5.2. Unmet Investment Needs for Asian Highway Identified
Projects 232Table A5.3. Indicative Investment Needs for Trans-Asian Railway
Network Projects 237Table A5.4. Energy Projects Linking East and Southeast-Central-South
Asia 239Table A5.5. Indicative Investment Needs for GMS Transport and Energy
Projects 239Table A5.6. Other Energy Projects in Southeast Asia 241Table A5.7. CAREC Transport, Trade Facilitation, and Energy Projects 242Table A5.8. Transport Logistics and Energy Projects in South Asia 246Table A5.9. Description of High-Priority GMS Energy and Transport
Projects 247Table A5.10. Description of High-Priority CAREC Transport and Energy
Projects 249Table A5.11. Description of High-Priority Transport and Energy Projects in
South Asia 252Table A5.12. Additional Transport and Energy Projects (Identified and in
the Pipeline) Without Available Investment Estimates 255Table A5.13. Trans-Asia Railway Projects Without Available Investment
Estimates 255Table A5.14. East and Southeast-Central-South Asia Transport Projects
Without Available Investment Estimates 257Table A5.15. ASEAN Projects Without Available Investment Estimates 257Table A5.16. List of GMS Projects Without Available Investment Estimates
and Target Schedules 258Table A5.17. East Asia’s Regional Energy (Power Grid Interconnection)
Project Without Available Investment Estimates 259Table A5.18. CAREC Energy Projects Without Available Investment
Estimates 259Table A5.19. Regional Transport Projects in South Asia Without Available
Investment Estimates 259

1
Executive Summary

2

Executive Summary
3
Executive Summary
Executive Summary
Asia’s diversity is its strength, providing opportunities for trade, investment, and economic growth. The region’s economies have flourished as they have become more closely intertwined with each other and the rest of the world. International supply chains span the region to
take advantage of each country’s comparative advantage. As a result, Asia plays an increasingly central role in the global economy: it is the world’s production factory, biggest saver, and an emerging giant in outsourced services.
Without good connectivity, however, diversity breeds disparity rather than prosperity. Asia’s trade competitiveness—and its increasingly sophisticated production networks in particular—depends on efficient, fast, reliable, and seamless infrastructure connections. The pattern of Asia’s development highlights this phenomenon. Its thriving firms cluster in an arc of enterprise along its coastlines, close to international ports and airports. But many parts of Asia—inland and remote areas, landlocked countries, and distant islands—are isolated economically as well as geographically. Much of Asia’s potential remains untapped.
While parts of the region’s infrastructure are world class, it is generally below the global average, as this study details. Rapid growth in recent years has also put severe pressure on the existing infrastructure, particularly in transport and energy, as well as in communications. The inadequacies of Asia’s infrastructure networks are a bottleneck to growth, a threat to competitiveness, and an obstacle to poverty reduction.
The study examines major challenges and issues associated with developing regional infrastructure through the fostering of regional cooperation in Asia, and provides a framework for pan-Asian infrastructure cooperation. To the best of the Asian Development Bank and Asian Development Bank Institute’s knowledge, this is
4
Infrastructure for a Seamless Asia
the first time that such a study on regional infrastructure has been undertaken. The study’s long-term vision is the creation of a seamless Asia—an integrated region connected by world-class, environmentally friendly infrastructure—in terms of both “hard” (physical) and “soft” (facilitating) infrastructure. The soft part supports the development and operation of the hard component. The challenge now is to build efficient and seamless connections across Asia—and thus to the rest of the world.
This study finds that the benefits of upgrading and extending Asia’s infrastructure networks are substantial, and that all countries in the region would benefit. A logistics network is only as good as its weakest link; each country in a regional supply chain gains from infrastructure improvements made in others. Also, the wider a network, the more each of its users benefits. Thus, better connections to inland areas would boost trade and economic growth in inland areas as well as coastal ones. Connecting national electricity grids and gas pipelines and harnessing common energy resources, such as rivers with hydroelectric potential, would boost regional energy trade, subsequently reducing costs, increasing the diversity of supply, enhancing energy security, and often benefiting the environment. Regional infrastructure development creates a win-win outcome for all participating countries.
Improving connectivity in the region would bring Asia large welfare gains through increased market access, reduced trade costs, and more efficient energy production and use. If the required investment toward pan-Asian connectivity is made in the region’s transport, communications, and energy infrastructure during 2010–2020, developing Asia’s real income during that period and beyond could reach $13 trillion. Countries that trade more, as well as those whose infrastructure needs are particularly urgent, would experience much larger gains. Asia’s leaders cannot afford to ignore such large gains.
Between 2010 and 2020, Asia needs to invest approximately $8 trillion in overall national infrastructure. In addition, Asia needs to spend approximately $290 billion on specific regional infrastructure projects in transport and energy that are in the pipeline. Of these regional projects, 21 high priority projects that could be implemented

Executive Summary
5
by 2015 at a cost of $15 billion have been identified. The successful implementation of these high-priority projects and their wider regional benefits would create a strong drive toward further strengthening regional infrastructure networks. This amounts to an overall infrastructure investment need of about $750 billion per year during this 11-year period.
As this study goes to press, the global financial turmoil and resulting economic downturn are still unfolding. If the current crisis is prolonged, demand from advanced economies will remain stagnant, thus depressing Asia’s production. However, the lesson of the financial crisis of 1997–1998 is clear: cuts in infrastructure investment that jeopardize future recovery should be avoided. Therefore, the need to upgrade and extend infrastructure networks over the time frame of 2010–2020 assumes greater importance. To mitigate the medium-term consequences of the ongoing crisis, Asia will need to put greater emphasis on increasing regional demand. As private financing will be much harder to secure, governments should adopt fiscal stimulus packages that accelerate and increase infrastructure investment. At this stage, enhanced regional infrastructure cooperation could complement these country-level efforts. International institutions such as Asian Development Bank and the World Bank need to provide increased financial and technical assistance for regional infrastructure programs.
In the long run, the full benefits of Asia’s size and diversity can be realized only by creating a single Asian market where goods, services, capital, information, and people move freely. Moving toward that long-term vision of a seamless Asia requires world-class, pan-Asian infrastructure networks that: (i) provide open connections to regional and global markets; (ii) are driven by political leadership as well as economic logic; (iii) are built up from national, bilateral, and subregional programs; and (iv) are guided and supported by broad-based and effective regional frameworks that ensure their proper development and financing.

6
Infrastructure for a Seamless Asia
Supporting Regional Trade and Investment
Where infrastructure connections are good, Asia’s trade has expanded rapidly. Trade within East Asia—and with the People’s Republic of China in particular—has risen fast; however, where infrastructure connections are poor, such as within South Asia and between Asian subregions, trade remains low. As barriers to trade in Asia have fallen—not least of which are import tariffs and other trade-policy restrictions—infrastructure deficiencies have become an increasingly relevant issue. Correcting these weaknesses in regional infrastructure would do more to lower the cost and increase the volume of trade in Asia than would eliminating any remaining tariff and non-tariff barriers.
Asia’s goods are transported mainly by sea. But as traded content shifts from bulky goods toward lighter, often higher-value products, goods are increasingly sent by air. Relatively few goods go long distances by road or rail, as demonstrated by the fact that trade among Asian countries that share a land border is much lower than similar areas elsewhere in the world. Improving rail and road connections to ports is particularly important for inland areas and landlocked countries, as they tend to encounter high trade costs.
Exports are diversifying across new markets, and intraregional trade in parts and components for regional supply chains accounts for a growing share of total trade. These trends underscore the need for efficient and flexible logistics networks that provide uncomplicated connections between different transport modes and make it possible to trade with more places, in less time, at lower costs. The logistics networks need to be complemented by investments in information and communications technology, human capacity development, cooperation on trade facilitation, and improvements in “soft” infrastructure.

Executive Summary
7
Harnessing the Benefits of Regional Infrastructure Networks
Sufficient evidence has been generated to confirm that infrastructure plays a key role in promoting and sustaining rapid economic growth. Studies suggest that differences in infrastructure help explain East Asia’s superior growth in relation to other emerging regions. Evidence from around the world shows that the returns from investing in telecommunications, transport, and energy infrastructure greatly exceed those from other forms of capital investment. Studies in several developing Asian countries illustrate how infrastructure, particularly roads and electricity, helps to reduce poverty.
One of the major challenges in developing regional infrastructure is to address the asymmetric distribution of regional infrastructure project costs and benefits. It is also important to effectively manage negative socioeconomic impacts across countries so as to ensure win-win outcomes for participating countries. Studies of the benefits of regional infrastructure are scarce, but careful economic modeling prepared for this book shows that the benefits are large, tend to be widely distributed, and often help the poor the most. Case studies of Central Asia, the Greater Mekong Subregion, and South Asia show that the gains from subregional infrastructure projects greatly exceed the costs. The negative impacts of regional infrastructure projects include road accidents, human trafficking, displacement of people, and environmental damage. These issues need to be addressed. Efforts to make transport and energy investments more environmentally aware and, in particular, to mitigate their impact on climate change, are critical.
Developing Effective Policies and Institutions
Asia has made some progress in developing subregional infrastructure programs over the past decade and a half, with overlapping subregional groups cooperating to varying degrees on infrastructure issues in Asia. Such programs are most advanced in the

8
Infrastructure for a Seamless Asia
Greater Mekong Subregion and are less developed in other subregions. However, connections between subregions—notably between South and East Asia—are particularly weak.
Further progress requires creating an effective new framework for regional cooperation, as well as strengthening the coordination among and capacity of existing ones. Asia can learn from the experiences of other regions, notably Europe and Latin America. The European Union’s experience shows that creating a framework for regional infrastructure cooperation often requires an honest broker to forge a convergence of interests, and high-profile coordinators to monitor implementation. Latin America’s experience shows that a forum for dialogue and cooperation can help build awareness of the benefits of regional integration and infrastructure, filter out unproductive projects, coordinate among national and subnational agencies, and increase stakeholders’ participation. While the lessons from other regions are useful, ultimately, Asia must craft policies and institutions that are appropriate for its own needs and circumstances.
Until now, Asia has largely followed a bottom-up, market-driven approach to infrastructure development. However, it is now necessary to complement this approach with a more top-down, market-expanding, and demand-inducing approach geared toward creating a seamless Asia. Furthermore, the prospect of a prolonged downturn in Asia’s major export markets underscores the need for a long-term rebalancing of its economy toward meeting local needs. This will require many policy changes, particularly the prioritization of improvements in pan-Asian connectivity.
In view of Asia’s varied needs and circumstances—and varying political commitment to closer integration—subregional infrastructure programs have been proceeding at different speeds and on different tracks. Asia should create pan-Asian infrastructure networks by strengthening and integrating existing subregional programs.
Consequently, a pan-Asian infrastructure forum (PAIF) should be established to help coordinate and integrate existing subregional infrastructure initiatives. It would bring together all the key stakeholders
Executive Summary
9
in the region, which would help build consensus about, prioritize, and coordinate regional infrastructure plans. The PAIF could also develop harmonized standards for regulatory and legal issues—based on international best practices—as well as a common framework for handling and mitigating negative social and environmental impacts. Within the PAIF, sectoral subforums could also be established—for transport and energy, for instance—as well as subforums for soft infrastructure matters, such as regulatory and legal issues.
Financing Regional Infrastructure
A seamless Asia will not come to fruition without proper financing. Yet, financing infrastructure projects is often challenging—for regional projects in particular—as they involve major risks and uncertainties that the private sector is unwilling to bear. Most regional infrastructure projects are therefore developed and financed by governments. Even those that involve public-private partnerships generally still require some form of government guarantee.
Lessons from other regions show that developing and financing regional projects is a slow and complicated process, even in the European Union. Political leadership from the highest level is necessary but not sufficient, as the Latin American experience demonstrates. Regional projects are often a low priority for domestic policymakers responsible for allocating budgets and usually require assistance from multilateral institutions. Furthermore, at times such projects involve constructing infrastructure segments in areas of a country with little economic activity and few advocacy groups. Concessionary financing from external sources may be necessary to make such projects more attractive to investors.
The region’s vast domestic savings would be the main source of financing for Asia’s massive infrastructure investment requirements. Due to the turmoil in global financial markets, the public sector will necessarily continue to play a dominant role, with spending from government budgets supplemented by funds channeled through domestic and regional financial markets. Asian governments must

10
Infrastructure for a Seamless Asia
bolster their collective efforts to mobilize a large pool of regional savings for viable regional infrastructure investments. If such ”bankable” regional projects are created, then private financing involving public-private partnerships could be obtained. Strengthening national and regional bond markets—notably though initiatives such as the Asian Bond Markets Initiative and Asian Bond Funds—is one of the first steps in creating a viable source of infrastructure financing to tap the vast Asian savings.
An Asian infrastructure fund (AIF) should be established to help mobilize Asian and international funds, and to meet the challenges of preparing and financing “bankable” regional infrastructure projects. The AIF’s capital could come from a variety of sources, including governments, sovereign wealth funds, multilateral development banks, and bilateral agencies. It should have its own legal identity so as to enable it to help finance projects through its own resources, as well as by issuing bonds or through cofinancing arrangements with other entities, including private investors. The AIF would help finance projects identified and prioritized by the PAIF by providing a facility to expedite financial preparations, as well as provide grant and concessional financing in order to encourage countries to prioritize regional projects in their national development programs. It would also be able to provide guarantees against major political, economic, and financial risks.
Toward a Seamless Asia
The key messages of this study are as follows:The required investment in regional infrastructure for pan-Asian connectivity would produce large real income gains of around $13 trillion for developing Asia during 2010–2020 and beyond.A pan-Asian infrastructure forum should be established to help coordinate and integrate existing subregional infrastructure initiatives toward a seamless Asia.From 2010 to 2020, Asia will need to invest approximately $8 trillion in overall national infrastructure and, in addition,

Executive Summary
11
about $290 billion in specific regional infrastructure projects—an average overall infrastructure investment of $750 billion per year.An Asian infrastructure fund is needed to mobilize Asian and international funds and to help prioritize, prepare, and finance “bankable” regional infrastructure projects.
Building roads, railways, bridges, power stations, and pipelines across the region should be a priority for the region’s policymakers. In these uncertain times, Asia must not pause or turn back, but rather forge ahead with the challenging and immensely rewarding task of integrating this large and diverse region for the benefit of all its citizens. Such integration will help boost economic growth and disperse its benefits more widely. It will enhance the region’s competitiveness and extend its global reach. It will help reduce poverty and promote greater environmental sustainability. But it is only possible with a common vision, strong commitment from political leadership, and partnership at the highest level. Now is the time to start moving toward a seamless Asia.

Infrastructure
Needs and Regional
Cooperation
Chapter 1

Infrastructure Needs and Regional Cooperation
15
Asia’s diversity provides enormous opportunities for trade, investment, and economic growth. East Asia’s remarkable success in recent decades demonstrates this. Asian economies have flourished as they have become more closely intertwined with each other and
the rest of the world. International supply chains span the region to take advantage of each country’s comparative advantage. As a result, Asia plays an increasingly central role in the global economy: it is the world’s factory, its biggest saver, and an emerging giant in outsourced services.
Without good connections, however, diversity breeds disparity rather than prosperity. The competitiveness of Asia’s trade—and of its increasingly sophisticated production networks in particular—depends on cost-effective, rapid, and reliable infrastructure networks. The pattern of Asia’s development highlights this phenomenon. Its thriving firms cluster in an arc of enterprise along its coastlines, close to efficient international ports and airports. Other outposts dotted around the region trade by air or through fiber optic cables, bypassing shoddy roads and railways. But many parts of Asia—inland and remote areas, landlocked countries, distant islands—are isolated economically as well as geographically. Much of Asia’s enormous potential remains untapped.
Physical connectivity is crucial to support complementarities in the production processes across the entire region. Regional connectivity enhances the free flow of goods and services across borders, allowing countries to benefit from better relocation of resources. Infrastructure investment has been at the heart of Asia’s development strategy of
1. Infrastructure Needs and Regional
Cooperation

16
Infrastructure for a Seamless Asia
promoting integration with the regional and global economy (Kuroda et al. 2008).
While parts of the region’s infrastructure are world-class, it is below the global average generally, as this study details. Rapid economic growth in recent years has put severe pressure on the existing infrastructure, particularly in transport and energy, as well as in communications. This current state of the region’s infrastructure is a bottleneck to growth, a threat to competitiveness, and an obstacle to poverty reduction. The challenge now is to build better connections across Asia—and thus to the rest of the world.
After years of bountiful growth, the global financial crisis and ensuing economic downturn have hit Asia particularly hard. For decades, the region recorded the world’s fastest economic growth. In 2006 and 2007, average growth in gross domestic product (GDP) across the 45 countries (i.e., the 46 listed in Appendix Table A1.1, excluding Japan) of Asia and the Pacific exceeded 8.9%. The region’s two biggest emerging economies did even better, with India recording growth of more than 9% in each year, and the People’s Republic of China (PRC) topping 13.0% in 2007. But growth slowed sharply in 2008, and the Asian Development Bank (ADB)(2009) forecasts further weakness in 2009 and a recovery in 2010. While the fundamentals of Asia’s economies and financial systems appear sound, weakening exports and sharply reduced private capital inflows pose a significant challenge (ADB 2008c, 2008f). Further financial turmoil would also be likely to dampen the confidence of consumers and investors.
The long term consequences of the current crisis are not clear. However, as long as Asia’s long-term growth potential remains unaffected, it does not lessen the need for upgrading and extending infrastructure networks. On the contrary, the crisis provides three additional reasons for increased investment in regional infrastructure: First, infrastructure is a critical supply-side base for increasing competitiveness and productivity of an economy and for reducing poverty. Second, bringing forward and stepping up infrastructure investment can form an important part of a fiscal stimulus package, especially if the crisis proves prolonged. Governments with a sound

Infrastructure Needs and Regional Cooperation
17
fiscal position and stable currency can take fiscal measures to stimulate their economies if necessary. For example, infrastructure spending is an important component of the PRC’s CNY4.0 trillion ($586 billion) stimulus package announced in November 2008; several other Asian economies have adopted similar packages to a lesser extent. Third, the crisis underscores the importance of reducing the imbalances in the world economy and ensuring that global growth is more balanced in the future. Improvements in regional infrastructure can promote greater regional integration and help expand demand within the region, which should account for a larger share of Asia’s growth.
In responding to the current global financial crisis, Asia should heed the lessons of the crisis of 1997–1998. At that time, public and private infrastructure investments were substantially reduced in many Asian economies, where in many cases they were already too low. Private investment more than halved in East and Southeast Asia after 1996, while public investment also declined sharply as budget constraints bit and international financial institutions such as the World Bank cut their infrastructure lending (Economic Research Service and United States Department of Agriculture 1999). Infrastructure programs were among the first to be cut in developing Asian economies such as Indonesia, the Philippines, and, to a lesser extent, the Republic of Korea and Malaysia. Indonesia and the Philippines are still suffering from a large infrastructure deficit due to the collapse of investment after the 1997 financial crisis—and their poor infrastructure has kept growth rates below their potential (ADB 2006g).
In contrast, this time some Asian economies, such as the PRC and the Republic of Korea, are responding to the current crisis by increasing public infrastructure spending to sustain demand, help create jobs, and raise long-term growth. The State Council of China has approved CNY2.0 trillion ($292 billion) in railway investment under the new stimulus package of CNY4.0 trillion. The PRC’s stimulus package also involves investments in rural infrastructure, roads, and airports. A high return on new infrastructure investment is expected, especially in underdeveloped areas such as the western part of the country (China Business Review 2009; China Daily 2008).

18
Infrastructure for a Seamless Asia
In the Republic of Korea, infrastructure spending fell only slightly during the 1997–1998 crisis and, as the economy bounced back, the government increased infrastructure investment to create jobs and stimulate the economy (Aldo 2001). In 2008, the government announced a 14 trillion won ($11 billion) fiscal stimulus package, of which 4.6 trillion won ($3.6 billion) will be spent on infrastructure projects (Ministry of Strategy and Finance, Rep. Korea 2009).
While the global financial and economic turmoil will no doubt dampen private investment and may make public financing more difficult, Asian governments, multilateral development banks (MDBs) and bilateral aid agencies should provide additional infrastructure investment to tide economies through difficult times and promote future growth.
The crisis may also tempt countries to turn away from regional and global integration. But Asia’s economies did not retreat into protectionism after the 1997–1998 crisis, and it would be a mistake to do so now. Regional integration has so far delivered substantial benefits (ADB 2008c, ADB-United Nations Conference on Trade and Development [UNCTAD] 2008, The Research and Information System for Developing Countries 2008), and changing course now would put those achievements at risk. Indeed, the crisis underscores the need to enhance regional cooperation, not least in developing and integrating Asia’s financial markets to mobilize funds for investment within the region.
Such is the severity of the current global crisis that it would be foolish to believe that Asia does not need to rebalance growth and move away from its high dependence on exports to advanced economies. But it is reasonable to assume that Asia’s economy is fundamentally sound and that it will emerge from the crisis sooner rather than later. Because the time frame of this study stretches until 2020, it takes a medium-term view of Asia’s needs for regional infrastructure—and so should Asian policymakers. Regional infrastructure is a long-term investment in Asia’s future prosperity.

Infrastructure Needs and Regional Cooperation
19
Scope, Coverage, and Definitions1.1.
This study looks at regional infrastructure development in Asia up to 2020. It examines the key issues and challenges associated with developing regional infrastructure through fostering regional cooperation in Asia. To the best of ADB and Asian Development Bank Institute’s knowledge, this is the first time that such a study on regional infrastructure has been undertaken. It assesses the extent and merits of existing programs, policies, and institutions, and provides recommendations for how to develop them and improve their effectiveness as well as a pan-Asian framework for regional infrastructure cooperation.
The study looks at both broad pan-Asian initiatives and sector-specific subregional efforts, mainly in transport (such as roads, railways, ports, waterways, and airports) and energy (such as power stations, hydroelectric dams, electricity grids, and gas and oil pipelines), and to a lesser extent in telecommunications (such as telephone and internet systems). It also emphasizes the need for green infrastructure, such as climate-friendly railways and waterways, and low-carbon, clean, and renewable energy projects. It covers both “hard” infrastructure (i.e., the long-term physical structures, equipment, and facilities [including maintenance], and the economic services they provide) and “soft” (facilitating) infrastructure (i.e., the policy, regulatory, and institutional frameworks that support the development and operation of hard infrastructure).
While this study focuses on regional infrastructure, it must also give due consideration to national infrastructure, not least as one cannot always neatly distinguish between them. Regional infrastructure is explained and defined more fully in Box 1.1. The study does not cover, except in passing, nonconnective infrastructure, such as water and sanitation. Nor does it look at social infrastructure, such as housing, schools, and hospitals, which are vitally important but outside this study’s scope.
The study covers Japan and Brunei Darussalam plus ADB’s 44 developing member countries (DMCs) in the Asia and Pacific region.

20
Infrastructure for a Seamless Asia
Box 1.1. What Is Regional Infrastructure?
In one sense, nearly all infrastructure is national—or indeed local—in that it is situated in a single country. Among the exceptions are bridges and tunnels that connect two countries, along with power lines, pipelines, and fiber
optic cables that may span several countries. But many national infrastructure projects have a wider regional dimension: they may be planned and coordinated with several countries, connect to existing regional networks, or have spillover effects on neighboring countries. For example, a road within the Lao People’s Democratic Republic (Lao PDR) that connects to the border with Thailand will have an impact on Thailand even if it is built without consultation with the Thai government or consideration for its impact on Thailand. It may, for instance, stimulate trade with the area just across the border in Thailand. Clearly, though, both the Lao PDR and Thailand have an interest in coordinating their road building, so that their national road networks connect with each other.
Regional infrastructure ranges from simple projects that involve two countries, such as building a road link or bridge across a boundary river, to complex ones that involve several countries such as gas pipelines in which many countries cooperate and coordinate to create networks for common benefit. Soft infrastructure also has a regional dimension, since cross-border trade and movement often require, or at least benefit from, following common rules, standards, and procedures. For instance, rail connections are smoother if countries use the same rail gauge, and customs procedures are simpler and faster if countries harmonize their rules and standards.
For the purposes of this study, regional infrastructure projects are defined as:projects that involve physical construction works and/or coordinated policies and procedures spanning two or more neighboring countries; andnational infrastructure projects that have a significant cross-border impact:
their planning and implementation involve cooperation or »coordination with one or more countries;they aim to stimulate significant amounts of regional trade and »income; andthey are designed to connect to the network of a neighboring or third »country.
Infrastructure Needs and Regional Cooperation
21
These are listed in Table A1.1 of the Appendix and will be referred to as Asia for the sake of brevity. They span five subregions: Central Asia, East Asia, South Asia, Southeast Asia, and the Pacific. GDP data for these countries are presented in Table A1.1 and population data in Table A1.2 in the Appendix.
The remainder of this chapter presents the case for regional infrastructure and a framework for pan-Asian infrastructure cooperation, including the long-term vision of a seamless Asia. It then provides an overview of Asia’s regional infrastructure initiatives, setting the scene for subsequent chapters.
Why Regional Infrastructure?1.2.
Infrastructure plays a key role in promoting and sustaining rapid economic growth. The 1994 World Development Report Infrastructure for Development concluded that infrastructure investment was an important reason why East Asia’s growth was much faster than sub-Saharan Africa’s (World Bank 1994). More recent studies suggest that differences in infrastructure account for around one third of the difference in output per worker between Latin America and East Asia (Calderon and Serven 2004). Studies in several developing Asian countries illustrate how infrastructure, particularly roads and electricity, helps reduce poverty.1
Although Asia’s infrastructure has greatly improved in recent decades, investment has not kept pace with the demands placed on it by the region’s rapid economic growth (ADB 2007b). With Asia’s population set to rise by 15% by 2020, from 3.6 billion to 4.2 billion (see Table A1.2 in the Appendix for details), population growth is causing additional strain on Asia’s infrastructure.
Inadequate physical infrastructure is not only an impediment to growth, it is also one of the root causes of poverty. Asia is home to over 900 million people who survive on $1.25 or less a day and
1 For details, see Chapter 3 of this book.

22
Infrastructure for a Seamless Asia
around 1.8 billion people who manage on less than $2 a day (Bauer et al. 2008). Some 1.5 billion Asians lack access to decent sanitation, 640 million have no access to clean water, and 930 million are without electricity—over 700 million of them in South Asia alone (ADB 2007b). Only 3 in 10 Asians have access to a telephone, and a little under half of the region’s roads are unpaved. A more detailed overview of Asia’s existing infrastructure is provided in Chapter 2. Addressing the deficiencies of Asia’s national infrastructure is a priority, not least because it is the foundation of efforts to build wider subregional and regional transport, energy, and telecommunications networks.
Regional infrastructure is particularly important to Asia’s economic development. It can deliver the following benefits, which are also examined in greater detail in Chapter 3:
improve regional connectivity by making it faster, cheaper, and easier for people and goods to move across borders within the region;reduce the cost of regional (and global) trade, enhance the competitiveness of regional production networks, and promote greater investment;promote greater regional (and global) integration, and thus faster economic growth;help reduce poverty by improving poor people’s access to economic opportunities, lowering the cost of the goods and services that they consume, and providing better access to essential infrastructure services such as electricity;help narrow the development gap among Asian economies by providing small, poor, landlocked, and remote countries and areas with better access to wider regional (and global) markets and production networks, thereby stimulating investment, trade, and economic growth in those areas;promote more efficient use of regional resources, by developing regional projects that permit regional environment-friendly energy trade such as in gas and hydropower;ensure inclusive and environmentally sustainable economic growth by connecting isolated and landlocked areas to economic centers by utilizing greener technologies and providing opportunities for low-income populations; and

Infrastructure Needs and Regional Cooperation
23
help create a single Asian market, one that can engender large efficiency gains, increase regional demand, and invest Asia’s savings more productively.
As Asia’s outward-oriented economies have pursued closer integration with global markets, they have also become more closely intertwined among themselves. Many Asian economies are increasingly connected through trade, investment, finance, labor, and tourism, and other economic relationships. Intraregional trade in parts and components has grown particularly quickly. This reflects the development of regional production networks and supply chains that span Asia’s diverse economies, making the most of their comparative advantage. These have been a main driver of the region’s economic rise (Kawai 2005). Enhancing their competitiveness and extending them beyond the coastal regions of East Asia where they are currently concentrated is thus vital to Asia’s future success. Distant islands; rural and remote areas; and small, poor, and landlocked countries are often left behind in economic development because they are not connected to economic centers and wider regional and global markets. In part, this requires freer trade across Asia. But it also requires increased investment in regional infrastructure and enhanced regional cooperation, building up from progress at the national and subregional levels towards the ultimate aim of creating a truly seamless Asia.
Moreover, the current global financial and economic crisis may have major repercussions for Asian economies. If the current crisis is prolonged, demand from advanced economies for Asian exports will decelerate, depressing Asia’s production. To mitigate the medium-term consequences of the ongoing crisis, Asia needs to put greater emphasis on increasing regional demand. Thus, regional infrastructure geared more toward supporting Asian production networks and regional supply chains for intraregional trade to accommodate the expected increasing regional demand becomes more important. Amid weak global demand, Asian economies need to rely more on regional demand to sustain growth. Several Asian countries have been making efforts to stimulate domestic demand, and to alleviate the further impact of the growing crisis, by setting aside resources for infrastructure investment under their stimulus packages. At this stage, enhanced regional cooperation

24
Infrastructure for a Seamless Asia
has the potential to be an important platform that could complement these country-level efforts. By working together, countries in Asia can unlock their vast economic potential, achieve sustained and inclusive rapid growth, and reduce poverty. The need for regional collective action in developing Asia-wide physical connectivity is becoming increasingly important, particularly in this time of financial and economic crisis.
Framework for Regional 1.3. Infrastructure Cooperation
Asia’s economic integration has so far been market-led and marginally led by formal institutions (ADB 2008b). But it now requires closer cooperation in many areas, notably to improve physical regional infrastructure and to enhance the framework of rules and institutions that support the effective development and operation of regional infrastructure. Whereas inadequate infrastructure and institutions could constrain future growth, better ones could promote further growth and create new opportunities to spread its benefits and reduce poverty. This would support the competitiveness of Asia’s exports—benefiting consumers around the world as well as businesses that rely on Asian goods such as Korean steel, or services such as Indian information technology. It could also foster increased consumption and investment within Asia, helping to offset declines in demand in other regions and thus rebalance the global economy. Investment in regional infrastructure could thus benefit both Asia and the rest of the world.
By acting together through regional programs and cross-border projects, governments can help provide many goods and services—both public and private—better and more cheaply than they would be able to otherwise, as well as some goods and services that would otherwise not be provided at all. Regional integration also helps to improve the quality of institutions (Francois and Manchin 2007), so regional cooperation can help achieve national goals more efficiently. In providing regional public goods, individual countries can achieve far

Infrastructure Needs and Regional Cooperation
25
more together than they can alone. Collective action in infrastructure-related areas is required for the following reasons:
Regional connectivity is a public good. By reducing the cost of trading at a distance, regional connectivity expands markets and trade, producing large economic benefits that are spread widely across Asia. Connecting distant islands, landlocked countries, and inland and remote areas that remain isolated from economic centers, and regional and global markets is a particularly important element of regional connectivity. But public goods tend to be undersupplied by markets and individual governments for various reasons described in Chapter 3. Regional cooperation is therefore needed. The benefits of regional infrastructure spill over across borders due to large network and agglomeration effects. Countries therefore need to coordinate their infrastructure plans and infrastructure-related policies, for instance, by streamlining and harmonizing customs procedures, in order to harness those benefits. Participating countries need to address the asymmetric distribution of projects’ costs and benefits across countries so as to ensure “win-win” outcomes among them.Countries need to act together to tackle the negative socioeconomic spillovers of regional infrastructure projects—such as environmental damage, displaced people, traffic accidents, and human and drug trafficking—that cut across national borders. Regional infrastructure cooperation can also add value to national policymaking by sharing knowledge and best practices and by highlighting priorities that may run counter to domestic special interests. Asia’s investment in regional infrastructure should support its shift to a greener, low-carbon economy. Given Asia’s vast need for energy and its impact on the climate challenge, future energy supply plans, especially for power generation, need to shift towards a greater emphasis on energy efficiency and renewable energy sources. Efficiency gains from regional connectivity and energy trading will be essential. Transport will also need to get greener, with greater priority given to low-

26
Infrastructure for a Seamless Asia
carbon railways and waterways, and to the use of more fuel-efficient vehicles and cleaner fuels.
Long-Term Vision
This study’s long-term vision is the creation of a seamless Asia: an integrated region connected by world-class environment-friendly infrastructure networks that link national markets with distinct strengths, promote strong and sustainable economic growth, provide for people’s basic needs, and thus help reduce poverty. Achieving a seamless Asia will require the development of both “hard” and “soft” infrastructure. It includes:
building world-class interconnected environment-friendly regional transport networks of road, rail, sea, and air links that promote trade and investment within the region and with global markets, widen access to markets and public services, and thereby promote inclusive and sustainable economic growth and reduce poverty; developing greener cross-border energy projects that allow countries to benefit from natural endowments, providing efficient and secure supplies of electricity, coal, gas, oil, and alternative energies; expanding, deepening, and increasing the efficiency of regional production networks and supply chains by streamlining policies, systems, and procedures, such as customs procedures and other bureaucratic impediments that hamper regional and global connectivity; and developing stable and efficient regional financial markets that channel savings from around Asia and the rest of the world into productive investments, notably infrastructure, throughout the region.
A seamless Asia would help move the region’s economies towards an Asian single market with a huge wealth and diversity of resources and corresponding possibilities for trade and economic growth. Creation

Infrastructure Needs and Regional Cooperation
27
of Europe’s single market may have taken a very long time, however, Asia’s production, finance, and trade are better developed and connected now and can be used effectively to achieve integration in a relatively shorter time. Integration is a long-term goal that the region’s policymakers should pursue, for the sake of all Asians.
The section below presents various pan-Asian and subregional infrastructure initiatives in Asia. The institutional and policy aspects of these initiatives are further examined in Chapter 4.
Overview of Asia’s Regional 1.4. Infrastructure Initiatives
Regional cooperation can take various forms, including intergovernmental dialogue, information exchange, the common provision of regional public goods, and regional institution building (ADB 2008b). In the case of infrastructure, regional cooperation can play a number of roles. It can help identify, formulate, finance, and implement priority regional infrastructure projects and maintain existing ones. It can harness shared resources such as energy and water. It can harmonize cross-border rules, systems, and procedures and help countries learn from good practices concerning institutions, policies, and governance. This section reviews existing pan-Asian initiatives. It then outlines various subregional programs.
Pan-Asian Initiatives
Foremost among the existing pan-Asian infrastructure initiatives is the Asian Land Transport Infrastructure Development (ALTID), established in 1992 by the United Nations Economic and Social Commission for Asia and the Pacific (UNESCAP). ALTID is comprised of three pillars: the Asian Highway (AH), the Trans-Asian Railway (TAR), and the facilitation of land transport projects through intermodal transport terminals (dry and inland ports).
28
Infrastructure for a Seamless Asia
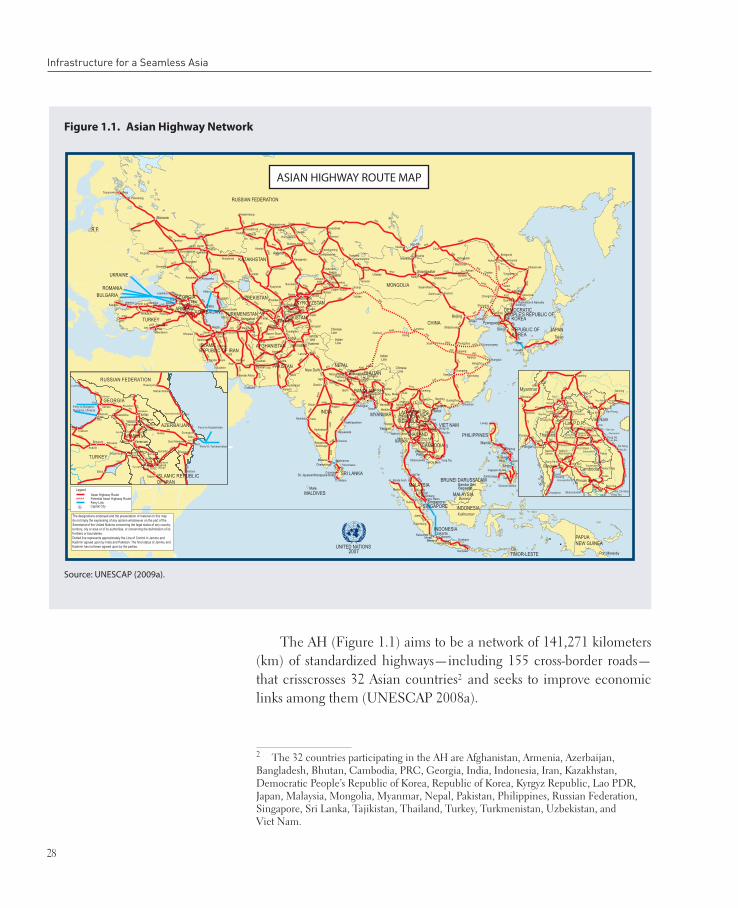
The AH (Figure 1.1) aims to be a network of 141,271 kilometers (km) of standardized highways—including 155 cross-border roads—that crisscrosses 32 Asian countries2 and seeks to improve economic links among them (UNESCAP 2008a).
2 The 32 countries participating in the AH are Afghanistan, Armenia, Azerbaijan, Bangladesh, Bhutan, Cambodia, PRC, Georgia, India, Indonesia, Iran, Kazakhstan, Democratic People’s Republic of Korea, Republic of Korea, Kyrgyz Republic, Lao PDR, Japan, Malaysia, Mongolia, Myanmar, Nepal, Pakistan, Philippines, Russian Federation, Singapore, Sri Lanka, Tajikistan, Thailand, Turkey, Turkmenistan, Uzbekistan, and Viet Nam.
Figure 1.1. Asian Highway Network
Source: UNESCAP (2009a).
AH81
Mandalay
Meiktila
Payagyi
Kyaing Tong
Yangon
Myanmar
Chiang Rai
TakUdonthani
Khon Kaen
Bang Pa-in
Chumphon
LaemChabang
Lao P.D.R.
Sihanoukville
Hai Phong
Vinh
Da Nang
Dong Ha
Kunming
Jinghong
Viet Nam
Vung Tau
Thaton
Bangkok
PakseHin Kong
Kabin Buri
NakhonRatchasima
NakhonSawan
Qudomxai
Phitsanulok
Hanoi
AH14
AH14
AH14
AH1
AH1
AH1
AH1
AH1
AH1
Thailand
HuaiKon
AH13AH1
AH14
AH1
AH1
AH1
AH1
AH1
AH11AH11
AH11
AH1
AH16
AH15
AH15
AH11
AH16
AH12
AH12
AH12
AH13 Vientiane
AH16
AH12
AH19
AH1
AH2
AH2
AH3
AH3
AH3
AH2
AH19
Nanning
AH1
Phnom Penh
Mae SaiTachilek
MuseRuili
HekouLao Cai
Huu Nghi Youyiguan
PoipetVeunkham
Trapeangkreal
Moc BaiBavet
Ban Lao
Daluo
Mongla
Savannakhet
NateuyBoten
Mohan
HouayxayChang Khong
Nong Khai
Cau TreoKeoneua
NakhonPhanom
Mukdahan
Lao Bao
Densavanh
Aranyaprathet
Cambodia
Mae SotMyawadi
Muang Ngeon
Sino
Thakhek
Bien Hoa
Ho Chi Minh
Stung Treng
Hoi An
Kratie
Uttaradit
Hoa Binh
ASIAN HIGHWAY ROUTE MAP

Infrastructure Needs and Regional Cooperation
29
The TAR network (Figure 1.2) aims to span 141,000 km of railways across 28 countries,3 linking to the pan-European rail network at various locations, offering connections to major ports in Asia and Europe, and thus providing landlocked countries with improved access to seaports either directly or in conjunction with highways (UNESCAP 2009b).
3 The 28 countries participating in TAR are Azerbaijan, Bangladesh, Belarus, Cambodia, Democratic People’s Republic of Korea, Georgia, India, Indonesia, Kazakhstan, Kyrgyz Republic, Lao PDR, Malaysia, Mongolia, Myanmar, Nepal, Pakistan, PRC, Poland, Republic of Korea, Russian Federation, Tajikistan, Thailand, Turkey, Turkmenistan, Singapore, Sri Lanka, Uzbekistan, and Viet Nam.
Figure 1.2. Trans-Asian Railway Network
Source: UNESCAP (2009b).
TRANS-ASIAN RAILWAY NETWORK

30
Infrastructure for a Seamless Asia
The third pillar, facilitating land transport, involves integrating road, rail, sea, and air links through improved logistics and intermodal interfaces. Its priorities are interconnecting the AH and TAR networks with seaports and establishing 700 “dry ports”4 in landlocked countries by 2015.5
In the energy sector, since 2006, the United Nations has started the regional initiative on a trans-Asian energy system for enhancing regional energy security for sustainable development in the 21st century. The trans-Asian energy system could be defined as an “Asia-wide integrated energy system linking and synergizing subregional energy systems.” (UNESCAP 2008d: 9). This system would aim to achieve greater cooperation, coordination, and integration—allowing countries to share information and expertise, leading to a system of transboundary energy trade and exchange. An integrated regionwide energy system would allow countries to balance supply and demand within the region in an efficient manner—opening up the potential for energy trade between countries that do not share borders or belong to the same subregion. This would benefit both supplying and consuming countries as well as countries of transit. However, it remains just a proposal (UNESCAP 2008d).
Subregional Initiatives
In view of Asia’s diversity, wherein countries differ in size, income levels, population, natural resources, and access to both regional and global markets, connectivity has been enhanced through several subregional infrastructure initiatives in the last few decades. A list of these initiatives is provided in Table 1.1, and an overview of each program is given below.
4 UNESCAP (2008a) defines a “dry port” as an inland location with functions similar to those of a seaport for the consolidation and distribution of goods. It distinguishes three types of modal interchange facilities that process border trade and provide full customs services: dry ports, inland container depots, and freight villages. Dry ports can process all forms of cargo, while inland container depots can process only containers.5 UNESCAP (2008b) estimates that 740 new container berths will be needed by 2015 in the United Nations Economic and Social Commission for Asia and the Pacific region, at a cost of $51 billion.

Infrastructure Needs and Regional Cooperation
31
Association of Southeast Asian Nations (ASEAN) is a formal grouping composed of 10 member countries with a broad mandate including infrastructure development. It recognizes that integrated energy, transport, and communication networks are vital for regional trade and investment, and hence for a thriving regional economy. But members’ geography and disparities in development pose big challenges. Deep seas and high mountains separate many of them, and funding expensive regional links is thus particularly difficult. While member countries fund infrastructure projects nationally, ASEAN seeks to promote greater cooperation and coordination among
Table 1.1. Subregional Cooperation Programs in Asia
Note: a Iran is an observer.
NameYear
EstablishedMembers
Association of Southeast Asian Nations (ASEAN) 1967
Brunei Darussalam, Cambodia, Indonesia, Lao People’s Democratic Republic (Lao PDR), Malaysia, Myanmar, Philippines, Singapore, Thailand, and Viet Nam
Bay of Bengal Initiative for Multi-Sectoral Technical and Economic Cooperation (BIMSTEC)
1997 Bangladesh, Bhutan, India, Myanmar, Nepal, Sri Lanka, and Thailand
Brunei Darussalam-Indonesia-Malaysia-Philippines–East ASEAN Growth Area (BIMP-EAGA)
1994 Brunei Darussalam plus provinces in Indonesia, Malaysia, and Philippines
Central Asia Regional EconomicCooperation (CAREC) 1997
Afghanistan, Azerbaijan, Kazakhstan, Kyrgyz Republic, Mongolia, Tajikistan, Uzbekistan, plus the Xinjiang Uygur Autonomous Region and the province of Inner Mongolia of the People’s Republic of China (PRC)
Greater Mekong Subregion (GMS) 1992 Cambodia, Lao PDR, Myanmar, Thailand, Viet Nam, plus Guangxi and Yunnan provinces of the PRC
Indonesia-Malaysia-Thailand Growth Triangle (IMT-GT) 1993 Provinces in Indonesia, Malaysia, and Thailand
Pacific Islands Forum (PIF) 1971
Australia, Cook Islands, Fiji Islands, Kiribati, Marshall Islands, Federated States of Micronesia, Nauru, New Zealand, Niue, Palau, Papua New Guinea, Samoa, Solomon Islands, Tonga, Tuvalu, and Vanuatu
South Asian Association for Regional Cooperation (SAARC) 1985 Afghanistan, Bangladesh, Bhutan, India, Maldives, Nepal,
Pakistan, and Sri Lanka
South Asia Subregional Economic Cooperation (SASEC) 2001 Bangladesh, Bhutan, India, and Nepal
Subregional Economic Cooperation in South and Central Asia (SECSCA)a 2003 Afghanistan, Pakistan, Tajikistan, Turkmenistan (associate), and
Uzbekistan

32
Infrastructure for a Seamless Asia
them. Its four flagship regional infrastructure programs are the ASEAN Power Grid, the Trans-ASEAN Gas Pipeline, the ASEAN Highway Network, and the Singapore-Kunming Rail Link. It also has programs to promote energy efficiency and renewable energy.
The Brunei Darussalam-Indonesia-Malaysia-Phillipines East ASEAN Growth Area (BIMP-EAGA), made up of provinces of three countries plus Brunei Darussalam, also seeks to expand opportunities for trade and investment through infrastructure development. With ADB as its development adviser, regional infrastructure projects have focused on air and maritime services, as well as software aspects. Airport and seaport facilities have been upgraded to accommodate an expected increase in passenger and cargo traffic from more regular air and sea links.
Bay of Bengal Initiative for Multi-Sectoral Technical and Economic Cooperation (BIMSTEC), comprised of countries in South Asia and Southeast Asia, has economic integration through a free trade agreement as its main objective. A framework agreement for this was signed in 2004 but has yet to be implemented. BIMSTEC has 13 priority sectors, and in 2008, together with ADB as its development partner, it completed a study to help promote and improve transport infrastructure and logistics among its member countries. In 2004, the BIMSTEC Trilateral Highway project linking India, Myanmar, and Thailand, with a total length of 1,360 km, was taken up by member countries to improve transport links and promote trade and tourism in the subregion.
Central Asia Regional Economic Cooperation (CAREC) is an informal forum involving eight Central Asian countries and six multilateral institutions, that generally aims for regional integration and trade, with infrastructure (transport and energy) as one of its major functions. CAREC’s mandate is to promote development through cooperation following a long-term strategic framework and a comprehensive action plan, which provides strategic direction and is updated annually. It aims to enhance energy security through regional energy projects. CAREC’s strategic transport framework for 2008–2018 has three goals: to establish competitive transport corridors across the

Infrastructure Needs and Regional Cooperation
33
subregion; to make it easier for people, goods, and vehicles to cross borders; and to develop safe, people-friendly transport systems that are environmentally sustainable and affordable (CAREC 2009). Six transport corridors have been proposed:
Europe-East AsiaMediterranean-East AsiaRussian Federation-Middle East and South AsiaRussian Federation-East AsiaEast Asia-Middle East and South AsiaEurope-Middle East and South Asia
The aim of developing these transport corridors is to improve connections to regional and world markets.6 Other potential corridors have also been identified: an east-west one and a north-south one (ADB 2006e). Eighty-two transport projects with an estimated cost of $19.9 billion and 43 energy projects ($18.6 billion) have been identified.
Greater Mekong Subregion (GMS) is another informal institution involving five countries as well as two provinces of the PRC. Its main goal is integration, and its main functional areas are trade and infrastructure. An important focus of the GMS Economic Cooperation Program is improving connectivity in the subregion by improving transport, energy, and telecommunications links. Projects number 73 in transport with an estimated cost of $18.3 billion, 32 in energy ($6.0 billion), 35 in trade and facilitation ($453 million), and 26 in telecommunications ($356 million).
Indonesia-Malaysia-Thailand Growth Triangle (IMT-GT), composed of provinces in three countries, aims to expand opportunities for trade and investment through improved infrastructure and
6 Four transport corridor segments that require immediate improvement were identified: in Corridor 1, the Kazakhstan Road Segment from Korgas at the PRC border to Zhaisan at the Russian Federation border via Almaty and Shymkent; in Corridor 2, the Kyrgyz Road Segment from Biskeke to Torugard at the PRC border and the route that links the Kyrgyz Republic and other Central Asian countries to the PRC; in Corridor 2, the Azerbaijan Railway Segment from Baku to Beyok Kesik at the Georgia border, which is an important transit route for oil and oil products from Kazakhstan and Turkmenistan to European markets; and in Corridor 4, the Mongolia segment connecting Yarant at the PRC border to Ullanbaishint at the Russian Federation border.

34
Infrastructure for a Seamless Asia
connectivity. To date, IMT-GT has undertaken several regional infrastructure projects and identified five economic connectivity corridors.7 Together with ADB, its development partner since 2006, it provides capacity-building support, helps mobilize technical and financial resources, and helps promote an enabling environment for private sector development (IMT-GT 2009).
Pacific Island Forum (PIF) consists of 16 Pacific island countries and aims to strengthen regional integration through the Pacific Plan for Strengthening Regional Cooperation and Integration, which was endorsed in 2005. This aims to expand trade in goods and services, notably by implementing regional tourism marketing and investment plans, implementing regional transport services plans, as well as planning and implementing national sustainable development strategies. The PIF program also attempts to enhance governance mechanisms and strategies as well as associated legislation for maritime and aviation security and surveillance (PIF Secretariat 2007).
South Asian Association for Regional Cooperation (SAARC) is composed of countries in South Asia, and its main objective is economic integration through the South Asia Free Trade Area. A SAARC Regional Multimodal Transport Study, conducted with ADB financial and technical assistance, identified 10 road corridors, 5 rail corridors, 10 inland or maritime gateways, and 7 aviation gateways.
South Asia Subregional Economic Cooperation (SASEC) is made up of four countries in South Asia. The initiative was launched in 2001, with ADB providing technical assistance. In 2007, the SASEC information highway project was approved, with technical assistance financed from the Regional Cooperation and Integration Fund. Six transport and energy projects are ongoing or in the pipeline, at an estimated cost of $56 million. There is huge potential for energy trade and cooperation in the subregion as there is hydropower potential in Nepal and Bhutan, coal in the Indian states of West Bengal and Bihar, and oil and gas in Bangladesh and in the Indian states of Assam and
7 The five corridors include: (i) Extended Songkhla-Penang-Medan; (ii) Straits of Melaka; (iii) Banda Aceh-Medan-Pekanbaru-Palembang; (iv) Melaka-Dumai; and (v) Ranong-Phuket-Aceh.

Infrastructure Needs and Regional Cooperation
35
Tripura. SASEC’s vision is to develop, utilize, and optimize power links, but there has been limited progress so far.
Subregional Economic Cooperation in South and Central Asia (SECSCA) is composed of countries in South and Central Asia. It aims to promote transport connectivity and facilitate the movement of goods and people across South and Central Asia. Key to achieving these goals is developing efficient transport corridors that connect landlocked Central Asian republics to ports in the Arabian Sea and the Persian Gulf via Afghanistan. With ADB’s technical assistance, a plan for two transport corridors, north-south and east-west, was formulated in 2006 (Asia Regional Integration Center 2009). But due to the continuing conflict in Afghanistan, very little progress has been made.
At present, regional infrastructure cooperation in Asia is relatively underdeveloped. In general, limited progress has been made with various pan-Asian initiatives. Although achievement has been made with respect to intergovernmental agreements of participating countries, much remains to be done with the physical construction of the AH and the TAR, while the Trans-Asian Energy System remains merely a proposal. Subregional cooperation has increased since the early 1990s with the support of ADB, but here, too, progress has been slow, with the notable exception of the GMS. However, subregional initiatives have advanced further than pan-Asian ones.
Within ASEAN, the very few completed projects are bilateral—for example, between Malaysia and Singapore—rather than regional. Almost all successfully completed, or under serious consideration, regional projects are in energy, transport, and telecommunications. In the GMS, the focus has been on building new domestic infrastructure (such as road corridors and power transmission grids) and connecting them across national borders (for instance by building bridges and completing missing segments), so as to develop new corridors within and among countries. Central Asia is seeking to develop regional transport and energy networks, building on the success of the Almaty-Bishkek road and existing privately funded oil and gas pipelines. In South Asia, the regional projects are mostly bilateral, mainly involving

36
Infrastructure for a Seamless Asia
India seeking to import power from neighboring countries (such as Bhutan) capable of exporting hydropower.
The immediate priority of the region is to develop and integrate existing subregional programs towards a seamless Asia. These can act as building blocks towards creating an integrated region connected by world-class, environmentally-friendly infrastructure networks.
Plan of the Study1.5.
This study is organized into four major themes or focus areas, namely: (i) trade, logistics, and investment; (ii) regional infrastructure network; (iii) policies and institutions; and (iv) financing infrastructure. Chapter 2 identifies major challenges facing the region on trade, logistics, and investment, focusing on international and intraregional issues and examining not only investment-related issues but also policy and institutional aspects. It also provides an analysis of the relationship between existing infrastructure and costs of major traded goods and services, as well as an analysis of challenges and opportunities that can be overcome by improved logistics.
Chapter 3 discusses the economics of an infrastructure network and examines the benefits of regional infrastructure networks and presents new empirical evidence to support the cases in Central, South, and Southeast Asia in terms of economic welfare and poverty. In addition, it estimates the benefits of Asia-wide infrastructure investment in terms of real income gain.
Chapter 4 examines policy and institutional issues as they define the overall environment for effective infrastructure development, notably how to ensure that they promote sustainable development and green infrastructure. In particular, it reviews existing legal, regulatory, and institutional frameworks and policies in Asia and other regions, and suggests what institutions and policies need to be in place to ensure sustainability and effectiveness of regional infrastructure projects. In addition, it provides a policy and institutional framework for a seamless Asia.

Infrastructure Needs and Regional Cooperation
37
Chapter 5 estimates the region’s infrastructure financing needs and provides recommendations on how to fill in the huge gap in financing infrastructure investment in Asia. It examines the experiences of Asia and other regions for enhancing public-private partnerships (PPP) in infrastructure investment and building regional financial infrastructure for intermediating surplus funds in the Asian region for infrastructure projects that can enhance regional connectivity.
In the concluding chapter, the study proposes major policy recommendations, lessons learned for effective infrastructure development through possible regional cooperation initiatives, and a framework for pan-Asian infrastructure cooperation towards a seamless and integrated Asia.

Supporting
Regional Trade and
Investment
Chapter 2

Supporting Regional Trade and Investment
41
Asia’s reemergence as an economic powerhouse in recent decades—and its recovery from the 1997–1998 financial crisis—owes much to the expansion of its international trade. This has been fostered by the development of supporting infrastructure, both hard (physical) and soft
(institutional), and of efficient logistics services—the well-managed distribution and storage of goods, services, and related information through firms’ supply chains—that make the best possible use of trade-related infrastructure.8
Investments in production facilities and the resulting trade depend on infrastructure investments that reduce trade costs, improve access to markets and suppliers, and enhance international competitiveness. Through a virtuous cycle of infrastructure development, outward-oriented policies, and integration into global supply chains and regional cooperation frameworks, Asia stimulates trade and foreign investment, benefiting from market-driven integration. As logistics have improved and openness to foreign direct investment (FDI) has increased, international supply chains that crisscross the region have developed, supported by greater financial integration. For instance, a product for export to the United States (US) may be assembled in the PRC from parts manufactured around the region. And as economies
8 Between 1975 and 1995, developing Asia’s port capacity swelled from 3 million to 62 million twenty-foot-equivalent units (TEU)—an average annual expansion of over 15%. Over the same period, airfreight shipments in the region soared from under 2 billion to over 30 billion ton-kilometers, an annual rise of some 14% (Brooks 2008).
2. Supporting Regional Trade and
Investment

42
Infrastructure for a Seamless Asia
become more deeply involved in global production networks, they can benefit more from trade-related infrastructure investment, notably in transport and telecommunications.9
Asia’s trade-supporting infrastructure now needs further improvements to maintain the competitiveness of existing production networks and widen their benefits, notably to inland areas. For example, almost two thirds of the cost of transporting goods from Chongqing in the PRC to the west coast of the US is incurred within the PRC, in transit to the port from which the goods are exported (Ma and Zhang 2009). Willoughby (2004) found that transport costs for a typical landlocked country were 50% higher than for a coastal country, that trade volumes were 60% lower, and that a 10% reduction in transport costs would increase trade by 25%. A multicountry study showed that a 20% reduction in logistics costs would increase the share of trade in GDP by more than 10 percentage points in Cambodia, the PRC, and the Lao PDR; by more than 15 in Mongolia; and by more than 20 in Papua New Guinea (Carruthers and Bajpai 2003). A background paper prepared for this study (Bhattacharyay and Rahman 2009) found that improvements in both physical infrastructure and the rules and regulations supporting it significantly increased trade in Asia.10 Brooks (2008) concluded from the available empirical evidence that countries with better trade-supporting infrastructure trade more.
9 Francois and Manchin (2007) found that infrastructure is a key determinant not only of export levels, but also of the likelihood of exporting at all. 10 The study used a gravity model covering PRC; India; Japan; Republic of Korea; Taipei,China; and seven ASEAN countries (Cambodia, Indonesia, Malaysia, Philippines, Singapore, Thailand, and Viet Nam) between 2002 and 2006. Physical infrastructure was measured through a composite index of telecommunications (fixed-line and mobile-phone subscribers per 100 people) and transport (kilometers of roads and railways per thousand people) infrastructure. Soft infrastructure was measured through a composite index of three attributes of a country’s business environment. These attributes are: (i) time required to enforce a contract—i.e., from the filing of a lawsuit to the final judgement to, when necessary, payment; (ii) time required to start a new business; and (iii) time to resolve insolvency—i.e., from filing for insolvency in court until the resolution of distressed assets.

Supporting Regional Trade and Investment
43
Improvements in logistics benefit an economy in several ways. They can reduce distribution margins, narrowing the gap between producer and consumer prices and thus improving economic welfare. They can lower firms’ marginal costs and generate greater economies of scale in production, transport, and marketing—increasing the potential for export (and domestic) sales. By increasing productivity and fostering international trade, better infrastructure also boosts economic growth and reduces poverty. And as it expands a country’s domestic markets and its export potential, infrastructure stimulates links among different sectors; encourages competition, innovation, and entrepreneurship; and generates a dynamic increase in growth. Supportive rules and institutions are as important as physical infrastructure. Predictable legal rights and procedures, a robust competition policy, and an effective regulatory framework are crucial. Financial services—including financial intermediation, risk management, payment and clearing services, and the availability of adequate credit and foreign exchange at reasonable rates—are especially important for facilitating international trade, as the current financial crisis has highlighted.
As Asian economies have liberalized their trade policies, infrastructure deficiencies have become an increasingly significant impediment to trade. In a study of eight sectors in 10 Asian countries, infrastructure quality and transport costs were found to be the leading determinants (along with tariffs) of cross-country variations in trade flows after controlling for distance. Infrastructure improvements would do more to lower the cost, and hence increase the volume, of trade in Asia than eliminating the remaining tariffs and nontariff barriers.11 A 10% reduction in transport costs (expressed as an ad valorem tariff equivalent) would boost Asia’s trade by 3–4% (De 2008). As Asia
11 Trade costs are a central determinant of trade volumes. For instance, Jacks et al. (2008) found that declining trade costs explain more than half of the pre-World War I (1870–1913) surge in global trade and around a third of post-World War II trade growth, while a steep rise in trade costs explains the entire trade collapse between the two wars.
44
Infrastructure for a Seamless Asia
multiplies its efforts to broaden and deepen regional trade through subregional forums such as ASEAN as well as wider ones such as ASEAN plus the PRC, Japan, and Korea (ASEAN+3), there is a growing need for regional cooperation to maximize the gains from the positive spillovers of investment in infrastructure networks. The potential gains are substantial: a virtuous circle whereby enhanced regional cooperation in trade and logistics bolsters Asia’s economic growth and integration, which in turn fosters greater investment in regional infrastructure, and so on.
This chapter presents an overview of the state of Asia’s trade-related infrastructure. It then discusses the rapid growth of Asia’s trade and how infrastructure improvements lower trade costs and facilitate trade. It identifies areas and means in which regional cooperation could aid the development of trade-supporting infrastructure, underpinning and extending regional production networks and responding to an ever-changing economic environment. The chapter also has an important section on an often-neglected area of potential trade: energy.
Overview of Asia’s Infrastructure2.1.
While some Asian countries have far better infrastructure than others, overall, the region remains below the world average in terms of both its quantity and its quality (ADB 2007b, Economic Research Institute for ASEAN and East Asia 2007). This section provides an overview of Asia’s transport, communication, and energy infrastructure, and an assessment of its quality. Tables A2.1 and A2.2 in the Appendix provide detailed comparative figures for road, rail, and air transport. Asian countries have very wide gaps in terms of infrastructure attainment, where the regional infrastructure inequalities between countries have widened rather than narrowed over time (Kumar and De 2008).

Supporting Regional Trade and Investment
45
Transport
Transport infrastructure has generally improved in the region in recent decades, albeit with huge variance by country and transport mode (UNESCAP 2006a). Countries with coastlines are more oriented towards their major ports, while internal land transport systems are not always properly linked due to a lack of comprehensive policies joining different transport modes and logistics networks.
Seaports have expanded rapidly over the last decade and a half. Singapore was the world’s busiest port in 2007, narrowly ahead of Shanghai. The ports of the PRC, together with those of Hong Kong, China and Taipei,China, accounted for more than 28% of world container port throughput in 2007. Tanjung Pelepas, established in Malaysia in 2001, has already surpassed New York despite its proximity to Singapore (UNCTAD 2008). The PRC’s current (2006–2010) five-year plan aims to increase port throughput volume by at least 80% and container throughput volume by 70%.
Air transport is soaring in much of Asia. The volume of goods and passengers carried by air grew much faster than in the rest of the world between 1996 and 2005, doubling in Asia and quadrupling in East Asia. However, airport infrastructure in Central and West Asia, Southeast Asia, and the Pacific lags behind East Asia.
Road coverage varies, improving in some countries while declining in others. Although paved-road coverage has improved in East and Southeast Asia, it has fallen in Central and West Asia, mainly due to poor maintenance and insufficient funding for upgrading existing road networks (Ziyadov 2008, World Bank 2008b).

46
Infrastructure for a Seamless Asia
The quality of the road network in East and Southeast Asia remains much lower than in Organisation for Economic Co-operation and Development (OECD) countries. Only 2% of the PRC’s highway network is expressways. Asia has a much lower road density per land area than the OECD average and significantly fewer roads per person (perhaps partly reflecting its higher population density), as Figure 2.1 shows.
Figure 2.1. Road Network Indicators by Region, 1996 and 2005
km2 = square kilometer; OECD = Organisation for Economic Co-operation and Development.Notes: East Asia (15) includes: Brunei Darussalam; Cambodia; Hong Kong, China; Indonesia; Lao People’s Democratic Republic; Malaysia; Mongolia; Myanmar; People’s Republic of China; Philippines; Republic of Korea; Singapore; Taipei,China; Thailand; and Viet Nam. Central and West Asia (8) includes: Armenia, Azerbaijan, Georgia, Kazakhstan, Kyrgyz Republic, Tajikistan, Turkmenistan, and Uzbekistan. South Asia (8) includes: Afghanistan, Bangladesh, Bhutan, India, Maldives, Nepal, Pakistan, and Sri Lanka. Other developing countries include 116 countries classified as developing by the International Monetary Fund.Source: World Bank (2007a, 2008b, 2009b).
Kil
om
ete
rsK
ilo
me
ters
Road Length per 100 km2 of Land Area
Road Length per 1 Million People
400
350
300
250
200
150
100
50
0
30,000
25,000
20,000
15,000
10,000
5,000
0
East Asia Central and
West Asia
South Asia Other Developing Countries
OECD World
East Asia Central and
West Asia
South Asia Other Developing Countries
OECD World

Supporting Regional Trade and Investment
47
Railways constitute another weak link. Except in East Asia, Asia’s rail network actually shrank between 1996 and 2005, as few new rail routes were created, while existing ones were not maintained. The region’s rail network totaled 182,000 km in 2005, around two fifths of OECD’s 472,000 km. The gap is even bigger when comparing rail lines per land area and per person (Figure 2.2). Worldwide, the volume of goods transported by rail increased between 1996 and 2005, with Asia recording an increase of around 50%. The PRC’s railway network, which accounts for 6% of the global total, struggles to move a quarter of the world’s rail freight.
Figure 2.2. Railway Indicators by Region, 1996 and 2005
km2 = square kilometer; OECD = Organisation for Economic Co-operation and Development.Notes: East Asia (15) includes: Brunei Darussalam; Cambodia; Hong Kong, China; Indonesia; Lao People’s Democratic Republic; Malaysia; Mongolia; Myanmar; People’s Republic of China; Philippines; Republic of Korea; Singapore; Taipei,China; Thailand; and Viet Nam. Central and West Asia (8) includes: Armenia, Azerbaijan, Georgia, Kazakhstan, Kyrgyz Republic, Tajikistan, Turkmenistan, and Uzbekistan. South Asia (8) includes: Afghanistan, Bangladesh, Bhutan, India, Maldives, Nepal, Pakistan, and Sri Lanka. Other developing countries include 116 countries classified as developing by the International Monetary Fund.Source: World Bank (2007a).
Railway Length per 100 km2 of Land Area
Railway Length per 1 Million People
6.0
5.0
4.0
3.0
2.0
1.0
0.0
700
600
500
400
300
200
100
0
Kil
om
ete
rsK
ilo
me
ters
Central and
West Asia
South Asia Other Developing Countries
OECD World
Central and
West Asia
South Asia Other Developing Countries
OECD World
East Asia
East Asia

48
Infrastructure for a Seamless Asia
Communication
Some 1.2 billion Asians subscribed to a telephone service in 2005, almost nine times as many as in 1996. Despite this dramatic increase, the region still lags behind OECD levels. East Asia has the highest telephone density in Asia, while South Asia has the lowest. Except for East Asia, all Asian subregions have a lower telephone density than in other developing countries (Figure 2.3). The number of internet users per 1,000 people has risen dramatically all over the world, increasing 14 times between 1996 and 2005. In Asia, the number increased more than 18 times, compared with 8 times in OECD countries. However, the majority of Asians still have only limited access to the internet.
Figure 2.3. ICT Indicators by Region, 1996 and 2005
ICT = information and communication technology; OECD = Organisation for Economic Co-operation and Development.Notes: East Asia (15) includes: Brunei Darussalam; Cambodia; Hong Kong, China; Indonesia; Lao People’s Democratic Republic; Malaysia; Mongolia; Myanmar; People’s Republic of China; Philippines; Republic of Korea; Singapore; Taipei,China; Thailand; and Viet Nam. Central and West Asia (8) includes: Armenia, Azerbaijan, Georgia, Kazakhstan, Kyrgyz Republic, Tajikistan, Turkmenistan, and Uzbekistan. The Pacific includes: Cook Islands, Democratic Republic of Timor-Leste, Federated States of Micronesia, Fiji Islands, Kiribati, Marshall Islands, Nauru, Papua New Guinea, Republic of Palau, Samoa, Solomon Islands, Tonga, Tuvalu, and Vanuatu. South Asia (8) includes: Afghanistan, Bangladesh, Bhutan, India, Maldives, Nepal, Pakistan, and Sri Lanka. Other developing countries include 116 countries classified as developing by the International Monetary Fund.Source: World Bank (2007a, 2008b).
Nu
mb
er
of
Pe
op
leN
um
be
r o
f P
eo
ple
Internet Users per 1,000 People
Telephone Mainlines per 1,000 People600
500
400
300
200
100
0
600
500
400
300
200
100
0
Central and
West Asia
The Pacific South Asia Other Developing
Countries
OECD World
Central and
West Asia
The Pacific South Asia Other Developing
Countries
OECD World
East Asia
East Asia
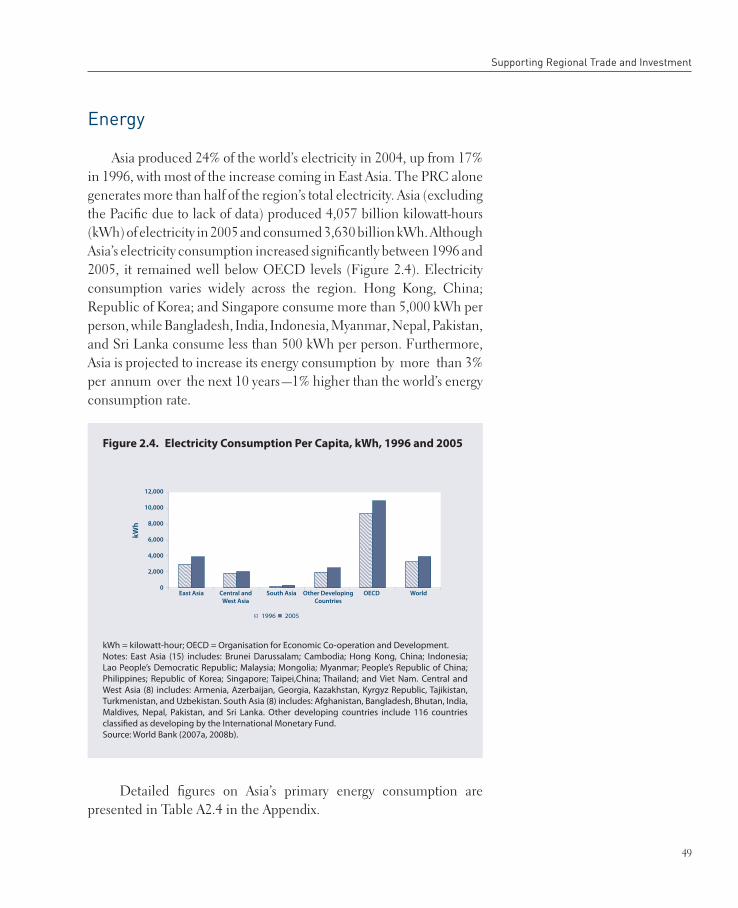
Supporting Regional Trade and Investment
49
Energy
Asia produced 24% of the world’s electricity in 2004, up from 17% in 1996, with most of the increase coming in East Asia. The PRC alone generates more than half of the region’s total electricity. Asia (excluding the Pacific due to lack of data) produced 4,057 billion kilowatt-hours (kWh) of electricity in 2005 and consumed 3,630 billion kWh. Although Asia’s electricity consumption increased significantly between 1996 and 2005, it remained well below OECD levels (Figure 2.4). Electricity consumption varies widely across the region. Hong Kong, China; Republic of Korea; and Singapore consume more than 5,000 kWh per person, while Bangladesh, India, Indonesia, Myanmar, Nepal, Pakistan, and Sri Lanka consume less than 500 kWh per person. Furthermore, Asia is projected to increase its energy consumption by more than 3% per annum over the next 10 years—1% higher than the world’s energy consumption rate.
Detailed figures on Asia’s primary energy consumption are presented in Table A2.4 in the Appendix.
Figure 2.4. Electricity Consumption Per Capita, kWh, 1996 and 2005
kWh = kilowatt-hour; OECD = Organisation for Economic Co-operation and Development.Notes: East Asia (15) includes: Brunei Darussalam; Cambodia; Hong Kong, China; Indonesia; Lao People’s Democratic Republic; Malaysia; Mongolia; Myanmar; People’s Republic of China; Philippines; Republic of Korea; Singapore; Taipei,China; Thailand; and Viet Nam. Central and West Asia (8) includes: Armenia, Azerbaijan, Georgia, Kazakhstan, Kyrgyz Republic, Tajikistan, Turkmenistan, and Uzbekistan. South Asia (8) includes: Afghanistan, Bangladesh, Bhutan, India, Maldives, Nepal, Pakistan, and Sri Lanka. Other developing countries include 116 countries classified as developing by the International Monetary Fund.Source: World Bank (2007a, 2008b).
kW
h
12,000
10,000
8,000
6,000
4,000
2,000
0East Asia Central and
West Asia
South Asia Other Developing
Countries
OECD World

50
Infrastructure for a Seamless Asia
Infrastructure Quality
Cross-country comparisons of infrastructure quality are bedeviled by measurement problems, statistical gaps, and the inherently subjective nature of such assessments. Table 2.1 presents one such assessment12 from the World Economic Forum’s (WEF) Global Competitiveness Report 2008–2009. The measurement is based on a survey of global business leaders’ perceptions13 and available data indicators14 (WEF 2008). It concludes that the quality of Asia’s infrastructure lags behind the world average, except in the case of railroads. Among subregions, East Asia is ranked highest and South Asia lowest. In 12 of the 22 Asian economies surveyed, the quality of infrastructure is deemed to be below the world average. There is a strong positive correlation15 between the WEF’s gauge of perceived infrastructure quality and its global competitiveness index,16 data on which are provided in Table A2.3 in the Appendix.
To sum up, Asia has made big improvements in its infrastructure, but there is still much more to do to bring its quantity and quality up to scratch.
12 Qualitative assessments are based on the computed country score calculated by calibrating results of the survey with available hard (quantity) assessments. Detailed information can be found in Chapter 2.1 of The Global Competitiveness Report 2008–2009 by the World Economic Forum (WEF).13 The Executive Opinion Survey is an annual survey conducted by the WEF that was completed by 12,297 top management business leaders in 134 countries. 14 Hard data include the infrastructure indicators on roads, railroads, ports, air transport, and electricity supply available from various international sources such as the International Air Transport Association, International Telecommunications Union, etc. 15 Correlation coefficient is 0.968 based on the pooled data of 2006, 2007, and 2008.16 Competitiveness is defined as the set of institutions, policies, and other factors that determine a country’s level of productivity. It is based on a weighted average of 12 pillars of economic competitiveness, namely institutions, infrastructure, macroeconomic stability, health and primary education, higher education and training, goods and market efficiency, financial market integration, financial market sophistication, technological readiness, market size, business sophistication, and innovation (WEF 2008).

Supporting Regional Trade and Investment
51
Table 2.1. Comparison of Asian Infrastructure Quality with the World, 2008
– data not available.Notes: Group of Seven (G7) countries include: Canada, France, Germany, Italy, Japan, United Kingdom, and United States. Score: 1 = underdeveloped, 7 = extensive and efficient by international standards.Source: World Economic Forum (2008).
Region/CountryOverall
InfrastructureRoad Railroad Port Air Transport
Electricity
Supply
World average 3.8 3.8 3.0 4.0 4.7 4.6
G7 countries average 5.7 5.7 5.4 5.4 5.8 6.4
Asia Average 3.8 3.7 3.6 3.9 4.6 4.1
Central Asia Average 3.5 3.1 3.6 3.2 4.2 3.6
Azerbaijan 3.9 3.7 4.0 4.2 5.2 3.9
Georgia 3.2 3.5 3.5 3.9 4.2 4.4
Kazakhstan 3.5 2.5 3.6 3.2 3.7 4.3
Tajikistan 3.2 2.6 3.3 1.6 3.5 1.7
East Asia Average 4.6 4.7 4.8 4.8 5.1 5.3
China, People’s Rep. of 3.9 4.1 4.1 4.3 4.4 4.7
Hong Kong, China 6.3 6.4 6.2 6.6 6.7 6.7
Korea, Rep. of 5.6 5.8 5.8 5.2 5.9 6.2
Mongolia 1.7 1.4 2.1 2.4 2.7 2.9
Taipei,China 5.5 5.6 5.7 5.5 5.7 5.9
South Asia Average 2.9 3.1 2.8 3.4 4.2 2.8
Bangladesh 2.2 2.8 2.3 2.6 3.4 1.9
India 2.9 2.9 4.4 3.3 4.7 3.2
Nepal 1.9 1.9 1.3 2.9 3.5 1.7
Pakistan 3.1 3.5 3.0 3.7 4.2 2.5
Southeast Asia Average 4.2 4.2 3.2 4.3 5.1 4.7
Brunei Darussalam 4.7 5.1 – 5.0 5.6 5.4
Cambodia 3.1 3.1 1.6 3.4 4.2 2.5
Indonesia 2.8 2.5 2.8 3.0 4.4 3.9
Malaysia 5.6 5.7 5.0 5.7 6.0 5.8
Philippines 2.9 2.8 1.8 3.2 4.1 4.2
Singapore 6.7 6.6 5.6 6.8 6.9 6.7
Thailand 4.8 5.0 3.1 4.4 5.8 5.5
Viet Nam 2.7 2.6 2.4 2.8 3.9 3.2
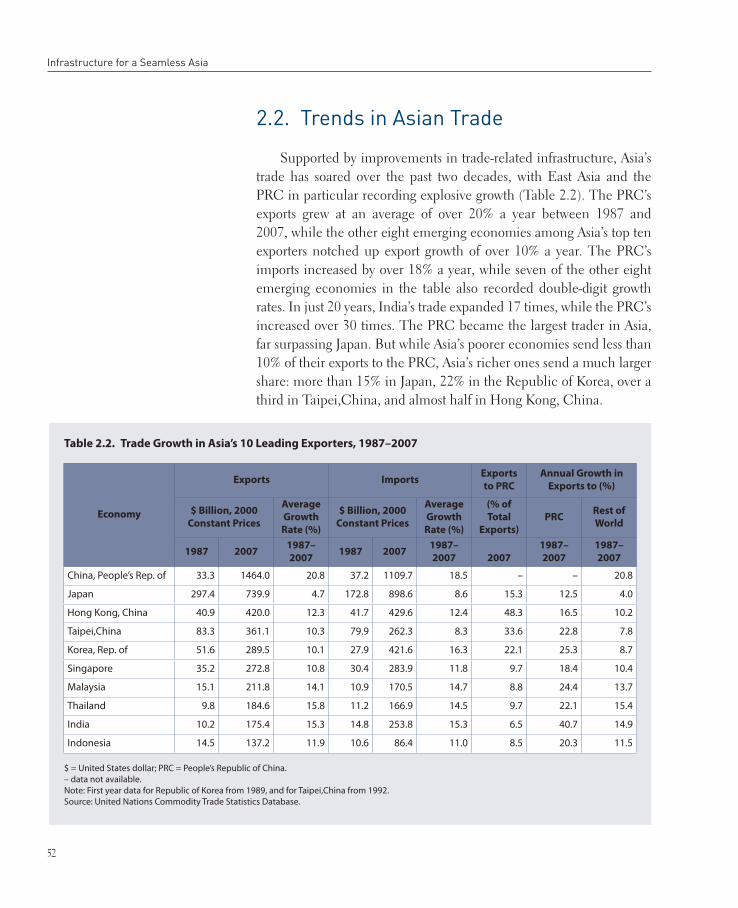
52
Infrastructure for a Seamless Asia
Trends in Asian Trade2.2.
Supported by improvements in trade-related infrastructure, Asia’s trade has soared over the past two decades, with East Asia and the PRC in particular recording explosive growth (Table 2.2). The PRC’s exports grew at an average of over 20% a year between 1987 and 2007, while the other eight emerging economies among Asia’s top ten exporters notched up export growth of over 10% a year. The PRC’s imports increased by over 18% a year, while seven of the other eight emerging economies in the table also recorded double-digit growth rates. In just 20 years, India’s trade expanded 17 times, while the PRC’s increased over 30 times. The PRC became the largest trader in Asia, far surpassing Japan. But while Asia’s poorer economies send less than 10% of their exports to the PRC, Asia’s richer ones send a much larger share: more than 15% in Japan, 22% in the Republic of Korea, over a third in Taipei,China, and almost half in Hong Kong, China.
Table 2.2. Trade Growth in Asia’s 10 Leading Exporters, 1987–2007
$ = United States dollar; PRC = People’s Republic of China.– data not available.Note: First year data for Republic of Korea from 1989, and for Taipei,China from 1992.Source: United Nations Commodity Trade Statistics Database.
Economy
Exports ImportsExports
to PRC
Annual Growth in
Exports to (%)
$ Billion, 2000
Constant Prices
Average
Growth
Rate (%)
$ Billion, 2000
Constant Prices
Average
Growth
Rate (%)
(% of
Total
Exports)
PRCRest of
World
1987 20071987–
20071987 2007
1987–
2007 2007
1987–
2007
1987–
2007
China, People’s Rep. of 33.3 1464.0 20.8 37.2 1109.7 18.5 – – 20.8
Japan 297.4 739.9 4.7 172.8 898.6 8.6 15.3 12.5 4.0
Hong Kong, China 40.9 420.0 12.3 41.7 429.6 12.4 48.3 16.5 10.2
Taipei,China 83.3 361.1 10.3 79.9 262.3 8.3 33.6 22.8 7.8
Korea, Rep. of 51.6 289.5 10.1 27.9 421.6 16.3 22.1 25.3 8.7
Singapore 35.2 272.8 10.8 30.4 283.9 11.8 9.7 18.4 10.4
Malaysia 15.1 211.8 14.1 10.9 170.5 14.7 8.8 24.4 13.7
Thailand 9.8 184.6 15.8 11.2 166.9 14.5 9.7 22.1 15.4
India 10.2 175.4 15.3 14.8 253.8 15.3 6.5 40.7 14.9
Indonesia 14.5 137.2 11.9 10.6 86.4 11.0 8.5 20.3 11.5

Supporting Regional Trade and Investment
53
Developing Asia now accounts for a much larger share of world trade, up from 13.8% in 1990 to 24.0% in 2007. Despite Japan’s share of world trade having fallen, Asia’s share of world trade rose from 22.7% in 1990 to 29.2% in 2007. East Asia accounts for the lion’s share of Asia’s trade. Excluding Japan, East Asia’s share of world trade soared by 9.2 percentage points between 1990 and 2007, from 13.0% to 22.2%, with the PRC’s share more than quadrupling from 1.9% to 8.8%.17 Trade within non-Japan East Asia grew faster (15.2% a year) than the region’s external trade (10.6%). Trade within non-Japan East Asia now accounts for 11% of world trade, up from 4.2%, while its external trade accounts for 11.3%, up from 8.7% (see Table 2.3).18
Including Japan, the 5.5 percentage-point growth of the share of East Asian exports in world trade (from 21.9% in 1990 to 27.4% in 2007) came mostly from trade within East Asia (which rose by 4.6 percentage points from 8.8% of world trade in 1990 to 13.4% in 2007). Trade with the PRC accounted for over half (2.6 percentage points) of that increase. East Asia’s trade with the PRC now accounts for 3.7% of world exports. Whereas the PRC accounted for 8.8% of East Asian exports in 1990, it accounted for 32.1% in 2007.
Intraregional trade accounts for a growing share of most regions’ trade—half of world trade takes place between partners less than 3,000 km apart (Berthelon and Freund 2004)—and this regional trend is particularly noticeable in East Asia (see Table 2.3).19 Trade within East Asia accounted for 49.4% of its exports in 2007, and grew faster (12.5% a year) between 1990 and 2007 than the region’s trade with the rest of the world (8.9%). Trade within East Asia also grew far faster than trade among North American Free Trade Agreement (NAFTA)
17 East Asia comprises 16 economies: Brunei; Cambodia; PRC; Hong Kong, China; Indonesia; Republic of Korea; Lao PDR; Malaysia; Mongolia; Myanmar; Philippines; Singapore; Taipei,China; Thailand; Viet Nam; and Japan.18 Calculated from United Nations Commodity Trade Statistics Database (S2, items-total).19 The elasticity of trade with respect to distance has been shown to be in the range of -0.9 to -1.5, indicating that trade over an 8,000 km distance tends to be 90% less than over a 1,000 km distance, other things being equal (Venables 2006).

54
Infrastructure for a Seamless Asia
Table 2.3. Trade in Asian Subregions and Other World Regions, 1990–2007
Total Exports ($ billion) Share of
1990 1995 2000 2005 2007 1990 1995
East Asia (15) 417.8 870.4 1,193.9 2,136.6 3,075.3 13.0 17.9Intraregional 136.1 344.7 456.4 901.7 1517.7 4.2 7.1Extraregional 281.7 525.7 737.5 1,234.9 1,557.6 8.7 10.8East Asia (16) 704.7 1313.3 1,673.1 2,731.5 3,789.5 21.9 27.1Intraregional 284.0 646.2 797.8 1,389.5 1,853.4 8.8 13.3Extraregional 420.7 667.1 875.3 1,342.0 1,936.1 13.0 13.7Central and West Asia – 5.6 14.9 34.7 62.2 – 0.2Intraregional – 1.9 1.2 2.9 3.9 – 0.1Extraregional – 3.7 13.7 31.8 58.3 – 0.1South Asia 27.2 43.7 60.7 125.8 194.4 0.8 0.9Intraregional 0.9 2.1 2.9 8.4 12.1 0.0 0.0Extraregional 26.3 41.6 57.8 117.4 182.3 0.8 0.9EU 1,521.6 2,010.8 2,424.3 4,054.3 5,316.8 47.2 41.4Intraregional 1,018.6 1,401.3 1,641.5 2,732.1 3,601.1 31.6 28.9Extraregional 503.0 609.5 782.8 1,322.2 1,715.7 15.6 12.6NAFTA 546.1 853.6 1,223.6 1,478.7 1,834.6 16.9 17.6Intraregional 225.8 392.9 681.6 824.4 930.8 7.0 8.1Extraregional 320.4 460.7 542.1 654.3 903.8 9.9 9.5MERCOSUR 64.6 89.1 122.5 219.4 324.3 2.0 1.8Intraregional 4.9 16.8 20.0 24.2 38.5 0.2 0.3Extraregional 59.7 72.3 102.5 195.2 285.8 1.9 1.5World Exports 3,224.8 4,853.9 6,233.1 9,859.0 13,830.0 100.0 100.0Japan 286.9 442.9 479.2 594.9 714.2 8.9 9.1PRC 62.1 148.8 249.2 762.0 1218.1 1.9 3.1United States 392.9 583.0 780.3 904.3 1162.2 12.2 12.0East Asia(16) to PRC 34.4 110.1 151.0 383.1 509.8 1.1 2.3
$ = US dollar; EU = European Union; MERCOSUR = Mercado Común del Sur; PRC = People’s Republic of China; NAFTA = North American Free Trade Agreement; US = United States. – data not available.Notes: 1. East Asia (15) includes: Brunei Darussalam; Cambodia; Hong Kong, China; Indonesia; Lao People’s Democratic Republic; Malaysia; Mongolia; Myanmar; PRC; Philippines; Republic of Korea; Singapore, Taipei,China; Thailand; and Viet Nam. 2. East Asia (16) includes: East Asia (15) plus Japan. 3. Central and West Asia (8) includes: Armenia, Azerbaijan, Georgia, Kazakhstan, Kyrgyz Republic, Tajikistan, Turkmenistan, and Uzbekistan. 4. South Asia (7) includes: Afghanistan, Bangladesh, India, Maldives, Nepal, Pakistan, and Sri Lanka. 5. EU includes its 27 members: Austria, Belgium, Bulgaria, Cyprus, Czech Republic, Denmark, Estonia, Finland, France, Germany, Greece, Hungary, Ireland, Italy, Latvia, Lithuania, Luxembourg, Malta, Netherlands, Poland, Portugal, Romania, Slovakia, Slovenia, Spain, Sweden, and United Kingdom. 6. MERCOSUR includes its 4 members and 1 prospective member: Argentina, Brazil, Paraguay, Uruguay, and Venezuela. 7. NAFTA includes its 3 members: Canada, Mexico, and the US. 8. Japan, PRC, and US share of intraregional exports in total is only intraregional exports (share of individual country’s export to the region in total region exports).9. Annual growth of Central and West Asia is for 1995–2005.Source: Calculated from United Nations Commodity Trade Statistics Database (S2, items-total) and International Monetary Fund Direction of Trade Statistics 2008.

Supporting Regional Trade and Investment
55
World Trade (%) Share of Intraregional Exports in Total (%)Annual
Growth (%)
2000 2005 2007 1990 1995 2000 2005 2007 1990–2007
19.2 21.7 22.2 100.0 100.0 100.0 100.0 100.0 12.57.3 9.1 11.0 32.6 39.6 38.2 42.2 49.4 15.2
11.8 12.5 11.3 67.4 60.4 61.8 57.8 50.6 10.626.8 27.7 27.4 100.0 100.0 100.0 100.0 100.0 10.412.8 14.1 13.4 40.3 49.2 47.7 50.9 48.9 11.714.0 13.6 14.0 59.7 50.8 52.3 49.1 51.1 9.4
0.3 0.6 0.4 – 100.0 100.0 100.0 100.0 22.20.0 0.0 0.0 – 33.4 8.1 8.4 6.3 6.40.3 0.5 0.4 – 66.6 91.9 91.6 93.7 25.71.0 1.3 1.4 100.0 100.0 100.0 100.0 100.0 12.30.0 0.1 0.1 3.5 4.7 4.8 6.7 6.2 16.20.9 1.2 1.3 96.5 95.3 95.2 93.3 93.8 12.1
38.9 41.1 38.4 100.0 100.0 100.0 100.0 100.0 7.626.3 27.7 26.0 65.9 62.1 61.1 59.7 67.7 7.712.6 13.4 12.4 34.1 37.9 38.9 40.3 32.3 7.519.6 15.0 13.3 100.0 100.0 100.0 100.0 100.0 7.410.9 8.4 6.7 41.3 46.0 55.7 55.8 50.7 8.7
8.7 6.6 6.5 58.7 54.0 44.3 44.2 49.3 6.32.0 2.2 2.3 100.0 100.0 100.0 100.0 100.0 10.00.3 0.2 0.3 8.9 20.5 20.9 13.1 11.9 12.91.6 2.0 2.1 91.1 79.5 79.1 86.9 88.1 9.6
100.0 100.0 100.0 – – – – – 8.97.7 6.0 5.2 12.2 14.4 11.7 10.4 8.8 5.04.0 7.7 8.8 5.8 6.2 6.9 11.0 12.2 18.2
12.5 9.2 8.4 14.8 13.1 11.4 7.7 7.1 5.72.4 3.9 3.7 12.1 17.0 18.9 27.6 27.5 17.2

56
Infrastructure for a Seamless Asia
(7.4%) and EU-2720 members (7.6%). But trade among and within other Asian subregions is still relatively small (Figure 2.5).
20 European Union (EU)-27 includes: Austria, Belgium, Bulgaria, Cyprus, Czech Republic, Denmark, Estonia, Finland, France, Germany, Greece, Hungary, Ireland, Italy, Latvia, Lithuania, Luxembourg, Malta, Netherlands, Poland, Portugal, Romania, Slovakia, Slovenia, Spain, Sweden, and the United Kingdom.
Figure 2.5. Intraregional Trade Flows in Asia, 2007 (as a percentage of Asia’s total trade)
ASEAN = Association of Southeast Asian Nations; SAARC = South Asian Association for Regional Cooperation.Notes: Central Asia includes: Kazakhstan, Kyrgyz Republic, Tajikistan, Turkmenistan, and Uzbekistan. Northeast Asia includes: Hong Kong, China; Japan; Mongolia; People’s Republic of China; Republic of Korea; and Taipei,China. Southeast Asia includes: Brunei Darussalam, Cambodia, Indonesia, Lao People’s Democratic Republic, Malaysia, Myanmar, Philippines, Singapore, Thailand, and Viet Nam (ASEAN). South Asia includes: Afghanistan, Bangladesh, India, Maldives, Nepal, Pakistan, and Sri Lanka (SAARC excluding Bhutan).Sources: International Monetary Fund Direction of Trade Statistics, December 2008; United Nations Commodity Trade Statistics 2006 for Taipei,China.
South Asia0.23
Southeast Asia3.62
Northeast Asia
18.74
CentralAsia 0.04
4.85
0.51
0.25
2.65
2.59
0.02
0.00
0.62
0.80
0.13 29.26
4.21
5.21
0.56
1.120.00
0.00
7.65
16.67 0.27

Supporting Regional Trade and Investment
57
Developing Asia’s imports from within the region have risen far faster than exports within the region. In 2005–2006, intraregional imports amounted to 58.6% of total imports, up from 41.5% in 1992–1993. The intraregional share in total regional exports was significantly lower, however, at 37.7% in 1992–1993 and 40.0% in 2005–2006 (Athukorala 2008). These figures underscore the continued importance to Asia of exports to the rest of the world—and of the infrastructure and logistics to facilitate them.
In all East Asian countries, the share of components in exports and imports within the region has increased much faster than in trade with the rest of the world (Athukorala 2008). In 2005–2006, exports within the region accounted for 60% of total component exports; for component imports, the share was even higher. The increase in component intensity has been particularly noticeable in Southeast Asia’s trade with the other developing East Asian economies, notably the PRC. The Republic of Korea and Taipei,China are also involved in substantial component trade with other countries in the region.
In addition to Asia’s trading pattern, the shape of its trade is also changing—and with it the region’s infrastructure needs. Asia’s trade is becoming lighter. The content of Asia’s trade is shifting from bulky goods towards lighter, often higher value goods and weightless services. In particular, the information and communication technology (ICT) revolution has generated increased trade in ICT products and outsourced services, as well as greater migration of highly skilled professionals. More generally, the weight-to-value ratio of Asia’s trade in goods is declining. This has important implications for the choice of transport mode, the distance and destination of trade flows, the location and fragmentation of production processes, and the demand for supporting infrastructure (Hummels 2009).
Changes in transport technology, notably improvements in air freight and containerization, have amplified these trends. Air cargo involving Asian countries has grown much faster than in the world as a whole, with international flights within Asia experiencing rapid growth. Multimodal shipping and improvements in logistics services
58
Infrastructure for a Seamless Asia
have made it possible to trade with more places in less time and often at lower cost (Brooks and Hummels 2009).
In Asia, only 1–5% of trade by value is among countries with a shared land border.21 Nearly all goods traded with non-adjacent partners move by air or sea. When infrastructure improvements lower the marginal cost of trade, exports tend to expand in two ways: new products are exported to new destinations, typically through small shipments from small firms, and existing trade flows deepen. When the new markets are inland, air transport may be a viable alternative to a combination of sea and land freight to avoid or reduce potential port congestion, and to save time.
Air has the huge advantage of speed—and advances in technology have made air transportation much cheaper in recent years. The cost of air freight fell by 90% between 1955 and 2004 (Hummels 2009).22 This makes long-distance trade more attractive and expands the range of potential export markets. The falling weight-to-value ratio of traded goods and the declining share of trade costs in delivered goods prices reinforce this pattern. In effect, economic distance is shrinking: trading with far-off markets is no longer much more expensive than trading with neighboring ones. Because the marginal cost of sending air cargo an additional mile is falling rapidly, the average air shipment is traveling for a longer distance while the average ocean shipment is going a shorter distance (Hummels 2007).
Another factor driving the rise in air freight is that, as consumers in rich countries get richer, their demand for higher quality imports rises. This affects demand for air transport in three ways: First, higher quality goods tend to be more expensive, so transport costs are a smaller share of the delivered price. Second, as consumers grow richer, so does their willingness to pay for particular product characteristics; producers therefore have an incentive to manufacture to specification, and to adjust production and shipments quickly and flexibly. Third, delivery speed is itself an important aspect of product quality for many
21 By comparison, around a quarter of world trade is between countries sharing a common border (Berthelon and Freund 2004).22 As measured by average revenue per ton-kilometer.

Supporting Regional Trade and Investment
59
consumers, and the demand for timely delivery is rising as incomes grow (Hummels 2009).
The combination of increased trade in parts and components within Asia and greater long-distance air shipments is generating many more (mostly small) new shipments, while the biggest existing shipments are getting even bigger. Thus, in the case of the PRC’s exports, the mean shipment is getting bigger, while the median is falling. The pattern in other Asian countries is similar (in some cases, both mean and median are falling, but medians are falling faster [Hummels 2009]).
In short, Asia’s trade expanded rapidly (until the current crisis). Trade within East Asia has risen particularly fast. Asia’s trade is becoming lighter and more valuable, and is increasingly shipped by air.
Infrastructure for Trade and 2.3. Investment
Given the importance of transportation, ICT, and trade facilitation measures in Asia’s trade and investment, this section briefly examines ways and means to develop trade and investment-related infrastructure and the associated challenges.
Trade Costs
Trade costs, in broad terms, include all costs incurred in getting goods from the production place to the final users or consumers rather than the cost of producing the goods themselves. For example, these costs include transportation costs (both freight and time), policy barriers (tariff and nontariff), transit delays, information costs, contract enforcement costs, costs associated with the use of different currencies, legal and regulatory costs, and local wholesale and retail distribution costs (Anderson and van Wincoop 2004).
Trade costs can account for a large share of the prices of delivered goods and thus influence demand. The quantity of infrastructure

60
Infrastructure for a Seamless Asia
investment, the quality of infrastructure services, and the efficient coordination of logistics services that lower trade costs influence trade performance in a variety of ways. Nordas and Piermartini (2004) highlighted four factors:
Direct monetary outlays on communications, business travel, freight, insurance, and logistics services are affected by the quality of infrastructure and the cost and quality of related services.Timeliness is even more likely to be influenced by geography and infrastructure.Risk of damaged cargo, and so of higher losses and insurance costs, are greater when infrastructure is poor.Lack of access to transport or telecommunications services can have a high opportunity cost, limiting market access and trading opportunities.
The relative importance of different categories of infrastructure-related trade costs can be surprising. For example, in 2005, the ocean freight rate for importing a container to India was around two thirds greater than for exporting, while the rate for importing a container to the PRC from six Asian countries was far lower than for exporting (De 2009a). Auxiliary shipping charges (such as documentation fees, container-handling charges, and government taxes and levies) may account for much of this difference; these are sometimes greater than ocean freight charges, particularly where shipments experience congestion at ports or borders. On average, auxiliary shipping charges outweigh terminal handling charges across countries and commodities in Asia, and their variations contribute significantly to variations in trade costs. Improvement in logistics services, including better cross-country coordination, could help to lower both their average cost and their variability. This is one important area where regional cooperation in strengthening soft infrastructure could help lower trade costs.
The composition of freight charges also varies significantly across countries and commodity categories. In some cases, inland freight charges are a smaller share of total freight charges than the charges for ocean freight. Often, however, they are greater (De 2009a). Thus, countries for which inland freight is particularly expensive need
Supporting Regional Trade and Investment
61
to focus their infrastructure efforts on improving inland services. Looking at different commodity groups, the weight-to-value ratio is the main determinant of transport costs, suggesting that the preferred means of transporting heavier cargoes is by sea, followed by rail and then by road.23 Landlocked countries and inland regions that export heavy goods should therefore consider prioritizing the development of streamlined rail connections to efficient ports. Rail has the added benefit of being a less carbon-intensive transport mode and hence more environmentally friendly than are roads.
Infrastructure and logistics need to adjust to the impact of changes in oil prices on trade. The high rise in oil prices in the first half of 2008 reached a record $142.99 per barrel in July (Powell and Clark 2009), raising shipping (and therefore import) costs, shifting the balance in favor of domestic (or nearby) producers. Such changes can have a double impact on products in international supply chains, since the prices of both imported inputs and exported final products rise. For example, PRC steel produced with Brazilian iron ore for export to the US would be hit twice by higher fuel charges (three times if including the cost of energy used in production). The impact of an increase in oil price is greater where the goods (or their imported components) are shipped by air or have a high weight-to-value ratio, and where fuel accounts for a higher share of freight costs. Decreases in oil prices and improvements in transport technology, on the other hand, would most likely have the opposite effect.
Time is also an important factor, particularly for perishable or other time-sensitive goods. Hummels (2001) found that the time cost of one day in transit for US imports is equivalent to an ad valorem tariff rate of 0.8%, implying the equivalent of a 16% tariff on an average trans-Pacific shipment of 20 days. Clearly, improvements in infrastructure services that reduce delays at borders, in transit, or in ports will increase a country’s propensity to trade. Encouragingly, the
23 Hummels and Skiba (2004) found that a 10% increase in the ratio of product weight to value results in a 4% increase in ad valorem shipping costs. Hummels (2007) noted that during 1960–2004 the real value of manufacturing trade grew around 1.5% a year faster than the weight of nonbulk cargoes. Including bulk commodities, the real value of all trade grew 1.8% a year faster than its weight, thus showing a relative decrease in the weight-to-volume ratio.
62
Infrastructure for a Seamless Asia
January 2008 maiden run of the Beijing–Hamburg container express rail service covered its 10,000 km journey in 15 days, compared with around 30 days for the comparable journey by sea (UNCTAD 2008).
The impact of trade costs and timeliness is particularly important in the case of inland areas and landlocked countries, as the next section discusses.
Access to Markets
As land and labor costs rise in Asia’s coastal regions, investors are looking to locate production facilities further inland. However, they are hampered by inadequate infrastructure connections, which raise transport costs to and from those areas. In the PRC, this realization has led to a shift in infrastructure policy to give greater weight to hinterland access. Railways, which are particularly suited to transporting bulk commodities, which constitute the greater share of production in inland provinces, have been prioritized. The shifting focus to inland regions magnifies the importance of seamless intermodal connections.
Improved infrastructure is vital for connecting remote areas and landlocked countries with regional and global markets. The median landlocked country has 55% higher transport costs than the median coastal one.24 Transporting goods over land is around seven times more costly than over a similar distance by sea, and estimates of the elasticity of trade flows with respect to transport costs range from -2 to -3.5, suggesting that lowering a landlocked country’s trade costs by 10% through regional infrastructure development could increase its exports by over 20% (Venables 2006).
The 12 landlocked countries25 in Asia—Afghanistan, Armenia, Azerbaijan, Bhutan, Kazakhstan, Kyrgyz Republic, Lao PDR, Mongolia, Nepal, Tajikistan, Turkmenistan, and Uzbekistan—are especially
24 Limao and Venables (2001) found that domestic infrastructure explains around 40% of transport costs for coastal countries, while domestic and transit-country infrastructure together account for an estimated 60% of transport costs for landlocked countries. 25 Landlocked countries are those that do not have access to an open sea. Some landlocked countries, such as Azerbaijan, have access to an inland sea, such as the Caspian.

Supporting Regional Trade and Investment
63
disadvantaged. Most are 700–1,000 km from the nearest port; four (Kazakhstan, Kyrgyz Republic, Tajikistan, and Uzbekistan) are over 3,000 km from the sea (UNESCAP 2007b). They struggle with poor physical infrastructure, small domestic markets that are remote from world markets, and high vulnerability to external shocks. Unless they are transported expensively by air, traded goods must transit through at least one neighboring state, and frequent changes in transport mode result in high transaction costs. Customs and transport inefficiencies hamper access to global markets, deter FDI, and raise the cost of imports. UNCTAD (2008) suggested that a multidimensional approach is needed to tackle these problems. This involves developing adequate national transport networks and efficient transit systems, promoting regional or subregional economic integration, and encouraging FDI in economic activities that are not distance sensitive. For example, in 1995, the United Nations General Assembly endorsed the Global Framework for Transit Transport Cooperation between Land-locked and Transit Developing Countries and the Donor Community with a view to enhancing transit systems and enabling landlocked and developing countries to reduce their marginalization from world markets.
Many other Asian countries have vast remote areas with poor connections to other domestic markets, as well as to international sea and air gateways. Low population density and geographic remoteness are exacerbated by inadequate transport infrastructure. Where markets are distant and trade volumes low, justifying the building and maintaining of even basic infrastructure is difficult. This creates a vicious circle.
In small and less-developed countries such as Bangladesh, Cambodia, Lao PDR, and Mongolia, roads are often closed; transport services may be suspended; and poor infrastructure requires the use of small, inefficient vehicles and vessels that have high operating costs. Transport systems are poorly integrated and lack streamlined procedures to support the seamless movement of containers between coastal and inland areas. Border procedures are often cumbersome and time consuming. Pacific island countries face particular challenges in transport, since shipping distances are large, and shipments are generally small and of relatively low value added.

64
Infrastructure for a Seamless Asia
Inland transport is particularly slow and expensive in South Asia. It accounts for around 88% of total trade transport costs in the subregion (De 2009b). Land border crossings are overcrowded, and greater policy attention to efficiency concerns could easily reduce delays and monetary costs. Complex border-crossing requirements expand possibilities for corruption and encourage informal trade. Unsurprisingly, trade within South Asia is low. There is therefore a strong case for subregional cooperation to improve soft infrastructure and inland transport so as to raise exporters’ competitiveness.
To sum up, large and landlocked countries probably need to put more emphasis on rail and road infrastructure in order to get goods to ports more cheaply. For Asia’s many landlocked countries, regional cooperation agreements on transit facilitation are particularly important.
Trade Facilitation and Soft Infrastructure
Bottlenecks at Asia’s borders often impede the efficiency of its logistics systems. Trade facilitation—streamlining the movement of goods and services across borders—is therefore vital. Physical facilities need to be improved so that shipments can move smoothly and quickly. Customs procedures also need to be simplified and harmonized so that exports do not incur costly delays. Complying with export requirements can take around a month in many Asian countries compared with only 11 days in the OECD (Table 2.4). The pattern is similar for importing, although the time and cost involved are slightly greater. Streamlining these procedures and costs should clearly be a priority.
At the same time, reducing bureaucracy and improving port efficiency should also be a priority for boosting Asia’s trade, since the vast bulk of it goes by sea. This is vital not just for nearby coastal regions, but also for inland areas and landlocked countries whose trade is channeled through road and rail links to ports. Infrastructure improvements that raise port efficiency can reduce shipping costs26.
26 Clark et al. (2004) found that infrastructure improvements that raise port efficiency from the bottom 25% to the top 25% can reduce shipping costs by more than 10%.
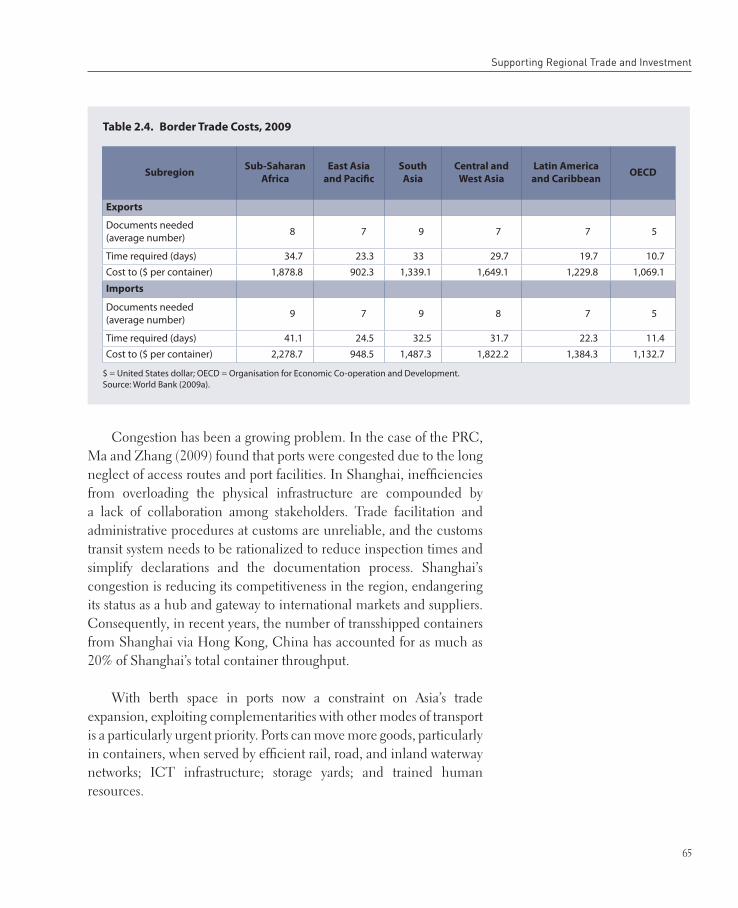
Supporting Regional Trade and Investment
65
Congestion has been a growing problem. In the case of the PRC, Ma and Zhang (2009) found that ports were congested due to the long neglect of access routes and port facilities. In Shanghai, inefficiencies from overloading the physical infrastructure are compounded by a lack of collaboration among stakeholders. Trade facilitation and administrative procedures at customs are unreliable, and the customs transit system needs to be rationalized to reduce inspection times and simplify declarations and the documentation process. Shanghai’s congestion is reducing its competitiveness in the region, endangering its status as a hub and gateway to international markets and suppliers. Consequently, in recent years, the number of transshipped containers from Shanghai via Hong Kong, China has accounted for as much as 20% of Shanghai’s total container throughput.
With berth space in ports now a constraint on Asia’s trade expansion, exploiting complementarities with other modes of transport is a particularly urgent priority. Ports can move more goods, particularly in containers, when served by efficient rail, road, and inland waterway networks; ICT infrastructure; storage yards; and trained human resources.
Table 2.4. Border Trade Costs, 2009
$ = United States dollar; OECD = Organisation for Economic Co-operation and Development.Source: World Bank (2009a).
SubregionSub-Saharan
Africa
East Asia
and Pacific
South
Asia
Central and
West Asia
Latin America
and CaribbeanOECD
Exports
Documents needed (average number) 8 7 9 7 7 5
Time required (days) 34.7 23.3 33 29.7 19.7 10.7Cost to ($ per container) 1,878.8 902.3 1,339.1 1,649.1 1,229.8 1,069.1
Imports
Documents needed (average number) 9 7 9 8 7 5
Time required (days) 41.1 24.5 32.5 31.7 22.3 11.4Cost to ($ per container) 2,278.7 948.5 1,487.3 1,822.2 1,384.3 1,132.7
66
Infrastructure for a Seamless Asia
Increasing port efficiency enables countries to reap large economies of scale. Accommodating larger, faster ships and expanding container facilities reduces the average time shipments spend at sea and in ports. Service tends to become more frequent, facilitating timely delivery. A densely traded route also enables an effective use of hub and spoke arrangements, in which small container vessels feed shipments into a hub where containers are aggregated into much larger and faster container ships for longer hauls.
Trade growth along a particular shipping route also encourages entry—and where permitted, new competition tends to drive down shipping margins, particularly when complemented by an effective competition policy that constrains monopoly power and removes barriers to entry (Brooks 2005). Hummels et al. (2007) found that ocean liners charge much higher freight rates for goods whose import demand is relatively inelastic, indicating that shipping firms are most likely exercising market power. In 2006, one in six importer-exporter pairs was served by a single liner service; over half were served by three or fewer.
A study of several Asian ports found that specific infrastructure investments significantly reduce port costs (Haveman et al. 2009). A new harbor, wharf, or terminal is estimated to decrease average port costs by 2%, while a new crane reduces port costs by 1%. Perhaps surprisingly, increasing the number of berths at ports and deepening channels have less effect. While Penang (Malaysia) has the lowest costs among the ports studied, Mumbai (India) experienced the greatest improvement in relative costs between 1997 and 2005. Suzhou Park in the PRC includes free-trade zones with streamlined customs procedures and dedicated transport routes to ports, and has thereby reduced both costs and waiting times (Hausman et al. 2005). In the case of Indonesia, Patunru et al. (2009) found that limitations in soft infrastructure, such as labor skills, regulation, bureaucracy, and other institutional factors, reduce port efficiency. Port performance is crucial to the Indonesian

Supporting Regional Trade and Investment
67
archipelago.27 Lack of direct competition among ports controlled by the same government authority is also a critical factor.
Investments in port infrastructure, especially procuring new cranes, not only lower the cost and raise the efficiency of handling existing trade flows; they can also increase a port’s capacity to handle new flows and thus influence the composition of trade. Standardized containers yield cost savings by allowing goods to be packed once and moved over long distances via a combination of transport modes—for example, truck, rail, ocean liner, rail, then truck again—without being unpacked and repacked. Given the advantages of containerization for certain product categories, improvements in port infrastructure can reduce unit costs further as the share of trade shipped by container rises.
ICT is an increasingly productive complement to physical infrastructure. ICT helps to reduce the costs of finding suppliers, agreeing on contracts, monitoring their implementation, and tracking the location and status of shipments. Fink et al. (2002) found that higher telecommunications costs dampen bilateral trade flows, especially for differentiated (rather than homogeneous) products. In particular, as smaller shipments of a wider variety of higher value-added products proliferate, the demand for ICT services rises. The same is true as the growth of trade in services outpaces that in manufacturing. Trade in services such as banking and business services, or communications, is highly dependent on a well-developed ICT infrastructure in both the exporting and importing countries. While the private sector is especially adept in the ICT sector, the need for mutually interfacing logistics services at both ends of a trade route is an area where regional cooperation could help users to share information, learn from best practices, and coordinate capacity building to enhance trade.
27 In the Indonesian archipelago, where around 90% of external trade (and much of domestic trade) passes through ports, exporters seeking to distribute raw materials tend to follow the “trade follows the ships” principle: they are attracted to ports with shipping routes that best reach the desired markets (Patunru et al. 2009). Regions where service-sector exports are more important tend to follow the “ships follow the trade” principle, whereby ships are routed to serve the desired regions.

68
Infrastructure for a Seamless Asia
In short, soft infrastructure is at least as important as physical infrastructure, especially where hard infrastructure is already well established. Fortunately, soft infrastructure is particularly amenable to regional cooperation agreements.
Logistics Services
Logistics and infrastructure services are a vital component of Asia’s global competitiveness. Supply chains that span the region rely on them, and the location of FDI within the region is shaped by them. Improvements in infrastructure service efficiency can lead to cost savings equivalent to moving production to locations thousands of kilometers closer to trading partners. Economies such as PRC; Hong Kong, China; Republic of Korea; Malaysia; Singapore; Taipei,China; and Thailand have built well-developed logistics systems to facilitate international trade, but these will require much greater investment if economic activities are to expand inland from the coastal areas, where they currently concentrate.
An international comparison of logistics performance (World Bank 2007b) found that East Asian economies perform relatively well compared with South Asian countries, but that most still lag well behind high-income countries, with the exception of Singapore and Hong Kong, China (Figure 2.6). In Central Asia, transport costs account for nearly 20% of the value of trade costs, because transport and logistics services are expensive and of low quality.
The challenges of providing efficient logistical support rise as countries move into progressively more complex and higher value manufacturing, and as production processes become increasingly fragmented. Already, there is a premium on timeliness and reliability of delivery, care and security in handling and transporting, and certification and standardization of product quality. Improving the quantity and quality of logistics services in trade enhances competitiveness and value added. Freight forwarding, warehousing, storage, packaging, shipping services, and ICT infrastructure services are becoming increasingly
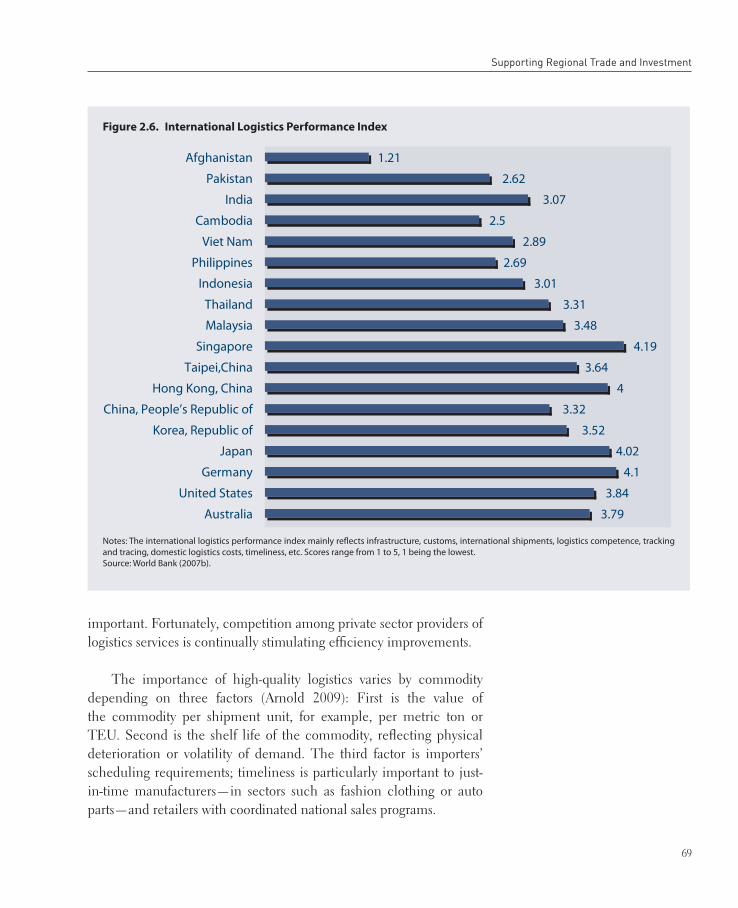
Supporting Regional Trade and Investment
69
important. Fortunately, competition among private sector providers of logistics services is continually stimulating efficiency improvements.
The importance of high-quality logistics varies by commodity depending on three factors (Arnold 2009): First is the value of the commodity per shipment unit, for example, per metric ton or TEU. Second is the shelf life of the commodity, reflecting physical deterioration or volatility of demand. The third factor is importers’ scheduling requirements; timeliness is particularly important to just-in-time manufacturers—in sectors such as fashion clothing or auto parts—and retailers with coordinated national sales programs.
Figure 2.6. International Logistics Performance Index
Notes: The international logistics performance index mainly reflects infrastructure, customs, international shipments, logistics competence, tracking and tracing, domestic logistics costs, timeliness, etc. Scores range from 1 to 5, 1 being the lowest.Source: World Bank (2007b).
3.79
3.84
4.1
4.02
3.52
3.32
4
3.64
4.19
3.48
3.31
3.01
2.69
2.89
2.5
3.07
2.62
1.21
Australia
United States
Germany
Japan
Korea, Republic of
China, People’s Republic of
Hong Kong, China
Taipei,China
Singapore
Malaysia
Thailand
Indonesia
Philippines
Viet Nam
Cambodia
India
Pakistan
Afghanistan

70
Infrastructure for a Seamless Asia
To sum up, logistics services are increasingly important as the value of products, and the demand for timely delivery, rise.
Foreign Direct Investment Location
Trade, investment, and production patterns are partly determined by differences in infrastructure service quality across countries. Kimura et al. (2007) found that geographical distance reduced trade in machinery parts and components much less in East Asia than in Europe. This implies that the costs of production fragmentation are substantially lower in East Asia than in Europe, contributing to large differences in the development of international production and distribution networks. On the other hand, Kuroiwa (2008) found that the automotive industry in Southeast Asia is geographically concentrated, as its parts and components are heavy and bulky, and transporting them is relatively costly. As a result, the share of local content rose and that of imported components declined during the 1990s.
Reductions in transport costs also have an indirect impact on FDI inflows by lowering the cost of spreading production across several countries in order to take advantage of their comparative advantages. Increased FDI, in turn, can further boost regional trade, adding to the direct effect of reduced transport costs arising from improvements in infrastructure near border areas. If the advantages of fragmenting production across economies in a region outweigh those from concentrating it together, reductions in transport costs make FDI complementary to trade. For instance, in Southeast Asia’s electronics industry, where components are generally small and light (relative to value added), with relatively low transport costs, cross-border production networks proliferated in the 1990s. This can create a virtuous circle of cross-border infrastructure development, trade, and investment that fosters increased trade and economic growth.
To compete for larger shares of regional supply chains, countries have strived to improve their infrastructure services. In Malaysia, for instance, the government has actively promoted infrastructure development to strengthen its competitive and comparative advantage.

Supporting Regional Trade and Investment
71
Since the mid-1980s, Malaysia has pursued an FDI-led, export-oriented development strategy, with FDI contributing to the economy’s integration in global production networks. Malaysia has enhanced its geographical attractiveness to foreign firms as a key link in global supply chains through infrastructure development and the resulting high-quality services. Ang (2007) found that, in Malaysia, providing an adequate infrastructure base stimulates FDI inflows. Its exchange-rate policy has also played an important role.
Tham et al. (2009) shed light on infrastructure’s role in attracting export-oriented FDI by analyzing the sectoral and location pattern of FDI in Asia, as well as by conducting interviews with the local managers of foreign firms with subsidiaries involved in international trade. FDI was found to tend toward areas with relatively good infrastructure and amenities. Infrastructure improvements thus help attract FDI, which, in Asia, has frequently been directed toward export sectors, in turn influencing patterns and quantities of imported raw materials and intermediate inputs.
Amiti and Javorcik (2008) argued that access to markets and access to suppliers are the most important factors affecting foreign entry. Their influence on FDI location decisions was four times greater than that of production costs. In the PRC, access to markets and suppliers within the province of entry matters more than access to the rest of the country, consistent with observed market fragmentation. A one-standard-deviation increase in the number of sea berths increases foreign entry by around 11%, while an equivalent increase in railway length increases it by 7%. This reinforces the observation that provinces with more developed ports, and, to a lesser extent, a more developed rail network, tend to attract greater FDI flows.
To sum up, FDI is important for Asia’s trade growth, especially in parts and components. Infrastructure is important for attracting and keeping FDI, especially trade-related infrastructure.

72
Infrastructure for a Seamless Asia
Enhancing Regional Energy Trade2.4.
Meeting Asia’s soaring demand for energy is a huge challenge for the region—not least because Asia’s huge potential for regional energy trade is stymied by a lack of trade-supporting infrastructure such as gas pipelines, power grid connections, and hydroelectric dams.
Nearly half of the increase in global demand for primary energy28 between 2000 and 2020 is expected to occur in Asia (as detailed in Table A2.4 in the Appendix). Demand is expected to grow by 3.2% a year, compared with 2% for the world as a whole. Most of the increase will come from the PRC, India, Indonesia, and Thailand, but the highest rates of growth will be in the Philippines and Viet Nam. Increased investment in energy infrastructure to ensure reliable, affordable—and low-carbon—supplies is therefore vital. Worldwide, the International Energy Agency (IEA) estimates that the energy sector requires investment of around $16 trillion between 2003 and 2030 to meet rising global demand, of which developing Asian economies will need $4–5 trillion (IEA 2003). The electricity sector requires the biggest investment, followed by the oil and gas sectors (IEA 2006).
Asia has substantial energy resources— 7% of the world’s oil reserves, 12% of its natural gas, and 32% of its coal in 2006 (Table 2.5)—to meet this projected demand, but these are unevenly distributed across the region, and often untapped. The PRC, India, and Kazakhstan have 98% of Asia’s coal reserves. Kazakhstan has almost half of the region’s oil, and Turkmenistan has by far the highest gas reserves. Overall, Asia accounted for 13% of the world’s fossil fuel exports and 20% of its imports in 2003.
Since some Asian countries are net energy exporters and others are net importers, there is huge potential for mutually beneficial energy trade. For instance, the PRC is a major exporter of coal and the Republic of Korea a big importer, while Turkmenistan and Indonesia are big gas exporters (Table 2.6).
28 Primary energy consists of coal, gas, oil, and electricity.

Supporting Regional Trade and Investment
73
A World Bank (2008a) study for Asia concluded that increasing regional energy trade would benefit all countries in the region, and that governments should make it a policy priority. Improving power grid interconnections would allow countries with an electricity surplus to export power to those with a shortfall, while building oil and gas pipelines would also permit greater regional trade. Relatively smaller economies such as Bhutan, Cambodia, Kyrgyz Republic, Lao PDR, Myanmar, Nepal, Tajikistan, and Turkmenistan have hydropower or hydrocarbon resources far in excess of their energy needs. Energy exports could bring them huge economic gains. For example, Bhutan’s electricity exports in the 2007 fiscal year were expected to amount to nearly 25% of GDP and 60% of government revenues (ADB 2008h).
In other countries such as Afghanistan, Bangladesh, India, Pakistan, and Sri Lanka, energy demand growth far outstrips domestic
Table 2.5. Proven Energy Reserves in Million Tons of Oil Equivalent and Percent of World Total, 2006
OECD = Organisation for Economic Co-operation and Development.– data not available.Notes: Regional aggregates and the world total calculated based on data for 48 countries that reported. East Asia includes: Hong Kong, China; Japan; Mongolia; People’s Republic of China; Republic of Korea; and Taipei,China. Central and West Asia includes: Armenia, Azerbaijan, Georgia Kazakhstan, Kyrgyz Republic, Tajikistan, Turkmenistan, and Uzbekistan. The Pacific includes: Cook Islands, Democratic Republic of Timor-Leste, Federated States of Micronesia, Fiji Islands, Kiribati, Marshall Islands, Nauru, Papua New Guinea, Republic of Palau, Samoa, Solomon Islands, Tonga, Tuvalu, and Vanuatu. South Asia includes: Afghanistan, Bangladesh, Bhutan, India, Maldives, Nepal, Pakistan, and Sri Lanka. Southeast Asia includes: Brunei Darussalam, Cambodia, Indonesia, Lao People’s Democratic Republic, Malaysia, Myanmar, Philippines, Singapore, Thailand, and Viet Nam. Source: World Resources Institute (2009).
Region
Oil Gas Coal
Million Tons% of World
TotalMillion Tons
% of World
TotalMillion Tons
% of World
Total
Developing Asia 11,203 7.1 18,561 11.6 143,051 31.7
East Asia 2,219 1.4 2,204 1.4 58,927 13.0
Central and West Asia 6,543 4.1 8,890 5.6 20,827 4.6
The Pacific – – 392 0.2 – –
South Asia 777 0.5 1,359 0.8 60,843 13.5
Southeast Asia 1,665 1.1 5,716 3.6 2,454 0.5
Other Developing Countries 137,897 87.3 127,580 79.8 142,461 31.5
OECD 8,935 5.7 13,776 8.6 166,158 36.8
World 158,035 100.0 159,917 100.0 451,670 100.0

74
Infrastructure for a Seamless Asia
supply, and this gap will continue to widen unless domestic supplies are supplemented by imports. Importing energy would permit their economies to grow faster. For example, in India unmet electricity demand in the 2007 fiscal year was estimated at 54,916 gigawatt-hours, valued at $12.1 billion on the basis of short-term marginal cost in
Table 2.6. Pattern of Asia’s Energy Exports and Imports, by Country and Commoditya (in percent)
– data not available.Note: a As a percentage of total Asian exports and imports of that commodity.Source: World Resources Institute (2009).
Region/Economy
Exports Imports
Oil and Petroleum Products
Natural Gas CoalOil and
Petroleum Products
Natural Gas Coal
East Asia 20 1 51 46 50 65
China, People’s Rep. of 9 1 51 21 0 7Hong Kong, China 1 0 0 2 3 7Korea, Rep. of 10 0 0 22 47 51
Central and West Asia 24 45 8 3 28 4
Armenia 0 0 0 0 2 0Azerbaijan 4 0 0 0 7 0Georgia 0 0 0 0 2 0Kazakhstan 17 9 8 1 15 1Kyrgyz Republic 0 0 0 0 1 1Pakistan 0 0 0 2 0 2Tajikistan 0 0 0 0 1 0Turkmenistan 2 33 0 0 0 0 Uzbekistan 0 3 0 0 0 0
South Asia 5 1 18 18
Bangladesh 0 – 0 1 – 0India 5 – 1 16 – 17Sri Lanka 0 – 0 1 – 0
Southeast Asia 51 54 41 33 22 14
Indonesia 13 32 38 5 0 0 Malaysia 11 17 0 3 0 5 Myanmar 0 5 0 0 0 0 Philippines 1 0 0 3 0 4 Singapore 18 0 0 14 9 0 Thailand 3 0 0 6 13 5 Viet Nam 6 0 3 2 0 0
Total 100 100 100 100 100 100
Supporting Regional Trade and Investment
75
the Indian grid. The value of the industrial production forgone was doubtless several times higher (World Bank 2007c, Bhattacharya and Kojima 2008).
Regional energy trade would also enhance national energy security by diversifying energy forms and supply sources and lowering costs. Studies estimate that regional cooperation in the GMS would reduce the subregion’s total discounted energy costs by an estimated $220 billion, or 19% of total energy costs (ADB 2008a). Such huge gains are possible because energy demand is expected to rise sharply, and importing from neighboring countries is the cheapest way of meeting that demand.
Regional cooperation and energy trade would also benefit the environment. In India, which relies heavily on domestic coal, carbon dioxide emissions are forecast to rise from 4% of the world total to around 13% by 2030. Imported hydropower and natural gas would moderate this rise. Major cross-border energy projects involving hydro, nuclear, and wind power could also reduce electricity generation from coal and oil and thus limit environmental damage. The net benefit of building cross-border infrastructure in order to access clean energy would total around $3.5 billion; East Asia alone would gain more than $2 billion (Bhattacharya and Kojima 2008). Clearly, there is huge potential for Asia to replicate and build on the success of the GMS in fostering energy trade and cooperation.
Toward Greater Trade2.5.
Asia’s trade-related infrastructure has greatly improved, but it must continue to do so to sustain economic growth and regional integration. Asia’s international trade is growing in value and shrinking in weight per unit value. Exports are diversifying across new markets with smaller flows, and intraregional trade in parts and components for regional production networks accounts for a growing share of total trade. These trends underscore the need for speed, flexibility, and information. This requires efficient and flexible logistic networks that provide uncomplicated connections between different transport modes and

76
Infrastructure for a Seamless Asia
make it possible to trade with more places, in less time, at lower cost. The logistics networks need to be complemented by investments in ICT, human capacity development, cooperation on trade facilitation, and improvements in “soft infrastructure.” Regional infrastructure that facilitates the expansion of trade along these lines will boost a country’s export competitiveness and its efficient integration into the global economy.
As production becomes increasingly fragmented and traded more internationally, cooperation among economies participating in production networks is becoming more important. The competitiveness of each country’s production depends on that of the other countries in a production network as well as on the efficiency of the trading links among them. They thus have a strong incentive to cooperate with each other, particularly on improving physical infrastructure and harmonizing soft infrastructure to reduce the costs of trading among them.
The sequencing of hard and soft infrastructure in regional infrastructure investments is important, particularly as transport corridors develop into more diversified economic corridors. Once physical infrastructure has been built, developing complementary soft or ICT infrastructure may be more important than further investments in transport, while maintaining (or increasing) spending on operation and maintenance. For example, once a two-lane highway has been built, streamlining customs facilities may boost trade more than widening the road to four lanes.
Efficient and cost-effective logistics services are increasingly important for timely delivery. As production supply chains become more geographically fragmented and extended, logistics can have more impact than transport on trade costs. Effective logistics services need to be complemented by ICT, soft infrastructure, and education and training.
Flexibility, as well as timeliness, will become more valuable as greater trade implies greater potential vulnerability to external shocks such as financial turmoil or sharp fluctuations in fuel prices. An extended
Supporting Regional Trade and Investment
77
economic downturn in export markets would diminish the demand for transporting goods and passengers. As a result, fuel costs, congestion, and economies of scale in shipping would likely decline. But so too would export prices, potentially raising ad valorem trade costs and altering the prices of traded goods relative to those of nontradables. In general, one would expect the direct price effect to dominate, favoring trade in goods that are smaller, lighter, and of higher unit value. Trade finance may also be negatively affected, reducing the ability of trade to contribute to economic recovery in a region where it has been highly important in the past.
Infrastructure must adapt to changes in export and import demand in an efficient manner (for example, shifting towards more fuel-efficient transport). Similarly, logistics systems must realign to facilitate changes in trade patterns and flows.
Factors such as high freight costs, delays in customs clearance, unofficial payments, slow port handling, and poor governance are particularly damaging because they impede this flexibility. They are also barriers to trade that need to be addressed through regional cooperation on trade facilitation measures. Infrastructure improvements that reduce the costs of international trade are crucial for the region to realize the full gains from recent and prospective trade liberalization. This should be a priority in negotiations on bilateral and regional trade agreements, which can provide an added incentive and commitment to reform.
Asian countries need to cooperate to develop trade-supporting infrastructure, but match infrastructure developments to their individual trade characteristics, industrial structure, and plans. Once hard infrastructure has been developed, trade liberalization and soft infrastructure are increasingly important as exports move up the value-added supply chain.

Harnessing the
Benefits of Regional
Infrastructure
Chapter 3

Harnessing the Benefits of Regional Infrastructure
81
Volumes of evidence attest to the economic benefits of infrastructure in general.29 It boosts growth, improves access to basic services and economic opportunities, and helps reduce poverty. At its best, infrastructure investment can spark a cycle of poverty reduction,
improved service provision, and economic growth that sets the economy on a dynamic new development path.
Given that much national infrastructure has a regional impact and that regional infrastructure can be expected to have many of the same benefits as domestic connective infrastructure, it is worth summarizing some of this evidence. Calderon and Serven (2004) showed that the marginal productivity of telecommunications, transport, and power infrastructure significantly exceeded that of non-infrastructure capital in a sample of 100 countries. They also determined that a large proportion of Latin America’s economic underperformance relative to East Asia in the 1980s and 1990s could be traced to the fall-off in its infrastructure investment. Hulten (1996) found that the effective use of infrastructure explained a quarter of the growth differential between Africa and East Asia, and more than 40% of that between low-growth and high-growth countries more generally.30 Many studies have concluded that transport, electricity, gas, water, and communication facilities have a significant positive effect on economic growth.31
29 Aschauer’s (1989) seminal work on the relationship between public investment and economic growth has sparked a vast body of literature on the economic impact of infrastructure investment. But this has focused mainly on domestic infrastructure spending (Straub et al. 2008).30 See also Esfahani and Ramírez (2003), Estache (2005), and Rickards (2008) for growth impacts. 31 For instance, Barnes and Binswanger (1986), Binswanger et al. (1989), Datt and Ravallion (1998), Elhance and Lakshamanan (1988), and Sahoo and Sexena (1999).
3. Harnessing the Benefits of Regional
Infrastructure

82
Infrastructure for a Seamless Asia
The impact on poverty is equally striking. Several broad studies show that better infrastructure, especially road transport and electricity, significantly reduced poverty in developing Asian countries.32 Better access to roads and sanitation reduces income inequality, lowering Gini coefficients by between 0.05 and 0.13 (Calderon and Serven 2004). In Thailand, around 40% of survey respondents associated electricity with increases in income (Chatterjee et al. 2004). In India, poverty rates were lowest for households near good roads and with electricity, and highest for households with neither (ADB 2004). In the Lao PDR, all-weather road access lowered the incidence of poverty by around 6 percentage points (Warr 2005). Providing dry-season roads to villages that previously lacked road access is particularly pro-poor (Menon and Warr 2008). In Viet Nam, poor households living in rural communities with paved roads had a 67% higher probability of escaping poverty than those in communities without paved roads (Glewwe et al. 2002).
Infrastructure investment gives poor people and underdeveloped areas better access to markets and economic opportunities (Smith et al. 2001). It can also improve access to education and healthcare. Studies have found that improved transport increases school attendance (Levy 2004), and that access to electricity improves school performance by allowing more study time (Kulkarni et al. 2007). In Indonesia, 64% of women who lived near a paved road received antenatal care by a medically trained midwife, compared with 38% of those living near a nonpaved road (Ishimori 2003).
Infrastructure investment has been a significant part of the region’s development strategy (Kuroda et al. 2008). Yet studies on the impact of regional infrastructure are scarce. Measuring the broader benefits of connecting national infrastructure networks together is particularly tricky. This chapter attempts to do so. It starts by examining the theoretical rationale for regional infrastructure. It then sets out evidence on the impacts of regional infrastructure projects on economic welfare and poverty. It also considers their potential negative social and economic impacts. It then presents three detailed case studies of the impacts of regional projects in Central, South, and Southeast Asia. It concludes by estimating the benefits to Asia and the world arising from
32 See, for instance, Datt and Ravallion (1998) and Fan and Zhang (2004).

Harnessing the Benefits of Regional Infrastructure
83
pan-Asian connectivity through required infrastructure investment across the entire region.
Economics of Infrastructure Network3.1.
Economic theory suggests that infrastructure investment and development are strongly correlated. Connective infrastructure can reduce the economic distance between locations—the time and cost of trading between them—and thus expand and link markets. This enables firms to reap economies of scale, permits greater specialization in production, and allows a finer division of labor. In other words, it promotes development through regional (and global) integration. Areas of dense economic interaction also bring improved learning opportunities and greater knowledge spillovers. Creating and improving infrastructure networks can thus boost an economy’s rate of innovation and technological advancement, lifting long-term growth (Straub et al. 2008).
Network Externalities
The main economic benefit of regional infrastructure derives from network externalities. These occur when the value of a product or system to any user rises as the number of other users increases. For instance, the more people who have a telephone, the more valuable having a telephone is. Network industries—which include telecommunications, computing, electricity, and transport—are pivotal to the economy. Their integration can generate huge economies of scale and substantial technical innovation (Economides 1998).
Network externalities can occur directly or indirectly. Direct effects arise when increasing the size of a network expands the number of economic agents with whom direct interaction becomes possible—for example, a road’s value to a distribution facility increases with the number of businesses located along it. Indirect benefits exist when increasing the size of a network expands the range of complementary products and services available to its members. These are prevalent

84
Infrastructure for a Seamless Asia
in communications, transport, and energy. For example, as a cable network’s subscriber base increases, it may become profitable to offer a wider range of television channels, or broadband internet. Likewise, as the number of users connected to a power grid increases, it becomes profitable to sell a wider range of consumer products that require electricity, such as electric lamps and refrigerators.
Network externalities are prevalent in infrastructure in developing countries. In a study using panel data from 50 countries between 1960 and 1995, Hurlin (2006) found strong network effects.33 When a country’s infrastructure stock was very low, investment in the sector was found to be as productive as non-infrastructure investment. Once a minimum network was achieved, however, the marginal productivity of infrastructure investment was generally greater than that of other investments. The road sector showed particularly strong network effects. Importantly, the impact of infrastructure investment on productivity depends more on the size of a country’s infrastructure network than on its level of development. This means that even poor countries can reap network productivity gains—and that connecting countries’ networks together is particularly beneficial.
Network effects provide a strong rationale for infrastructure investment in general, and for regional infrastructure in particular. But regional infrastructure is a public good that is likely to be undersupplied unless governments act together to help provide it.
Infrastructure as Club Goods
Public goods are goods and services that are nonexcludable—once provided they are available to all, and nonpayers cannot be excluded from their use—and nonrival: their use by some does not reduce the supply for others. If exclusive rights to a product or service cannot be secured, there is little incentive for the private sector to provide them, and so government has to step in. Various types of public goods exist, depending on the degree of rivalry and excludability. Most transport and energy networks are considered “club goods,” because access to
33 Sample size and time period varied depending on sector.

Harnessing the Benefits of Regional Infrastructure
85
them can be regulated—for instance, through highway tolls—but an extra car on the road does not necessarily diminish others’ ability to drive on it by a corresponding amount, or even at all. Moreover, the quantity and quality of a club good provided depends on the efforts of the weakest individual member(s); for instance, the value of a regional logistics network is determined by its weakest link.
This gives rise to a free rider problem. If, for instance, all the members of the GMS except the Lao PDR were to upgrade their national road networks and cross-border connections, the Lao PDR would benefit too, without making any effort. At the same time, the Lao PDR’s nonparticipation would prevent the rest of the GMS from reaping the full benefits of an improved and integrated road network; trade within the region would either have to transit slowly and more expensively through the Lao PDR or bypass it altogether. But in that case, other GMS members might question the value of investing in a regional road network, and the end results could be that everyone tries to free-ride, no network is built, and everyone misses out on its potential benefits. The challenge for regional cooperation, therefore, is to reduce the costs of collective action, find a way of sharing the costs of providing the club good in a broadly acceptable and equitable manner, and thus enable all members of the regional club to benefit from the collective gains of improved regional infrastructure networks.
Until recently, public goods theory paid no attention to transnational or network dimensions (Tanzi 2005a). However, the rise of regional entities—such as ASEAN, GMS, North American Free Trade Agreement (NAFTA), and European Union (EU)—has highlighted the need to provide public goods whose benefits are regional in scope. These remain undersupplied in the developing world, because individual governments lack sufficient means to provide them, and international organizations have until recently not provided support for them (Sandler 2004).
Club theory provides a means of conceptualizing a regional approach to providing public goods. It suggests that any collective endeavor must be self-sustaining and provide a large enough pool of net benefits so that it makes each of its members better off. A club’s

86
Infrastructure for a Seamless Asia
success or failure depends on whether the benefits of members acting together exceed the costs of collective action. Thus, for instance, neighboring governments that are antagonistic may fail to develop common hydroelectric resources even though they would each benefit economically from doing so. Conversely, a regional or subregional institution can greatly reduce the costs of collective action, to the benefit of all its members, particularly if they feel that they have shared interests and even elements of a common identity. However, larger groups may find it harder to agree among themselves, so that it may be preferable to start by creating subregional clubs and gradually extend cooperation among these.
ADB has recognized the benefits of a regional strategy for infrastructure development through its subregional programs in South, Southeast, and Central Asia. It has identified projects that seek to develop networks and take advantage of the agglomeration forces and spillover benefits described above. These subregional programs provide the institutional structure needed to realize the benefits of these regional public goods. Tables A5.4–A5.8 in the Appendix list major projects in each subregional program in Asia.
Economic Geography and Agglomeration
Infrastructure networks affect the economic geography of a region by where activity is located and the pattern of trade across a location. A region can be conceived of as a set of gateways and hubs, multimodal corridors and integrated networks that often cut across politically determined national borders. Hub-and-spoke networks encourage economic activity to concentrate in hubs, because firms that are centrally located face lower transport costs than those that are in the spokes (Estache and Fay 2007). To maximize its effectiveness, infrastructure investment should seek to enable goods, services, information, and people to move seamlessly along the spokes while fully integrating them with the hubs. An integrated region needs to increase the efficiency of its spokes so as to reduce the cost of trading within it and thus reap economies of scale.

Harnessing the Benefits of Regional Infrastructure
87
Such integration can strengthen a region’s global competitiveness by creating reliable and secure connections between main urban gateways, enabling capital and labor to move efficiently between them (Rimmer and Dick 2008). But effective integration requires institutional support in order for gateways and multimodal corridors to enhance trade competitiveness and develop a regional network. True integration relies on a systems-based approach that rises above individual industries and economies and tackles infrastructure, policy, governance, and operational issues in an integrated policy framework (Kuroda et al. 2008).
The choice of where to locate infrastructure to serve a certain geographical area has important implications. Inevitably, some locations will benefit more than others—and that, in turn, will influence the pattern of migration, the establishment of new firms, the location of other capital investments, and so on. In order to maximize the gains from infrastructure investment, it is important to understand how patterns of economic activity may arise. Such activity tends to concentrate in certain areas, not just because of physical or geographical attributes—for instance, proximity to a natural harbor—but also because of economic forces of agglomeration, which in turn may be affected by policy interventions and the accumulation of infrastructure capital.
Firms tend to locate near each other, because this enables them to reap economies of scale. These may be internal or external to the firm. Internal scale economies arise either from demand effects—for instance, firms congregate in regions with bigger markets so as to be able to serve more customers—or from supply effects, for example, by locating near each other, firms’ aggregate purchases may bid down input prices. External scale economies arise from positive spillovers among firms locating near each other. For instance, firms may learn from each other or may benefit from a deeper pool of skilled workers.
While these agglomeration effects tend to concentrate economic activity, countervailing dispersion forces tend to scatter it more widely. For example, a concentration of economic activity will tend to bid up the price of land, giving firms an incentive to move to cheaper

88
Infrastructure for a Seamless Asia
locations. If workers are not perfectly mobile, it will also tend to bid up local wages, again encouraging firms to relocate to areas where labor is cheaper. Negative externalities such as congestion and pollution will accentuate these forces. And the pull of demand from other markets will also offset the attractions of agglomeration.
Transport costs often determine how the forces of agglomeration and dispersion shape the economic landscape (Krugman 1993). Infrastructure improvements that reduce the time and cost of connectivity encourage not only greater agglomeration in some areas but also a wider dispersion of economic activity, and thus increase total economic activity in a region. Economic activity tends to expand across many new smaller nodes rather than in a few large existing ones.
Improvements in transport free up the movement of resources. As goods and people move across borders more easily, the region can make full use of neighboring countries’ diverse resource endowments and realize greater scale economies from agglomeration. Entrepreneurs can exploit new opportunities and combine resources with varying competitive advantage across borders. While it is still early to measure precisely the extent of agglomeration effects attributable to specific projects within ADB’s subregional programs, developments at border areas are clearly at least partly associated with improvements in cross-border infrastructure. For example, the garment industry is flourishing in Poipet, on the border between Thailand and Cambodia, and likewise at the Thailand-Myanmar border at the western end of the East-West Economic Corridor (EWEC). Labor-intensive industries are multiplying in the Mae Sot District of Tak Province, where Thai garment firms employ many workers from Myanmar (Kudo 2007).
Modern theory and practical experience concur: prospects for development are improved when markets and government action stretch beyond the confines of a single country. The benefits of infrastructure projects, such as railways and power grids, not only extend beyond national boundaries but are enhanced across networks. The larger cross-border externalities are, the stronger the economic case for regional cooperation and coordination in infrastructure provision.

Harnessing the Benefits of Regional Infrastructure
89
Network externalities ensure that all countries in the region benefit from these infrastructure projects.
Economic Corridors
In practice, the benefits of regional infrastructure are often realized through the creation of cross-border economic corridors—improved transport connections between centers of economic activity that reduce the cost of moving and trading along them and promote development around them. These encourage trade, investment, and other economic opportunities, and can thus help reduce poverty, support the development of rural and border areas, increase the earnings of low-income groups, and promote tourism (ADB 2005d). The development of such corridors involves systematic and coordinated planning, and policy and institutional changes. In effect, they extend the scope of cross-border cooperation beyond the provision of collective infrastructure projects to seek to promote economic activities around them and to improve soft infrastructure, such as reducing delays at border crossing points (ADB 2006d). The best example of this in Asia is the ongoing economic corridors program within the GMS.
Economic corridors are a concrete way for policymakers to reap the network benefits of regional infrastructure. These are important not only for trade but also for shaping the economic geography of a region. Transport corridors attract many other economic activities, which can produce a chain reaction of increasing returns and broader economic development (Venables 2007). Figure 3.1 shows the major corridors in Southeast Asia.
The role of economic corridors varies. While all seek to promote efficient trade, they often also have broader economic goals. Some seek to promote economic activity along the corridor itself, while others aim to increase it at the international gateway at the end of the corridor. A corridor may also provide an international gateway for one or more landlocked countries that would otherwise have to conduct trade with countries beyond their immediate neighbors through intermediaries.
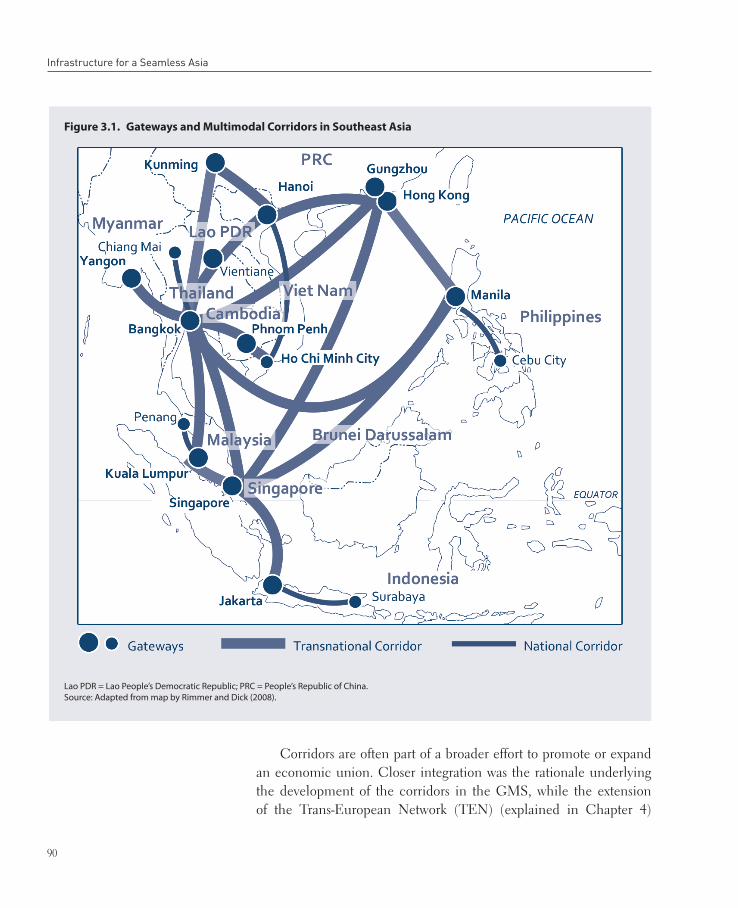
90
Infrastructure for a Seamless Asia
Corridors are often part of a broader effort to promote or expand an economic union. Closer integration was the rationale underlying the development of the corridors in the GMS, while the extension of the Trans-European Network (TEN) (explained in Chapter 4)
Figure 3.1. Gateways and Multimodal Corridors in Southeast Asia
Lao PDR = Lao People’s Democratic Republic; PRC = People’s Republic of China.Source: Adapted from map by Rimmer and Dick (2008).

Harnessing the Benefits of Regional Infrastructure
91
transit network to Eastern Europe sought to support the EU’s eastward enlargement (Tanzi 2008). Finally, some corridors exist solely to facilitate trade among countries by linking existing agreements or arrangements (Arnold 2006).34 Efforts to create the AH have also followed this incremental approach.
Empirical Evidence3.2.
Marshaling empirical evidence on the impacts of regional infrastructure projects is difficult. Data are often inadequate or unavailable. This is a major concern, given the commitments to infrastructure formalized in the United Nations Millennium Development Goals. Policy-relevant research and reliable information are urgently needed (Estache and Fay 2007). In the case of transport, the flaws are glaring. It is known that road density in the poorest developing countries is around a third of that in the richest ones and around a sixth of that in developed countries, but these data do not capture the quality of the infrastructure: the same weight is given to a one-lane rural road as to a 12-lane ring road. This makes it hard to gauge the economic and social benefits of road improvements.
In the case of energy, most of the information on access rates is based on extrapolations from a small sample of representative countries. The last time comparative data were collected by the IEA was in 2000. Household surveys provide additional information, but there are major gaps as well as compatibility issues. Information on prices and quality in the sector depends on heroic assumptions, making it difficult to generate comparable cross-country data sets (Straub 2008). Monitoring infrastructure services may be difficult, but it is regrettable that information on changes in their affordability and quality is unavailable for most developing countries, even though these are vital dimensions of progress in reducing poverty.
34 Such is the case for some land routes in the Middle East, including those from the eastern Mediterranean to Iraq, from Iran up through the Central Asian republics, and from Jordan through to Syria and Iraq.

92
Infrastructure for a Seamless Asia
A recent study on the impact of road upgrading and improvement under the AH network on overland trade expansion found that if required investment is made to the selected roads (totaling 15,842 km), total intraregional trade in 18 of 32 member countries of the AH network would increase by 35%, or equivalent to $89.5 billion annually (Parpiev and Sodikov 2008).
Studies of infrastructure projects in the GMS have found impressive benefits. The Phnom Penh to Ho Chi Minh City highway project was found to reduce the average time required to reach local healthcare services by around 30%, while travel times to schools and markets fell by around 40% (Phyrum et al. 2007). In the case of the EWEC project, travel time from the Lao PDR-Viet Nam border of Densavanh to Khanthabouly on Road 9 was reduced from around 12 hours in 2001 to 2.5–3 hours (Rattanatay 2007). After the completion of the Lao PDR road section in the North-South Economic Corridor (NSEC), travel time from Bangkok to Kunming was slashed from 78 hours in 2000 to 51 hours in 2006, and it is projected to be cut to 30 hours by 2015 (Banomyong 2007). Correspondingly, the cost of transporting one ton of rubber products from Bangkok to Kunming fell from $563 in 2000 to $392 in 2006, and is projected to decline to $210 by 2015 (Banomyong 2007: 12).
Reduced transport times generate larger traffic volumes. After the completion of the Champasak road improvement project, traffic volumes on the route grew at an average annual rate of 22% (growth of 5–7.5% had previously been projected). The number of passenger buses along the EWEC in the Lao PDR rose from around 600 in 2000 to around 1,560 in 2005, while the number of freight operators doubled over the same period (Rattanatay 2007). Traffic volume on the route of the Almaty-Bishkek regional road rehabilitation project in Central Asia grew by 25% after 2007 (ADB 2008g). This increased traffic enhanced the availability of labor, customers, alternative technologies, and other stimuli for economic development.
Some of the increased traffic stems from the rising number of visitors and tourists in the region. The number of tourists visiting the Lao PDR’s Champasak Province rose 128% between 1998 and 2004,

Harnessing the Benefits of Regional Infrastructure
93
partly due to the Champasak road improvement project (ADB 2008g). The number of visitors (including tourists) crossing the Cambodia-Viet Nam border at Bavet-Moc Bai rose by an average of around 53% a year between 2003 and 2006, while the number of vehicles crossing the border rose by 38% a year (ADB 2008g). In the Lao PDR’s Savannakhet Province, the number of tourist arrivals rose from 90,910 in 1999 to 222,063 in 2006. Following the opening of the second Mekong international bridge, the number of tourist arrivals increased by 8% in the first 2 months of 2007 alone. Most such tourism involves regional tours covering the Lao PDR, Thailand, and Viet Nam (Rattanatay 2007).
Much of the increased traffic is eventually expected to come from an expansion of regional trade. Trade between Cambodia and southern Viet Nam along the Southern Economic Corridor increased by around 40% a year between 2003 and 2006 (ADB 2008d). In Savannakhet Province, the Lao PDR’s transit province along the EWEC, exports increased by 24 times and imports by 39 times between 2001 and 2005 (Rattanatay 2007).
In a broader study to analyze the determinants of regional trade and FDI flows in GMS countries in a Gravity model framework, Edmonds and Fujimura (2008) found that cross-border road development (expressed in road density) has had a distinctly positive impact on regional trade flows, controlling for other factors.
Improved cross-border transport infrastructure induces investments in new economic activities. In anticipation of closer economic links between Viet Nam and Cambodia, industrial districts such as the Trang Bang Industrial Park are developing on the Vietnamese side of the border along the Southern Economic Corridor, generating jobs for the local population (ADB 2008d). As discussed in the previous chapter, FDI is attracted to places where transport costs are low and resource complementarities are high. The value of FDI and joint ventures in Savannakhet Province increased from $96 million in 1995–2000 to $250 million in 2001–2005. More than half of these FDI projects were in agriculture, providing work for villagers in activities such as silk and cotton production, weaving, and handicrafts (Rattanatay 2007).

94
Infrastructure for a Seamless Asia
Phyrum et al. (2007) found that around 46% percent of households in the area around the Champasak road improvement project increased their agricultural output for sale at local markets, significantly increasing incomes. More than 70% of field survey respondents in the Southern Economic Corridor stated that their living standards had improved as a result of the project (Phyrum et al. 2007).
By increasing their mobility, infrastructure also increases poor people’s employment opportunities. For example, many workers from Saravan Province of the Lao PDR, which is not even on the direct East-West Corridor route, work in Cambodia and Thailand (ADB 2006d). There is also evidence that such mobility improves labor standards. Cross-border workers in the GMS reported improved working conditions in 2001–2005, as border crossings eased and wage levels improved (Singh and Mitra 2006).
The benefits of energy cooperation in the GMS are particularly large, as Box 3.1 explains.
Box 3.1. Estimating the Benefits of Energy Cooperation in the GMS
A DB has worked with the GMS countries to draft a regional energy strategy. A model known as MESSAGE (Model for Energy Supply Strategy Alternatives and their General Environmental Impact) was used to estimate the optimal supply
pattern to meet the growing energy needs of the GMS. This is a system engineering optimization model used for medium- to long-term energy planning. It identifies the flow of energy from primary sources to estimated energy demands. It also sets out the investment choices required to provide the least-cost energy supply mix to meet a given energy demand. Demand is based on population and economic growth projections. Costs include investment costs (fixed and variable), operation and maintenance, fuel, and environmental costs. These are based on assumptions about the specific costs associated with various technologies over time. A detailed analysis of pollutant emissions is an integral part of this cost analysis. Many scenarios were constructed to understand the implications of different policy issues facing the region. These indicate that regional cooperation is the optimal strategy. By integrating its energy market, the GMS could reduce its energy costs by 19% over the base scenario—saving more than $220 billion.
Source: ADB (2008a).

Harnessing the Benefits of Regional Infrastructure
95
Bhattacharya and Kojima (2008) showed that cross-border energy trade between the PRC and Thailand could enhance the gains from increased energy supplies. The Jinghong and Nuozhadu hydropower project, the largest energy project in the Lancang-Mekong basin, is expected to boost Thailand’s GDP by 3.45% and the PRC’s by 1.15% by increasing energy supplies by 12% in the PRC and 47% in Thailand. Including a trading scheme in these estimates increases gains in GDP in both countries, as Table 3.1 shows. It would also reduce both Thailand’s and the PRC’s carbon dioxide emissions by approximately 1 million tons.
While most of the evidence so far comes from the GMS, a few studies of Central Asia also exist. In a forward-looking study of the CAREC region, a multisector computable general equilibrium (CGE) model was employed to simulate the economic impact of regional cooperation in transport, transit, and trade policy, focusing on the Kyrgyz Republic (ADB 2006b). Its results indicate that the cumulative increase in the country’s real GDP in 2006–2015 would be $2.1 billion, more than double the baseline scenario without regional cooperation. Poor households’ incomes would nearly double over the same period.
In the case of railways, using common facilities for goods distribution centers could reduce costs by $21 million. Constructing a joint workshop for locomotive repair could cut costs by $11 million–$12 million, and renting track repair equipment in common could save a further $31 million (Overseas Economic Cooperation Fund [OECF] 1998). The OECF also calculated (in 1998) that by cooperating, Kazakhstan,
Table 3.1. Impacts on the PRC and Thailand from Electricity Infrastructure Investment
$ = United States dollar; CO2 = carbon dioxide; GDP = gross domestic product; SOx = sulfur oxides.Source: Bhattacharya and Kojima (2008).
CountryGDP
($ million)
Labor Payments ($ million)SOx
(thousand tons)
CO2
(million tons)Skilled Unskilled
China, People’s Republic of 75.9 3.7 -13.8 0.9 -1.0
Thailand 45.7 -1.0 -6.1 -0.2 -0.9

96
Infrastructure for a Seamless Asia
Kyrgyz Republic, and Uzbekistan could reduce the investment cost of meeting their electricity needs in 2010 from $9.3 billion to $8.3 billion, a saving of over 10% (OECF 1998).
Regional infrastructure cooperation in Asia is still in its infancy. But so far its impact appears to be highly positive. The following section looks in greater detail at its impacts.
Regional Case Studies3.3.
This section presents the findings of three new case studies, prepared especially for this study, that attempt to measure the benefits of regional infrastructure projects and their impacts on household income and poverty levels in three Asian subregions using a CGE approach. These studies are more comprehensive than the cost-benefit analyses generally used for project appraisal and are particularly useful for measuring the broader benefits of infrastructure networks, as well as their distributional impact (see Box A3.1 in the Appendix). The first provides evidence from Central Asia, the second from South Asia, and the third from the GMS in Southeast Asia.
Evidence from Central Asia
Two regional infrastructure projects in Central Asia were examined to determine their impacts on economic growth and household welfare. The first is the road corridor development project in Kazakhstan; the second is the expansion of the Atasu-Alashankou oil pipeline from Kazakhstan to the PRC. The road network project aims to create a corridor throughout Kazakhstan, helping to link Uzbekistan and the Kyrgyz Republic with the PRC. Using estimates of the reduction in vehicle operating costs and transit times that the new corridor is expected to deliver (ADB 2006b), a CGE model of the region was used to ascertain the project’s broader impacts (Roland-Holst 2008).
The road-corridor project is expected to give a big boost to Central Asia’s GDP, as Table 3.2 details. Kazakhstan is expected to gain most,
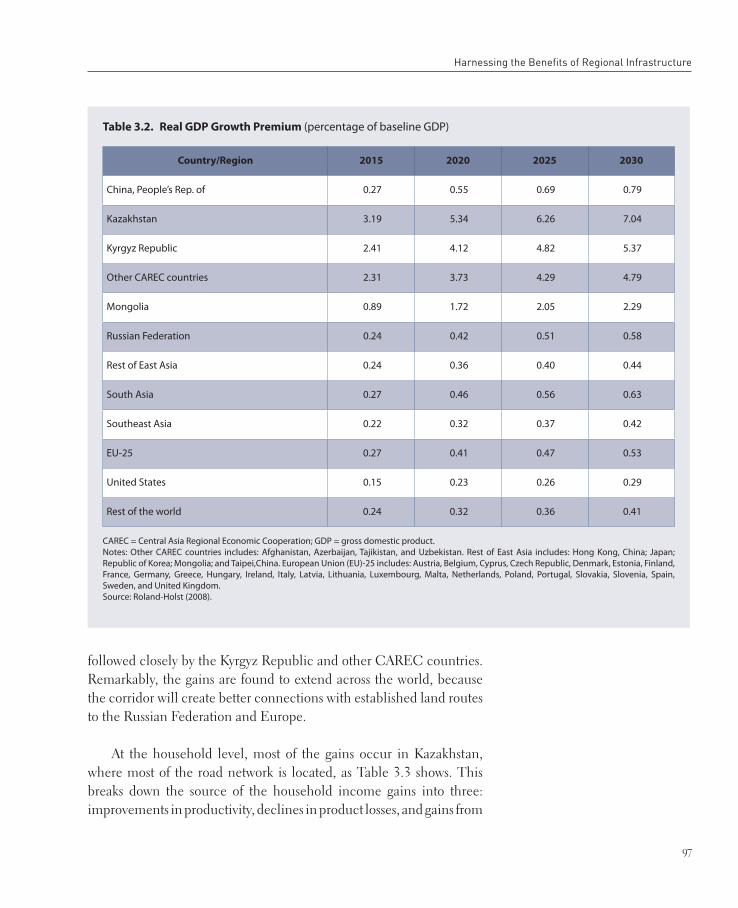
Harnessing the Benefits of Regional Infrastructure
97
followed closely by the Kyrgyz Republic and other CAREC countries. Remarkably, the gains are found to extend across the world, because the corridor will create better connections with established land routes to the Russian Federation and Europe.
At the household level, most of the gains occur in Kazakhstan, where most of the road network is located, as Table 3.3 shows. This breaks down the source of the household income gains into three: improvements in productivity, declines in product losses, and gains from
Table 3.2. Real GDP Growth Premium (percentage of baseline GDP)
CAREC = Central Asia Regional Economic Cooperation; GDP = gross domestic product.Notes: Other CAREC countries includes: Afghanistan, Azerbaijan, Tajikistan, and Uzbekistan. Rest of East Asia includes: Hong Kong, China; Japan; Republic of Korea; Mongolia; and Taipei,China. European Union (EU)-25 includes: Austria, Belgium, Cyprus, Czech Republic, Denmark, Estonia, Finland, France, Germany, Greece, Hungary, Ireland, Italy, Latvia, Lithuania, Luxembourg, Malta, Netherlands, Poland, Portugal, Slovakia, Slovenia, Spain, Sweden, and United Kingdom.Source: Roland-Holst (2008).
Country/Region 2015 2020 2025 2030
China, People’s Rep. of 0.27 0.55 0.69 0.79
Kazakhstan 3.19 5.34 6.26 7.04
Kyrgyz Republic 2.41 4.12 4.82 5.37
Other CAREC countries 2.31 3.73 4.29 4.79
Mongolia 0.89 1.72 2.05 2.29
Russian Federation 0.24 0.42 0.51 0.58
Rest of East Asia 0.24 0.36 0.40 0.44
South Asia 0.27 0.46 0.56 0.63
Southeast Asia 0.22 0.32 0.37 0.42
EU-25 0.27 0.41 0.47 0.53
United States 0.15 0.23 0.26 0.29
Rest of the world 0.24 0.32 0.36 0.41

98
Infrastructure for a Seamless Asia
trade. Kazakhstan gains most from improved trade, but other CAREC countries, especially the Kyrgyz Republic, also gain substantially. Countries also gain from improvements in transport operations. Thus, while the project’s primary goal is to improve regional transport links, it also greatly benefits domestic markets.
Central Asia is abundantly endowed with energy resources, and this is an important area for regional cooperation. One promising project is the Atasu-Alashankou pipeline extension, which would extend the existing oil pipeline 700 km westward, linking it directly to the Caspian Sea. It is estimated that this will reduce the costs of delivering oil to the PRC by as much as 40%, while also boosting the Kazakh economy.
The project is expected to boost Kazakhstan’s GDP by just over 1% by 2020. Kazakh exports are expected to rise by nearly $2.3 billion, or 3.4% over their estimated 2010 level. The PRC’s GDP will also rise.
Table 3.3. Sources of Real Household Income Growth (percentage change from baseline)
CAREC = Central Asia Regional Economic Cooperation.Note: Other CAREC countries includes: Afghanistan, Azerbaijan, Tajikistan, and Uzbekistan. Rest of East Asia includes: Hong Kong, China; Japan; Republic of Korea; Mongolia; and Taipei,China. Source: Roland-Holst (2008).
Country/Region Productivity Decline in Product Losses Trade
China, People’s Rep. of 0.15 0.11 0.08
Kazakhstan 1.74 2.45 3.26
Kyrgyz Republic 1.57 1.67 1.64
Other CAREC countries 1.10 1.09 1.01
Mongolia 0.59 0.54 0.43
Russian Federation 0.11 0.08 0.05
Rest of East Asia 0.08 0.06 0.03
South Asia 0.10 0.09 0.06
Southeast Asia 0.09 0.06 0.03

Harnessing the Benefits of Regional Infrastructure
99
While the rest of CAREC and the Russian Federation will experience short-term declines in GDP, they too will experience increased trade. These estimated gains far exceed the projected project costs of $850 million (Roland-Holst 2008). Table 3.4 details the impact of the pipeline extension in 2002 US dollars.
More detailed household income results are available only for Kazakhstan. The benefits to households from the pipeline project are twofold. First, there are direct income and employment gains from increased energy production and trade. These accrue primarily to urban households with workers in the energy-producing regions, and those living near the project. Second, there are indirect income and employment gains from the multiplier effects of spending by the direct beneficiaries. These are more widespread, but still benefit mainly urban populations, with some gains to the rural sector through the food market.
Table 3.4. Aggregate Impacts of Pipeline Extension, 2020 (in 2002 $ million)
CAREC = Central Asia Regional Economic Cooperation; GDP = gross domestic product.Notes: Other CAREC countries includes: Afghanistan, Azerbaijan, Tajikistan, and Uzbekistan. European Union (EU)-25 includes: Austria, Belgium, Cyprus, Czech Republic, Denmark, Estonia, Finland, France, Germany, Greece, Hungary, Ireland, Italy, Latvia, Lithuania, Luxembourg, Malta, Netherlands, Poland, Portugal, Slovakia, Slovenia, Spain, Sweden, and United Kingdom.Source: Roland-Holst (2008).
Country/Region
2020
GDP Consumption Investment Exports Imports
China, People’s Rep. of 141 70 139 553 621
Kazakhstan 2,301 1,509 187 2,266 1,661
Russian Federation -136 -80 -5 175 226
Other CAREC countries -96 3 4 13 116
EU-25 126 243 81 288 486
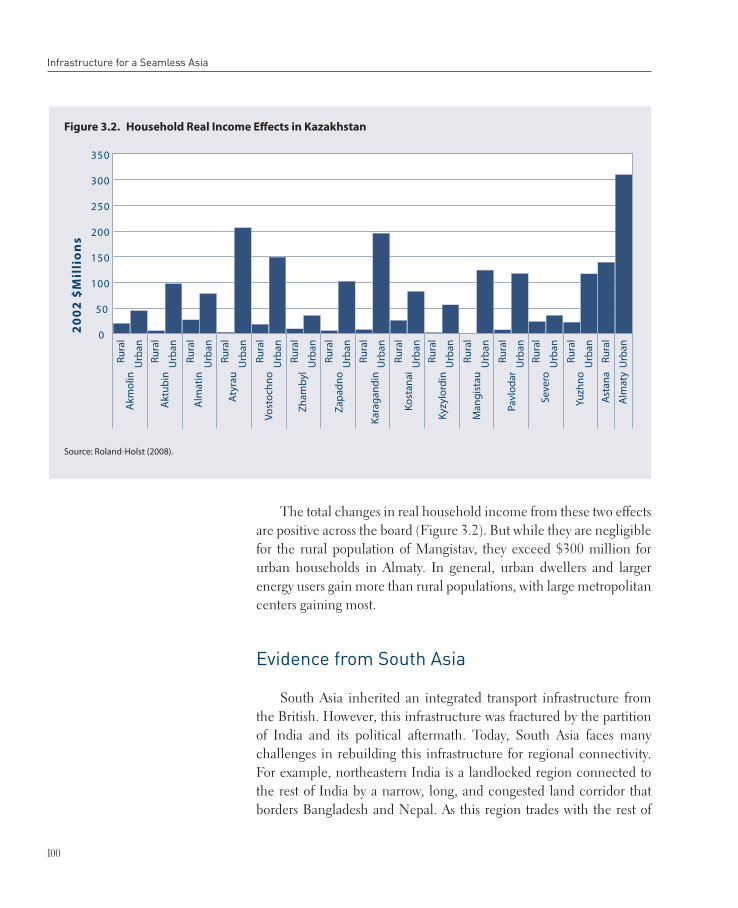
100
Infrastructure for a Seamless Asia
The total changes in real household income from these two effects are positive across the board (Figure 3.2). But while they are negligible for the rural population of Mangistav, they exceed $300 million for urban households in Almaty. In general, urban dwellers and larger energy users gain more than rural populations, with large metropolitan centers gaining most.
Evidence from South Asia
South Asia inherited an integrated transport infrastructure from the British. However, this infrastructure was fractured by the partition of India and its political aftermath. Today, South Asia faces many challenges in rebuilding this infrastructure for regional connectivity. For example, northeastern India is a landlocked region connected to the rest of India by a narrow, long, and congested land corridor that borders Bangladesh and Nepal. As this region trades with the rest of
Figure 3.2. Household Real Income Effects in Kazakhstan
Source: Roland-Holst (2008).
300
250
200
150
100
50
0
350
20
02
$M
illi
on
s
Rura
l
Urb
an
Rura
l
Urb
an
Rura
l
Urb
an
Rura
l
Urb
an
Rura
l
Urb
an
Rura
l
Urb
an
Rura
l
Urb
an
Rura
l
Urb
an
Rura
l
Urb
anRu
ral
Urb
an
Rura
l
Urb
an
Rura
l
Urb
anRu
ral
Urb
an
Rura
l
Urb
an
Rura
l
Urb
an
Akm
olin
Akt
ubin
Alm
atin
Aty
rau
Vost
ochn
o
Zham
byl
Zapa
dno
Kara
gand
in
Kost
anai
Kyzy
lord
in
Man
gist
au
Pavl
odar
Seve
ro
Yuzh
no
Ast
ana
Alm
aty

Harnessing the Benefits of Regional Infrastructure
101
India and the world through this strip of land, the costs of transporting goods to and from the area are very high. Third-country trade with both Nepal and Bhutan also goes through this corridor, causing delays and higher costs. An appropriate solution to this issue is to build a corridor from this region to the Chittagong port of Bangladesh. This will provide cost effective access for transporting goods to and from the landlocked region including northeastern India, Bhutan, and Nepal (ADB 2007i).
Improving the region’s infrastructure in order to reduce poverty is a major policy objective. South Asia is home to the world’s largest concentrations of poor people. Over 40% of rural Indians live on less than $1 a day, and some 88% on less than $2. A multiregional competitive CGE model—which covered Bangladesh, India, Nepal, Pakistan, and Sri Lanka, as well as (incompletely) the rest of the world—was used to determine the welfare impacts of developing transport infrastructure in northeastern India (Gilbert and Banik 2008). The road transport component of trade costs was reduced for intra-SASEC transport margins. The reduction was based on estimates that improved roads and transit would reduce the time spent on transport and processing by 20% (ADB 2007i).
The model predicts that transport improvements in the passage would boost GDP a little throughout the region (Table 3.5). Trade would also rise, with Bangladesh and Nepal gaining the most as a
Table 3.5. Aggregate Outcomes in South Asia
$ = United States dollar; EV = equivalent variation, an expression of changes in utility or welfare measured in dollars; GDP = gross domestic product.Source: Gilbert and Banik (2008).
Aggregate Outcome Pakistan Bangladesh India Sri Lanka Nepal
Change in GDP (%) 0.06 0.11 0.00 0.11 0.32
Change in exports (%) 0.12 0.48 0.06 0.10 0.63
Change in imports (%) 0.28 0.66 0.13 0.12 0.98
EV ($ million) 52.00 45.90 86.60 18.70 41.10
Cumulative EV ($ million) 2,600.80 2,295.10 4,330.30 933.80 2,057.10
Cumulative EV (% of GDP) 2.70 4.10 0.70 4.60 14.80

102
Infrastructure for a Seamless Asia
percentage of total trade. Taking the cumulative welfare gains over the life of the project and expressing them as a percentage of current GDP shows that Nepal would gain (14.8%) more than Sri Lanka (4.6%). In absolute terms, India would gain the most, by over $4.3 billion, followed by Pakistan at $2.6 billion. The region’s total welfare gains would greatly exceed the $80 million in anticipated loans from ADB.
The impact on household welfare of a reduction in regional transport costs is presented in Table 3.6. All household groups in Nepal would benefit, and these results are robust for all households. The biggest gainers would be small farm households (H3) and landless rural groups (H1), while smaller gains would accrue to large farm
Table 3.6. Household Welfare Impact of Transport Cost Reductions ($ million)
$ = United States dollar.Note: Household (H) categories are defined in Table A3.1 in the Appendix.Source: Gilbert and Banik (2008).
Household Category Pakistan Bangladesh India Sri Lanka Nepal
H1 0.4 0.6 92.3 3.5 11.3
H2 0.9 6.8 -6.6 5.1 10.4
H3 0.2 -1.2 14.6 1.6 14.2
H4 0.9 -11.7 -4.0 4.6 5.3
H5 2.6 10.7 0.8 3.8
H6 0.9 6.6 -2.9
H7 0.8 4.1 -2.7
H8 4.5 4.4 -2.0
H9 1.5 8.7 -2.9
H10 0.6 17.1
H11 0.6
H12 0.2
H13 0.4
H14 1.2
H15 0.1
H16 6.7
H17 1.7
H18 24.7
H19 3.2
Total 52.0 45.9 86.6 18.7 41.1

Harnessing the Benefits of Regional Infrastructure
103
households (H2) and the urban group (H4) (who tend to be richer on average). The distribution of gains in Nepal implies that a reduction in international transport margins would be pro-poor in both an absolute and a relative sense.
In Bangladesh, a reduction in transport margins has a positive impact on the welfare of all household groups except small (H3) and larger (H4) farmers. Small farmers, one of the poorer groups in the country, lose slightly; relatively large (and relatively rich) farmers lose more. The poorest groups, the rural landless (H1), marginal farmers (H2), and the urban illiterate (H7), all experience rising income. This suggests that a reduction in transport margins would be pro-poor in Bangladesh in an absolute sense. However, by far the largest gains accrue to the urban highly educated (H10), the richest household grouping in Bangladesh. Thus the changes are unlikely to lower relative poverty (i.e., income inequality) in Bangladesh.
India is expected to experience the largest absolute gains and the most severe distributional consequences. Welfare is predicted to fall among rural agricultural labor (H2) and other rural households (H4), as well as the urban self-employed (H6), salaried (H7), urban casual labor (H8), and other urban households (H9); although, only the results for the urban self-employed and urban salaried are robust. This may be problematic, since rural agricultural labor and other rural households are the poorest groups in the country. Of the three poorest groups, only rural non-agricultural labor (H3) sees a modest income increase. By far the biggest gainers as a group are large farmers (H1), who are middle income. This is due to the rise in (especially agricultural) export prices. This suggests that increases in the value of agricultural land would be the primary driver of household income changes in India. Overall, the policy may be marginally pro-poor in a relative sense, since the welfare of the richest groups fall, but it is unlikely to be pro-poor in an absolute sense. In effect, a reduction in transport margins would benefit agricultural landowners most.
The household impacts in Pakistan, where the most detailed household data are available, are all positive, suggesting a drop in absolute poverty levels. But the urban rich (H18) are by far the biggest

104
Infrastructure for a Seamless Asia
gainers, so relative poverty may increase. In Sri Lanka, the gains are relatively uniform across all household categories, although the impact on rural low-income households (H2) is sensitive to the parameters of the model.
Evidence from Southeast Asia
As the GMS of Southeast Asia has moved away from seeking self-sufficiency and instead has embraced regional cooperation, it has sought to develop its infrastructure links through a number of economic corridor projects. These have been supported by international agencies, including ADB, in the hope that they will greatly improve the region’s prospects.
The GMS is very diverse. It includes the landlocked Lao PDR as well as Viet Nam, which has over 3,400 km of coastline. Population density ranges from 25 people per square kilometer in the Lao PDR to more than 270 in Viet Nam. The GMS is home to some of Asia’s poorest people (in Cambodia and the Lao PDR, for example) as well as a relatively prosperous country (Thailand). The diversity of the GMS is both a challenge and an opportunity for regional cooperation.
Several studies have attempted to measure the impacts of various aspects of the GMS regional transport network, based on which economic projections were made using the global CGE model, Global Trade Analysis Project (GTAP) (Stone et al. 2008).35 These estimated impacts were based on progress on two fronts: improvements in physical connectivity from better roads and bridges along the various economic corridors, and the easier movement of goods and people thanks to the Cross-Border Transport Agreement (CBTA). Based on several
35 Details of these data and underlying assumptions can be found in Hertel (1997) and the GTAP website: https//www.gtap.agecon.purdue.edu.
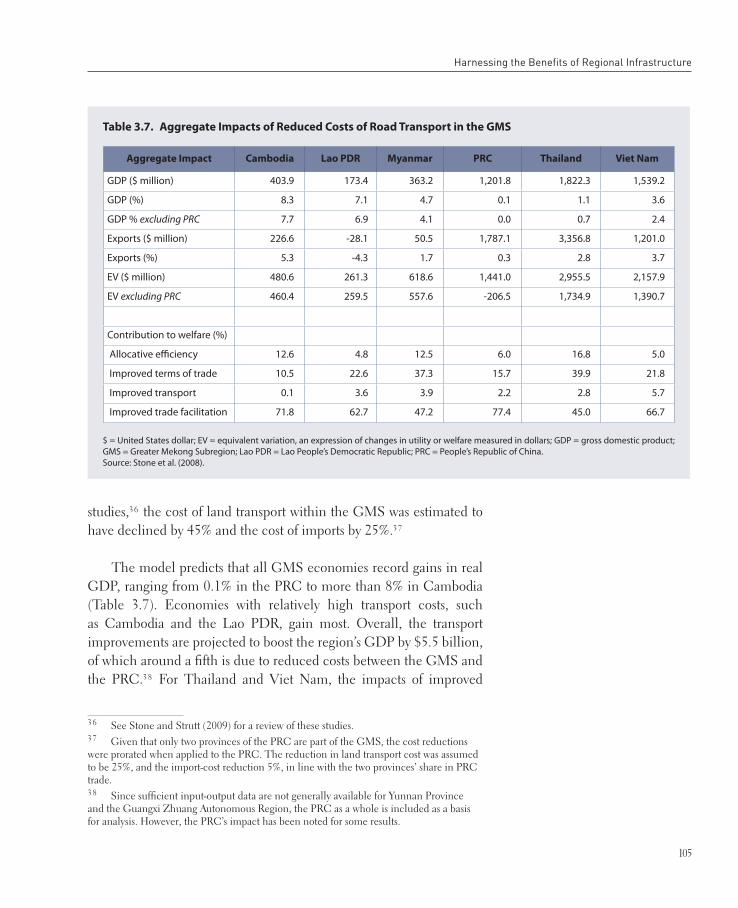
Harnessing the Benefits of Regional Infrastructure
105
studies,36 the cost of land transport within the GMS was estimated to have declined by 45% and the cost of imports by 25%.37
The model predicts that all GMS economies record gains in real GDP, ranging from 0.1% in the PRC to more than 8% in Cambodia (Table 3.7). Economies with relatively high transport costs, such as Cambodia and the Lao PDR, gain most. Overall, the transport improvements are projected to boost the region’s GDP by $5.5 billion, of which around a fifth is due to reduced costs between the GMS and the PRC.38 For Thailand and Viet Nam, the impacts of improved
36 See Stone and Strutt (2009) for a review of these studies.37 Given that only two provinces of the PRC are part of the GMS, the cost reductions were prorated when applied to the PRC. The reduction in land transport cost was assumed to be 25%, and the import-cost reduction 5%, in line with the two provinces’ share in PRC trade.38 Since sufficient input-output data are not generally available for Yunnan Province and the Guangxi Zhuang Autonomous Region, the PRC as a whole is included as a basis for analysis. However, the PRC’s impact has been noted for some results.
Table 3.7. Aggregate Impacts of Reduced Costs of Road Transport in the GMS
$ = United States dollar; EV = equivalent variation, an expression of changes in utility or welfare measured in dollars; GDP = gross domestic product; GMS = Greater Mekong Subregion; Lao PDR = Lao People’s Democratic Republic; PRC = People’s Republic of China.Source: Stone et al. (2008).
Aggregate Impact Cambodia Lao PDR Myanmar PRC Thailand Viet Nam
GDP ($ million) 403.9 173.4 363.2 1,201.8 1,822.3 1,539.2
GDP (%) 8.3 7.1 4.7 0.1 1.1 3.6
GDP % excluding PRC 7.7 6.9 4.1 0.0 0.7 2.4
Exports ($ million) 226.6 -28.1 50.5 1,787.1 3,356.8 1,201.0
Exports (%) 5.3 -4.3 1.7 0.3 2.8 3.7
EV ($ million) 480.6 261.3 618.6 1,441.0 2,955.5 2,157.9
EV excluding PRC 460.4 259.5 557.6 -206.5 1,734.9 1,390.7
Contribution to welfare (%)
Allocative efficiency 12.6 4.8 12.5 6.0 16.8 5.0
Improved terms of trade 10.5 22.6 37.3 15.7 39.9 21.8
Improved transport 0.1 3.6 3.9 2.2 2.8 5.7
Improved trade facilitation 71.8 62.7 47.2 77.4 45.0 66.7

106
Infrastructure for a Seamless Asia
transport links with the PRC account for over half of their GDP gains. Other GMS economies gain more from improved connections to other countries.
Exports increase everywhere except the Lao PDR, which experiences a slight loss in export share to countries outside the region. However, as the GMS economies realize the projected GDP gains shown in Table 3.7, the Lao PDR would most likely find ready local markets to replace these potential export declines. All GMS economies are expected to experience welfare gains, totaling almost $8 billion overall.
Of the $5.4 billion of transport and trade-related projects completed or ongoing in the GMS, $36.7 million has been devoted to facilitating cross-border trade and investment and the rest has been invested in the three transport corridor programs (East-West, North-South, and Southern). Using the conservative estimates reported above, the regional benefits of the entire program to date are almost 50% greater than the outlays. In the long term, as dynamic network externalities play out, these gains are likely to increase considerably.
Table 3.8 outlines the impact on poverty across various groups. Across the GMS-4—Cambodia, Lao PDR, Thailand, and Viet Nam—over 400,000 people move out of extreme poverty (a 4.5% decline), and some 1.75 million are lifted above the $2 a day poverty line (a 3.6% decline).39 Over half of those lifted above the $1 a day line are in Cambodia, and over half of those lifted above $2 a day are in Viet Nam. Most of the poverty reduction occurs in rural areas, with rural diversified households accounting for almost half of the poverty reduction at both poverty levels.
Comparing these results with those from country-specific studies highlights the substantial benefits of implementing projects regionally. For instance, the net benefits of the East-West Corridor to the Lao PDR and Viet Nam have been estimated at $295.5 million (ADB 2007f). But the benefits of integrating the entire GMS are far greater, producing welfare gains in excess of $260 million for the Lao PDR alone and
39 Sufficient household data for Myanmar were not available (see Stone et al. 2008).

Harnessing the Benefits of Regional Infrastructure
107
of over $2.4 billion for the Lao PDR and Viet Nam combined, as Table 3.7 shows. The welfare gains to the GMS, excluding the PRC, exceed $4.4 billion.
Table 3.8. Change in Poverty Headcount (by stratum and country)
$ = United States dollar; Lao PDR = Lao People’s Democratic Republic. Note: Greater Mekong Subregion (GMS)-4 includes: Cambodia, Lao PDR, Thailand, and Viet Nam. Source: Stone et al. (2008).
$1/day
Stratum Cambodia Lao PDR Thailand Viet Nam GMS-4
Agriculture 83,504 54,483 936 7,720 146,643
Non-agriculture 7,289 2,760 1,087 1,035 12,171
Urban labor 4,272 1,121 230 2,280 7,903
Rural labor 3,905 303 2,879 6,219 13,306
Transfer payments 1,658 236 9,670 6,010 17,574
Urban diversified 14,858 5,409 3,206 1,741 25,214
Rural diversified 101,467 11,323 35,994 34,762 183,546
Total 216,953 75,635 54,002 59,767 406,357
Percent Change 4.7 4.6 3.7 4.8 4.5
$2/day
Stratum Cambodia Lao PDR Thailand Viet Nam GMS-4
Agriculture 106,708 102,610 6,263 62,333 277,914
Non-agriculture 22,648 5,472 25,440 14,039 67,599
Urban labor 7,291 3,640 14,010 82,203 107,144
Rural labor 6,747 409 44,533 34,885 86,574
Transfer payments 1,333 190 22,142 4,560 28,225
Urban diversified 39,558 15,507 33,258 146,793 235,116
Rural diversified 198,348 36,923 161,429 549,520 946,220
Total 382,633 164,751 307,075 894,333 1,748,792
Percent Change 3.6 4.0 1.9 4.2 3.6
108
Infrastructure for a Seamless Asia
Looking at the relative impacts on poverty, Menon and Warr (2008) found that improving road quality in the Lao PDR alone lifts slightly over 1% of the population out of poverty. Regional action, in contrast, reduces the number of people in the Lao PDR living on less than $1 a day by 4.6%, and the number of people living on less than $2 a day by 4%. Clearly, the benefits of regional integration are significant.
Potential Negative Impacts3.4.
While regional infrastructure projects can bring big economic gains, they may also have negative impacts. For example, people may be displaced by hydropower schemes, agricultural land disrupted by road building, telecommunications towers located in highly populated regions. Unsightly or highly polluting installations such as power plants are often located in areas where the population is poor, vulnerable, and unable to fight such location decisions effectively.
An in-depth field survey on the impacts of the GMS NSEC in Cambodia conducted between September 2006 and February 2007 reported that 70% of residents along the corridor feared an increase in traffic accidents (Phyrum et al. 2007). Over 40% worried that human and drug trafficking would increase, while over 30% expressed concern about potential damage to the local environment and natural resources. Over 25% worried that HIV/AIDS40 transmission would rise with the increase in transit traffic, travelers, and prostitution.
Traffic accidents are a major concern across the developing world. A World Bank study found that, while death rates from most other factors tend to fall with development, traffic accidents are a notable exception (Koptis and Cropper 2003). Road traffic deaths per capita are increasing across the developing world, including Southeast Asia. The annual economic loss from road accidents in the GMS has been estimated at more than $4.7 billion, or more than 2% percent of
40 HIV is human immunodeficiency virus; AIDS is acquired immunodeficiency syndrome.

Harnessing the Benefits of Regional Infrastructure
109
GDP (ADB 2005d).41 Lost time, damaged cargo and vehicles, lack of insurance, injuries, and even death all add to the high costs of traffic accidents.
Border regions are often associated with drugs and human trafficking, and improvements in connectivity create opportunities for illegal businesses as well as legitimate ones. It has been reported that nearly a quarter of the local population in frontier villages of Cambodia are habitual drug users (ADB 2006d). Cross-border movement of illegal arms and terrorists is another menace; Southeast Asian governments began unofficially to share terrorist-related information after the Bali incidents in 2002 and 2005 (Japan International Cooperation Agency [JICA] 2007). It is debatable, however, to what extent such activities are caused by cross-border infrastructure projects, and to what extent they happen to coexist in border regions.
Perhaps most importantly, infrastructure projects give rise to environmental concerns. Specific projects often fail to consider the spillover impacts on neighboring regions and ecosystems. For example, drainage systems along road networks may cause flooding and thus affect the transportation network, and hydroelectric dams may affect downstream farms and fishing.
More broadly, it is vital that Asia’s investments in regional infrastructure support its shift to a low-carbon economy. Future energy supply plans, especially for power generation, need to shift toward greater emphasis on energy efficiency and renewable energy sources. Efficiency gains from regional connectivity and trading will be essential. Transport will also need to become greener, with greater priority given to low-carbon railways and waterways, and to the use of more fuel-efficient vehicles and cleaner fuels. Limiting deforestation and land degradation is another priority. Box 3.2 explains how the environmental impact of the GMS transport corridors could be improved.
41 This value is substantiated by the EU, which states that road crashes costs 1-3% of a country’s GDP. See http://www.ertico.com/en/subprojects/euindia/about_eu-india/road_safety_in_india/.

110
Infrastructure for a Seamless Asia
Box 3.2. Greening the GMS Transport Corridors
Transport is a major and growing source of greenhouse gas emissions in the GMS. Increases in economic growth and population are lengthening supply and distribution chains and increasing traffic. Road-based traffic is projected to more than double across the subregion
by 2015, with much of it due to increased freight haulage as intraregional trade increases. Without measures to mitigate the impact on air pollution and public health, improve energy and cost efficiency, and curb greenhouse-gas emissions, the increase in traffic is likely to have serious repercussions on development and the environment.
Freight traffic is already making a measurable contribution to GMS carbon dioxide emissions. Preliminary investigations show that freight traffic in the EWEC accounts for around 3% of total freight traffic in the region, and the NSEC around 4%. The EWEC from Da Nang in Viet Nam to Maulamyine in Myanmar contributes around 1 million tons of carbon dioxide annually, of which just over half comes from freight traffic. Without improvements in engine efficiency, carbon dioxide emissions from freight traffic will reach around 1.44 million tons by 2015, compared with 530,000 tons now.
The NSEC from Kunming in the PRC to Bangkok in Thailand produces 2 million tons, of which about 1.2 million tons is from freight traffic. Without improvements in engine efficiency, carbon dioxide from freight traffic emissions will rise from 0.7 million tons to around 2.2 million tons by 2015.
How can carbon intensity be reduced? One medium-term option is to increase carbon sequestration by maintaining and expanding forest cover in watersheds along transport corridors as well as undertaking strip plantation along GMS highways. This would have the added benefit of generating rural employment and encouraging the development of wood processing industries. Such efforts could be combined with the development and deployment of second-generation biofuels to reduce dependence on traditional fuels.
Policy frameworks and fiscal incentives can also help promote carbon reduction and carbon avoidance strategies. Logistics and haulage companies in the GMS could reduce their carbon emissions by deploying more fuel-efficient trucks. Governments could help achieve this by imposing tighter fuel-efficiency standards and providing fiscal incentives to promote the marketing of fuel-efficient freight engines and cover the cost of adjusting to low-carbon freight fleets.
The ADB-GMS Environment Operations Center is developing an investment framework for 2011–2015 that includes feasibility assessments of “greening” options for the EWEC and NSEC. It will focus on reducing the transport sector’s carbon footprint, improving system efficiencies, and strengthening forward and backward linkages with rural economies.
Source: ADB staff (2008).

Harnessing the Benefits of Regional Infrastructure
111
Overall Gains from Pan-Asian 3.5. Connectivity
Earlier sections have provided compelling evidence of the broader gains from creating subregional infrastructure networks in Asia. This section presents estimates of the overall real income gains from pan-Asian connectivity through required investment in infrastructure, namely transport, telecommunications, and energy.42
The estimates reported in this section are based on a CGE model to simulate the impact of an expansion of infrastructure in developing Asian economies. The methodology for estimating the gains is presented in Box 3.3.
The results show that developing Asia would gain significantly—as would the rest of the world. If the required investment toward pan-Asian connectivity were made in the region’s transport, communications, and energy infrastructure during 2010–2020 (as estimated in Chapter 5), the total net income gains (measured in present value in 2008 dollars) of developing Asia could reach $12.98 trillion, of which $4.43 trillion would be gained during 2010–2020 and $8.55 trillion would be gained beyond 2020. These benefits are particularly large for two types of regional economies: those that depend heavily on external trade and those for which the need for improved infrastructure is particularly acute.
The economy-wide gains stem from positive network externalities as discussed in section 3.1. In the case of investment in transport and communications infrastructure, one of the most important externalities is that it increases market access by lowering trade costs. The calculation assumes an investment of some $320 billion a year in transport and communications between 2010 and 2020. The estimated reduction in trade costs from increased infrastructure investment is presented in Table 3.9. Transport improvements would slash Indonesia’s trade costs by a quarter, India’s by more than a fifth, and the PRC’s by a seventh. The rest of Asia’s would also fall by a fifth. Improvements in communications would cut India’s trade costs by 11.2%.
42 Based on Zhai (2009).
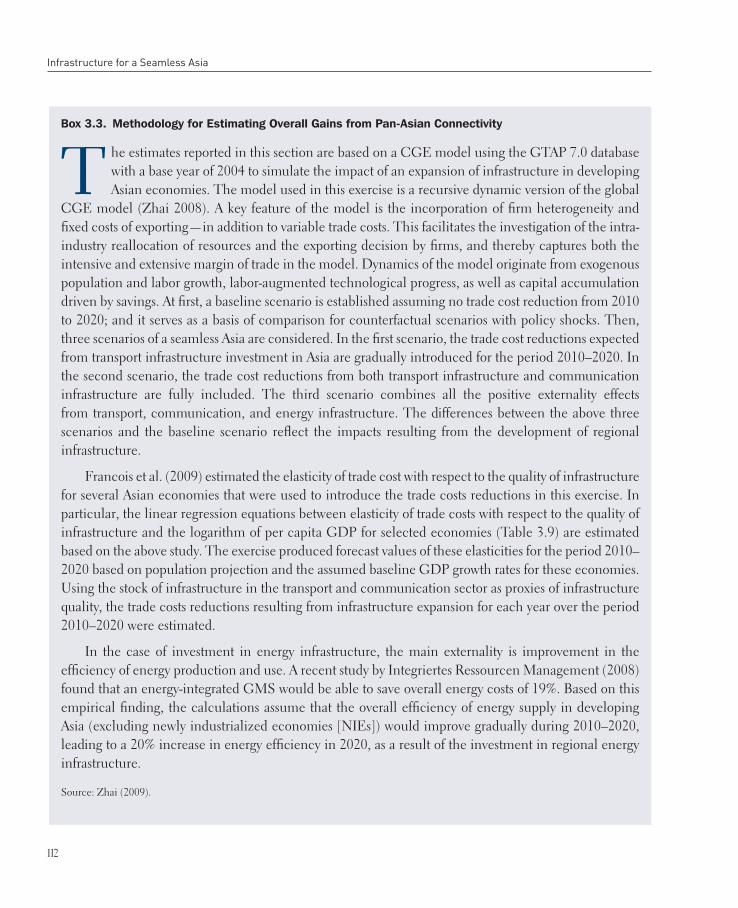
112
Infrastructure for a Seamless Asia
Box 3.3. Methodology for Estimating Overall Gains from Pan-Asian Connectivity
T he estimates reported in this section are based on a CGE model using the GTAP 7.0 database with a base year of 2004 to simulate the impact of an expansion of infrastructure in developing Asian economies. The model used in this exercise is a recursive dynamic version of the global
CGE model (Zhai 2008). A key feature of the model is the incorporation of firm heterogeneity and fixed costs of exporting—in addition to variable trade costs. This facilitates the investigation of the intra-industry reallocation of resources and the exporting decision by firms, and thereby captures both the intensive and extensive margin of trade in the model. Dynamics of the model originate from exogenous population and labor growth, labor-augmented technological progress, as well as capital accumulation driven by savings. At first, a baseline scenario is established assuming no trade cost reduction from 2010 to 2020; and it serves as a basis of comparison for counterfactual scenarios with policy shocks. Then, three scenarios of a seamless Asia are considered. In the first scenario, the trade cost reductions expected from transport infrastructure investment in Asia are gradually introduced for the period 2010–2020. In the second scenario, the trade cost reductions from both transport infrastructure and communication infrastructure are fully included. The third scenario combines all the positive externality effects from transport, communication, and energy infrastructure. The differences between the above three scenarios and the baseline scenario reflect the impacts resulting from the development of regional infrastructure.
Francois et al. (2009) estimated the elasticity of trade cost with respect to the quality of infrastructure for several Asian economies that were used to introduce the trade costs reductions in this exercise. In particular, the linear regression equations between elasticity of trade costs with respect to the quality of infrastructure and the logarithm of per capita GDP for selected economies (Table 3.9) are estimated based on the above study. The exercise produced forecast values of these elasticities for the period 2010–2020 based on population projection and the assumed baseline GDP growth rates for these economies. Using the stock of infrastructure in the transport and communication sector as proxies of infrastructure quality, the trade costs reductions resulting from infrastructure expansion for each year over the period 2010–2020 were estimated.
In the case of investment in energy infrastructure, the main externality is improvement in the efficiency of energy production and use. A recent study by Integriertes Ressourcen Management (2008) found that an energy-integrated GMS would be able to save overall energy costs of 19%. Based on this empirical finding, the calculations assume that the overall efficiency of energy supply in developing Asia (excluding newly industrialized economies [NIEs]) would improve gradually during 2010–2020, leading to a 20% increase in energy efficiency in 2020, as a result of the investment in regional energy infrastructure.
Source: Zhai (2009).

Harnessing the Benefits of Regional Infrastructure
113
The estimated total gains in real income, measured in present value in 2008 dollars using a discount rate of 5%, are set out in Table 3.10. It shows that developing Asia as a whole would reap net income gains of $7,840 billion from the expanded regional transport infrastructure; $11,240 billion from the investments in both transport and communications; and $12,980 billion from the investments in transport, communications, and energy. The PRC and India would be the biggest beneficiaries, gaining $3,550 billion and $3,140 billion, respectively. Southeast Asian countries could be significant winners, mainly due to their high dependence on trade and large infrastructure requirements. The total gains of Indonesia ($1,280 billion), Malaysia ($830 billion), Philippines ($220 billion), Thailand ($1,240 billion), and Viet Nam ($400 billion) would be $3,970 billion, higher than both the PRC and India, thanks to improvements in pan-Asian connections.
Table 3.9. Accumulated Reduction in Trade Costs Resulting from Infrastructure Investment, 2010–2020
(percentage of trade value)
Source: Zhai (2009).
Country/Region From Transport Infrastructure From Communication Infrastructure
China, People’s Rep. of 14.0 0.7
Indonesia 25.3 6.6
Malaysia 11.4 1.7
Philippines 15.6 0.0
Thailand 12.1 5.9
Viet Nam 13.2 3.1
Bangladesh 12.9 9.9
India 21.6 11.2
Pakistan 12.9 1.2
Sri Lanka 10.6 6.5
Central Asia 11.5 12.1
Rest of Asia 20.3 21.3
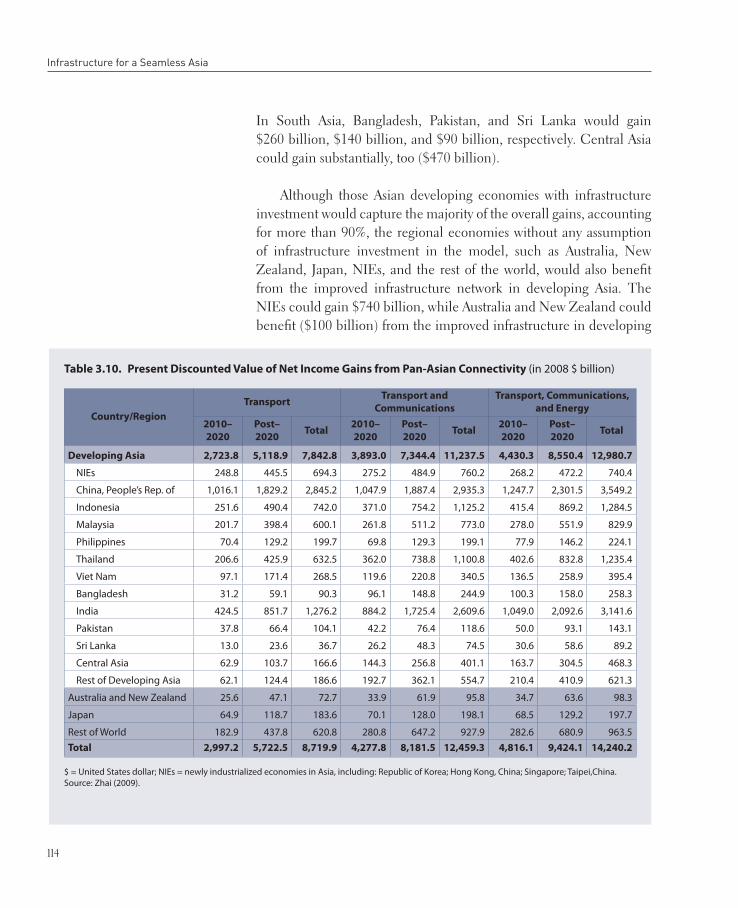
114
Infrastructure for a Seamless Asia
In South Asia, Bangladesh, Pakistan, and Sri Lanka would gain $260 billion, $140 billion, and $90 billion, respectively. Central Asia could gain substantially, too ($470 billion).
Although those Asian developing economies with infrastructure investment would capture the majority of the overall gains, accounting for more than 90%, the regional economies without any assumption of infrastructure investment in the model, such as Australia, New Zealand, Japan, NIEs, and the rest of the world, would also benefit from the improved infrastructure network in developing Asia. The NIEs could gain $740 billion, while Australia and New Zealand could benefit ($100 billion) from the improved infrastructure in developing
Table 3.10. Present Discounted Value of Net Income Gains from Pan-Asian Connectivity (in 2008 $ billion)
$ = United States dollar; NIEs = newly industrialized economies in Asia, including: Republic of Korea; Hong Kong, China; Singapore; Taipei,China. Source: Zhai (2009).
Country/Region
Transport Transport and
Communications
Transport, Communications,
and Energy
2010–
2020
Post–
2020Total
2010–
2020
Post–
2020Total
2010–
2020
Post–
2020Total
Developing Asia 2,723.8 5,118.9 7,842.8 3,893.0 7,344.4 11,237.5 4,430.3 8,550.4 12,980.7
NIEs 248.8 445.5 694.3 275.2 484.9 760.2 268.2 472.2 740.4
China, People’s Rep. of 1,016.1 1,829.2 2,845.2 1,047.9 1,887.4 2,935.3 1,247.7 2,301.5 3,549.2
Indonesia 251.6 490.4 742.0 371.0 754.2 1,125.2 415.4 869.2 1,284.5
Malaysia 201.7 398.4 600.1 261.8 511.2 773.0 278.0 551.9 829.9
Philippines 70.4 129.2 199.7 69.8 129.3 199.1 77.9 146.2 224.1
Thailand 206.6 425.9 632.5 362.0 738.8 1,100.8 402.6 832.8 1,235.4
Viet Nam 97.1 171.4 268.5 119.6 220.8 340.5 136.5 258.9 395.4
Bangladesh 31.2 59.1 90.3 96.1 148.8 244.9 100.3 158.0 258.3
India 424.5 851.7 1,276.2 884.2 1,725.4 2,609.6 1,049.0 2,092.6 3,141.6
Pakistan 37.8 66.4 104.1 42.2 76.4 118.6 50.0 93.1 143.1
Sri Lanka 13.0 23.6 36.7 26.2 48.3 74.5 30.6 58.6 89.2
Central Asia 62.9 103.7 166.6 144.3 256.8 401.1 163.7 304.5 468.3
Rest of Developing Asia 62.1 124.4 186.6 192.7 362.1 554.7 210.4 410.9 621.3
Australia and New Zealand 25.6 47.1 72.7 33.9 61.9 95.8 34.7 63.6 98.3
Japan 64.9 118.7 183.6 70.1 128.0 198.1 68.5 129.2 197.7
Rest of World 182.9 437.8 620.8 280.8 647.2 927.9 282.6 680.9 963.5Total 2,997.2 5,722.5 8,719.9 4,277.8 8,181.5 12,459.3 4,816.1 9,424.1 14,240.2

Harnessing the Benefits of Regional Infrastructure
115
Asia. Japan could capture a significant gain of $200 billion from infrastructure improvements in developing Asia. Real income gains in the rest of the world would be $960 billion.
Figure 3.3 shows trends in real income gains for developing Asia over 2010–2020 by country and country group. The annual gains would vary from $80 billion in 2011 to $370 billion in 2015 and $900 billion in 2020. On average, annual gains in the second half (2016–2020), around $670 billion per year, are much larger than in the first half (2011–2015), about $210 billion a year. The higher growth rate after 2016 can be explained by the effects of cumulative infrastructure investments made during the first half. This trend is visible in every country in the analysis. There are also large benefits even after 2020—when no new or replacement investments take place—but these benefits decline over time with the depreciation of infrastructure stock.
Figure 3.3. Trends in Real Income Gains During 2010–2020
$ = United States dollar; NIEs = newly industrialized economies in Asia, including: Republic of Korea; Hong Kong, China; Singapore; Taipei,China.Source: Zhai (2009).
0
100
200
300
400
500
600
700
800
900
1,000
Year
Re
al
Inc
om
e G
ain
s (
20
08
$ b
illi
on
)
Rest of Developing Asia
Central Asia
Sri Lanka
Bangladesh
Pakistan
India
Viet Nam
Thailand
Philippines
Malaysia
Indonesia
China, People’s Rep. of
NIEs
2010 2011 2012 2013 2014 2015 2016 2017 2018 2019 2020

116
Infrastructure for a Seamless Asia
Conclusions3.6.
The evidence presented in this chapter shows that regional infrastructure projects can boost growth and income, reduce poverty, and improve household welfare. Regional energy projects can also benefit the environment by reducing carbon emissions. The benefits of regional projects often spill over across countries in the region and beyond, illustrating the substantial and positive impact of creating regional infrastructure networks. The chapter finds that the benefits of subregional infrastructure projects in Central Asia, the GMS, and South Asia greatly exceed their costs. Furthermore, poverty declines substantially in each country in the respective subregions, particularly in the rural sector. Furthermore, improving pan-Asian connectivity in transport, telecommunications, and energy infrastructure would bring Asia very large income gains during 2010–2020 and beyond through increased market access, reduced trade costs, and more efficient energy production and use.
Notwithstanding the social and economic gains that large regional infrastructure projects bring, they also generate negative social and environmental impacts such as the displacement of people, human and drug trafficking, communicable diseases, smuggling, road accidents, environmental damage, and climate change. Addressing negative externalities through appropriate policies and institutions is extremely important. Chapter 4 discusses appropriate institutions and policies to address major negative externalities of infrastructure projects. To harness the gains of regional networks and ensure that those potentially disadvantaged by such projects are properly compensated, an effective project management system is needed. Managing regional projects is particularly complex and time consuming, and requires a systematic approach.
Developing
Effective Policies
and Institutions
Chapter 4

Developing Effective Policies and Institutions
119
Connecting a region together is not simply a matter of building physical infrastructure. It also requires a supportive framework of effective policies and institutions, both nationally and regionally (Kuroda et al. 2008). Such institutions provide the necessary
information, commitment, partnership, and coordination to support regional cooperation on infrastructure-related issues, while appropriate and effective policies help institutions deliver their objectives.
At a minimum, institutions can be informal arrangements that involve implicit or informal norms and understandings about the nature of acceptable behavior, without any legal binding or enforcement capacity—as is the case in CAREC. More ambitiously, institutions can be formal organizations that have explicit, often treaty-based, legally binding rules and regulations, with compliance and enforcement monitored by a standing body or secretariat (such as the European Commission [EC] in the case of the EU).
Asia has made some progress in developing regional cooperation in infrastructure over the past decade and a half. But further progress requires creating effective new institutions as well as developing and improving the coordination of existing ones—which, in turn, depends on the willingness and capacity of member countries. Without effective policies and institutions, cooperation is likely to be haphazard, limited, sporadic, and ultimately ineffective.
Asia can learn from the experience of its own subregional programs, as well as from experience in other regions, notably Latin America and Europe. But ultimately, it must craft policies and institutions that are
4. Developing Effective Policies
and Institutions

120
Infrastructure for a Seamless Asia
appropriate for its own unique needs and circumstances. Asia is very different from Latin America and Europe.
This chapter discusses the major issues involved in developing effective policies and institutions for regional infrastructure. It surveys the experiences of Europe and Latin America, and draws lessons for Asia. It also provides an overview of the policies and institutional structure of Asia’s subregional infrastructure programs, the major challenges they face, and the lessons learned. It concludes by proposing a policy and institutional framework for a seamless Asia. Financing infrastructure investment, including related institutional and policy issues, is dealt with in Chapter 5.
Components of Effective Policies and 4.1. Institutions
This section presents the important components of effective policies and institutions for regional infrastructure development. In addition to financing, these include coordinating, identifying, prioritizing, and preparing viable projects; developing appropriate (often harmonized) regulatory policies and legal frameworks; strengthening capacity-building programs; encouraging private sector participation; managing social and environmental problems; and promoting good governance.
Coordination
The success of a regional infrastructure project or program depends on the effectiveness of coordination among stakeholders. Such coordination may be among:
governments of participating countries and regional institutions;provincial governments of a participating country and governments of other participating countries;planning agencies within and among countries, such as national and provincial development offices;

Developing Effective Policies and Institutions
121
sectoral agencies within and among countries, in areas such as transport, the environment, energy, and telecommunications; and/orlocal or provincial governments and national or federal governments.
The challenge is not only to coordinate among equivalent agencies in different countries; it is to coordinate among various agencies within a country and across countries, for instance, between planning and financing agencies. Close coordination among national agencies with different objectives, such as transport ministries and environmental agencies, is important.
The coordination problems that regional infrastructure projects entail may also exist nationally, particularly in large federal countries. If local, rather than national, authorities are responsible for infrastructure spending, they may favor strictly local projects over those with greater national (or regional) importance.43 In such circumstances, coordination between the national government and local authorities, and even among the latter, is vital (Zhang 2008b).
Identification, Prioritization, and Preparation of Viable Projects
As regional infrastructure development is a lengthy, complex, expensive, and rigorous process, senior policymakers and qualified experts need to identify, prioritize, and prepare viable projects. The risk otherwise is that the wrong projects will get built, desirable ones will be passed over, and projects will be developed inefficiently. In this regard, the participation of a representative set of stakeholders through appropriate institutional arrangements at both the national and subregional levels is crucial for the prioritization of projects (UNESCAP 2008c).
43 For example, in the PRC, Yunnan Province in 1992 and Guanxi Zhuang Autonomous Region in 2004 found it useful to participate in the GMS program.

122
Infrastructure for a Seamless Asia
Standards, Regulatory Policies, and Legal Frameworks
Regional infrastructure projects require appropriate—and where possible, harmonized—regulatory and legal frameworks to define:
rights of passage for goods, people, and vehicles; permits, licenses, and other measures to facilitate transit rights, and arrangements to compensate transit countries for granting those rights as well as for other costs and risks such transit entails; consultation and dispute-settlement mechanisms; and jurisdiction and responsibility over title and ownership of offshore pipeline segments, particularly those outside a state’s territorial waters.
Comprehensive and transparent regulatory frameworks are needed in order to implement regulations effectively. For example, Bangladesh and India have a bilateral inland waterways protocol, but its role has been hindered by a number of restrictions on the movement of vessels and by a lack of harmonized customs procedures and standards. Both SASEC and CAREC have proposed multinational regulatory frameworks and policies but are facing problems in implementing them.
Regional infrastructure also requires the liberalization and harmonization of economic regulations and procedures to promote closer economic integration. This includes regulations in areas such as trade, investment, utilities, transport, energy, private sector participation, environmental protection, and design standards, as well as effective institutions to implement these regulations. Standards, conformity assessments, and technical regulations are the main technical barriers to regional trade. Enhancing and harmonizing the standards and quality of infrastructure assets and services are essential for the success of subregional programs.

Developing Effective Policies and Institutions
123
Strengthening Capacity Building
While national authorities’ commitment to infrastructure projects and their capacity to deal with technical and operational aspects are important, they must also be willing and able to adjust national rules and regulations where necessary. Well-trained staff is essential.44 Many studies have shown that regulatory offices in developing countries tend to be small, understaffed, and often more expensive to run (in relation to GDP) than those in developed economies (Stone 2008). Most developing economies in Asia lack experts trained in regulatory policy analysis and contract design.
Encouraging Private Sector Participation
Asia’s infrastructure needs—for both new investment and for the maintenance and replacement of existing assets—are so great that they cannot be financed by the public sector alone. Governments therefore need to encourage private investment in regional infrastructure. In addition to providing capital, private sector participation can bring technical expertise and managerial competence. It can also help boost the coverage and efficiency of infrastructure services.
Managing Social and Environmental Problems
Physical infrastructure needs to be designed, built, and operated in ways that do not threaten the long-term viability of social, economic, environmental, and ecological systems. In addition to their substantial social and economic benefits, large infrastructure projects often generate negative social and environmental impacts such as the displacement of people, undesired migration, human trafficking, communicable diseases, smuggling, and road accidents. Addressing negative externalities requires appropriate regulatory policies, legal
44 In Chile, for instance, each spending ministry has a small, highly trained group of experts capable of making professional and objective evaluations of new spending proposals, including national and regional infrastructure projects. As a result, Chile is widely admired for the efficiency of its public spending, and has attracted billions of dollars in private investment in national infrastructure projects.

124
Infrastructure for a Seamless Asia
frameworks, and harmonized standards, as well as institutions to implement these policies nationally and regionally.
Governance
Political risk and governance issues greatly limit the possibility of attracting private funding (Alburo 2008). The risk that future governments may not live up to their predecessors’ commitments to private investors or regional partners may be reduced by organizing projects in partnership with MDBs and by having other regional institutions provide guarantees against such risks.
More broadly, project implementation faces serious problems when laws are not enforced or when institutions are subverted. International conventions can sometimes, but not always, help address governance issues. A failure to tackle these issues can deter private investment in infrastructure and can even make borrowing from MDBs more expensive. Poor governance can also distort design and construction, raise the cost, and reduce the value of infrastructure (Tanzi and Davoodi 1998).
Good governance is essential for making infrastructure development successful, sustainable, and inclusive. This underscores the importance of policy and institutions that ensure that scarce resources are not wasted on unproductive investments and that projects achieve their social and environmental goals.
European and Latin American 4.2. Experience
The policies and institutions that Europe and Latin America have adopted for regional infrastructure development may provide important lessons for Asia. It is worthwhile to review these structures so as not to repeat the mistakes others have made.

Developing Effective Policies and Institutions
125
The European Union’s Experience45
The EU is the world’s largest and most developed regional institution, with 27 member countries.46 It has a comprehensive agenda, strong supranational institutions, and a functioning mechanism for enforcing its agreements. Unlike other regional institutions, it also possesses Structural and Cohesion Funds to help poorer parts of the Union, including by helping to finance regional infrastructure.
The EC is the driving force in the EU’s institutional system. The four major roles of the EC are to propose legislation to the European Parliament and the European Council; to administer and implement EC policies; to enforce EC law (jointly with the European Court of Justice); and to negotiate international agreements, mainly those relating to trade and cooperation. In this regard, policy and institutional issues are still handled by the EC, which also helps member countries develop TENs, set up PPPs, and obtain EU funds or European Investment Bank (EIB) support.
The EU seeks to develop regional infrastructure through TENs. These aim to underpin Europe’s single market, strengthen EU cohesion, and boost economic growth. Recognizing that inadequate regional infrastructure acts as a barrier to trade and labor mobility, EU governments in 1992 provided the legal basis for TENs in the Maastricht Treaty. This defines the EU’s responsibilities (Nunez-Ferrer 2007a, 2007b) as:
establishing guidelines for identifying projects of common interest; implementing measures necessary for effective cross-border network interoperability; supporting projects of common interest, for example, through feasibility studies, loan guarantees, or interest-rate subsidies;
45 This subsection is based primarily on Tanzi (2008) and van der Geest and Nunez-Ferrer (2008b).46 Its members are Austria, Belgium, Bulgaria, Cyprus, Czech Republic, Denmark, Estonia, Finland, France, Germany, Greece, Hungary, Ireland, Italy, Latvia, Lithuania, Luxembourg, Malta, Netherlands, Poland, Portugal, Romania, Slovakia, Slovenia, Spain, Sweden, and United Kingdom (UK).
126
Infrastructure for a Seamless Asia
contributing financing through the Cohesion Fund; and promoting coordination among member countries.
The planning and financing of TENs has been managed supranationally. Three types of infrastructure networks have been established under TEN: Trans-European Transport Networks (TEN-T), the Trans-European Energy Network (TEN-E or TEN-Energy), and the Trans-European Telecommunications Network (eTEN).
In 1996, the EU agreed on guidelines for developing TENs.47 Initially, the emphasis was on transport, primarily because the potential economic benefits of increased trade and mobility were clear, while energy and telecommunications were still often controlled by public companies or powerful national champions. In the case of energy, the creation of TENs required the politically sensitive opening of national markets to competition, and the privatization and unbundling of the energy sector, which is still incomplete.
TEN-T seeks to create efficient integrated EU transport networks by building new and improving existing infrastructure. Its objective is to allow people and goods to transfer freely from the network of one country to those of others, and from one transport mode, such as roads, to another, such as railways. A target of 2020 was set for the TEN-T, with five networks—roads, railroads, inland waterways, ports, and airports—established.
In the transport sector, the Transport Executive Agency (TEA) was established in 2006 to assist TEN-T’s development. In 2008, TEA took over from the EC the tasks of managing, monitoring, and assisting member states’ implementation of TEN-T projects, with the assistance of the European coordinators, who produce annual progress reports.48
TEN-E aims to integrate the EU energy market to increase its efficiency (Box A4.1 in the Appendix). The EU is a large net importer of energy, although some member states produce significant amounts
47 Decision No 1692/96/EC of the European Parliament and of the Council of 23 July 1996 on community guidelines for the development of the TEN-T.48 For details, see http://ec.europa.eu/ten/transport/coordinators/index_en.htm

Developing Effective Policies and Institutions
127
of oil, gas, and nuclear power that could be traded within the region, along with surplus electricity. EU guidelines give priority to projects that increase competition, strengthen EU energy security, and increase the supply of renewable energy. As a result, there is now some (but not much) cross-border electricity trading. New guidelines for TEN-E list and rank, according to the objectives and priorities laid down, projects eligible for European Economic Community assistance, and introduce the concept of “project of European interest.” TEN-E guidelines also strengthen project coordination and now fully incorporate the new member states. However, in the energy sector, a separate executive agency like TEA has not been established. Projects are followed up within the EC, with the assistance of the European Coordinators.
Environmental issues have a big impact on energy projects. European countries follow differing procedures that reflect different national laws. Harmonizing procedures and rules has proved difficult, as has coordinated action to speed up the approval process in the energy sector. These remain big challenges.
eTEN provides funds to make e-services available throughout the EU. The European Economic Community eTEN program helps to stimulate the deployment of innovative, trans-European e-services of social or economic interest. eTEN supports the deployment of e-services in the areas of eGovernment, eHealth, eLearning, eInclusion, Trust and Security, and small- and medium-sized enterprises. These services are expected to contribute to growth within the EU, employment, social cohesion, and to help everyone participate in the new knowledge-based economy (eTEN brochure 2009).
Decision-Making and Management of TENs
EU institutions have facilitated TENs’ development. The EC helped propose them, convinced member states of their importance, ensured their inclusion in the Maastricht Treaty, and is now tasked with ensuring the treaty’s implementation. Managing TENs’ development presents four major challenges:
achieving agreement on priorities,enforcing commitments,

128
Infrastructure for a Seamless Asia
streamlining management structures across member states, and finding a formula for burden sharing.
Achieving agreement on priorities. The EC cannot dictate to member states concerning infrastructure spending, but it can propose projects and then have some influence over them if EU funding is involved. Its first task has been to help member states to agree on a set of priority TEN projects. Figure 4.1 presents the EC’s role in guiding TEN developments.
Figure 4.1. Role of EU Institutions in TENs’ Decision Making and Management
DG = Directorate-General; EIB = European Investment Bank; EU = European Union; TEN = Trans-European Network; TEN-T = Trans-European Transport Network.Source: van der Geest and Nunez-Ferrer (2008b).
EU Funding EIB Funding National Funding
EU influence on the management depends on the source of funds. EU rules on public procurement and assessment standards, notably on environmental impacts, apply. Member states also have to follow interoperability decisions. By appointing high-ranking European Coordinators to follow up projects, the EU possesses indirect influence.
If cohesion funding, then DG Regional Policy has important role in approval, timeframe, and specifications.
Proposes, monitors TEN, offers funds and assistance
European Commission, Directorate-General
Energy and TransportMember States
Propose projects, agree on TEN lists
If TEN funding, DG Transport and Energy (or the TEN-T agency) has some power on approval and timeframe.
EIB has influence over project specifications and manage-ment.
EU influence weak. No influence from European institutions on time frame or specifications, although EU agreements on interoperability exist.

Developing Effective Policies and Institutions
129
Criteria for selecting regional infrastructure projects. The criteria for choosing projects for TEN-T include potential economic viability, or a socioeconomic cost-benefit analysis; impacts on the mobility of goods and persons; impacts on cohesion and sustainable development; and the degree of commitment on the part of the member states. This last criterion is supposed to guarantee that national authorities will work closely with the EC in the pursuit of the EU’s objectives.
Enforcement of regional infrastructure commitments. The appointment of European coordinators, high-profile political appointees who oversee projects’ implementation, creates pressure to foster TENs’ development. But it is easier for the EU to ensure that TENs are developed in poorer member states that make use of EU Cohesion Funds than in wealthier member states that do not.
Streamlining of management structures and obligations. Member countries each have their own assessment techniques and administrative procedures for the approval and implementation of infrastructure projects, but European institutions help set up joint management mechanisms. EU law also provides for the creation of “European companies,” greatly facilitating cross-border cooperation.
Burden sharing. The costs and benefits of regional infrastructure are often unevenly distributed across countries. For instance, transit countries can suffer disproportionately from pollution. In this context, the EU acts as a facilitator to ensure that projects are equitable. The EU has agreed on common rail and road rules to facilitate the creation of regional transport infrastructure. For example, the European Railway Agency was established to implement EU directives on railway network interoperability, including common rules for the design, construction, service delivery, upgrading, renewal, operation, and maintenance of parts of the system, as well as on staff’s qualifications and on health and safety conditions. The EU has also produced directives for roads and air transport networks.

130
Infrastructure for a Seamless Asia
Latin America’s Experience49
Latin America’s integration has been driven by three main subregional initiatives that pursue regional infrastructure projects:
the Initiative for the Integration of Regional South American Infrastructure (IIRSA), an informal institution comprised of 12 Latin American countries50—established in 2000 and supported primarily by the Inter-American Development Bank (IDB)—that aims to build better regional connections; the Plan Puebla Panama (PLPP), a formal institution established in 2001 by nine Latin American countries51 to create regional infrastructure that would develop the corridor from Puebla (in the south of Mexico) to Panama; and the four members of the Andean Community,52 which was set up in 1969 and has more recently sought to develop regional infrastructure.
IIRSA aims to promote regional integration and trade, develop regional production networks, and make the region more internationally competitive, not least by building better roads and by simplifying and harmonizing regulations. It was set up when IDB presented the Plan of Action for the Integration of South American Infrastructure to South American heads of state, who agreed to proceed with it. Much of the responsibility for the preparatory and technical work has fallen on IDB, assisted by the Corporación Andina de Fomento (CAF), a multilateral financial institution.53 Other development institutions that have played significant roles include the World Bank, the Fondo Financiero para el Desarollo de la Cuenca del Plata (FONPLATA),54 and the Brazil
49 This section is based on Tanzi (2008).50 Member countries are Argentina, Bolivia, Brazil, Chile, Colombia, Ecuador, Guyana, Paraguay, Peru, Surinam, Uruguay, and Venezuela.51 Belize, Colombia, Costa Rica, El Salvador, Guatemala, Honduras, Mexico, Nicaragua, and Panama.52 Bolivia, Colombia, Ecuador, and Peru.53 CAF was created in 1970 and has been the largest financial agent for infrastructure projects in Latin America.54 FONPLATA was created in 1971 to finance projects for transportation, agriculture and livestock, industry, and others in the basin of the River Plate.

Developing Effective Policies and Institutions
131
National Development Bank (BNDES),55 all of which finance cross-border projects that could be brought under the umbrella of IIRSA.
Institutionally, IIRSA is a forum for dialogue with several decision-making layers. These are the executive steering committee, composed of national ministers; national coordinators; and countries’ executive technical groups. All are advised by a technical coordinating committee that includes staff from international institutions such as IDB, CAF, FONPLATA, and BNDES. The World Bank also provides some assistance. Regular meetings rotate among the 12 member countries.
IIRSA’s achievements so far have been modest. A series of overlapping “development axes”—essentially regional development plans—have been identified. A lot of technical work has been done in areas such as establishing a list of infrastructure projects that would promote the region’s integration and development; promoting a forum for discussion and cooperation among regulatory and infrastructure planning agencies; and developing new instruments to improve the selection and the construction of trans-national infrastructure projects. As a result, members’ national investment budgets have slowly taken on an increasingly regional orientation.
By the end of 2007, some 506 projects with an estimated total cost of $68.3 billion had been proposed. To accelerate the execution of the IIRSA plan, 31 top priority projects with a total cost of $6.4 billion were selected for implementation. More than half of these required investment from more than one country; the rest were national projects with a strong “bridging effect” among countries. But while IIRSA has helped filter out financially nonviable and more generally unproductive projects, its impact on actual infrastructure investment has been marginal. Of the 31 priority projects, only one has been completed. Eleven are being built, while the rest are still at the bidding or preparatory stage.
The PLPP aims to create a trade and development corridor in Central America. Institutionally, it has an executive commission—
55 BNDES, a Brazilian public bank with significant resources, has been financing large projects in Brazil and throughout Latin America.

132
Infrastructure for a Seamless Asia
made up (mostly) of ministers from member countries and cochaired by Mexico and another member—to set and oversee the plan’s implementation. It is assisted by an interinstitutional technical group that includes representatives of several international institutions. It also has an executive directorate made up of technical specialists. A commission for the promotion and financing of the plan, coordinated by the president of IDB and also including the presidents of the Central American Bank for Economic Integration, CAF, and the Instituto de Credito Oficial de España, seeks to promote the financing of projects that have been selected. Spain continues to play an active role, not only because of its historical and cultural connections, but because it is the most likely financial backer. A consultative council coordinates contact with civil society.
Like IIRSA, the PLPP did not create a specific new institution, but rather a “conceptual umbrella” to bring together various development plans and complement them with ambitious new ones. The PLPP’s focus is on road development, but it also proposes connecting electricity grids; developing hydroelectric power, ports, airports, bridges, and a fiber optic network; and improving tourism infrastructure (Pickard 2002). Unlike IIRSA but similarly to the GMS, the transport and electricity improvements aim to attract industries to the region to make use of its abundant, cheap labor to produce products for export.
The PLPP has grand ambitions but it has yet to achieve much. It lacks funding, since national budgets are tight and private investors have not been forthcoming. IDB and others have been reluctant to lend because of resistance from people—notably, indigenous communities—who would be displaced from their traditional lands by the new roads, which would also pass through environmentally fragile areas.
The Andean Community is a long-established subregional cooperation initiative in Latin America that started upon the signing of the Cartagena Agreement in 1969. It was known as the Andean Pact56 until 1996. It has been undertaking programs for strengthening regional
56 For further details, see: http://www.grouplamerica.com/andean_pact.htm

Developing Effective Policies and Institutions
133
infrastructure since 2005. The member countries belong to the Andean axis, and have prioritized IIRSA projects. Efforts are also being made to reactivate the Andean Committee on Road Infrastructure, a forum to coordinate road projects and systems in the region.
Lessons for Asia
The experience of the EU offers the following important lessons for Asia:
Creating a framework for regional infrastructure cooperation often requires the active role of a third party—an honest broker—to forge a convergence of interests. Supranational institutions, particularly the EC and the EIB, have fulfilled such a facilitating and enabling role in the EU. The EU’s experience also underscores the vital importance of national governments and good governance.The success of particular regional infrastructure projects requires tripartite and multilateral initiatives. These may take the form of “coordinators,” akin to those for TEN-T projects. Alternatively, special purpose vehicles—companies owned by the relevant governments along with multilateral institutions—may be considered. In Asia, where the framework for regional infrastructure cooperation is not as developed as in the EU, the role of the honest broker could be filled by multilateral institutions such as ADB, UNESCAP, or a new neutral organization. These organizations could appoint coordinators from among top-level decision makers in the region.
Moreover, Latin America’s regional cooperation efforts have similarities to Asia’s and offer the following valuable lessons:
A forum for dialogue and cooperation such as IIRSA can help build awareness of the benefits of regional integration and infrastructure, filter out unproductive projects, coordinate among various national and subnational agencies, and increase stakeholders’ participation.

134
Infrastructure for a Seamless Asia
Prioritizing a small number of regional projects is a good way to build momentum. Pursuing too many projects at once often results in hardly any being built. Attracting funding from multilateral institutions—in Latin America’s case, IDB—is vital. This is one reason why it is important that contentious issues, such as the displacement of people by big infrastructure projects, be handled delicately and that efforts be made to minimize such problems. Assisting less developed countries in building their supply and institutional capabilities is vital. IIRSA has done valuable work in this area. Many Asian countries lack the capacity and regulatory framework even to conceptualize an infrastructure upgrade, let alone to implement one.
Asia’s Regional Infrastructure 4.3. Programs: Policies and Institutional Arrangements
As highlighted in Chapter 1, there are several pan-Asian and subregional infrastructure cooperation initiatives in Asia. This section reviews their institutional arrangements and policies.
Pan-Asia
The AH and the TAR initiatives are being formalized through intergovernmental agreements by participating countries to ensure effective coordination of national planning with regional requirements, as well as the regular regionwide review and updating of the network. UNESCAP acts as the secretariat for these agreements. The goals of these initiatives are to facilitate international trade and tourism and promote regional integration and international cooperation. Countries’ efforts to develop such an Asian transport network started in 1959. The identification of the AH and TAR has progressed mainly since 1992, when UNESCAP initiated the ALTID project. The number of member countries participating in the AH program increased from 18 in 1995 to 25 in 1996, to 31 in 2001, and reached 32 in 2003. The coverage of

Developing Effective Policies and Institutions
135
the TAR network expanded from five member countries in 1995 to 13 in 1999 and reached 28 in 2008. The intergovernmental agreements on the AH and TAR, which have been signed by 28 (of 32) and 22 (of 28) Asian countries, respectively, are examples of existing pan-Asian infrastructure initiatives. The AH agreement came into force on 4 July 2005 with 23 member countries57 ratifying it. The TAR agreement was ratified by nine countries58 and came into force on 11 June 2009. The agreements are treaties that provide a framework for the coordination of development in Asia as well as in Europe. They are also platforms wherein the member countries discuss policy, institutional, and technical issues related to developing the networks and increasing the networks’ operational efficiency (UNESCAP 2009a, 2009b).
For the AH, a working group was created to facilitate implementation of the agreement and to consider any amendments to it. This group also serves as a forum to discuss policies and issues related to the development of international highways in member states. The group has met twice, in 2005 and 2007 (UNESCAP 2009a).
In April 2008, a Forum of Asian Ministers of Transport that would hold meetings every two to three years was established. The first meeting is expected to be held in December 2009. The objective of the Forum of Asian Ministers of Transport is to facilitate closer cooperation and more frequent interactions between the member countries at the ministerial level in order to provide strategic guidance for the handling of the organization and operation of land transport, including infrastructure and its technical operation, and the economic and commercial sides of transport operations. The possible areas of debate and political guidance by the ministers include: (i) transport infrastructure development, (ii) transport facilitation, (iii) transport logistics, (iv) road safety, and (v) general policy issues (UNESCAP 2007c, 2009c; Ha 2008).
57 Afghanistan, Armenia, Azerbaijan, Bhutan, Cambodia, PRC, Georgia, India, Japan, Kazakhstan, Kyrgyz Republic, Lao PDR, Mongolia, Myanmar, Pakistan, Philippines, Republic of Korea, Russian Federation, Sri Lanka, Tajikistan, Thailand, Uzbekistan, and Viet Nam (as of January 2008).58 Cambodia, Georgia, PRC, India, Republic of Korea, Mongolia, Russian Federation, Tajikistan, and Thailand (as of May 2009).

136
Infrastructure for a Seamless Asia
Subregions
In addition to these pan-Asian initiatives, various subregional groups are addressing regional infrastructure issues to different degrees. These programs are presented in Table 4.1 along with their
Table 4.1. Key Characteristics of Regional and Subregional Institutions and Programs Involved in Infrastructure
RegionFunctions
Integration Security Trade Finance Infrastructure Socioeconomic
Asia
ASEAN � � � � � �
GMS � � � �
MRC c � � � �
IMT-GT � � � �
BIMP-EAGA � � � �
BIMSTEC � � � �
CAREC � � � �
SAARC � � � � �
SASEC � � � �
SECSCA � � �
PIF � � � � �
Latin America
CAN � � � � �
IIRSA � �
PLPP � �
Europe
EU � � � � � �
ASEAN = Association of Southeast Asian Nations; BIMP-EAGA = Brunei Darussalam Indonesia Malaysia Philippines – East ASEAN Growth Area; BIMSTEC = Bay of Bengal Initiative for Multi-Sectoral Technical and Economic Cooperation; CAN = Andean Community; CAREC = Central Asia Regional Economic Cooperation; EU = European Union; GMS = Greater Mekong Subregion; IIRSA = Initiative for the Integration of Regional South American Infrastructure; IMT-GT = Indonesia-Malaysia-Thailand Growth Triangle; MRC = Mekong River Commission; PIF = Pacific Island Forum; PLPP = Plan Puebla Panama; SAARC = South Asian Association for Regional Cooperation; SASEC = South Asia Subregional Economic Cooperation; SECSCA = Subregional Economic Cooperation in South and Central Asia.Notes: a Summit refers to summit of heads of state and government.b Modalities: A =advisory, F =financing, and R =regulatory.c Covers only management and use of the Mekong River.Sources: Bhattacharyay and De (2009), Linn and Pidufala (2008), compilation from subregional programs’ websites, and Asian Regional Integration Center website.

Developing Effective Policies and Institutions
137
key characteristics: their functions, form59 (formal or informal), level of participation, and operational modalities (advisory, regulatory, and financing). Most of Asia’s subregional institutions are informal, with the
59 Institutions can be informal arrangements that involve implicit or informal norms and understandings about the nature of acceptable behavior, without any legal binding or enforcement capacity—as is the case in CAREC. Institutions can be formal organizations that have explicit, often treaty-based, legally binding rules and regulations with compliance and enforcement monitored by a standing body or secretariat such as the EC in the case of the EU.
Form of Institution Highest Levela Modalitiesb Members/Participants
Formal Summit A, R 10 countries
Informal Summit/ministerial A, F, R 6 countries, ADB
Informal Senior officials A, F, R 4 countries
Informal Summit A, F, R 3 countries
Informal Summit A, F, R 4 countries, ADB
Informal Summit/ministerial A, F, R 7 countries
Informal Ministerial A, F, R 8 countries, 6 multilateral institutions
Formal Summit/ministerial A, F, R 8 countries, 9 observers
Informal Senior officials A, F, R 4 countries, ADB
Informal Ministerial A, F, R 6 countries, 1 observer, ADB
Informal Forum leaders A, R 16 countries, 4 country observers, ADB
Formal Senior officials A 4 countries, IDB
Informal Senior officials A, F 12 countries, IDB
Formal Summit A 9 countries, IDB
Formal Summit A, F, R 27 countries

138
Infrastructure for a Seamless Asia
exception of ASEAN and SAARC. Many take their lead from summits of heads of state and government, but others operate at a lower level. Most have advisory, regulatory, and financing modalities, except for ASEAN and the PIF, which lack a financing modality. The policies and institutional arrangements of the main wholly Asian subregional programs are discussed in this section.
Southeast Asia
ASEAN is a formal institution consisting of 10 member countries with a very broad mandate and meets at the summit level. It became a legal entity after the adoption of the ASEAN charter. Its main aim is economic integration through the ASEAN Free Trade Area and the establishment of a common market by 2015. ASEAN’s agenda is set at an annual summit of heads of state and government. Ministerial meetings on a variety of topics are also held regularly. Supporting these ministerial bodies are committees of senior officials, technical working groups, and task forces. ASEAN also has a small secretariat that is mandated to initiate, advise, coordinate, and implement ASEAN activities. ASEAN recently completed the ASEAN Comprehensive Investment Agreement, which was signed in February 2009. This seeks to promote greater cross-border investment and to attract private investment by creating a more liberal, transparent, and congenial investment environment, including by extending national treatment to ASEAN investors. ASEAN has also established the ASEAN Telecommunications Regulators Council Mutual Recognition Arrangement on conformity assessment for telecommunications equipment (ASEAN 2009). Although ASEAN is an important institution that has achieved much in several areas, it has achieved relatively limited progress in infrastructure.
GMS is an informal institution established at the ministerial level, but has met at the summit level in recent years. Detailed work is carried out by sectoral working groups, which handle both the hardware and software issues of regional infrastructure development. ADB operates as the de facto secretariat and provides technical, administrative,
Developing Effective Policies and Institutions
139
financial, and logistical support. Appendix Figure A4.1 presents GMS institutional arrangements.
In 2001, GMS ministers endorsed a 10-year strategic framework for enhancing connectivity, competitiveness, and a sense of community in the subregion. Eleven flagship programs were identified, including three economic corridors: east-west, north-south, and southern. These seek to promote trade, investment, and economic development in and among the areas connected by the subregion’s new transport infrastructure. In the energy and telecommunications sectors, cooperation began in 1992 with power transmission lines linking the Lao PDR and Thailand. The telecommunications network now extends to Cambodia, Lao PDR, Thailand, and Viet Nam. Developing power interconnections and regional power-sharing arrangements are envisaged. Future priorities include transforming the transport corridors into genuine economic corridors, a greater focus on “soft” infrastructure, capacity building, and stepping up efforts to mobilize both public and private sector resources.
Institutionally, the GMS has established a forum for discussing transport strategies and exchanging information in order to develop a common approach to cross-border issues, mainly through the CBTA (Box 4.1).
Four GMS countries—Cambodia, Lao PDR, Thailand, and Viet Nam—have also established an informal forum, the Mekong River Commission (MRC), to manage their shared water resources and sustainably develop the economic potential of the Mekong River basin (see Appendix Box A4.2 for details). The PRC and Myanmar are dialogue partners of MRC (MRC 2009).
In the energy sector, GMS countries are building cross-border grid interconnections linking Cambodia, Lao PDR, Thailand, and Viet Nam that will enable surplus countries to export electricity—notably, from clean and renewable sources, such as hydropower—to those with a deficit. To coordinate regional energy trade, the GMS countries signed the Inter-Governmental Agreement on Regional Power Trade in November 2002 and established the Regional Power

140
Infrastructure for a Seamless Asia
Box 4.1. The Greater Mekong Subregion Cross-Border Transport Agreement
The GMS CBTA is a compact and comprehensive multilateral instrument that covers all the relevant aspects of cross-border transport facilitation in one agreement. These include:
single-stop/single-window customs inspections; the cross-border movement of people (i.e., visas for people who work in transport operations); transit traffic regimes, including exemptions from physical customs inspections, bond deposits, escorts, and agriculture and veterinary inspections; requirements for vehicles making cross-border trips; the exchange of commercial traffic rights; and issues related to road and bridge design standards, road signs, and signals.
The CBTA will apply to selected and mutually agreed upon routes, as well as to points of entry and exit in the signatory countries. It provides a practical means of streamlining regulations and reducing soft infrastructure barriers that is consistent with similar ASEAN initiatives and existing international conventions on cross-border land transport facilitation.
National transport facilitation committees (NTFCs), chaired by a transport minister or deputy and consisting of senior officials from ministries and agencies involved in cross-border transport and trade facilitation, have been established in accordance with the CBTA in each GMS country. The NTFCs coordinate the ratification and implementation of the CBTA and its annexes and protocols. Their chairs meet in the CBTA Ministerial Joint Committee. Respective NTFC members of the six GMS countries comprise the various subcommittees of the CBTA, viz., transport, customs, immigration, and quarantine and health. Appendix Figure A4.2 presents the organizational structure.
The CBTA’s main agreement was signed and ratified by GMS leaders in March 2008. The full document, including its 20 annexes and protocols, is currently being ratified (four GMS members have already done so, and the remaining two are set to complete the process shortly). However, further work is required on addressing constraints to the CBTA and making the GMS corridors effectively operational. Implementation involves, among other things, harmonizing and integrating procedures and systems to facilitate border crossings, and promoting the development of trade logistics. In preparation for the CBTA’s full implementation, essential activities—such as incorporating the CBTA into domestic law, preparing detailed implementation guidelines and manuals, and training—are being undertaken with technical assistance from ADB. In some cases, national laws have to be amended to achieve conformity with the CBTA.
Source: ADB (2005d).

Developing Effective Policies and Institutions
141
Trade Coordination Committee (RPTCC). This lays the groundwork for fair and transparent rules and principles governing the power trade and also serves as a model for other subregions.
The operationally independent RPTCC is composed of national representatives who report to GMS ministerial conferences and their respective national governments. It is charged with finalizing a Regional Power Trading Operating Agreement to specify the rules for regional power trade, providing proposals for its day-to-day management and coordination, setting priorities to achieve these objectives, and identifying the steps needed to implement regional trade. In January 2006, RPTCC established a focal group to coordinate implementation of the Regional Power Trading Operating Agreement in each GMS country. In June 2006, it established a working group to carry out activities such as establishing training needs, pricing rules, and technical standards in the subregion.
In telecommunications, an information superhighway network (ISN) implementation group composed of telecommunications operators from GMS countries was established in 2005. It was tasked with developing a GMS ISN through fiber optic interconnections. An ISN Steering Committee, composed of senior officials of GMS telecommunications agencies, was also established in the same year to coordinate and oversee the ISN’s development. A memorandum of understanding (MOU) for its planning and construction was signed in 2005. The GMS has also established a Subregional Telecommunications Forum.
In the tourism sector, the GMS is implementing a strategy study and has established the annual Mekong Tourism Forum. This seeks to prioritize tourism projects and facilitate travel, notably by issuing GMS-wide visas.
In addition to the various sectoral forums, a GMS Business Forum has been established to promote private investment in GMS countries. A strategic framework for action on trade facilitation and investment has also been adopted. The GMS has also made good progress in

142
Infrastructure for a Seamless Asia
involving the private sector. For instance, national chambers of commerce participate in GMS programs.
While the GMS needs to improve its policies and institutions, it is in many respects a role model for subregional infrastructure cooperation in Asia.
The IMT-GT institutional set-up is modeled on ASEAN’s, with multitiered meetings of heads of state and government, ministers, senior officials, governors and chief ministers, and working groups. The private sector plays a prominent role through the joint business councils. Six working groups, including ones focused on infrastructure and transport, help drive its programs and activities. ADB, which has been a key development partner of the IMT-GT since 2006, provides capacity-building support, helps mobilize technical and financial resources, and helps promote an enabling environment for private sector development.
In BIMP-EAGA, the Senior Officials and Ministers Meeting provides the strategic directions and general policy guidelines. Top-level summits also occur. Infrastructure programs focus on promoting greater mobility of people, goods, and services in the aviation and maritime sectors, with ADB as the development adviser. In 2007, members signed an MOU on promoting the cross-border movement of commercial buses and vehicles, and establishing efficient and integrated sea links in the subregion (BIMP-EAGA 2009a, 2009b).
Central Asia
CAREC, as an informal forum, acts mainly as an advisory group, but the participation of regional and international financial institutions helps put financial resources at its disposal. It also provides a de facto regulatory function through its establishment of an electricity regulators’ forum.
Central Asia has abundant but very unevenly distributed energy resources and thus has great potential for regional trade, as discussed

Developing Effective Policies and Institutions
143
in Chapter 2. CAREC’s vision is to enhance energy security through cross-border energy projects. But despite the potential for energy cooperation, national policies have so far favored self-sufficiency and import substitution rather than regional trade. Physical connections such as pipelines, power lines, rail links, and storage facilities are often inadequate. Sluggish economic growth has also hampered countries’ ability to pay for energy imports.
Some efforts are being made to tackle these issues. The CAREC Members’ Electricity Regulators’ Forum has been set up to enhance regulatory capacity by sharing experience and promoting harmonized approaches to common issues. Intraregional power transmission lines are being rehabilitated, and load dispatch centers modernized. The PRC has signed a bilateral MOU with Mongolia to import around 10 gigawatts of coal-fuelled power. A transmission line to export power from Afghanistan to Tajikistan is planned. A 1,700 km gas pipeline from Turkmenistan to Afghanistan and Pakistan, a $3.2 billion project, is also planned.
The CAREC mandate has been shaped by the GMS experience, which has also influenced its institutional framework (Appendix Figure A4.3). Its secretariat is the CAREC unit at ADB. Sectoral coordinating committees have been established for transport, trade, and energy development. The trade committee spearheads trade facilitation efforts, but progress varies across countries in the region. The energy committee leads efforts to improve suppliers’ financial viability and to ensure the sustainability of services; guarantee low-income people access to minimum quantities of energy at affordable prices; restructure and commercialize the energy sector to promote private sector participation and investment, greater competition, regional trade, and greater transparency and efficiency; and improve regulation, energy conservation, environmental protection, and the promotion of alternative and renewable energy sources. CAREC has a great deal of promise, but it has yet to live up to its potential.

144
Infrastructure for a Seamless Asia
SECSCA is an informal institution that aims to promote transport connectivity and facilitate the movement of goods and people across South and Central Asia.60 With ADB’s technical assistance, a plan for two transport corridors, north-south and east-west, was formulated in 2006 (Asia Regional Integration Center 2009). But, due to the continuing conflict in Afghanistan, scarcely any progress has been made.
South Asia
South Asia is one of the least integrated of Asia’s subregions, and regional cooperation has made limited progress. While there is great potential for expanding trade within the subregion, this would require a large investment in physical cross-border infrastructure, many policy and institutional changes, and strong political and economic commitment that is not yet forthcoming. Among its institutions, SAARC is a formal institution that operates at the summit level, whereas BIMSTEC and SASEC are informal forums, operating at the summit and senior official levels, respectively.
In 2004, SAARC members pledged to strengthen transport, transit, and communication links across the region. SAARC has a Secretariat that coordinates and monitors the implementation of SAARC activities, provides support for SAARC meetings, and interfaces with other international organizations. Regional cooperation is guided by the Integrated Program of Action, consisting of technical committees in various areas, including transport, energy, ICT, and tourism. Working groups in key sectors also guide the regional cooperation agenda.
Major decisions are taken at ministerial meetings, followed by top-level summits. Foreign ministers meet at least twice a year as a Council of Ministers to formulate policy, review progress on regional cooperation, and identify new areas of cooperation. SAARC also has a Standing Committee, comprised of the foreign secretaries, to monitor and coordinate cooperation programs, approve projects (including
60 Its members are Afghanistan, Iran (observer), Pakistan, Tajikistan, Turkmenistan (associate), and Uzbekistan.

Developing Effective Policies and Institutions
145
their financing), and mobilize regional and external resources. It meets as often as necessary and reports to the Council of Ministers. In April 2007, it established an intergovernmental group on transport to identify and develop projects based on the SAARC regional multimodal transport study recommendations and to draft agreements required for implementing them. In 2008, SAARC transport ministers agreed to negotiate a regional transport and transit agreement and a regional motor vehicles agreement.61 An agreement on the establishment of a South Asian Regional Standards Organization was signed in August 2008. Twelve products of high trade potential have been identified for the harmonization of standards (Sharma 2009).
BIMSTEC aims to combine the “Look West” policy of Thailand and ASEAN with the “Look East” policy of India and South Asia. Ministerial meetings, followed by summit-level meetings, are its highest policy-making bodies. Senior officials’ meetings look after its operations. BIMSTEC has 13 priority sectors, each with an expert group drawn from member countries. These coordinate, monitor, and review progress in implementing projects and report on the same to the Sectoral Committee. Since BIMSTEC does not have a full-fledged secretariat, its working group in Bangkok acts as a mini-secretariat and coordinator. ADB became BIMSTEC’s development partner in 2005 (BIMSTEC 2009).
In SASEC, which is an informal forum, sectoral working groups have been established with ADB providing technical assistance. Country advisers, comprising finance secretaries from the four countries, form the steering and decision-making body. The senior officials’ meeting is the highest decision-making body.
The Pacific
The PIF, consisting of 17 member countries, is the main political and economic organization in the region. Among its priorities are the development of efficient transport and communications, and it
61 Declaration of the 15th SAARC Summit, Colombo, 2008.

146
Infrastructure for a Seamless Asia
has programs covering sectors such as air and sea transport, energy, and communications, supported by ADB. Members also cooperate on a regulatory advisory service, cable networks and satellite hubs, and developing cross-border trade facilitation and cruise ship infrastructure.
PIF leaders meet annually to develop collective responses to regional issues. The PIF has no formal rules governing its operations or the conduct of its meetings. Its agenda is based on reports from its Secretariat and related regional organizations and committees, as well as other issues that members wish to raise. Leaders’ decisions are reached by consensus and are outlined in a PIF communiqué, from which policies are developed and a work program is prepared (PIF Secretariat 2009).
So far, however, regional cooperation has been limited and implementation poor, with the exception of PASO (see Box 4.2). Institutional capacity is a problem, as is a preference for national approaches over regional ones. ADB’s assistance has been largely project specific and so far has had limited impact.
Lessons Learned
Experience from Asia’s subregional programs provides some important lessons for regional cooperation:
Subregional infrastructure has developed faster in some subregions, such as the GMS, than in others, such as South Asia. Much remains to be done to improve connectivity in these subregions. Since it is a bottom-up and market-driven approach, progress is slower where it is not driven by growing trade relations—and a lack of cross-country infrastructure is, in turn, slowing the growth of regional trade.Institutional arrangements and policies are weak in most subregional programs. All institutions are informal except for ASEAN and SAARC, which are not primarily involved in regional infrastructure development. The main constraints include: (i) inadequate legal and regulatory frameworks,

Developing Effective Policies and Institutions
147
Box 4.2. Pacific Aviation Safety Office
In very small Pacific island countries that rely on tourism and air links for trade and social connections, modern and soundly regulated aviation is essential. But because they have limited funds and a shortage of skilled personnel, regional cooperation is an effective and cost-efficient way
of regulating and supervising aviation.
The Pacific Aviation Safty Office (PASO) was established in 2002 and formalized under international law in 2005 by the Pacific Islands Aviation Safety and Security Treaty. Original signatories were Kiribati, Papua New Guinea, Samoa, Solomon Islands, Tonga, and Vanuatu. PASO is governed by a council of directors comprising representatives from each member country and associate members. PASO members now also include Australia, Cook Islands, Fiji Islands, Nauru, New Zealand, and Niue. ADB, the Association of South Pacific Airlines, the US Federal Aviation Agency, the International Civil Aviation Organization, and the PIF Secretariat are associate members.
A nonprofit international organization, PASO is responsible for overseeing regional aviation safety and security for its members. Its core responsibilities include flying operations, airworthiness, security, airports, and personnel licensing. Its primary long-term goal is to improve the quality and range of services by standardizing the aviation operating environment using harmonized legislative and regulatory frameworks, ensuring compliance with Civil Aviation Administration rules through airline recertification, institutionalizing annual audits and inspections using local regulations and International Civil Aviation Organization Standard and Recommended Practices, and providing technical assistance and capacity building. To enforce these standards, PASO appoints five regional professionals to provide advisory, certification, and surveillance services to national aviation authorities, and to monitor compliance with international standards.
The cost of establishing PASO was $2.4 million, of which $1.9 million was borrowed from ADB and the rest of which was shared by PASO member countries in annual membership fees. The loan from ADB was guaranteed equally by Papua New Guinea, Samoa, Tonga, and Vanuatu. For its operation and maintenance expenses, PASO uses its revenues, a 10% premium on service fees from members that are not guarantors, and aid agency and industry support.
PASO brings substantial benefits to its stakeholders: improved civil aviation administration for member governments, lower regulatory compliance costs for 40 air transport operators with nearly 4,000 licensed personnel, and greater safety and security for air transport passengers. Indirectly, the tourism industry benefits from increased and more reliable arrivals and departures. With its clear and enforceable standards, harmonized regulations, risk sharing among its members, innovative structure, and intergovernmental finance, PASO helps provide effective and cost-efficient safety oversight services in the Pacific. It may grow as other countries join the organization and use its services.
Sources: PASO website (http://www.paso.aero/); Guild (2008).

148
Infrastructure for a Seamless Asia
(ii) weak governance and institutional capacity, (iii) low operational efficiency and complex procedures, and (iv) insufficient mechanisms for regional cooperation. Cooperation is easier when few countries are involved, they have common objectives, and they have reasonably good relations. The GMS has made the most progress, notably on physical infrastructure connectivity. While some progress has also been made on software issues, the GMS still needs to strengthen its institutional capacity and policy coordination. In particular, further work is needed on the agreements, frameworks, rules, and regulations that support the efficient use of regional infrastructure, notably the GMS’s CBTA. The GMS has gone furthest in creating subregional regulatory frameworks and policies, with transport and energy as priorities. These are closely connected to ASEAN’s regional integration activities, and focus on technical aspects. However, most regional projects are approached on a case-by-case basis. Further progress in developing subregional regulatory frameworks, policies, and institutions depends on members’ willingness to participate, the demand created by cross-border trade and investment, and applicable ASEAN frameworks. The GMS’s CBTA is a very important step towards harmonizing the software relating to use of infrastructure and infrastructure services. It could provide a template for other Asian subregions and eventually for a pan-Asian transport infrastructure network, too. The GMS has developed financial and institutional arrangements for regional power trade involving the private sector. This model could be useful for other projects in the GMS, as well as for other subregional programs, particularly in South and Central Asia. Outstanding issues in the GMS include broadening cooperation from electricity to energy more generally; adopting a road map for developing a regional energy market; and enacting more effective social and environmental impact assessments and corrective measures, especially related to hydropower projects.

Developing Effective Policies and Institutions
149
Policies and institutional arrangements in all subregional programs urgently need to be strengthened. GMS programs work for a diverse group of countries; its best practices can therefore be adopted by other subregional programs, with appropriate changes to suit their particular needs. To encourage private sector participation and cross-border investment flows, Asia could formulate a comprehensive investment agreement, as ASEAN has, to extend national treatment to foreign investors.
Addressing the Major Challenges4.4.
Asia has so far followed a flexible, pragmatic, informal, and bottom-up approach to regional infrastructure cooperation. As this chapter has detailed and Figure 4.2 illustrates, it has many overlapping subregional cooperation programs. This approach reflects Asian economies’ diversity in size, development level, population, per capita income, trade patterns, technical capacity, and other socioeconomic features. It also reflects political realities, with some countries and subregions more willing to cooperate than others. Since subregions have differing needs and different propensities toward regional integration and cooperation, a subregional approach towards building a seamless Asia is needed.
Asian experience shows that infrastructure cooperation in small groups of countries is more manageable and thus likely to progress faster. For example, even though progress has been achieved in the signing and ratifying of the intergovernmental agreement by participating countries for the AH, the progress of the physical construction works (e.g., missing links, upgrading, and border connections) has been rather limited. Since the AH agreement was enforced in 2004, there have been some achievements in upgrading the AH network, such as the upgrading of 10,000 km of the network to meet minimum standards

150
Infrastructure for a Seamless Asia
(Class III).62 However, much still remains to be done. Particularly, there is still 12,000 km (or 9% of the network) that remains below the minimum standard. The majority of the highways meet Class II and Class III standards, accounting for 37% and 25.8% of the total network, respectively. Meanwhile, shares of Primary or highest standard and
62 The AH is classifi ed into four technical classes. “Primary” class refers to access-controlled highways. “Class I” refers to four or more lanes roads with asphalt or cement concrete pavement. “Class II” highways have two lanes with double bituminous treatment. “Class III” is regarded as the minimum standard, where the pavement is upgraded to asphalt concrete or cement concrete.
Figure 4.2. Architecture of Subregional Infrastructure Cooperation in Asia
ASEAN = Association of Southeast Asian Nations; ASEAN+3 = ASEAN plus three countries, as shown; BIMP-EAGA = Brunei Darussalam Indonesia Malaysia Philippines – East ASEAN Growth Area; BIMSTEC = Bay of Bengal Initiative for Multi-Sectoral Technical and Economic Cooperation; CAREC = Central Asia Regional Economic Cooperation; EAS = East Asia Summit; FSM = Federated States of Micronesia; GMS = Greater Mekong Subregion; IMT-GT = Indonesia-Malaysia-Thailand Growth Triangle; Lao PDR = Lao People’s Democratic Republic; PIF = Pacifi c Island Forum; PRC = People’s Republic of China; SAARC = South Asian Association for Regional Cooperation; SASEC = South Asia Subregional Economic Cooperation; SECSCA = Subregional Economic Cooperation in South and Central Asia.Source: Bhattacharyay (2008).
PRC
Brunei Darussalam
Malaysia IMT-GT
iet Nam
GMS
Lao PDR s
a
Myanmar
BIMSTEC
c of Korea
a BIMP-EAGA
ASEAN
ASEAN+3
e
New Zealan tralia
EAS
Fiji . olomon
u Guinea
Niue
i
SMrs .
Tuvalu Nauru
.SamoaTonga
SECSCA
SASECCAREC
Ta n
alau
n
stan
s
aSAARC
an
n
erKyrgy
PIF

Developing Effective Policies and Institutions
151
Class I standard highways are rather low—14.4% and 13.5% of the total network, respectively (Ha 2008).
Interestingly, some subregional programs, notably the GMS and CAREC, are adopting and implementing some AH projects within their subregions. Since building a seamless AH network involves building missing links, as well as enhancing existing roads to international or regional standard within and between countries, this could be achieved through existing subregional programs acting as building blocks of a pan-Asian infrastructure network. This allows each subregional program to proceed at its own speed, based on its own priorities and needs. However, given the immediate imperative of stimulating regional growth and the medium-term need for Asia to rebalance its economic activity and direct more of its energies towards satisfying local needs, this bottom-up and market-driven approach may now need to be complemented with a more top-down, market-creating, and demand-inducing approach geared towards creating a seamless Asia. The key factors for success include a common vision, multilayer coordination among stakeholders, and effective implementation of infrastructure programs. The required policies and institutions are sketched out below.
Pan-Asian Vision
Achieving a seamless Asia requires that its leaders agree on a common vision, recognizing the urgency of further Asian integration through physical connectivity and regional cooperation. It also requires strong leadership and commitment. This leadership could emerge in various ways. The collective decisions of large and strong regional groupings or forums, such as ASEAN+3, the East Asia Summit (ASEAN+6), and the Asia-Pacific Economic Cooperation, could provide the leadership for this vision as well as the top-down political push for a seamless Asia. ASEAN has provided strong leadership in building physical connectivity to support its vision of ASEAN economic integration. Leaders of major Asian economies could also provide leadership, as the presidents of Brazil and Mexico did in the cases of IIRSA and PLPP, respectively. In Europe, France and Germany provided the

152
Infrastructure for a Seamless Asia
leadership and political push for infrastructure integration as part of a more explicit drive toward economic and political integration. Leading regional and international institutions representing Asian countries could also carry forward the vision of a seamless Asia (Figure 4.3).
Figure 4.3. Policy and Institutional Framework for a Seamless Asia
PAIF = pan-Asian infrastructure forum.Source: Bhattacharyay and De (2009).
Vision:a seamless Asia
Effective execution of Asianinfrastructure strategy
Proper coordination amongvarious stakeholders
commitment of leaders
governments and subregional groupings/forums
international/regional development institutions
(e.g., regulatory, legal, sectoral)
agencies

Developing Effective Policies and Institutions
153
Toward a Coordinated Infrastructure Strategy: Pan-Asian Infrastructure Forum
In addition to strengthening national and subregional infrastructure strategies, sectoral policies, and institutions, Asia requires a broad, coordinated, regionwide infrastructure strategy, including policies in key sectors, such as transport and energy, for building a seamless Asia. These national, subregional, and regional policies need to provide coherent support for regional infrastructure development.
Developing regional infrastructure is a lengthy, expensive, and very complex process that involves many interdependent facets and stakeholders. Asia should therefore establish a new high-level platform for pan-Asian coordination, namely a PAIF, to help coordinate and integrate existing subregional infrastructure initiatives toward a seamless Asia. The PAIF would bring together representatives (senior policy makers) of all subregional programs in Asia and their member countries; managers of leading private companies; as well as representatives from major international and regional institutions that fund regional infrastructure projects, such as ADB, the World Bank, and the Japan Bank for International Cooperation (JBIC)/JICA, and that coordinate regional infrastructure, such as the Asian-Pacific Economic Cooperation, ASEAN + 3, East Asia Summit, and UNESCAP, to discuss and push forward plans to improve connectivity within and among Asia’s subregions. The policy and institutional framework for a seamless Asia is depicted in Figure 4.3.
The PAIF’s role could include, among other things:assisting, in liaison with regional financial and development institutions, in the formulation of a coordinated Asian regional infrastructure strategy, including energy and transport policies; identifying regional infrastructure projects and prioritizing the development of regional infrastructure networks; facilitating consensus building among participating countries;managing coordination and building cooperation among stakeholders;

154
Infrastructure for a Seamless Asia
providing a platform for small and poorer Asian countries whose voices might otherwise not be heard; exchanging relevant information and experiences, and thus reducing information asymmetry among various stakeholders; conducting research, sharing knowledge and best practices, and assisting in capacity building on regional infrastructure issues; producing harmonized standards, based on international best practices where possible; anddeveloping a common approach to mitigating negative social and environmental impacts.
The PAIF would need to work closely with an advisory group of experts who have a regional vision of Asia’s infrastructure needs and who can identify and appraise prospective regional projects. To varying degrees, the EC performs this role in the EU, as does IIRSA in South America, while for the GMS, CAREC, and SASEC, ADB experts have provided assistance.
Sectoral subforums could also be established—for transport and energy, for instance—as well as subforums for soft infrastructure matters such as regulatory and legal issues as well as environmental and other social issues. Regulatory forums, such as the East Asia and the Pacific Infrastructure Regulatory Forum and the South Asia Infrastructure Regulatory Forum, already exist at the subregional level.
Formulating strategies and policies requires compiling and disseminating comparable cross-country statistics on infrastructure and other important data. This may require new institutional arrangements and capacity building. For example, an Asia Regional Infrastructure Information Center may need to be established.
In addition to developing a strong coordination framework at the regional level, efforts should be made to strengthen coordination at the national level, particularly in large economies, as well as subregionally among key stakeholders. In particular, Asia’s mostly informal subregional arrangements would benefit from becoming

Developing Effective Policies and Institutions
155
more formal institutions with greater ability to ensure that decisions are implemented.
Implementing the Strategy
To implement the coordinated infrastructure strategy, five major institutional challenges need to be addressed: aligning legal and regulatory frameworks, developing effective governance, managing social consequences and promoting environmental sustainability, engaging the private sector, and engaging regional and international institutions. Overarching all of them is the need to strengthen institutions and their capacity to build and manage regional infrastructure. Since Asian countries’ capacities in infrastructure development vary significantly, an external party is needed to provide technical assistance. In the EU, the EC performs this role, while in Latin America, a variety of institutions do. In Asia, ADB could perform this task, as it already does in the GMS and CAREC.
Aligning legal and regulatory frameworks. In many Asian countries, regulations are often weak and patchy. Many economies lack the sound institutional structures needed to implement regulatory and legal policies. On a micro level, regulatory regimes in developing countries suffer from considerable deficiencies in management, often lacking skilled human resources (Stone 2008). This institutional weakness is further complicated by the inability, or unwillingness, of regulators to commit to some types of reform that would promote greater predictability, especially in countries with unstable political structures that lead to frequent changes in government and where contracts are not protected by law.
Asian countries therefore need to adopt a coherent strategy to liberalize, strengthen, and harmonize their legal and regulatory frameworks, focusing in particular on transport and transit systems and on customs procedures. Domestic regulatory procedures and institutional structures based on Asian (for example, ASEAN) and international (for example, EU) best practice models can improve transparency, reduce costs and time, and introduce professionalism in

156
Infrastructure for a Seamless Asia
border clearance procedures. Streamlining regulations on technical barriers and liberalizing transport, energy, and telecommunications regimes can also facilitate trade and integration. Collective action to raise capacity in regulatory systems would help facilitate regional infrastructure projects.
Regulations and procedures should be simplified and harmonized to comply with global standards, where possible. For instance, to streamline the administrative formalities of cross-border transport, Asian subregions may need to adopt transit arrangements that follow international conventions and guidelines.63 In the case of customs procedures, the World Customs Organization and the International Chamber of Commerce may provide guidance. In some cases, differing established standards make cross-border infrastructure impractical—in the case of different railway gauges in neighboring countries, for example. In such areas, there is scope for subregional guidelines on coordinating diverse standards, which could be drafted by regional bodies such as ADB, ASEAN, and UNESCAP. Member countries need to work together to set up common technical specifications, licenses, insurance, safety standards, and so forth, so that equipment (such as trucks, trains, and ships) can operate across borders.
Developing effective governance. Greater accountability and disclosure in agencies involved in infrastructure development can reduce the risks associated with poor governance. Transparent and accountable decision making coupled with anticorruption measures is vital. Strong and independent audit offices and anticorruption commissions also help strengthen good governance. To enhance credibility, there is a need to ensure that concerned agencies and other stakeholders follow best international practices (for instance, OECD principles).
Managing social consequences and promoting environmental sustainability. Asia’s current policy and institutional framework does not adequately address the potentially negative social and environmental
63 For example, the convention on the international transport of goods under cover of Transport International Routier Carnets, which was made in 1975 under the auspices of the United Nations Economic Commission for Europe.

Developing Effective Policies and Institutions
157
impacts of infrastructure development, such as the displacement of people from their land, urbanization pressures from migration to big cities, increases in the incidence of communicable diseases, human and drug trafficking, and traffic accidents—not to mention the impact on the local and global environment. This needs to be dealt with in the context of the regional forum, PAIF. This is not just an issue of sustainable development; it can also create strong popular opposition to projects, as happened in Central America with the PLPP initiative as discussed in Section 4.2, particularly the subsection on Latin America’s experience.
A thorough assessment of a regional project’s social and environmental impacts must always be conducted before it is built. While some negative impacts are unavoidable, others can be mitigated through a different choice of route or project design, or through appropriate compensation for losers, notably people displaced from their land. Strict environmental impact assessments and strategic impact assessments are needed for very large projects. These should review the planning, legal, regulatory, and institutional frameworks within which the project will operate and suggest corrective actions where needed.
Some achievements in addressing social issues have been made in the GMS. For example, an MOU signed in 2004 sought to adopt a coordinated initiative against human trafficking—a model that other subregions could follow. But while some resettlement plans have been regionally coordinated (albeit on a project-to-project basis), no regionwide framework for resettling displaced people exists, and thus each country has to come up with its own policy. Subregional programs urgently need to develop solid, coordinated measures to mitigate the negative social impacts of infrastructure development, which are often inadequately addressed even at the national level. This calls for the creation of specific institutions with the necessary expertise and resources to provide better resettlement policies for displaced people, to assist and train migrant laborers, and to help foster better economic opportunities. The capacity of existing national institutions for dealing with such issues also needs to be strengthened (Chalamwong and Komkit 2008, Zhang 2008a).

158
Infrastructure for a Seamless Asia
Given their long life span, infrastructure investments’ environmental impacts get locked in for decades to come. If current carbon-intensive development patterns persist, the region will find itself increasingly contributing to global climate change, with rising negative consequences for the region and the world. This is particularly important for Asia, which is poised to build substantial new infrastructure over the next few decades. A clean approach—integrating economic and climate change concerns—is needed to develop and implement sustainable infrastructure at the national, subregional, and pan-Asian levels. In relation to regional infrastructure, the focus should be on energy and transport, the principal sources of greenhouse gas emissions in the region. Regional cooperation in the area of energy can also help the region move to a low carbon growth path by promoting trade in clean energy.
In view of Asia’s rising energy requirements and the need for energy security and sustainability, a regional initiative to build green energy networks is urgently needed. Regional energy projects can provide cost savings and deliver environmental benefits by reducing local pollutant and greenhouse gas emissions through the use of hydropower and natural gas in place of coal and oil, as well as through carbon sinks from the maintenance of land and forest coverage. For instance, the Trans-ASEAN Gas Pipeline proposed in ASEAN’s vision for 2020 would link natural gas production centers with markets in neighboring countries. By creating cross-border connections between national gas grids, it would also provide a cheaper, cleaner, and more efficient alternative to traditional diesel-fired plants, encourage competition among suppliers, and promote the development of stranded gas fields whose small size does not currently justify production (Zhang 2008b). Such green regional projects should be prioritized and implemented rapidly. Their success could provide good models for future projects.
Since transport infrastructure can have many negative environmental impacts, green transport initiatives need to be promoted. These would support sustainable economic development through a transport system that leaves a smaller physical footprint, uses less energy, and produces fewer pollutants and less carbon dioxide. In the PRC, policies are being considered to improve the efficiency of road

Developing Effective Policies and Institutions
159
cargo transport and to enhance energy saving and emission reductions in the highway industry (ADB 2008e). Box 3.2 in Chapter 3 discusses how the GMS transport corridors could be greened. Other important environmental issues include land-use change, the loss of vegetation and biodiversity, and the impact on wildlife (Zhang 2008a).
Engaging the private sector. To meet the growing challenge of investment in regional infrastructure, Asia has to encourage private investors to fund and provide infrastructure facilities. The EU has sought to pursue PPPs to develop regional infrastructure. But this is particularly challenging, as will be described in Chapter 5, and generally requires multilateral institutions to take on some of the risks involved. Asian countries therefore need to create policies and procedures that encourage private investors to fund and provide efficient infrastructure facilities. Following the examples of the EU and ASEAN, Asia could formulate a regional infrastructure investment agreement to protect cross-border investment and provide national (equal) treatment to all investors in the region. This would also create a more liberal, transparent, and competitive investment environment in Asia. Governments should also develop and implement policies and regulations that make it easy to establish regional infrastructure-related businesses, along the lines of the “European companies” that exist in the EU, and remove barriers that may hinder profitability and competitiveness.
Engaging regional and international institutions. Multilateral institutions such as the ADB and World Bank have important roles to play in developing regional infrastructure (Kuroda et al. 2008).
As financiers, they can provide loans and other risk mitigation instruments, such as guarantees, and help mobilize resources from other development partners, including the private sector. As knowledge partners and technical advisers, they can provide expert advice, share lessons learned regionally and globally, and tailor knowledge to countries’ specific needs and conditions. As capacity builders, they can help developing countries and regional or subregional bodies to strengthen their institutional

160
Infrastructure for a Seamless Asia
and human capacities to manage cross-border infrastructure, particularly financial management and supporting software and institutional aspects. As honest brokers, perhaps most importantly, they can play a catalytic role, bringing countries and other stakeholders together and facilitating dialogue so that countries can reach political convergence to strengthen cross-border connectivity.
In Asia, ADB is the major organization that has been actively involved for a long period in assisting countries in developing and financing regional infrastructure projects in several subregional programs such as the GMS, CAREC, and SASEC. In view of the ongoing global financial crisis, infrastructure development becomes highly essential and urgent for reviving economic growth and providing jobs. As explained in Chapter 1, many Asian countries have enhanced their infrastructure programs significantly through their fiscal stimulus packages. In most cases, these programs do not involve broad subregional or regional coordination as suggested in this study. At the same time, several countries are facing budget and foreign exchange constraints in financing planned infrastructure programs. At this juncture, the enhanced role of international and regional institutions such as ADB and the World Bank is crucial. They urgently need to increase their financing and their mobilization of capital from cofinanciers, including the private sector, for building Asian regional infrastructure as well as assisting countries in addressing various soft infrastructure issues such as planning, coordination, and capacity and institution building.
Conclusions 4.5.
A seamless and integrated Asian economy requires coordinated infrastructure services in key sectors, especially transport and energy. To deliver such services, countries need to develop effective policies and institutions nationally, subregionally, and regionally. These policies, in turn, need to provide coherent support for the complex skills and knowledge required to build and manage infrastructure, including design and development, financing, and maintenance.

Developing Effective Policies and Institutions
161
Given the geographical and functional complexity of infrastructure, a broad, regionwide approach is needed to guide infrastructure strategy. This report finds that a new PAIF could be especially valuable in coordinating and integrating existing subregional infrastructure initiatives and organizing them into functional building blocks needed to create a seamless Asia. The PAIF could facilitate the formulation and implementation of Asian energy and transport policies. It could also establish subforums in key areas of hard and soft infrastructure development, such as laws and regulation or new construction in sectors like energy and transport.
Although broad regional coordination is critical, national and subregional infrastructure programs will remain the essential building blocks of the infrastructure networks. Thus, Asia needs to strengthen national and subregional policies and institutions for the effective implementation of infrastructure programs. In turn, the technical capacity of various stakeholders at the national, subregional, and regional levels needs to be enhanced through the establishment of a regional institutional network.
The global financial crisis lends urgency to infrastructure development. Many countries are incorporating infrastructure programs in their fiscal stimulus packages—often without the broad coordination advocated in this study. At the same time, many also face tightening budgets and foreign exchange constraints. In this context, international and regional institutions such as the World Bank and ADB have a particularly important role to play. Their contributions to Asian regional infrastructure development can be essential, not only in financing new projects, but also in helping to resolve urgent planning, capacity, and institutional constraints.
An effective, forward-looking Asian infrastructure strategy will require strong leadership. This could emerge in various ways—from the commitments of political leaders of large economies; from collective decisions of regional forums and leading international institutions; or from persuasive, visionary arguments by individuals. In the case of Latin America, the presidents of Brazil and Mexico took the initial step. In Europe, infrastructure integration emerged as part of a more general

162
Infrastructure for a Seamless Asia
drive toward comprehensive economic and political integration under the leadership of France and Germany. But in each case, leadership was essential in “getting the ball rolling” and in empowering institutions to carry it forward.
Ultimately, the political commitment of national leaders is indispensable. Many competent institutions will be needed to implement the technical requirements of any ambitious, pan-Asian infrastructure program. But only leaders with foresight will be able to sustain the vision of a seamless Asia and motivate the large investments of creativity, energy, and money that will be required to achieve it.

Financing Regional
Infrastructure
Chapter 5

Financing Regional Infrastructure
165
Asia’s need for regional infrastructure is clear. Previous chapters have detailed how infrastructure networks are vital for promoting trade and investment, spreading the benefits of economic growth more widely, and improving human welfare. But without proper financing, the need
for infrastructure will go unmet and the benefits will not be realized. Yet financing infrastructure projects is often challenging—and regional projects particularly so. However, Asia has vast savings that can be channeled into infrastructure investment for viable projects through an appropriate mechanism. This chapter maps out the challenges and how to overcome them.
The chapter first provides estimates of Asia’s overall national infrastructure needs as well as the financing needs for regional projects that are under consideration and could become ready for investment between 2010 and 2020. It then considers the features of regional infrastructure projects that complicate their financing, preparation, implementation, and operation. Lessons from international experience with regional projects, with a particular focus on Europe, Latin America, and the GMS, are discussed. The chapter examines recent developments in Asian financial markets and the potential for deploying Asia’s vast savings for infrastructure investment. It then explores options for funding regional projects through national and international financial markets, and it assesses whether creating new public sector funding mechanisms and/or institutions specifically geared towards financing regional infrastructure projects is desirable and feasible. The chapter concludes with some proposals and recommendations.
5. Financing Regional Infrastructure

166
Infrastructure for a Seamless Asia
Financing Needs5.1.
Many institutions have published estimates of Asia’s infrastructure needs, notably the UNESCAP (2006) and joint ADB-JBIC-World Bank (2005) studies. The present study provides new estimates of physical capacity needs during 2010 and 2020 for most developing Asian countries using a top-down approach.64 The projection of infrastructure investment needs covers 30 of the 45 ADB DMCs in Asia and the Pacific for the period 2010–2020. These include: seven countries in Central Asia (Armenia, Azerbaijan, Georgia, Kazakhstan, Kyrgyz Republic, Tajikistan, and Uzbekistan); 10 countries in East and Southeast Asia (Brunei Darussalam, Cambodia, PRC, Indonesia, Lao PDR, Malaysia, Mongolia, Philippines, Thailand, and Viet Nam); six countries in South Asia (Bangladesh, Bhutan, India, Nepal, Pakistan, and Sri Lanka); and seven countries in the Pacific (Fiji Islands, Kiribati, Papua New Guinea, Samoa, Timor-Leste, Tonga, and Vanuatu). Due to lack of reliable historic data, it was not possible to estimate the investment requirements for the other 15 Asian DMCs. This exercise covers the following major sectors: transport (airports, ports, railways, and roads); energy (electricity only); telecommunications (landlines and mobile phones); and water and sanitation.65
The forecasting exercise follows the methodology of Fay and Yepes (2003): a two-step procedure was used to develop the projections for each country. In the first step, econometric models that could be used across countries were developed to estimate new physical infrastructure capacity needs by sector for each year between 2010 and 2020. Demand for infrastructure stock in these models was derived from key determinants, namely income per capita, shares of agriculture and manufacturing in GDP, urbanization, and population density. In the second step, projected demand for infrastructure stock of new capacity was valued at best-practice unit costs. Investments required for maintaining and/or replacing current capacity at the end of its useful life were calculated by assuming that replacement investments would be around 2% of the investments required for new capacity for
64 For details, see ADBI (2009) and Bhattacharyay (2008).65 This study does not cover gas and petroleum, housing, urban transport, and rural roads.

Financing Regional Infrastructure
167
transport and energy, 8% for telecommunications, and 3% for water and sanitation.
The estimates do not take into account any country strategic planning to invest in infrastructure ahead of demand or to meet development targets such as the Millennium Development Goals. These top-down order-of-magnitude estimates must be regarded as a reference point rather than a substitute for detailed bottom-up country and sector specific estimates that take into account actual conditions in each sector and country.
Between 2010 and 2020, Asia’s overall national infrastructure investment needs are estimated to be $8 trillion, 68% of which is for new capacity and 32% of which is for maintaining and replacing existing infrastructure (Table 5.1)—with an average infrastructure investment need of about $730 billion per year. Electricity and roads account for 51% and 29% of the total, respectively. East Asia and the
Table 5.1. Asia’s Total Infrastructure Investment Needs by Sector, 2010–2020 (in 2008 $ million)
$ = United States dollar. Sources: ADBI (2009); Bhattacharyay (2008).
Sector/Subsector New Capacity Replacement Total
Energy (Electricity) 3,176,437 912,202 4,088,639
Telecommunications 325,353 730,304 1,055,657
Mobile phones 181,763 509,151 690,914
Landlines 143,590 221,153 364,743
Transport 1,761,666 704,457 2,466,123
Airports 6,533 4,728 11,260
Ports 50,275 25,416 75,691
Railways 2,692 35,947 38,639
Roads 1,702,166 638,366 2,340,532
Water and Sanitation 155,493 225,797 381,290
Sanitation 107,925 119,573 227,498
Water 47,568 106,224 153,792
Total 5,418,949 2,572,760 7,991,709

168
Infrastructure for a Seamless Asia
Pacific’s needs total $4,670 billion; South Asia’s, $2,870 billion; and Central Asia’s, $460 billion. A portion of the total amount will be used for financing regional infrastructure projects (see Box 1.1 for a broader definition of a regional project).
Furthermore, the study identifies 1,077 specific bilateral, subregional, and pan-Asian infrastructure projects that are in the pipeline66 over the same period. Since no officially available list of all regional or subregional projects exists, a background paper for this study (Bhattacharyay 2008) compiled a consolidated list of the various proposals—some more advanced than others—for regional projects (as defined in Box 1.1) that are considered both economically viable and likely to be ready for implementation between 2010 and 2020. This list, which is included in the Appendix, is based primarily on information from ADB staff, but also takes into account proposals from other sources, including the websites of various subregional infrastructure programs, and UNESCAP. To the best of ADB and ADBI’s knowledge, this is the first time that such a list has been compiled. In addition, the study has identified 95 projects for which data on financing needs are not available (Tables A5.12–A5.19 in the Appendix).
This was compiled from a variety of sources, some much more detailed and rigorous than others, and includes proposals at various stages of definition, preparation, review, and vetting. In most cases, ADB and ADBI do not have access to detailed feasibility reports and/or economic and financial evaluations for the projects; in some cases, these do not appear to have been carried out yet. In other cases, neither a definitive timetable nor managerial arrangements for implementation could be obtained.
In addition to the above overall national infrastructure needs, the total investment needed for these 1,077 regional projects is $290 billion—with an average infrastructure investment need of close to $30 billion per year (Table 5.2). Of the 1,077 projects, 989 projects in transport will cost $200 billion (70%), and 88 in energy will cost $80 billion (30%). Pan-Asian transport projects alone account for more
66 This includes planned and soon-to-be constructed projects.

Financing Regional Infrastructure
169
than 60% of the total. Energy projects in Southeast and Central Asia account for more than 60% of the total energy investment needs. This amounts to an overall infrastructure investment need of $8,280 billion (national and regional) and about $750 billion per year during this period (Bhattacharyay 2008).
Table 5.2. Indicative Investment Needs for Regional Identified and Pipeline Infrastructure Projects, 2010–2020
$ = United States dollar; ASEAN = Association of Southeast Asian Nations; BIMP-EAGA = Brunei Indonesia Malaysia Philippines-East ASEAN Growth Area; CAREC = Central Asia Regional Economic Cooperation; GMS = Greater Mekong Subregion; UNESCAP = United Nations Economic and Social Commission for Asia and the Pacific.– data not available.Notes: a Dry and sea ports, container depots (UNESCAP, 2007b: 79–82). b Projects involving countries belonging to more than one subregion. c Some projects involve countries in East Asia, such as the People’s Republic of China and Mongolia.Sources: Bhattacharyay (2008) and adapted from UNESCAP (2006a, 2007a, 2007b, 2008a, 2008b); ADB (2008a, 2008d, 2008i); CAREC (2008a, 2008b, 2008c); ASEAN (2004); Bhattacharya and Kojima (2008); China Post (2007); Kathuria (2006); ADB staff estimates (2008); ASEAN Center for Energy (2005); and Von Hippel (2001).
Region/Subregion
Transport Projects Energy Projects Total
Cost
($ million)No.
Cost
($ million)No.
Cost
($ million)No.
Asia 177,077 931 – – 177,077 931
Asian Highway 43,276 121 – – 43,276 121
Trans-Asian Railway 82,801 45 – – 82,801 45
Asian Container Portsa 51,000 765 – – 51,000 765
East/Southeast-Central-South Asiab – – 22,975 5 22,975 5
Southeast Asiac 5,858 17 41,444 33 47,302 50
GMS 5,858 17 2,604 14 8,462 31
Trans- ASEAN Gas Pipeline – – 7,000 1 7,000 1
BIMP-EAGA – – 100 1 100 1
Others – – 31,740 17 31,740 17
Central Asia 21,414 38 11,131 44 32,545 82
CAREC 21,414 38 10,861 43 32,275 81
Others – – 270 1 270 1
South Asia 293 3 6,846 6 7,139 9
Total 204,642 989 82,369 88 287,038 1,077

170
Infrastructure for a Seamless Asia
Experience elsewhere suggests that the actual investment in regional projects is usually a small fraction of total infrastructure investment. Even in the EU, which is highly integrated and offers ample financing at very attractive terms, regional projects have accounted for only a small portion of total infrastructure investments. This proportion is smaller in Latin America, where only a small fraction of regional projects proposed by governments have been formally realized.
It seems unlikely that many large pan-Asian regional projects will come to fruition by 2020 as long as there remains no appropriate pan-Asian institutional forum supported by regional governments. Political support for pan-Asian initiatives remains weak, and there is no adequate source of concessional financing for less developed participating countries. Subregional “bankable”67 projects under existing subregional initiatives such as GMS programs, are more feasible even though adequate financing for subregional programs remains elusive.
Furthermore, this study has identified 21 high priority projects that could be implemented by 2015 in East, South, and Central Asia that are regional in nature. These projects are well advanced in terms of definition and approvals necessary; clearly deserving of high priority; and considered politically, technically, economically, and financially viable in principle (Table 5.3). These could be designated as “flagship” projects whose successful financing and implementation would create positive precedents and open the way for progress on a much larger number of regional projects further strengthening regional infrastructure networks (Bhattacharyay 2008). Their estimated total cost is $15 billion. Details of these projects are available in Tables A5.9–A5.11 in the Appendix.
67 A bankable project is one that has sufficient collateral, future cash flow, and a high probability of success so that it is acceptable to institutional lenders for financing (http://www.businessdictionary.com/definition/bankable.html).

Financing Regional Infrastructure
171
Table 5.3. Twenty-One High Priority “Flagship” Regional Projects
$ = United States dollar; CAREC = Central Asia Regional Economic Cooperation; GMS = Greater Mekong Subregion; Lao PDR = Lao People’s Democratic Republic; SASEC = South Asia Subregional Economic Cooperation.Source: ADB staff and Bhattacharyay (2008).
Subregion TransportInvestment
($ million)Energy
Investment
($ million)
Total
Projects
(No.)
Total
Investment
($ million)
GMS 5 projects (total) 3,324 5 projects (total) 1,414 10 4,738
GMS Kunming-Hai Phong Transport Corridor-Noi Bai-Lao Cao Highway
1,216 GMS Northern Power Transmission 54
2nd GMS Northern Transport Network Improvement 135
GMS Nabong-Udon Thani Power Transmission and Interconnection
110
Rehabilitation of the Railway in Cambodia 73
Lao PDR-Viet Nam Power Interconnection (Ban Sok-Pleiku)
270
Ha Long-Mong Cai Expressway 1,000 GMS Nam Ngiep 1 Hydropower Project 380
GMS Hanoi-Lang Son Expressway 900 GMS Nam Ngum 3 Hydropower Project 600
CAREC 4 projects (total) 9,043 2 projects (total) 1,072 6 10,115
CAREC Corridor 1b 6,700Central Asia-South Asia Regional Electricity Market (CASAREM)
962
Caucasus Corridor: Armenia-Georgia Regional Transport Project
323Regional Power Transmission Interconnection Project
110
CAREC Corridor 2 1,800
Western Regional Road Corridor Development Project-Mongolia 220
SASEC 3 projects (total) 293 2 projects (total) 279 5 572
SASEC Information Highway Project (Bangladesh, Bhutan, India and Nepal)
24 Green Power Development (Bhutan) 234
Subregional Transport Logistics and Trade Facilitation Projects (Bangladesh, Bhutan, India and Nepal)
179 West Seti Hydroelectric Project (Nepal) 45
Improving Connectivity and Destination Infrastructure for Sub-regional Tourism Development (Bangladesh, Bhutan, India, Nepal and Sri Lanka)
90
Total 12 projects (total) 12,660 9 projects (total) 2,764 21 15,424

172
Infrastructure for a Seamless Asia
Challenges in Financing Regional 5.2. Infrastructure
Financing infrastructure projects is challenging for many reasons. Investments are relatively large and lumpy, their implementation period is long and they create assets that yield financial returns over an even longer period, they involve sovereign risks that create uncertainties about future costs and revenue streams, and many of their economic benefits cannot be captured as financial revenues. Most infrastructure projects are therefore developed and financed by governments. And while an increasing proportion of projects involve PPPs, these still require—with the exception of telecommunications projects—some form of government guarantee.
Additional complexities are involved in the development, approval, preparation, evaluation, implementation, management, operation, and maintenance of regional projects that make their financing even more challenging. By definition, they require the support of—and coordination between—two or more sovereign countries. Domestic politics complicates matters further. Key stakeholders may be reluctant to support “foreign” projects, and powerful interest groups may oppose them for protectionist or other reasons. Broader regional projects are particularly complex, and reaching agreement among a larger number of governments often requires a neutral conciliator.
Regional projects that involve building infrastructure in less developed or sparsely populated border areas are particularly problematic. For instance, a cross-border road may initially be used less intensively than one in a country’s economic heartland, making it harder to justify diverting funds from wholly national investments. That is one reason why most regional projects in the EU have required grant or concessional financing.
Financing becomes more complicated when the costs and benefits of a regional project are unevenly distributed. One reason for the lack of progress in building a road link between Bangladesh and Nepal through India, for instance, is apparently that India believes that it would bear most of the costs but derive few of the benefits. India

Financing Regional Infrastructure
173
might view the project more favorably if concessional financing were available. Consider, also, that to secure financing for a power plant that would mainly export its electricity, the parties involved need to agree on their respective shares of costs and benefits, or else bring in a neutral third party and/or an external source of concessional financing. For example, many years of technical work by ADB and the World Bank—and the promise of considerable concessional financing—were needed to help prepare, assess, and negotiate the Nam Theung power project in the Lao PDR.
Regional projects also usually involve additional project management, commercial, and sovereign risks that lengthen their preparation and complicate the negotiation of their financing. That is one reason why very few regional projects in the EU have involved PPPs and why only a fraction of those proposed in Latin America have reached the implementation stage. Experience in the EU and Latin America shows that strong political support from national leaders and a perceived shared interest in their development are therefore essential. The involvement of a technically competent, neutral third party and the availability of considerable concessional financing are also often crucial.
Four examples—two from Europe and two from Asia—in Boxes 5.1–5.4 illustrate the challenges and best practices of developing cross-border projects and the complexities of structuring PPPs while also coordinating the activities of two or more sovereign countries. They also highlight that each project requires tailor-made management, financing, and risk mitigation arrangements.

174
Infrastructure for a Seamless Asia
Box 5.1. Theun Hinboun Hydropower Project, the Lao PDR
The 210 megawatt Theun Hinboun project was the first PPP to build, own, operate, and transfer a hydropower plant in the Lao PDR. It was built between 1994 and 1998 at a cost of $240.3 million. It was also the
first project implemented under an MOU between the Lao PDR and Thailand to develop 1,500 megawatts of power for export by 2000.
The overall project cost, including both foreign exchange and local currencies, was estimated at loan appraisal at $270 million equivalent. The actual cost was about $240 million, resulting in savings of about $30 million. The most important saving of about $23 million was due to substantially lower than estimated tender prices for the main civil works and hydraulic steelworks.
The Lao PDR government entered into a joint venture with a private company to form the Theun Hinboun Power Company (THPC) to develop, implement, and maintain the project. THPC was given 30-year operating rights under a long-term contract with the Electricity Generating Authority of Thailand (EGAT). The Lao PDR is represented in the project by Electricité du Laos (EdL), the private sector by MDX Lao Public Company (90% owned by GMS Power Public Company and 10% by Crown Property Bureau, Thailand) and Nordic Hydropower AB (owned equally by Statkraft AS of Norway and Vattenfall AB of Sweden).
Equity funding ($110 million) was raised by the government of the Lao PDR through EdL ($66 million), MDX ($22 million), and Nordic Hydropower AB ($22 million). Debt funding ($130 million) was provided by the government of the Lao PDR ($7 million), commercial banks ($65 million), and export credit ($59 million). The Lao PDR government’s contribution toward equity and debt came from grants by the Norwegian Agency for Development Cooperation ($7 million) and the United Nations Development Programme ($0.4 million), as well as from loans by ADB ($58 million) and the Nordic Development Fund ($7 million).
The license agreement provides exclusive rights and tax and royalty obligations for THPC. THPC is also protected against any detrimental water diversions, except for implementation of the Nam Theun 2 project. In return, THPC pays a royalty of 5% of gross revenues to the Lao PDR government. THPC enjoyed a five-year tax holiday after the start of commercial operations, but now it pays 15% tax. The government is responsible for environmental and social mitigation, with limited funding by THPC.

Financing Regional Infrastructure
175
The Power Purchase Agreement (PPA) was executed between EdL and EGAT in June 1996 and is valid for 25 years from the start of commercial operation. The PPA provides for an option to renegotiate the power tariff after 10 years and is based on the take-or-pay principle under which EGAT undertakes to purchase 95% of the project’s available energy output. The tariff is denominated in US dollars, of which 50% is payable in dollars and 50% in Thai baht at the exchange rate on the execution date of the PPA. In the first year of operation, the tariff was negotiated at US$0.0484 per kWh; thereafter it would increase at the fixed rate of 1% per annum.
The project is highly profitable, and THPC maintains a comfortable debt-servicing capacity. Its revenues increased from $42 million in 1998 to $57 million in 2005, and are expected to be around $55 million a year in the future. The project generated a net income of $88 million between 2003 and 2005. THPC’s dividend payments in 2003–2005 totalled $78 million, of which $47 million went to EdL. THPC also paid around $2.8 million in royalties to the government in 2005.
To attract private investment, project risks were mitigated in a number of ways. The Lao PDR government committed to meet its obligations under the 30-year build, own, operate, and transfer license, while ADB waived its usual negative pledge covenant. Shareholders gave lenders a completion guarantee, and an offshore escrow account was set up and pledged to the lenders. Funds are distributed first to meet THPC’s operation and maintenance costs, then to service interest payments, followed by royalties to the government, and finally dividends to shareholders.
The project has boosted the Lao PDR’s economy through increased export revenues and the electrification of surrounding rural areas. Many jobs were also created, enhancing the skills of workers associated with the project. Modern education and medical services have improved living conditions. The revenues from the project allow EdL to subsidize electricity tariffs for the poor and to support other power projects. However, the diversion of water flows from the Nam Hai-Nam Hinboun system caused substantial social and environmental damage until this was mitigated with support from ADB.
Overall, the project has proved successful in terms of its financing arrangements, implementation, and the coordination among all parties concerned. This could be considered a good model for financing cross-border hydropower projects.
Source: De et al. (2008).

176
Infrastructure for a Seamless Asia
Box 5.2. Malaysia-Singapore Second Link: Railway
The second border crossing bridge (also known as the “Second Crossing” or “Linkedua”) between Malaysia and Singapore was built to reduce traffic congestion at the first crossing, the Johor-Singapore Causeway.
The project was implemented on a build-operate-transfer basis, through a concession agreement signed in July 1993 with United Engineers Malaysia Berhad (UEM). The agreement gave exclusive rights and authority to UEM to design, construct, manage, operate, and maintain the bridge and expressways for 30 years. In May 1994, through an agreement, UEM assigned all of its rights, liabilities, and obligations to Linkedua Malaysia Berhad (LINK), a wholly owned subsidiary of UEM.
The 1.92 km long twin-deck bridge accommodates a two-way, six lane road. The bridge, designed to cater to about 0.2 million vehicles a day, was opened to traffic on 18 April 1998.
An Inter-Governmental Agreement (IGA) that defined each government’s responsibilities for the design, construction, operation, and maintenance of the bridge was signed in March 1994. Further, in September 1994, a Supplemental Concession Agreement was signed to take into account the IGA between the governments of Malaysia and Singapore. This agreement ensured that LINK’s obligation to implement the project and its rights under the concessional agreement were consistent with the Malaysian government’s obligations under the IGA. A joint committee comprising representatives of each government was formed to oversee the project’s implementation. The award was valued at 1.6 billion ringgit plus a 600 million Singapore dollar component from Singaporean investors.
Project sponsors on the Malaysian side include the Malaysian Highway Authority, the government of Malaysia, Malaysia PLUS Expressway Berhad, and LINK. Sponsors on the Singapore side are the Land Transport Authority and the government of Singapore. The project is maintained by Malaysia PLUS Expressway Berhad and LINK on the Malaysian side, and by the Land Transport Authority on the Singapore side.
Projects of such magnitude require large cash flows in their initial years of operation, followed by sustained revenue flows to meet project expenses and to service debts. To make the project attractive, the concessionaire (UEM) was accorded rights for developing a new township in Johor, called Prolink 2020. This

Financing Regional Infrastructure
177
was jointly developed by the project company based on a cost-sharing arrangement with Prolink Development, also owned by UEM.
The link provides safe and congestion-free travel, with quick customs and immigration clearances. Financially, however, the project has not been successful. Since its opening, revenues have proved much lower than expected due to low traffic volume (in 1998 this was one third of the original estimate). The project company (LINK) has therefore had great difficulty servicing its debts. Information in the public domain reveals that cumulative revenue of the concessionaires in 2007 was 27.6 billion ringgit, while the total cumulative net profit was 3.5 billion ringgit. In order to ensure financial returns to the project developers, the government has been planning to pay compensation to toll concessionaires in the form of prolonged concessions. The interventions by the governments can be seen as positive steps in building the confidence of the private sector and ensuring that the private sector remains engaged in the development of regional infrastructure facilities in the long run.
Source: De et al. (2008).
Box 5.3. Perpignan–Figueiras Rail Concession
This cross-border rail link between France and Spain, although not yet completed, is a good example of a successful PPP with very complex institutional challenges. An EU grant and subsidies from domestic
governments will cover 57% of the construction costs. The remaining funds have to be offered by the private partners in the form of own equity and commercial loans.
The private parties will levy fixed and publicly approved tolls from train operators. The standards of maintenance and performance obligations are set very high, with penalties for nonperformance, including termination of the contract. This is seen as a flagship model of how to set up a PPP for a highly complex cross-border infrastructure project. Subsidies allow the private sector to take on demand and availability risks rather than the total cost of the project.
Source: van der Geest and Nunez-Ferrer (2008a).

178
Infrastructure for a Seamless Asia
Box 5.4. Channel Tunnel Rail Link
The Channel Tunnel rail link connecting the United Kingdom (UK) to France is a prime example of a highly complex and very costly cross-border project. It highlights the challenges of putting together and executing such
projects. After the first part was completed in 1993, passenger numbers were less than half those expected, not least because the projections had failed to allow for the emergence of low-cost airlines. It was soon clear that London and Continental Railways (LCR), the private consortium that developed the project, would not be able to recover its investment. But the British government could not provide state aid. Finally, a complex refinancing agreement was agreed upon. This involved LCR completing the project and selling it to Railtrack, the newly privatized UK rail company. The UK government provided loan guarantees to LCR so that it could finance the design and construction work. Unfortunately, Railtrack, too, experienced hard times and had to be taken into public ownership.
While the rail link was completed seven years late at a cost of 5 billion pound sterling, the private engineering and building companies managed to deliver their part of the project on time and on budget. But the project was hampered by low passenger use, a failure to connect the rail link to the rest of the UK network, and a long delay in upgrading the line within the UK. Eurostar trains ran at 300 kilometers per hour (km/h) in France but then had to slow down to 140 km/h in the UK. Since 2008, the trains can finally run at 270 km/h in the UK. Shorter travel times, combined with the increasing inconvenience of flying, not least due to prolonged security controls at UK airports, have recently increased the demand for Eurostar services. Even so, only 10 million passengers a year are expected in 2010, compared with the original forecast of 21 million. While the project has not been financially successful, it has brought Britain closer to the rest of Europe and is seen as a historic feat of engineering on both sides of the Channel.
Source: van der Geest and Nunez-Ferrer (2008b).

Financing Regional Infrastructure
179
International Experience5.3.
This section discusses international experience in financing regional infrastructure projects—particularly those involving PPPs in Europe and Latin America—as well as experience within Asia, notably in the GMS. The financial instruments used for regional infrastructure development in Europe, Latin America, and Asia and their experience to date reflect their differing economic and political realities.
The EU is the world’s most integrated region, both economically and politically, and is often seen as a model for economic cooperation and integration in other regions. Its advanced economies are home to a thriving private sector and sophisticated financial markets, supported by well-developed regional (supranational) institutions (such as the EC and the EIB) that have considerable statutory authority, highly skilled staff, and significant financial resources.
The EU has the strongest policy and institutional framework, as well as an extensive system of financial support for regional initiatives. European countries have also been leaders in using PPPs. The EU has two major financial channels to support regional infrastructure projects with PPPs: programs managed by the EU itself, and those of EIB. Regional infrastructure projects consist mainly of connecting existing high-standard national transport, energy, and telecommunications facilities and networks and upgrading existing individual country segments to European standards so as to reduce the time and cost of—and stimulate further—already large movements of people, goods, and services across national borders.
Latin America is the least integrated of the three regions. External trade is a much lower share of GDP, consists principally of commodities, and is mostly with countries outside the region. The region is middle income—and thus much richer than Asia—but its growth is generally much lower. Efforts to develop regional infrastructure are driven more by political desire than by economic imperatives. Culturally, political leaders are comfortable with the creation of high-profile initiatives and formal supranational institutions, but their follow-up has been limited.

180
Infrastructure for a Seamless Asia
Latin America has created two formal programs and supporting institutional frameworks for regional projects: IIRSA, which encompasses 12 countries; and the PLPP, which aims to link seven countries in Central America with Mexico. Cascading sets of committees exist, with summits of heads of state providing political leadership. No institutions are specifically responsible for financing regional projects; rather, three existing regional institutions—CAF, FONPLATA, and IDB—provide expertise and help mobilize financing for the ventures. Latin American efforts have focused on 10 regional transport, energy, and telecommunications “axes,” which were noted in Chapter 4.
Asia comprises several distinct subregions that differ in geography, politics, level of development, resource endowment, and economic growth rate, as well as in the importance and direction of external trade. Whereas intraregional trade approaches EU proportions in East Asia, it is very low in South Asia, where the political will to enhance regional cooperation and integration is also lowest. Trade among the sparsely populated Central Asian countries, which have historically traded with the Russia Federation rather than with each other, remains low and consists mainly of energy. In contrast to Europe, regional integration in East Asia has been led by the private sector; formal agreements among governments are relatively underdeveloped.
Asia does not possess a formal pan-Asian forum to lead and guide regional infrastructure development. So far, such activities have been discussed either bilaterally or subregionally. The GMS has made the most progress, with periodic summits of heads of state providing active leadership. ADB has played a crucial role in facilitating all aspects of regional cooperation in the GMS, not least in identifying, developing, and financing regional projects. ASEAN possesses a small secretariat and also relies informally on ADB for technical expertise and financial resources. In Central Asia, a formal institutional framework has been created with ADB’s help, but CAREC is still in its infancy. Countries rely on multilateral institutions, notably ADB, to finance projects. In South Asia, SASEC’s achievements have been negligible, perhaps reflecting long-standing political tensions within the subcontinent and countries’ preference for developing closer ties with those outside the subregion.
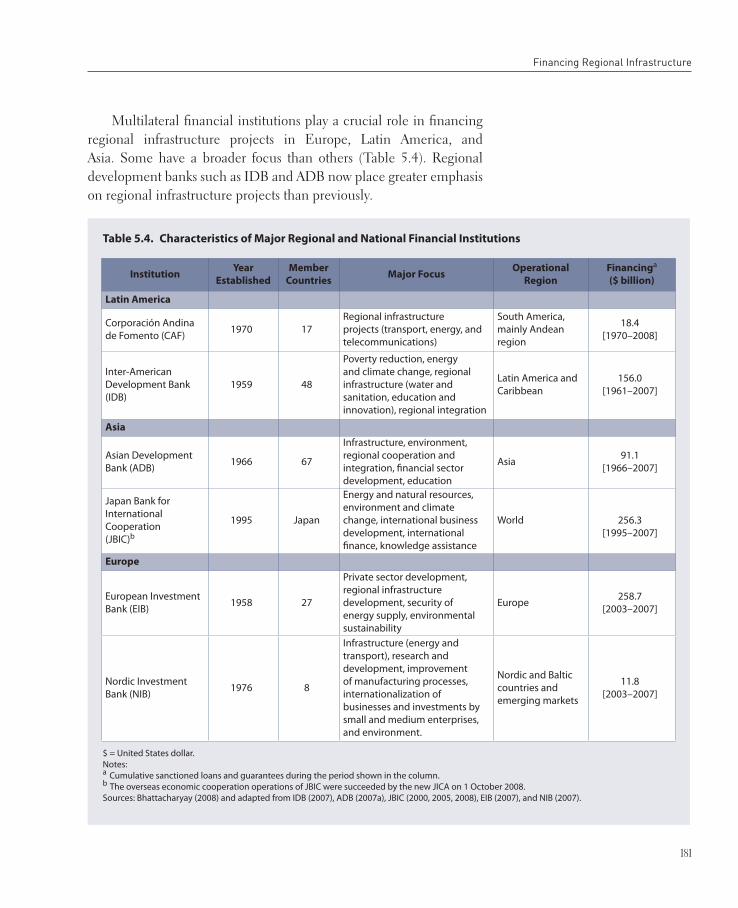
Financing Regional Infrastructure
181
Multilateral financial institutions play a crucial role in financing regional infrastructure projects in Europe, Latin America, and Asia. Some have a broader focus than others (Table 5.4). Regional development banks such as IDB and ADB now place greater emphasis on regional infrastructure projects than previously.
Table 5.4. Characteristics of Major Regional and National Financial Institutions
$ = United States dollar. Notes: a Cumulative sanctioned loans and guarantees during the period shown in the column. b The overseas economic cooperation operations of JBIC were succeeded by the new JICA on 1 October 2008. Sources: Bhattacharyay (2008) and adapted from IDB (2007), ADB (2007a), JBIC (2000, 2005, 2008), EIB (2007), and NIB (2007).
InstitutionYear
Established
Member
CountriesMajor Focus
Operational
Region
Financinga
($ billion)
Latin America
Corporación Andina de Fomento (CAF) 1970 17
Regional infrastructure projects (transport, energy, and telecommunications)
South America, mainly Andean region
18.4[1970–2008]
Inter-American Development Bank (IDB)
1959 48
Poverty reduction, energy and climate change, regional infrastructure (water and sanitation, education and innovation), regional integration
Latin America and Caribbean
156.0 [1961–2007]
Asia
Asian Development Bank (ADB) 1966 67
Infrastructure, environment, regional cooperation and integration, financial sector development, education
Asia 91.1[1966–2007]
Japan Bank for International Cooperation(JBIC)b
1995 Japan
Energy and natural resources, environment and climate change, international business development, international finance, knowledge assistance
World 256.3[1995–2007]
Europe
European Investment Bank (EIB) 1958 27
Private sector development, regional infrastructure development, security of energy supply, environmental sustainability
Europe 258.7[2003–2007]
Nordic Investment Bank (NIB) 1976 8
Infrastructure (energy and transport), research and development, improvement of manufacturing processes, internationalization of businesses and investments by small and medium enterprises, and environment.
Nordic and Baltic countries and emerging markets
11.8[2003–2007]

182
Infrastructure for a Seamless Asia
Very few examples of successful cross-border infrastructure projects with PPPs exist, as the examples in Boxes 5.1 and 5.3 highlight. Even though the EU has dedicated special financing windows for PPPs, these have been scarcely used. The few regional projects that have successfully involved PPPs have obtained private financing from capital markets rather than submit to EU rules and procurement procedures.
Most privately funded projects in Europe have been funded through project-finance vehicles. The EU has well-developed financial markets with several financing instruments, an advanced legal and regulatory framework, and relatively stable currency markets. However, for financing regional projects, the specific financial instruments, techniques, and risk-mitigation arrangements were all tailored to the specific needs of the various project sponsors and funders, the nature of the revenue streams, the sovereign countries where the project was based, and the market appetite at the time of financial closure. While cross-border projects tend to take a very long time to prepare, negotiate, finance, and implement, those financed through project-finance techniques take even longer.
Lessons for the Future
Past experience shows that only a few of the long list of projects proposed by individual countries and parties reach the final financing and implementation stage. During the process of vetting and professional appraisal, many are dropped for a variety of reasons, including unrealistic demand and cost assumptions, poor technical design, inability to realize adequate financial returns, lack of project sponsors, and inadequate financing.
The following lessons can be drawn from previous experience with regional infrastructure projects in Europe, Latin America, and Asia:
Developing and financing cross-border projects is a slow and complicated process, even in the EU. Political leadership at the highest level is necessary but not sufficient, as Latin America demonstrates.
Financing Regional Infrastructure
183
Regional projects are usually a low priority for national policymakers responsible for allocating budgets and requesting assistance from multilateral institutions. Also, they often involve constructing infrastructure segments in parts of a country with little economic activity and few advocacy groups. Concessionary financing from external sources is therefore usually necessary to make a project more economically and financially attractive.Public sector funding alone will not be sufficient to eliminate infrastructure gaps for regional infrastructure projects.Attracting private participation in regional projects is particularly difficult because of the additional risks and uncertainties involved. Despite the ongoing turmoil in global financial markets, many regional projects in Asia can involve PPPs if attractive, sound, and bankable projects are created. The private sector will have to play a big role in the future when the significant challenges involved can be overcome.To attract large- and medium-sized private investors, Asian countries must establish effective institutional mechanisms, both nationally and regionally, as discussed in Chapter 4.A neutral and respected multilateral agency is very helpful, if not essential, to provide a dispassionate and professional assessment of projects’ merits and the best way to structure them fairly. For example, ADB has been vital to the success of regional cooperation in the GMS. The Theun Hinboun and Nam Theun 2 hydropower projects were able to attract private investment thanks to sustained support (i.e., funding, political and risk guarantees, and support in implementing environmental and social rehabilitation and mitigation measures) from aid agencies such as ADB and the World Bank.

184
Infrastructure for a Seamless Asia
Development of Asian Financial 5.4. Markets
The availability of private finance for commercially and financially viable infrastructure projects—be they national or regional—depends on how developed and stable Asia’s financial markets are and their effectiveness in intermediating the region’s vast domestic savings. This section therefore considers the state of Asian financial markets and their future development.
Most Asian countries’ financial systems have made impressive progress since the 1997–1998 crisis. But while they are deeper and more robust, they are still relatively underdeveloped. The recent global financial turmoil has highlighted that Asia’s financial systems are now intimately intertwined with global ones, and that even healthy national balance sheets—high domestic savings, low foreign debt, and large foreign reserves—cannot insulate Asia from problems elsewhere.
After the 1997–1998 crisis, authorities in the region focused on restructuring the banking sector and, to a lesser extent, on building capital markets. Nearly all countries have made considerable progress in reforming their banking systems; the incidence of nonperforming assets has dropped, and the return on assets has risen. Supervisory and regulatory regimes have been strengthened, and internal governance has been improved. Many countries have allowed foreign banks to open branches, increasing competition and stimulating innovation. But much remains to be done. Banking systems remain vulnerable due to the vagaries of global financial markets and the weaknesses of domestic institutions and regulations.
Capital markets have developed differently. One group of economies with more sophisticated markets—Hong Kong, China; Republic of Korea; Malaysia; and Singapore—has been quite successful at reforming and deepening domestic bond markets and, to a lesser extent, at bolstering their equity markets. In Central Asia, Kazakhstan’s financial system is also relatively well developed. But in the rest of Asia, capital markets have developed more slowly, and financial systems remain largely bank dominated, as Table 5.5 shows. Three main

Financing Regional Infrastructure
185
factors have hindered progress: fiscal deficits in many countries, an inability to reform and restructure contractual savings institutions,68 and a reluctance to allow foreign financial intermediaries to help build these markets.
Capital markets in the region also have a narrow investor base. This reduces liquidity and impedes domestic savings and investments from flowing through them. Although investor diversity is broadening in some markets, notably in emerging East Asia, greater issuance of financial instruments such as bonds and equities will not automatically
68 Contractual savings institutions include national provident funds, life insurance companies, private pension funds, and funded social pension insurance systems (Vittas and Skully 1991).
Table 5.5. Structure of Financial Systems in Selected Asian Economies (percent of GDP)
– data not available.CEIC = China Economic Information Center; GDP = gross domestic product; PRC = People’s Republic of China.Note: * PRC and Hong Kong, China 1990 bank deposit data from CEIC. Viet Nam 2006 bank deposit data for 2005. PRC 1990 equity market data for 1992. Hong Kong, China; Japan; Singapore; and Taipei,China 2006 equity market data from 2005. Pakistan and Philippines 1990 bond market data do not include private bonds. Indonesia 1990 bond market data for 1991. Hong Kong, China 1990 insurance premium data from CEIC is for 1991.Source: Financial Structure Database, CEIC.
Economy Bank Deposits Equity Market Bond Market Insurance Premiums Total Financial Assets
1990 2006 1990 2006 1990 2005 1990 2005 1990 2005/2006
PRC 75.6 * 177.8 2.4 * 60.4 5.9 34.1 0.8 2.7 84.7 275.0
India 31.4 53.2 10.4 76.2 19.8 33.0 1.5 3.2 63.1 165.6
Indonesia 30.0 34.7 4.5 30.4 0.1 * 20.3 0.9 1.5 35.4 87.0
Korea, Rep. of 32.6 66.1 48.2 88.2 44.3 102.0 11.0 10.5 136.1 266.8
Malaysia 80.6 115.9 100.7 141.0 69.9 90.5 3.0 5.6 254.2 352.9
Pakistan 23.6 34.0 6.7 35.8 29.0 * 29.7 0.8 0.7 60.0 100.2
Philippines 24.7 46.7 20.6 46.7 25.8 * 38.9 2.0 1.5 73.1 133.8
Thailand 62.9 93.9 29.2 64.3 9.8 41.3 1.7 3.6 103.6 203.1
Hong Kong, China 205.6 * 251.5 105.2 527.9 * 1.5 27.7 3.0 * 9.9 315.3 817.1
Japan 177.3 190.4 122.6 93.2 * 86.4 191.5 8.5 10.6 394.7 485.6
Singapore 74.3 107.5 95.9 163.5 * 27.7 57.8 3.0 8.8 201.0 337.6
Taipei,China – – 104.6 134.8 * 16.6 55.9 – 14.2 121.2 204.8

186
Infrastructure for a Seamless Asia
translate into higher liquidity, especially as the nonbank investor base remains homogenous; focused on buy-to-hold strategies; and dominated by government-controlled provident funds, insurance companies, and banks. Measures to support the participation of more provident schemes, pension funds, and insurers would help in diversifying and expanding the investor base, as would the reduction of national and cross-border financial transaction barriers.
By sustaining current account surpluses and accumulating foreign currency reserves, Asian countries have strengthened their balance sheets and made their economies more resilient to external shocks. But the buildup of reserves also reflects the inability of the region’s financial system to intermediate the surplus funds effectively. Savers have instead channeled their surpluses through US and European financial centers, from which their funds have often been reinvested in Asia. Thus, Asia has become both a major exporter of capital and the world’s largest recipient of private capital inflows.
If Asia’s financial markets and institutions were more developed, a large part of the region’s savings could be directly channeled into productive investments—including regional infrastructure—within Asia, while also perhaps offering higher returns to savers. Asia therefore needs to redouble its efforts to develop national and regional capital markets—especially bond markets.
Regional Integration of Financial Markets
Since 1997, Asian leaders and policymakers have placed more emphasis on regional financial integration and cooperation. Several important initiatives have been launched, notably the Chiang Mai Initiative, the Asian Bond Markets Initiative (ABMI), and the Asian Bond Funds (ABF). Despite these worthwhile initiatives, the region remains much less integrated financially than it is in trade and investment (Kawai 2005). Most Asian financial markets are more closely integrated with international ones, particularly in the US and Europe, than they are with neighboring ones.

Financing Regional Infrastructure
187
Greater regional financial integration is an essential part of closer regional cooperation—and vital for funding Asia’s vast infrastructure needs. It would create deeper and broader financial markets that would enable Asian investors to invest in other markets in the region more effectively, and channel funds from economies with surplus savings to those short of capital. With a greater knowledge of the risks and rewards associated with investment opportunities in the region, local markets may be more efficient in allocating resources than outsiders. Regionwide initiatives to implement global financial standards and to strengthen regulation and oversight could also spur competition and reforms in domestic markets.
Many obstacles remain. For a start, the domestic financial markets that will act as building blocks for larger regional markets need to be developed and liberalized. In particular, the contractual savings institutions—the pension and provident funds, social security institutions, and insurance companies that hold most of the long-term savings that are the bedrock of bond and equity markets—need to be liberalized. National authorities also need to harmonize their domestic laws, regulations, financial standards, and access rules for foreign financial institutions and products. A desire to protect domestic players seems to override efforts to foster competition and create regional markets. Jurisdictional rivalries and competition among the numerous public institutions responsible for the financial system have also delayed progress. Last but not least, closer regional collaboration is needed to develop appropriate financial infrastructure needed to support regional capital markets.
In the longer term, Asia requires a regional financial system that matches the strength, global competitiveness, and agility of its productive sector. Such a system should be capable of mobilizing and channeling, within the region itself, a much larger share of its twin surpluses of domestic savings and foreign exchange reserves in a manner that helps meet the region’s need for higher investment, particularly in infrastructure projects; raises returns; and reduces risks to savers.
188
Infrastructure for a Seamless Asia
The ultimate impact of the post-2007 global financial crisis and ensuing economic downturn is still unclear. For now, there has been a sharp fall in global capital flows. As international investors become much more risk averse, they are reducing their exposure to emerging markets. Given the perceived higher risks associated with long-term investments in cross-border infrastructure projects in emerging markets, prospects for attracting private financing appear slim for now. Asia will therefore have to rely much more on domestic financial markets and support from multilateral institutions to supplement public funding for infrastructure investment.
Financing Options5.5.
This section reviews the need, rationale, and practical feasibility of creating new public sector funding mechanisms and/or institutions, as well as financial instruments using Asia’s domestic savings and foreign exchange reserves for financing national and regional projects—including those involving PPPs.
Asia’s Twin Surpluses
It is often argued that Asia’s massive—national and regional—infrastructure needs could easily be financed by the region’s large domestic savings and huge foreign exchange reserves (see Table 5.6). But the reality is far more complicated.
On the demand side, countries are understandably reluctant to finance infrastructure investment through foreign borrowing. In Asian (and most other) developing countries, domestic investment is financed overwhelmingly through domestic savings. In most Asian economies—with the notable exceptions of least developed countries such as Nepal, and countries rebuilding from a war such as Afghanistan—over 90% of domestic investment is financed from domestic financial markets or through government budgets funded by local taxes. Foreign capital flows—FDI, portfolio flows, and bank debt—account for a modest (if not marginal) share of total financing, while international development

Financing Regional Infrastructure
189
assistance is small, except in least developed countries, small island economies, and postconflict countries.
Since the financial crisis in 1997–1998, Asian countries have been wary of incurring large commercial debts in foreign currencies to invest in assets that will generate revenues in local currency. Governments are usually reluctant, therefore, to increase their reliance on foreign capital significantly to finance the needed jump in infrastructure spending. They are instead trying to supplement investment budgets by tapping domestic savings, through PPPs as well as by allowing state-owned infrastructure companies to raise debt and equity from domestic markets. Since governments avoid foreign financing for domestic infrastructure, they are highly unlikely to provide guarantees on foreign debt to finance regional projects.
On the supply side, most of Asia’s domestic savings are not at the disposal of the region’s governments. Asia’s domestic savings are held mainly by private individuals and businesses, whose main investment criteria are financial returns and risk management. Mostly invested through (domestic) financial markets, these can be tapped only by offering market-beating returns. The only domestic savings
Table 5.6. Asia’s Gross Domestic Savings and Foreign Exchange Reserves, 2007 ($ billion)
$ = United States dollar; ASEAN = Association of Southeast Asian Nations; GDP = gross domestic product.Notes: East Asia-5 includes: Hong Kong, China; Japan; People’s Republic of China; Republic of Korea; and Taipei,China. ASEAN-5 includes: Indonesia, Malaysia, Philippines, Singapore, and Thailand. Asia-11 includes: East Asia-5, ASEAN-5, and India.Sources: Bhattacharyay (2009a), based on Key Indicators 2007 (www.adb.org/statistics); Asian Development Outlook 2008 (ADB 2008k), International Monetary Fund International Financial Statistics, and World Bank’s World Development Indicators CD-ROM 2008.
Country/Region GDP Gross Domestic Savings Foreign Exchange Reserves
China, People’s Rep. of 3,239 1,384 1,434
Japan 4,403 1,311 923
East Asia-5 9,173 3,207 3,034
ASEAN-5 1,091 457 409
India 1,085 329 267
Asia-11 11,349 3,992 3,710
190
Infrastructure for a Seamless Asia
that governments control are those generated by budget surpluses and the surplus cash flows of public sector enterprises and banks. There are many competing claims on these resources domestically, so governments are unlikely to use them to finance investments abroad (other than bilateral aid and export promotion schemes).
Several Asian countries, notably PRC, India, Japan, and Republic of Korea, have also accumulated huge foreign exchange reserves. These are usually held by central banks, which are legally required to invest them in a way that preserves capital, maintains liquidity, and involves minimal risk. Most reserves are therefore invested in “risk-free” US and European government securities. Central banks are highly unlikely to be willing, or able, to invest even part of these reserves in infrastructure in other Asian countries.
More recently, as many Asian countries’ foreign currency reserves have come to greatly exceed central banks’ needs for maintaining exchange rate and financial stability, part of them has been channeled into sovereign wealth funds (SWFs). These are allowed to invest in foreign assets that offer higher returns than are possible under central banks’ investment guidelines.
Since SWFs hold the funds in trust on behalf of a country’s present and future citizens, they have a duty to preserve the principal and earn a “reasonable” return. To obtain financing from them, infrastructure projects need to offer attractive financial returns at an acceptable level of risk. In principle, then, it should be possible to tap this source of funding for large individual projects that are financially viable, as well as dedicated infrastructure funds that operate on a commercial basis. In both cases, projects involving PPPs are likely to form the basis for attracting financing from SWFs.
Unfortunately, the EU’s experiences—and current financial condition—suggest that very few regional projects are likely to be based on PPPs, so it is not prudent to expect SWFs to be a major direct source of financing for regional infrastructure. It may, however, be possible to persuade some SWFs to allocate a small part of their portfolio to specialized funds created by an institution—such as ADB—that already

Financing Regional Infrastructure
191
has an investment-grade rating and is willing to absorb many of the risks. Infrastructure investments by foreign investors face special types of risk because of their long development time, currency exposure, political risks, possibility of cancellation, possible underutilization, and so on. Official guarantees can make projects bankable by ensuring against specific risks—indeed, official guarantees by AAA-rated institutions can open new and cheaper funding channels that can enable the building of infrastructure that otherwise would not be funded.
In the medium term, Asia needs to develop deeper and more robust domestic financial markets to help fund bankable infrastructure projects. In Chile and Mexico, for instance, private pension funds have created large financial resources focused on long-term investments. Over time, these could also be complemented by regional financial markets. But this will take time. In the short term, infrastructure—and regional infrastructure in particular—will be funded largely by the public sector, complemented by domestic savings where possible.
Commercial Financing
Commercially viable projects and companies (whether national or regional) can readily be financed in a variety of ways: they can tap domestic equity markets; can borrow from domestic counterparties such as the corporate sector, financial institutions, and households, either through bond markets or long-term bank loans; and can seek external finance, where possible. This could involve equity financing through FDI in countries where the government permits foreign participation in infrastructure projects. It could also involve borrowing from regional or international debt markets, where prudential controls on borrowing in foreign currencies do not prevent this.
To borrow long-term funds from international debt markets, developing Asian countries need to create mechanisms for nonspeculative, natural counterpart-funded cross-currency swap markets. Exchange controls must also be liberalized to reassure investors that projects will be able to access long-term foreign currency funding.

192
Infrastructure for a Seamless Asia
Commercially viable projects and companies can—and should—be financed through the normal financial instruments available in well-developed financial markets. Special new instruments or institutions are not needed. Experience in Asia and elsewhere with PPPs for cross-border infrastructure projects shows that project financing arrangements generally have to be tailored to the specific needs of each particular project. Rather than creating unnecessary special instruments to provide financing for a handful of investments in cross-border infrastructure projects, efforts should focus instead on developing and properly regulating domestic and regional financial markets to help mobilize and allocate domestic savings effectively and efficiently across the whole economy, and meet the diverse needs of all investors and consumers. In this context, ongoing efforts to develop national and regional equity and bond markets will help boost investment in infrastructure. Two valuable regional initiatives—the ABF and ABMI—acquire added urgency and priority. Islamic financial instruments also offer an attractive source of financing for regional infrastructure projects, as Box 5.5 describes.
Box 5.5. Islamic Financial Instruments
Islamic capital markets offer a huge potential source of finance for infrastructure investment. The global market for sukuk (Islamic bonds) is more than $100 billion and is growing by an estimated 25–35% a year. Two thirds are issued in the Malaysian market, leaving Southeast
Asia well placed to absorb Islamic funding. The size and number of sharia-compliant private-equity funds has also increased in recent years, in both Islamic and non-Islamic markets.
Islamic bond and equity markets in Kuala Lumpur and the Middle East could potentially generate significant funds for infrastructure projects that comply with sharia financing principles. This requires that consultations begin during the planning stages of infrastructure projects on how to configure the financial package to meet sharia requirements and how to appeal to Islamic investors. Currently, each project requires customization to meet Islamic requirements, but work is under way to create standardized documentation. This will greatly facilitate the process. This study proposes that a small working group on Islamic finance for infrastructure should be created to work primarily with the Islamic Financial Services Board in Kuala Lumpur to promote this standardization and explore the potential for expanding Islamic financing.
Source: Bhattacharyay and Krueger (2009).

Financing Regional Infrastructure
193
Filling the Gaps
Two important gaps in the financing of regional projects need to be filled. As discussed above, the identification, preparation, negotiation, and evaluation of regional projects involve additional complexities. Their resolution requires considerable time, effort, and expense, and often the involvement of a trusted third party. This is true whether the project is sponsored by public entities or involves private participation. PPPs require extensive due diligence by governments to ensure that costs and benefits are properly estimated and shared. Governments also need to spend considerable sums to assess and address adverse social and environmental impacts. Yet governments are often reluctant to use scarce budgetary resources for regional projects, whose benefits partly accrue to other countries.
It would therefore be very helpful if external aid agencies, preferably multilateral institutions, could provide grants to fund technical assistance to identify, define, prepare, and reach agreement among the governments involved. This could be provided as part (or an extension) of ADB’s newly created funds for regional cooperation, such as the Regional Cooperation and Integration Financing Partnership Facility, the Regional Cooperation and Poverty Reduction Fund, and the Investment Climate Facilitation Fund to support technical assistance activities. However, their size may need to be increased substantially (see Bhattacharyay (2008) for details).
Second, as discussed in section 5.3, the EU’s experience shows that overcoming the challenges of agreeing on and implementing regional projects often requires concessional financing from an external source. Asia needs to create a mechanism for this purpose. A good start could be made on this by using more vigorously the provision in the latest replenishment of the Asian Development Fund for supporting projects that enhance regional cooperation, including greater trade and investment flows within the region. Building physical connectivity through regional infrastructure projects fits well with this objective of the Asian Development Fund. International Development Association funds managed by the World Bank could also help prepare and finance regional projects.

194
Infrastructure for a Seamless Asia
Various proposals (see Bhattacharyay and Krueger (2009) for details) for one or more new specialized multilateral entities dedicated to infrastructure financing in Asia have been floated. But it would appear hard to justify the huge effort and cost of setting up a new institution, especially given the renewed emphasis on infrastructure from nearly all multilateral and bilateral aid agencies active in Asia. Perhaps most importantly, such proposals do not have the necessary political support from a broad group of Asian governments. Working with existing institutions is therefore both more desirable and more realistic.
The binding constraint for infrastructure development in Asia is not a lack of financing. On the contrary, Asia is flush with capital. The countries accounting for 95% of Asia’s total investment needs—PRC, India, Japan, Republic of Korea, Malaysia, Thailand, and Viet Nam—all have high domestic savings rates. The real constraints include a lack of bankable projects; inadequate policy and institutional frameworks; weaknesses in the public sector that hamper its capacity to implement infrastructure projects (except in the PRC); weak support for PPPs (except in Republic of Korea, Malaysia, and, recently, India); and underdeveloped domestic and regional capital markets, especially bond markets.
Asian Infrastructure Fund
Therefore, Asia needs an appropriate mechanism or instrument such as a pan-Asia infrastructure fund. Asia should create a large Asian infrastructure fund (AIF) that would mobilize Asian and international funds, and help prepare and finance bankable regional infrastructure projects. A move in this direction has been initiated by ADB through its Asian Infrastructure Financing Initiative (ADB 2008j).
The AIF’s capital—which should include grant and concessional resources—could come from a variety of sources, notably governments, MDBs, and bilateral agencies. Efforts should be made to persuade some of Asia’s SWFs to allocate a small proportion of their assets to such a fund. The fund could be managed under an appropriate governance

Financing Regional Infrastructure
195
structure, for instance, as a trust fund. It should have a legal identity so as to help finance projects through its own resources as well as by issuing bonds or through cofinancing with other entities.
The AIF could help mobilize capital from cofinanciers, including national governments and institutions, such as national development banks and export-import banks, and investors interested in portfolio investment, notably pension funds and private investors, as well as Islamic financial institutions.
The AIF would help finance projects identified, agreed upon, and prioritized by the PAIF. It would need a project preparation facility (in addition to the existing regional technical assistance facility provided by multinational agencies such as ADB) to expedite and help finance the preparation, development, negotiation, and evaluation of formally agreed upon regional projects. It would also need a dedicated facility to provide grant and concessional financing to make the projects financially viable and bankable and to give countries the necessary incentives to prioritize regional projects in their own development programs. It may also need to provide guarantees against major risks, such as operational, financial, country, and political risks.
Conclusions5.6.
The public sector will necessarily continue to play a dominant role in developing and funding Asian infrastructure. Spending from government budgets will be supplemented primarily by funds channeled through domestic financial markets. The following six complementary steps would support the financing of national and regional infrastructure projects:
Establish policy, legal, and institutional frameworks that improve the financial viability of infrastructure services and companies and the bankability of infrastructure projects.Promote competition and PPPs vigorously, while improving the effectiveness of regulatory frameworks that protect the public interest, particularly in sectors such as telecommunications, energy, and transport.

196
Infrastructure for a Seamless Asia
Negotiate and agree on nondiscriminatory investment-protection treaties—along the lines of ASEAN’s Comprehensive Investment Agreement—to facilitate greater private investment within Asia, including regional infrastructure projects involving PPPs. Redouble efforts to develop more efficient, robust, and deep financial markets, particularly corporate bond markets, equity markets, and contractual savings institutions.Develop local currency capital markets that can effectively intermediate local savings, reduce currency risks to investors (including by creating nondiscriminatory currency swap instruments for long-term debt), and create a more stable financial system.Accelerate existing initiatives to create regional bond and equity markets in Asia—the ABF, ABMI, and ASEAN Equity Markets project—and to integrate national markets, wherever feasible, into broader regional ones.
Domestic savings need to be supplemented by public-sector initiatives supported by external aid agencies. Multilateral and bilateral institutions—especially ADB, World Bank, International Finance Corporation, Islamic Development Bank, JBIC, JICA, and the UK’s Department for International Development—have traditionally played an important role in supporting infrastructure development in the region through financial and technical assistance. This support must be continued, and indeed increased. Fortunately, all major multilateral institutions have recently adopted new assistance strategies that have put greater emphasis on infrastructure. The long-term strategic framework approved by ADB’s Board of Governors in May 2008 emphasizes all three of the areas highlighted above: infrastructure development, financial sector development, and regional cooperation.
This study also proposes that a large AIF should be created to help mobilize Asian and global funds, and to help prepare and finance bankable regional infrastructure projects.

Toward a
Seamless Asia
Chapter 6

Toward a Seamless Asia
199
Connecting a diverse Asia through seamless and environment–friendly infrastructure will help in achieving and sustaining an integrated, poverty-free, prosperous, and peaceful Asia. To the best of ADB and ADBI’s knowledge this is the first time that such a study
on regional infrastructure has been undertaken. The key messages of the study are as follows:
The required infrastructure investment for pan-Asian connectivity in the transport, communications, and energy sectors during 2010–2020 would produce substantial real income gains of about $13 trillion for developing Asia during this period and beyond. A PAIF should be established to help coordinate and integrate existing subregional infrastructure initiatives toward a seamless Asia.During 2010–2020, Asia needs to invest a total of around $8 trillion in overall national infrastructure and an additional $287 billion in specific regional infrastructure projects—an average overall infrastructure investment of $750 billion per year.An AIF is needed to mobilize Asian and international funds and help prioritize, prepare, and finance “bankable” regional infrastructure projects.
Asia is home to more than half of the world’s population, with a wide variety of resource endowments and cultures. Its landmass is vast, with abundant natural resources, and large and diverse energy reserves. It is dotted with factories, workshops, and businesses, both small and large, that produce a range of goods and services. Above all, it has enormous potential—but unfortunately, much of it goes untapped.
6. Toward a Seamless Asia

200
Infrastructure for a Seamless Asia
The reasons for not realizing this potential are many, but an important one is that Asia’s many resources are often not well connected to each other. Economic growth springs from the widening and deepening of markets—and the diffusion of new technologies across and between them—but geography often stands in the way. For instance, farmers in remote rural areas may produce food that city dwellers across Asia would love to eat—if only the time and cost of shipping it over a long distance to such consumers were not prohibitive. And while the distance cannot shrink, the cost of trading at a distance can. Import tariffs can be slashed, customs procedures streamlined, better infrastructure connections built, and logistics systems improved. Infrastructure connectivity can bring benefits to the region in many ways. Roads, railways, airways, seaways, and fiber optic cable that connect business centers of neighboring countries can enhance intraregional trade. Cross-border gas pipelines and electricity grids make it possible for energy surplus countries to profitably export excess resources to energy deficit neighbors.
The benefits of trade liberalization and low-cost, timely, reliable, and integrated regional infrastructure networks can be seen first hand in Asia’s busy ports, through which most of the region’s traded goods are shipped, as well as in the coastal regions around them. It can be witnessed in Bangalore, connected to the region and the world by fiber optic cables that are lifelines for its technology and services companies. Increasingly, it can be seen in Asia’s airports, through which a rising share of the region’s trade transits. Less visibly, but perhaps most importantly, it is evidenced by the increasingly sophisticated and efficient production networks and supply chains that crisscross parts of the region to take advantage of its comparative advantage.
While parts of the region’s infrastructure are world class, it is generally below the global average as this study details, and under increasing strain from rising populations and rapid growth. These problems limit development, endanger the competitiveness of those all-important production networks, and prevent the networks’ poverty-reducing benefits from expanding. Distant Pacific island countries, landlocked Central Asian states, inland provinces of the PRC, remote rural Indian states, the Indonesian archipelago—all, among others,

Toward a Seamless Asia
201
suffer from the inadequacies of Asia’s infrastructure connections. That they are often bypassed by development is a tragedy not just for the people who live there, to whom opportunity is denied, but for Asia as a whole, whose vast resources are underemployed. Disparities in development also generate large waves of migration and can cause social strains.
The good news is that the findings of this study confirm that the benefits of upgrading and extending Asia’s infrastructure networks are so large that they would benefit all countries in the region—and even the rest of the world. For example, better connections to coastal areas would not just benefit inland areas, they would boost trade and economic growth in coastal areas, too. Regional infrastructure development creates a win-win situation for all participating countries.
This study finds that between 2010 and 2020, developing Asia needs to invest a total of about $8 trillion in overall national infrastructure, 68% for new capacity and 32% for maintaining and replacing existing infrastructure. Some of this is for regional infrastructure as defined in Box 1.1. In addition, this study has also identified 1,077 bilateral, subregional, and pan-Asian infrastructure projects that are in the pipeline and could be implemented by 2020 at a cost of around $287 billion. These include 989 projects in transport that cost approximately $205 billion and 88 in energy that cost around $82 billion.69 This amounts to an overall infrastructure investment need of about $750 billion per year during this period.
Appropriate infrastructure investment to facilitate increased regional infrastructure integration (physical connectivity) would bring Asia large welfare gains, mainly through increased market access, reduced trade costs, and more efficient energy production and use. The required investments in the region’s transport, telecommunications, and energy infrastructure would generate net real income gains of about $13 trillion during 2010–2020 and beyond. Economies that
69 This list must be used with caution. It was compiled from a variety of sources, some much more detailed and rigorous than others, and includes proposals at various stages of definition, preparation, review, and vetting.
202
Infrastructure for a Seamless Asia
trade more and those that have the biggest unmet infrastructure needs would gain most.
Of the identified 1,077 regional projects, Asia should prioritize 21 high-priority “flagship” infrastructure projects, which could be implemented by 2015 at a cost of $15 billion. These consist of 10 projects in the GMS (five in transport and five in energy), six in Central Asia (four transport corridors and two energy projects), and five in South Asia (two in energy and one each in transport, telecommunications, and tourism). The successful implementation of these priority projects and their wider regional benefits could create a strong impetus towards further strengthening regional infrastructure networks.
As this study goes to press, the global financial turmoil and resulting economic downturn are still unfolding. If the current crisis is prolonged, demand from advanced economies will remain stagnant and thus depress Asia’s exports and production. However, the crisis does not alter the broad thrust of this study—on the contrary, it gives added weight to it. The lessons of the Asian financial crisis of 1997–1998 are clear: cuts in infrastructure investment that jeopardize future recovery should be avoided. Some economies, such as the PRC and Republic of Korea, have already adopted fiscal stimulus packages that accelerate and increase infrastructure investment. Wherever possible, other governments should undertake similar measures. While an economic downturn may reduce some of the increasing pressure on overburdened existing infrastructure, it does not obviate the need for upgrading and extending the network over the time frame of this study (i.e.,2010–2020).
Traditionally, Asian countries have prioritized export markets outside the region, especially in the US and Europe, and their infrastructure reflects this. But the prospect of a prolonged downturn in those major markets underscores the need for a rebalancing of Asia’s economies towards demand within the region. It is in Asia’s interests—and the world’s—that the region direct more of its energies towards satisfying local needs. This requires many policy changes, not least of which includes prioritizing improvements in connectivity within the region.

Toward a Seamless Asia
203
In the long term, the full benefits of Asia’s size and diversity can be realized only by creating a single Asian market where goods and services can move freely and seamlessly. Moving towards that long-term vision requires world class and environment-friendly pan-Asian infrastructure networks—with open connections to regional and global markets, driven by political leadership as well as economic logic; built up from national, bilateral, and subregional programs; and guided and supported by broad-based and effective regional institutions that ensure their proper development and financing.
A Framework for Regional 6.1. Infrastructure Cooperation
A pan-Asian approach to infrastructure development may initially be difficult. Progress in developing existing pan-Asian initiatives, such as the AH and the TAR, has been limited. At the subregional level, some groupings, such as the GMS, cooperate more closely than others. Connections between subregions—notably between South and East Asia—are particularly weak.
Improved pan-Asian connectivity in transport and energy can be achieved through a variety of channels such as:
developing national infrastructure that connects remote and inland areas—particularly in large countries—to the country’s economic centers and coastal areas, thus linking them to the rest of Asia and the world; developing regional infrastructure that enhances national connectivity—for example, connecting India’s landlocked northeastern region to the nearest port and economic center (Kolkata) through Bangladesh; connecting two neighboring countries to form a two-country hub or corridor;connecting several countries in a subregion to form a regional hub, corridor, or market; and creating connections among subregions.
204
Infrastructure for a Seamless Asia
In view of Asia’s varied needs and circumstances—and varying political commitment to closer integration—national and subregional programs proceeding at different speeds and on different tracks offer the best way forward for now. But the many overlaps among existing subregional programs can help build connectivity across subregions, such as Central Asia, South Asia, and Southeast Asia.70
Until now, Asia has followed a largely bottom-up and market-driven approach to infrastructure development. But it now needs to complement this with a more top-down, market-expanding, and demand-inducing approach geared toward a seamless Asia. This involves:
building world-class, interconnected, environment-friendly regional transport networks of road, rail, waterway, sea, and air links that promote trade and investment within the region and with global markets, and widen access to markets and public services;developing greener cross-border energy projects that allow countries to benefit from their natural endowments, and that provide efficient and secure supplies of electricity, coal, gas, oil, and alternative energies;expanding, deepening, and increasing the efficiency of regional production networks and supply chains by streamlining policies, systems, and procedures, such as customs procedures and other bureaucratic impediments that hamper regional and global connectivity; anddeveloping stable and efficient national and regional financial markets that channel savings from around Asia and the rest of the world into productive investments, notably infrastructure, throughout the region.
Creating a seamless Asia would have many benefits such as:increasing trade, investment, and economic integration in Asia;
70 For example, BIMSTEC could link SASEC and SAARC to the GMS and ASEAN; SECSCA could connect South and Central Asia; IMT-GT corridors could be connected to India; the GMS’s northern road and rail corridors could connect the PRC to India through Myanmar; and the GMS’s western corridors could connect India, Malaysia, and Thailand.

Toward a Seamless Asia
205
promoting inclusive and environmentally sustainable economic growth; reducing costs and delivering environmental benefits (e.g., lower energy costs, local pollutants and greenhouse gas emissions);shifting to low-carbon, greener infrastructure such as renewable energy, railways, waterways, and road transport by deploying more fuel-efficient vehicles and cleaner fuels;reducing poverty and helping to provide for people’s basic needs, widening access to economic opportunities, and improving people’s quality of life as an essential complement to national development strategies;enhancing the region’s international competitiveness through stronger regional production systems and reducing logistics and transport cost;narrowing the development gap within Asia by improving the connectivity and competitiveness of poorer countries (particularly small, landlocked, and archipelagic ones);promoting greater trade within Asia to replace lower export demand from global markets, and to help rebalance sources of growth in the medium term; andultimately, creating a vast single Asian market that can provide large efficiency gains, increase regional demand, and invest Asia’s savings more productively.
A framework for regional infrastructure cooperation towards a seamless Asia is presented in Figure 6.1.
Achieving a seamless Asia requires:a common vision; strong leadership and a shared commitment from Asian leaders, as well as strong partnerships and institutional capacities within and across countries; common pan-Asian infrastructure strategies in which infrastructure investment is prioritized, as well as coordinated policies in sectors such as transport and energy;institutional arrangements for planning and implementing consistent infrastructure plans at the national, subregional, and
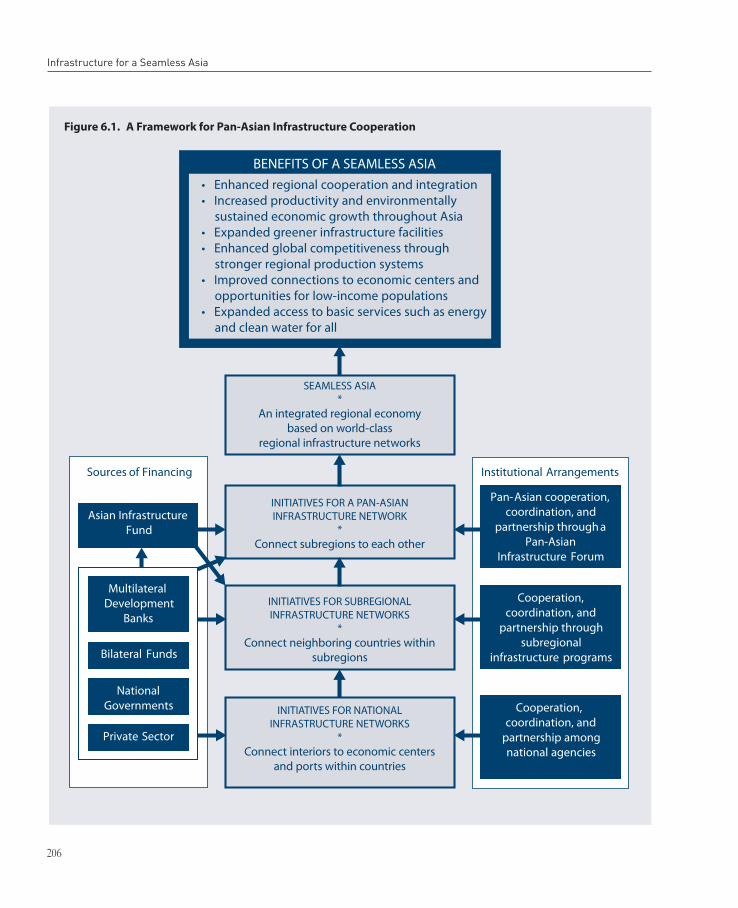
206
Infrastructure for a Seamless Asia
Figure 6.1. A Framework for Pan-Asian Infrastructure Cooperation
Sources of Financing
Institutional Arrangements
Pan-Asian cooperation, coordination, and
partnership through a Pan-Asian
Infrastructure Forum
Cooperation, coordination, and
partnership through subregional
infrastructure programs
Cooperation, coordination, and
partnership among national agencies
Asian Infrastructure Fund
Bilateral Funds
Private Sector
BENEFITS OF A SEAMLESS ASIA
Multilateral Development
Banks
National Governments
sustained economic growth throughout Asia
opportunities for low-income populations
and clean water for all
SEAMLESS ASIA*
based on world-classregional infrastructure networks
INITIATIVES FOR A PAN-ASIAN INFRASTRUCTURE NETWORK
*Connect subregions to each other
INITIATIVES FOR SUBREGIONAL INFRASTRUCTURE NETWORKS
*Connect neighboring countries within
subregions
INITIATIVES FOR NATIONAL INFRASTRUCTURE NETWORKS
*Connect interiors to economic centers
and ports within countries

Toward a Seamless Asia
207
regional levels through effective coordination, cooperation, and partnership;effective planning and implementation of regional infrastructure projects through good policies and institutions that address the asymmetric distribution of projects’ costs and benefits and manage negative socioeconomic impacts across countries so as to ensure win-win outcomes among participating countries; andeffective financing instruments, as well as conducive policies and regulations that complement public sector financing, help to mobilize the region’s vast savings, and encourage PPPs.
Main Findings and Recommendations 6.2.
This study has developed four main themes: supporting regional trade and investment (Chapter 2), harnessing the benefits of regional infrastructure (Chapter 3), developing effective policies and institutions (Chapter 4), and financing regional infrastructure (Chapter 5). This section highlights its main findings and recommendations.
Supporting Regional Trade and Investment
Asia’s trade-related infrastructure has greatly improved, but it must continue to do so in order to sustain economic growth and regional integration. Where infrastructure connections are good, Asia’s trade has expanded rapidly (at least it had until the current crisis). Trade within East Asia has risen particularly fast. But where infrastructure connections are poor, such as within South Asia and among Asian subregions, trade remains low.
Infrastructure gaps—a lack of connections between national electricity grids and gas pipelines, and a failure to harness common energy resources, such as rivers with hydroelectric potential—also hamper regional energy trade. Greater regional energy trade would reduce costs, increase the diversity of supplies, enhance energy security, and often benefit the environment as well.

208
Infrastructure for a Seamless Asia
As Asian economies have liberalized their trade policies, infrastructure deficiencies have become an increasingly significant impediment to trade. Infrastructure improvements would do more to lower the cost, and hence increase the volume, of trade in Asia than would eliminating the remaining tariffs and nontariff barriers.
Asia’s traded goods are transported mainly by sea. But as traded content shifts from bulky goods toward lighter, often higher value products, goods are increasingly sent by air. Relatively few goods go long distances by road or rail, as demonstrated by the fact that trade among Asian countries that share a land border is much lower than elsewhere in the world. Improving rail and road connections to efficient ports is particularly important for inland areas and landlocked countries, as they tend to encounter high trade costs.
Exports are diversifying across new markets with smaller flows, and intraregional trade in parts and components for regional production networks accounts for a growing share of total trade. As production becomes increasingly fragmented and traded internationally, the competitiveness of each economy in a regional production network depends on the other economies in the production network; all the economies in a network, therefore, have an incentive to cooperate in order to enhance each country’s competitiveness. However, if the current crisis is prolonged, demand from advanced economies for Asian exports will decelerate and, therefore, trade outside the region may not be a driving force for economic growth in the immediate future. To mitigate the medium-term consequences of the ongoing crisis, Asia will need to put greater emphasis on increasing regional demand through expanding intraregional trade. Enhancing competitiveness and extending it beyond the coastal regions of Asia where it is currently concentrated is thus vital to Asia’s future success.
These trends underscore the need for efficient and cost-effective logistics networks that combine speed, flexibility, and timely information, thus providing uncomplicated connections. As well as boosting countries’ export competitiveness, these would attract and facilitate greater investment in productive capacity, increase

Toward a Seamless Asia
209
employment opportunities for the poor, and broaden consumer choice for billions of Asia’s citizens.
Harmonizing and strengthening soft infrastructure is an essential complement of enhanced physical infrastructure, as is cooperation on trade facilitation. The sequencing and complementarity of investments are also important. Where physical transport infrastructure already exists, complementary soft infrastructure, such as customs harmonization, may be relatively more important than further physical investment.
Harnessing the Benefits of Regional Infrastructure
Evidence of the economic benefits of infrastructure investment in general is overwhelming. The marginal productivity of telecommunications, transport, and power infrastructure significantly exceeds that of non-infrastructure capital. Several broad studies of developing Asian countries echo international findings that better infrastructure—especially road transport and electricity—significantly reduces poverty.
Regional infrastructure can be expected to have many of the same benefits as domestic connective infrastructure, not least since much national infrastructure has a regional impact. Connective infrastructure expands and links markets together, enabling firms to reap economies of scale, permitting greater specialization in production, and allowing a finer division of labor. Areas of dense economic interaction also bring improved learning opportunities and greater knowledge spillovers. Creating and improving regional infrastructure networks can thus boost an economy’s rate of innovation and technological advancement, increasing long-term growth. But as a public good, infrastructure is often undersupplied, especially when it involves more than one country. Regional governments would therefore benefit from working together to produce it. Such collective action would tackle the free-rider problem and produce gains that cannot be reaped by acting alone.

210
Infrastructure for a Seamless Asia
Studies on the impact of regional infrastructure are scarce, and measuring the broader benefits of connecting national infrastructure networks is particularly complex. But careful economic modeling shows that the benefits of cross-border infrastructure projects are large. Benefits tend to be widely distributed, and often help the poor most. Case studies in Central Asia, the GMS, and South Asia show that the benefits of subregional infrastructure projects greatly exceed their costs. As discussed earlier, the benefits of an energy project in Central Asia were found to exceed its costs by a factor of three, as were those of a transport project in South Asia. The benefits of the GMS transport network exceed its costs by 50%.
The case studies find that poverty declines substantially in each country in the respective subregions, with a significant part of the poverty reduction occurring in the rural sector. Evidence in the GMS shows that, while the PRC and Thailand tend to make the largest absolute welfare gains, Cambodia and the Lao PDR gain most relative to the size of their economies.
But while regional infrastructure projects can bring big economic gains, they may also have negative impacts. Some people may experience negative effects. People may be displaced from their land. Traffic accidents may increase. Human and drug trafficking, and the incidence of communicable diseases also may rise. Perhaps most importantly, infrastructure can cause local and global environmental damage. Efforts to make transport and energy investments more environmentally friendly and, in particular, to mitigate impacts on climate change, have to be accompanied with many infrastructure projects.
Developing Effective Policies and Institutions
Without effective policies and institutions, cooperation on regional infrastructure is likely to be haphazard, limited, sporadic, and ultimately ineffective. Asia can learn from the experience of its own subregional programs as well as from other regions, notably Europe and Latin America. While the lessons from other regions could be

Toward a Seamless Asia
211
useful, ultimately, Asia must craft policies and institutions that are appropriate for its own needs and circumstances.
The EU’s experience shows that creating a framework for regional infrastructure cooperation often requires the active role of a third party, an honest broker, to forge the convergence of interests. In Asia, this role could be filled by multilateral institutions such as ADB and UNESCAP, among others. These organizations could appoint coordinators from among top-level decision-makers in the region.
Latin America’s experience shows that a forum for dialogue and cooperation can help build awareness of the benefits of regional integration and infrastructure, filter out unproductive projects, coordinate among various national and subnational agencies, and increase stakeholders’ participation.
In the medium-term, the ongoing global economic crisis is likely to lead to a structural shift in Asian economies, away from exporting to advanced economies and toward satisfying rapidly growing demand within the region. This underscores the need for a pan-Asian platform to plan and coordinate the investments in regional infrastructure needed to facilitate this adjustment.
This study therefore has proposed that a PAIF be established to help coordinate and integrate existing subregional infrastructure initiatives toward a seamless Asia. It would bring together all the key stakeholders in the region, to help build consensus about, prioritize, and coordinate regional infrastructure plans. It could also develop harmonized standards, based on international best practices where possible, for regulatory and legal issues, as well as a common framework for handling and mitigating negative social and environmental impacts. Within the PAIF, sectoral subforums could also be established—for transport and energy, for instance—as well as subforums for soft aspects of infrastructure matters, such as regulatory and legal issues.

212
Infrastructure for a Seamless Asia
Financing Regional Infrastructure
Financing infrastructure projects is challenging for many reasons—and regional ones involve additional complexities. As a result, developing and financing regional projects is a slow and complicated process, even in the EU. Political leadership from the highest level is necessary but not sufficient, as Latin American experience demonstrates. Regional projects are usually a low priority for domestic policymakers responsible for allocating budgets and requesting assistance from multilateral institutions. Also, these types of projects often involve constructing infrastructure segments in parts of a country with little economic activity and few advocacy groups. Concessionary financing from external sources is therefore sometimes necessary to make a project more economically and financially viable.
Attracting private sector investment in regional projects is particularly difficult because of the additional risks and uncertainties involved. Given the turmoil in global financial markets, it is unrealistic to assume that many cross-border projects in Asia will involve PPPs in the near term, although PPPs may play a bigger role in the future if the substantial challenges involved with their use can be overcome.
The region’s vast domestic savings, including those accumulated in SWFs, would be the main source of financing for Asia’s massive infrastructure investment requirements. Due to the turmoil in global financial markets, the public sector will necessarily continue to play a dominant role, with spending from government budgets supplemented by funds channeled through domestic and regional financial markets.
Asian governments must bolster their collective work to mobilize a large pool of regional savings for regional infrastructure investments. If such “bankable” regional projects are created, then private financing involving PPPs could be obtained. Strengthening national and regional bond markets—notably through vehicles such as the ABMI and ABF— is one of the first steps in creating a viable source of infrastructure financing to tap Asia’s vast savings. Effective financing instruments and policies and regulations that help mobilize the region’s vast savings and encourage PPPs are also needed.

Toward a Seamless Asia
213
This study has proposed that an AIF is needed to help mobilize Asian and global funds, and to prepare and finance “bankable” regional infrastructure projects. The AIF’s capital could come from a variety of sources, including governments, MDBs, bilateral agencies, and SWFs. It should have a legal identity so as to help finance projects through its own resources as well as by issuing bonds or through cofinancing with other entities, including national governments, private investors, and international financial institutions.
The AIF would help finance projects identified, agreed upon, and prioritized by the PAIF. Its project preparation facility would expedite and help finance the preparation of formally agreed upon regional projects. It could also provide grants and concessional financing in order to make regional projects financially viable and bankable. It might also need to provide guarantees against major risks, such as operational, financial, country, and political risks.
The Way Forward 6.3.
The road to a seamless Asia is long and arduous. This study has hopefully helped to chart the route ahead, to set out some of the obstacles and how to bypass or overcome them, and to warn against detours and false turns. Its message is clear: in these uncertain times, Asia should not pause or turn back, but rather press ahead with the challenging—and immensely rewarding—task of integrating this vast and diverse region for the benefit of all its citizens. Building bridges, highways, railways, transmission lines, and pipelines across the region should be a priority for the region’s policymakers. It will help to boost growth and spread its benefits more widely. It will enhance the region’s competitiveness and extend its global reach. It will help reduce poverty and promote greater environmental sustainability. But it is possible only with political leadership commitment and partnership at the highest level. It is time to start moving towards a seamless Asia now.

Appendix

Appendix
216
Infrastructure for a Seamless Asia
Table A1.1. GDP Growth, 2004–2010 (percentage per year)
Chapter 1
Subregion/Economy 2004 2005 2006 2007 2008 2009a 2010b
Central Asia 9.4 11.5 13.3 12.0 5.7 3.9 4.8
Armenia 10.5 13.9 13.2 13.8 6.8 0.5 3.0
Azerbaijan 9.3 28.0 34.5 25.4 10.8 8.0 6.7
Georgia 5.9 9.4 9.2 12.4 2.0 2.5 6.0
Kazakhstan 9.6 9.7 10.7 8.9 3.2 2.0 3.3
Kyrgyz Republic 7.0 -0.2 3.1 8.5 7.6 4.0 6.0
Tajikistan 10.6 6.7 7.0 7.8 7.9 3.0 4.0
Turkmenistan 14.7 13.0 11.4 11.6 10.5 10.0 10.0
Uzbekistan 7.7 7.0 7.2 9.5 8.5 7.0 6.5
East Asia (including Japan) 4.1 4.9 5.1 6.2 4.5 2.4 3.9
East Asia (excluding Japan) 8.4 8.3 9.4 10.4 6.6 3.6 6.5
China, People’s Rep. of 10.1 10.4 11.6 13.0 9.0 7.0 8.0
Hong Kong, China 8.5 7.1 7.0 6.4 2.5 -2.0 3.0
Japan 1.4 2.7 1.9 2.4 2.1 0.7 0.5
Korea, Rep. of 4.7 4.2 5.1 5.0 2.5 -3.0 4.0
Mongolia 10.6 7.3 8.6 10.2 8.9 3.0 4.5
Taipei,China 6.2 4.2 4.8 5.7 0.1 -4.0 2.4
South Asia 7.3 9.1 9.0 8.6 6.8 4.8 6.1
Afghanistan 8.0 16.1 8.2 12.1 3.4 9.0 7.5
Bangladesh 6.3 6.0 6.6 6.4 6.2 5.6 5.2
Bhutan 7.0 6.6 6.4 14.1 11.5 5.5 6.5
India 7.5 9.5 9.7 9.0 7.1 5.0 6.5
Maldives 9.5 -4.6 18.0 7.2 5.7 1.0 1.5
Nepal 4.4 3.2 3.7 2.7 5.3 3.0 3.5
Pakistan 7.5 9.0 5.8 6.8 5.8 2.8 4.0
Sri Lanka 5.4 6.2 7.7 6.8 6.0 4.5 6.0

Appendix
217
GDP = gross domestic product; Lao PDR = Lao People’s Democratic Republic.– data not available.Notes: a estimate. b projected. Sources: ADB (2009) and International Monetary Fund (2008).
Subregion/Economy 2004 2005 2006 2007 2008 2009a 2010b
Southeast Asia 6.5 5.7 6.0 6.4 4.3 0.7 4.2
Brunei Darussalam 0.5 0.4 4.4 0.6 -2.7 -0.4 2.3
Cambodia 10.3 13.3 10.8 10.2 6.5 2.5 4.0
Indonesia 5.0 5.7 5.5 6.3 6.1 3.6 5.0
Lao PDR 7.0 6.8 8.3 7.8 7.2 5.5 5.7
Malaysia 6.8 5.3 5.8 6.3 4.6 -0.2 4.4
Myanmar 13.6 13.6 13.1 11.9 – – –
Philippines 6.4 5.0 5.4 7.2 4.6 2.5 3.5
Singapore 9.3 7.3 8.4 7.8 1.1 -5.0 3.5
Thailand 6.3 4.6 5.2 4.9 2.6 -2.0 3.0
Viet Nam 7.8 8.4 8.2 8.5 6.2 4.5 6.5
The Pacific 3.8 2.9 2.0 2.8 5.1 3.0 2.7
Cook Islands 4.3 0.0 0.7 1.3 1.1 1.0 0.8
Fiji Islands 5.5 0.6 3.4 -6.6 1.2 -0.5 0.2
Kiribati -1.7 1.6 -5.2 0.5 0.6 1.0 0.9
Marshall Islands, Rep. of 6.7 2.0 0.9 1.3 1.5 0.5 0.8
Micronesia, Fed. States of -3.3 -0.6 -2.3 -3.1 -1.0 -0.1 0.8
Nauru – -14.5 6.3 -27.3 1.0 1.5 1.5
Palau, Rep. of 6.0 5.9 4.8 2.1 -1.0 -2.0 -0.2
Papua New Guinea 2.7 3.6 2.6 6.5 7.2 4.0 3.5
Samoa 3.3 4.0 1.9 5.5 0.3 -1.0 -0.1
Solomon Islands 8.0 5.0 6.1 10.3 6.4 2.2 1.7
Timor-Leste, Dem. Rep. 4.1 6.2 -5.8 8.0 10.0 10.0 8.0
Tonga 1.4 2.3 0.8 -3.5 1.2 -2.0 -0.6
Tuvalu 4.0 2.0 1.0 2.0 1.5 1.0 0.9
Vanuatu 5.5 6.5 7.2 6.8 6.3 3.5 0.8
Average (including Japan) 4.6 5.4 5.7 6.6 4.8 2.5 4.2
Average (excluding Japan) 7.9 8.1 8.9 9.5 6.3 3.4 6.0

218
Infrastructure for a Seamless Asia
Table A1.2. Population and Population Density, 2007–2020
Subregion/EconomyArea (km2)
(in 1,000)
2007 2008 2015 2020
Population
(in million)Density
Population
(in million)Density
Population
(in million)Density
Population
(in million)Density
Central Asia 4,189.5 75.6 18.0 76.2 18.0 81.0 19.0 84.4 20.0
Armenia 29.8 3.0 100.0 3.0 100.0 3.0 100.0 3.0 101.0
Azerbaijan 86.6 8.1 94.0 8.2 94.0 8.7 100.0 9.1 105.0
Georgia 69.7 4.7 67.0 4.6 66.0 4.5 65.0 4.4 64.0
Kazakhstan 2,724.9 15.3 6.0 15.3 6.0 15.8 6.0 16.0 6.0
Kyrgyz Republic 199.9 5.3 26.0 5.4 27.0 5.9 30.0 6.3 32.0
Tajikistan 143.1 7.1 49.0 7.2 50.0 8.2 57.0 8.9 62.0
Turkmenistan 488.1 5.1 10.0 5.2 11.0 5.8 12.0 6.2 13.0
Uzbekistan 447.4 27.1 61.0 27.4 61.0 29.2 65.0 30.6 68.0
East Asia 11,662.2 1,530.3 131.2 1,538.7 131.9 1,602.1 137.4 1,637.7 140.4
China, People’s Rep. of 9,597.0 1,321.9 138.0 1,330.0 139.0 1,393.4 145.0 1,430.5 149.0
Hong Kong, China 1.1 7.0 6,352.0 7.0 6,386.0 7.2 6,584.0 7.3 6,668.0
Korea, Rep. of 99.5 48.3 485.0 48.4 486.0 49.1 493.0 49.4 496.0
Mongolia 1,564.1 3.0 2.0 3.0 2.0 3.3 2.0 3.5 2.0
Taipei,China 36.0 22.9 635.0 22.9 637.0 23.2 645.0 23.3 647.0
Japan 364.5 127.4 349.5 127.3 349.2 125.8 345.1 123.7 339.3
South Asia 5,139.5 1,532.4 298.0 1,558.8 303.0 1,741.9 339.0 1,870.7 364.0
Afghanistan 652.1 31.9 49.0 32.7 50.0 39.3 60.0 44.6 68.0
Bangladesh 144.0 150.5 1,045.0 153.6 1,066.0 175.1 1,216.0 189.9 1,319.0
Bhutan 47.0 0.7 14.0 0.7 15.0 0.7 16.0 0.8 17.0
India 3,287.3 1,129.9 344.0 1,148.0 349.0 1,273.6 387.0 1,362.1 414.0
Maldives 0.3 0.4 1,225.0 0.4 1,295.0 0.4 1,320.0 0.4 1,315.0
Nepal 147.2 28.9 196.0 29.5 201.0 33.9 230.0 36.9 251.0
Pakistan 796.1 169.3 213.0 172.8 217.0 196.6 247.0 213.0 268.0
Sri Lanka 65.6 20.9 319.0 21.1 322.0 22.4 341.0 23.1 352.0
Southeast Asia 4,456.3 576.5 129.0 583.7 131.0 633.1 142.0 672.0 151.0
Cambodia 181.0 14.0 77.0 14.2 79.0 16.2 89.0 23.1 128.0
Indonesia 1,904.6 234.7 123.0 237.5 125.0 255.8 134.0 267.5 140.0
Lao PDR 236.8 6.5 28.0 6.7 28.0 7.8 33.0 8.6 36.0
Malaysia 329.9 24.8 75.0 25.3 77.0 28.4 86.0 30.8 93.0
Myanmar 676.6 47.4 70.0 47.8 71.0 50.3 74.0 51.8 77.0
Philippines 282.0 94.2 334.0 96.1 341.0 109.6 389.0 119.3 423.0

Appendix
219
km2 = square kilometer; Lao PDR = Lao People’s Democratic Republic.Note: Population density = population (in million)/area (in km2).Source: United Nations (2008).
Subregion/EconomyArea (km2)
(in 1,000)
2007 2008 2015 2020
Population
(in million)Density
Population
(in million)Density
Population
(in million)Density
Population
(in million)Density
Singapore 0.7 4.6 6,439.0 4.6 6,517.0 4.9 6,903.0 5.0 7,093.0
Thailand 513.1 65.1 127.0 65.5 128.0 68.1 133.0 69.5 135.0
Viet Nam 331.7 85.3 257.0 86.1 260.0 92.1 278.0 96.3 290.0
The Pacific 543.0 9.3 17.0 9.5 17.0 10.8 20.0 11.7 22.0
Cook Islands 0.2 0.0 54.0 0.0 52.0 0.0 42.0 0.0 36.0
Fiji Islands 18.3 0.9 50.0 0.9 51.0 1.0 56.0 1.1 60.0
Kiribati 0.7 0.1 149.0 0.1 152.0 0.1 177.0 0.1 197.0
Marshall Islands, Rep. of 0.2 0.1 342.0 0.1 349.0 0.1 399.0 0.1 430.0
Micronesia, Fed. States of 0.7 0.1 154.0 0.1 153.0 0.1 150.0 0.1 146.0
Nauru 0.0 0.0 644.0 0.0 656.0 0.0 738.0 0.0 796.0
Palau, Rep. of 0.5 0.0 45.0 0.0 46.0 0.0 49.0 0.0 51.0
Papua New Guinea 462.8 5.8 13.0 5.9 13.0 6.8 15.0 7.4 16.0
Samoa 2.8 0.2 76.0 0.2 77.0 0.2 85.0 0.3 91.0
Solomon Islands 28.9 0.6 20.0 0.6 20.0 0.7 24.0 0.8 26.0
Timor-leste, Dem. Rep. 14.9 1.1 73.0 1.1 75.0 1.3 86.0 1.4 93.0
Tonga 0.8 0.1 157.0 0.1 159.0 0.1 176.0 0.1 189.0
Tuvalu 0.0 0.0 461.0 0.0 468.0 0.0 525.0 0.0 568.0
Vanuatu 12.2 0.2 17.0 0.2 18.0 0.2 19.0 0.3 21.0
Developing Asia 25,626.1 3,597.0 140.0 3,640.0 142.0 3,943.0 154.0 4,153.0 162.0
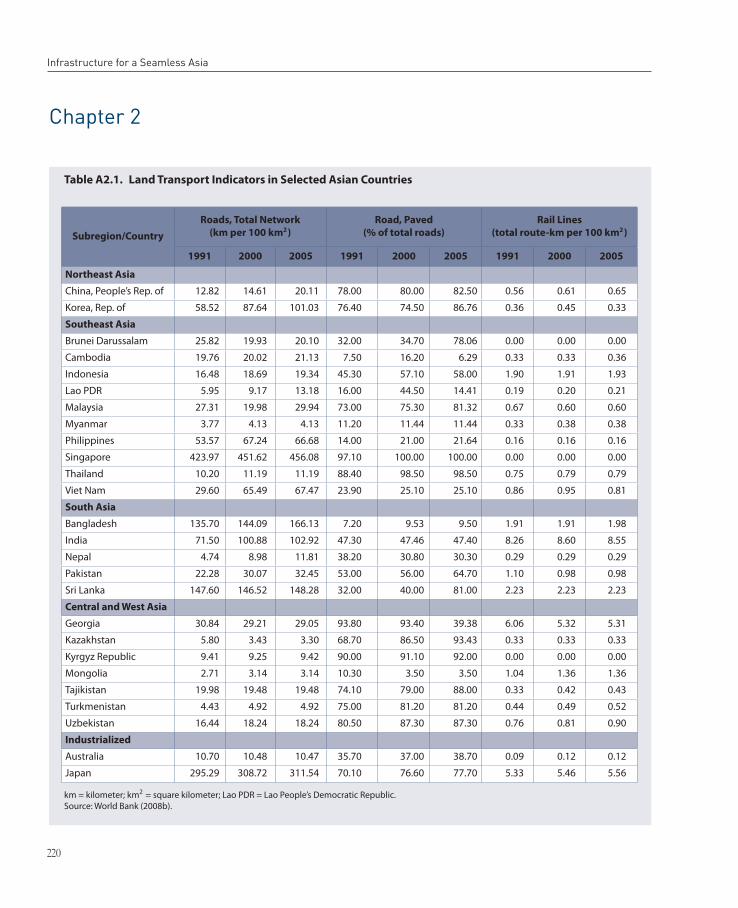
220
Infrastructure for a Seamless Asia
Table A2.1. Land Transport Indicators in Selected Asian Countries
km = kilometer; km2 = square kilometer; Lao PDR = Lao People’s Democratic Republic.Source: World Bank (2008b).
Chapter 2
Subregion/Country
Roads, Total Network
(km per 100 km2)
Road, Paved
(% of total roads)
Rail Lines
(total route-km per 100 km2)
1991 2000 2005 1991 2000 2005 1991 2000 2005
Northeast Asia
China, People’s Rep. of 12.82 14.61 20.11 78.00 80.00 82.50 0.56 0.61 0.65
Korea, Rep. of 58.52 87.64 101.03 76.40 74.50 86.76 0.36 0.45 0.33
Southeast Asia
Brunei Darussalam 25.82 19.93 20.10 32.00 34.70 78.06 0.00 0.00 0.00
Cambodia 19.76 20.02 21.13 7.50 16.20 6.29 0.33 0.33 0.36
Indonesia 16.48 18.69 19.34 45.30 57.10 58.00 1.90 1.91 1.93
Lao PDR 5.95 9.17 13.18 16.00 44.50 14.41 0.19 0.20 0.21
Malaysia 27.31 19.98 29.94 73.00 75.30 81.32 0.67 0.60 0.60
Myanmar 3.77 4.13 4.13 11.20 11.44 11.44 0.33 0.38 0.38
Philippines 53.57 67.24 66.68 14.00 21.00 21.64 0.16 0.16 0.16
Singapore 423.97 451.62 456.08 97.10 100.00 100.00 0.00 0.00 0.00
Thailand 10.20 11.19 11.19 88.40 98.50 98.50 0.75 0.79 0.79
Viet Nam 29.60 65.49 67.47 23.90 25.10 25.10 0.86 0.95 0.81
South Asia
Bangladesh 135.70 144.09 166.13 7.20 9.53 9.50 1.91 1.91 1.98
India 71.50 100.88 102.92 47.30 47.46 47.40 8.26 8.60 8.55
Nepal 4.74 8.98 11.81 38.20 30.80 30.30 0.29 0.29 0.29
Pakistan 22.28 30.07 32.45 53.00 56.00 64.70 1.10 0.98 0.98
Sri Lanka 147.60 146.52 148.28 32.00 40.00 81.00 2.23 2.23 2.23
Central and West Asia
Georgia 30.84 29.21 29.05 93.80 93.40 39.38 6.06 5.32 5.31
Kazakhstan 5.80 3.43 3.30 68.70 86.50 93.43 0.33 0.33 0.33
Kyrgyz Republic 9.41 9.25 9.42 90.00 91.10 92.00 0.00 0.00 0.00
Mongolia 2.71 3.14 3.14 10.30 3.50 3.50 1.04 1.36 1.36
Tajikistan 19.98 19.48 19.48 74.10 79.00 88.00 0.33 0.42 0.43
Turkmenistan 4.43 4.92 4.92 75.00 81.20 81.20 0.44 0.49 0.52
Uzbekistan 16.44 18.24 18.24 80.50 87.30 87.30 0.76 0.81 0.90
Industrialized
Australia 10.70 10.48 10.47 35.70 37.00 38.70 0.09 0.12 0.12
Japan 295.29 308.72 311.54 70.10 76.60 77.70 5.33 5.46 5.56

Appendix
221
Table A2.2. Air Transport Indicators in Selected Asian Countries
km = kilometer; km2 = square kilometer; Lao PDR = Lao People’s Democratic Republic.Source: World Bank (2008b).
Subregion/Country
Air Transport, Freight
(million tons per km)
Air Transport, Passengers Carried
(per 1000 population)
1991 2000 2005 2006 1991 2000 2005 2006
Northeast Asia
China, People’s Rep. of 1,009.5 3,900.1 7,579.4 7,692.2 17.0 49.0 104.8 120.5
Korea, Rep. of 2,597.0 7,651.3 7,432.6 7,751.7 390.8 730.3 701.7 719.6
Southeast Asia
Brunei Darussalam 22.0 140.2 134.1 130.2 1,161.3 2,589.6 2,614.9 2,726.8
Cambodia 0.0 4.1 1.2 1.1 0.5 6.2 12.0 18.0
Indonesia 475.5 408.5 439.8 469.2 57.4 48.1 121.7 133.9
Lao PDR 0.8 1.7 2.5 2.5 27.2 39.9 49.5 56.7
Malaysia 713.6 1,863.8 2,577.6 2,597.4 646.0 720.1 803.6 682.9
Myanmar 1.1 0.8 2.7 2.8 7.7 9.2 29.8 33.5
Philippines 307.6 290.0 322.7 318.9 87.0 76.0 97.0 96.3
Singapore 1,740.8 6,004.9 7,571.3 7,981.3 2,469.9 4,157.7 4,086.8 4,363.6
Thailand 866.2 1,712.9 2,002.4 2,106.9 139.1 283.1 294.3 316.9
Viet Nam 82.9 117.3 230.2 216.0 2.9 36.7 65.6 62.8
South Asia
Bangladesh 99.4 193.9 183.5 190.8 9.6 10.3 11.5 11.1
India 493.1 547.7 773.2 842.6 12.4 17.0 25.2 36.3
Nepal 23.9 17.0 6.9 7.2 32.4 26.3 17.7 18.4
Pakistan 373.3 340.3 407.9 427.0 46.9 38.3 34.4 35.9
Sri Lanka 100.7 255.7 310.4 325.4 51.7 90.7 143.6 155.9
Central and West Asia
Georgia 1.8 2.0 2.8 2.9 12.2 24.9 55.7 61.3
Kazakhstan 32.2 11.8 15.8 16.4 320.8 31.0 76.6 83.8
Kyrgyz Republic 0.7 3.7 2.0 1.2 102.1 49.0 43.9 42.3
Mongolia 1.2 8.4 6.1 6.3 287.5 105.9 115.6 134.6
Tajikistan 2.5 2.7 6.1 12.8 139.6 27.3 73.6 59.4
Turkmenistan 2.3 11.9 10.1 10.5 187.1 285.2 342.1 376.2
Uzbekistan 36.7 79.6 71.6 67.6 188.0 70.8 62.7 62.7
Industrialized
Australia 1,222.6 1,730.7 2,444.6 2,569.5 1,264.8 1,700.9 2,196.7 2,268.1
Japan 5,225.3 8,672.1 8,549.2 8,480.0 635.2 860.1 800.5 805.0

222
Infrastructure for a Seamless Asia
Table A2.3. Global Competitiveness and Infrastructure Quality Index of Asian Economies
GCI = Global Competitiveness Index.– data not available.Notes: a Total number of surveyed countries in the world: 75 (2001–2002) and 134 (2008–2009). b GCI score of 2001–2002 was not available; c Score: 1 = poorly developed and inefficient; 7 = among the best in the world. Sources: World Economic Forum (2001, 2008).
Economy
2001–2002 a 2008–2009a
GCIb Infrastructure GCIb Infrastructure
Rank Rank Scorec Rank Scorec Rank Scorec
Developed and Newly
Industrialized Asia (Average)5.87 5.82
Australia 9 14 6.10 18 5.20 21 5.33
Hong Kong, China 18 8 6.60 11 5.33 5 6.32
Japan 15 15 6.00 9 5.38 11 5.80
Korea, Rep. of 28 27 4.80 13 5.28 15 5.63
Singapore 10 2 6.80 5 5.53 4 6.39
Taipei,China 21 25 4.90 17 5.22 19 5.46
Developing and Emerging Asia
(Average)3.11 3.35
Bangladesh 73 74 2.00 111 3.51 122 2.21
China, People’s Rep. of 47 61 2.90 30 4.70 47 4.22
India 36 66 2.60 50 4.33 72 3.38
Indonesia 55 59 3.00 55 4.25 86 2.95
Malaysia 37 20 5.40 21 5.04 23 5.25
Nepal – – – 126 3.37 132 1.90
Pakistan – – – 101 3.65 85 2.96
Philippines 54 68 2.40 71 4.09 92 2.86
Sri Lanka 57 62 2.90 – – 65 3.60
Thailand 38 30 4.60 34 4.60 29 4.67
Viet Nam 62 71 2.20 70 4.10 93 2.86

Appendix
223
Table A2.4. Primary Energy Consumption in Asia and Other Regionsa (million TOEb)
GJ = giga joule; LPG = liquefied petroleum gas; OECD = Organisation for Economic Co-operation and Development; PRC = People’s Republic of China; TOE = ton of oil equivalent.Notes: a Number in parentheses indicates the percentage in relation of the world total. b For measurement, 1 TOE = 0.93 tons gasoline; 0.99 tons diesel oil; 0.96 tons kerosene; 1.04 tons fuel oil; 0.93 tons LPG; 1.61 tons coal; 6.25 tons bagasse; 2.63 tons fuel wood; 1.35 tons charcoal; 41.84 GJ.Sources: Based on data from “Energy Balances of OECD Countries” and “Energy Balances of Non-OECD Countries” International Energy Agency; forecast figures prepared by the Institute of Electrical Engineering.
Economy/Region
Actual ForecastAnnual Avg. Growth Rate
(%)
1990 2000 2010 20201990–
2000
2000–
2010
2010–
2020
China, People’s Rep. of 673 (40.5) 932 (38.5) 1406 (42.2) 2063 (45.1) 3.3 4.2 3.9
Japan 439 (26.4) 525 (21.7) 543 (16.3) 561 (12.3) 1.8 0.3 0.3
Korea, Rep. of 93 (5.6) 191 (7.9) 262 (7.9) 303 (6.6) 7.5 3.2 1.5
India 187 (11.3) 322 (13.3) 452 (13.6) 684 (15.0) 5.6 3.4 4.2
Indonesia 52 (3.1) 98 (4.1) 144 (4.3) 209 (4.6) 6.5 3.9 3.8
Taipei,China 48 (2.9) 83 (3.4) 110 (3.3) 132 (2.9) 5.6 2.9 1.9
Singapore 13 (0.8) 25 (1.0) 36 (1.1) 48 (1.1) 6.3 4.0 2.9
Malaysia 20 (1.2) 47 (1.9) 74 (2.2) 110 (2.4) 8.7 4.6 4.0
Philippines 18 (1.1) 33 (1.4) 57 (1.7) 96 (2.1) 5.9 5.6 5.5
Thailand 29 (1.7) 58 (2.4) 89 (2.7) 145 (3.2) 7.3 4.4 5.0
Viet Nam 5.8 (0.3) 14 (0.6) 33 (1.0) 54 (1.2) 9.5 8.7 5.2
Hong Kong, China 11 (0.6) 15 (0.6) 18 (0.5) 20 (0.4) 3.8 1.7 1.1
Other Asian countries 71 (4.3) 80 (3.3) 111 (3.3) 144 (3.2) 1.2 3.4 2.6
Asian total 60 (21.2) 2,423 (26.8) 3,335 (30.2) 4,570 (33.6) 3.9 3.2 3.2
North America 2,137 (27.4) 2,555 (28.2) 2,863 (25.9) 3,196 (23.5) 1.8 1.1 1.1
Central and South America 382 (4.9) 526 (5.8) 710 (6.4) 980 (7.2) 3.2 3.0 3.3
OECD Europe 1,624 (20.8) 1,764 (19.5) 1,953 (17.7) 2,116 (15.6) 0.8 1.0 0.8
Non-OECD Europe 1,468 (18.8) 100 (11.1) 1,197 (10.8) 1,385 (10.2) -3.8 1.8 1.5
World total
7,811
(100.0)
9,057
(100.0)
11,053
(100.0)
13,593
(100.0)
1.5
2.0
2.1

224
Infrastructure for a Seamless Asia
Box A3.1. Measuring the Benefits of Infrastructure Projects
A ll infrastructure projects implemented by ADB are subject to rigorous analysis of their economic benefits, along with a thorough study of their environmental and social impacts.
These cost-benefit analyses are carried out using economic internal rates of return (EIRRs) for each country and infrastructure component. EIRRs provide a basis for judging whether a project has a rate of return high enough to justify the investment. For example, the Phnom Penh to Ho Chi Minh City highway project was found to have an EIRR of 24% for the entire project, with the Cambodia component appraised at just over 24% and the Viet Nam component at over 25% (ADB 2007e). This far exceeds the estimated opportunity cost of capital of 12%.
Cost-benefit analyses do a good job of examining the immediate and direct impacts of a project, but they do not consider its wider implications and indirect effects. Over the longer term, these indirect effects on markets and households can be the primary drivers of gains from infrastructure development. But measuring these benefits can be difficult, especially with cross-border projects. It can be hard to find sufficient comparable and appropriate data, and even more difficult to determine the impact of infrastructure from many other factors in a robust and rigorous fashion.
Another shortcoming of project analysis is that it does not explicitly analyze an investment’s detailed distributional impact. Assessing distributional consequences is crucial in cross-border projects. To convince the local population that a project is the best use of limited public funds, each national government has to demonstrate how it benefits, or in some cases disadvantages, each affected population and measure these costs and benefits as thoroughly and accurately as possible.
Global CGE models have many advantages that complement cost-benefit analysis. They can account for a project’s indirect effects, as well as the direct ones usually considered as part of a project cost-benefit
Chapter 3

Appendix
225
analysis. They can also track changes in factor income, allowing for an analysis of changes in household welfare. And they show how benefits from better infrastructure are transmitted through markets: the final equilibrium allocation shows how costs and benefits are distributed across economic agents. This information can help policymakers develop strategies and policies for those who may be disadvantaged by the project.
The CGE studies presented in Section 3.3 have another big benefit: they provide a framework for analyzing the network effects of infrastructure projects and how improvements to infrastructure networks affect the economy as a whole. On a methodological level, the framework can be used to analyze the impact of spatial aggregation on modeling results, an issue that is known to impact outcomes (OECD/International Transport Forum 2008).
These CGE studies also have their shortcomings. Their results are only as good as the model and parameters used. For a variety of reasons, they are likely to underestimate the impact of infrastructure projects. The “comparative static” simulation technique does not capture potential dynamic accumulation effects, whereby some proportion of the income increase may be invested, leading to a multiplier effect. Nor does the competitive model account for scale effects. There could also be internal transport margin effects that a CGE model of this type is unable to capture. More broadly, they do not capture the scope for infrastructure networks to produce a virtuous cycle of increased competition, innovation, and investment that provides a dynamic boost to development.
There are a number of ways to measure the impact of cross-border projects on household welfare. In the first case study, a macro approach is applied, providing cumulative impacts on households in Central Asia. The second examines South Asia, providing evidence of changes in welfare measured in dollar values for the various household groups. The final one measures changes in the poverty headcount in the GMS.
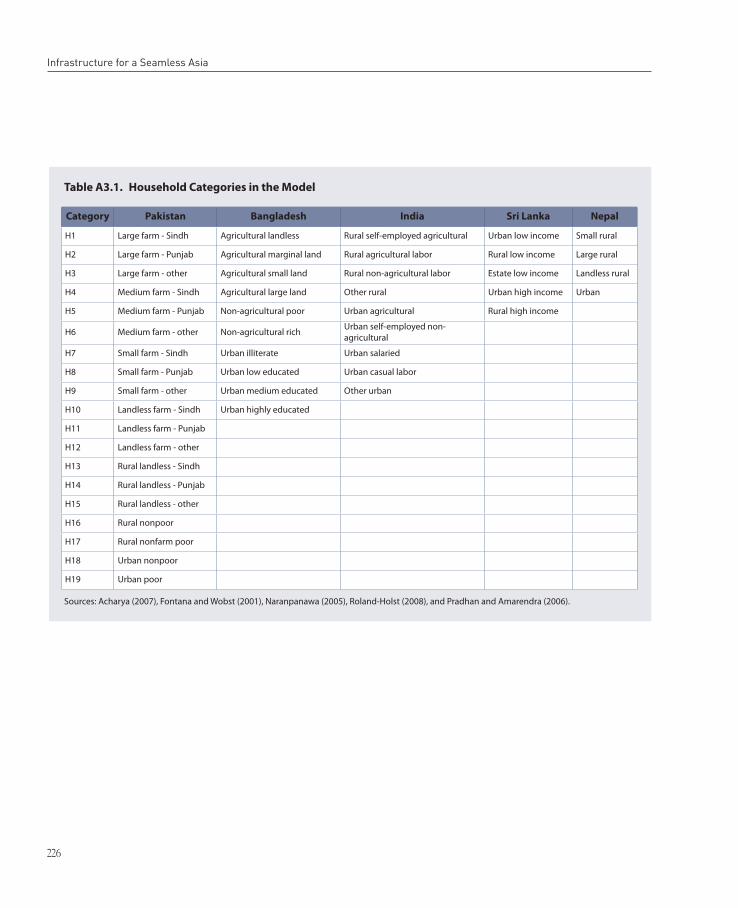
226
Infrastructure for a Seamless Asia
Table A3.1. Household Categories in the Model
Sources: Acharya (2007), Fontana and Wobst (2001), Naranpanawa (2005), Roland-Holst (2008), and Pradhan and Amarendra (2006).
Category Pakistan Bangladesh India Sri Lanka Nepal
H1 Large farm - Sindh Agricultural landless Rural self-employed agricultural Urban low income Small rural
H2 Large farm - Punjab Agricultural marginal land Rural agricultural labor Rural low income Large rural
H3 Large farm - other Agricultural small land Rural non-agricultural labor Estate low income Landless rural
H4 Medium farm - Sindh Agricultural large land Other rural Urban high income Urban
H5 Medium farm - Punjab Non-agricultural poor Urban agricultural Rural high income
H6 Medium farm - other Non-agricultural rich Urban self-employed non-agricultural
H7 Small farm - Sindh Urban illiterate Urban salaried
H8 Small farm - Punjab Urban low educated Urban casual labor
H9 Small farm - other Urban medium educated Other urban
H10 Landless farm - Sindh Urban highly educated
H11 Landless farm - Punjab
H12 Landless farm - other
H13 Rural landless - Sindh
H14 Rural landless - Punjab
H15 Rural landless - other
H16 Rural nonpoor
H17 Rural nonfarm poor
H18 Urban nonpoor
H19 Urban poor
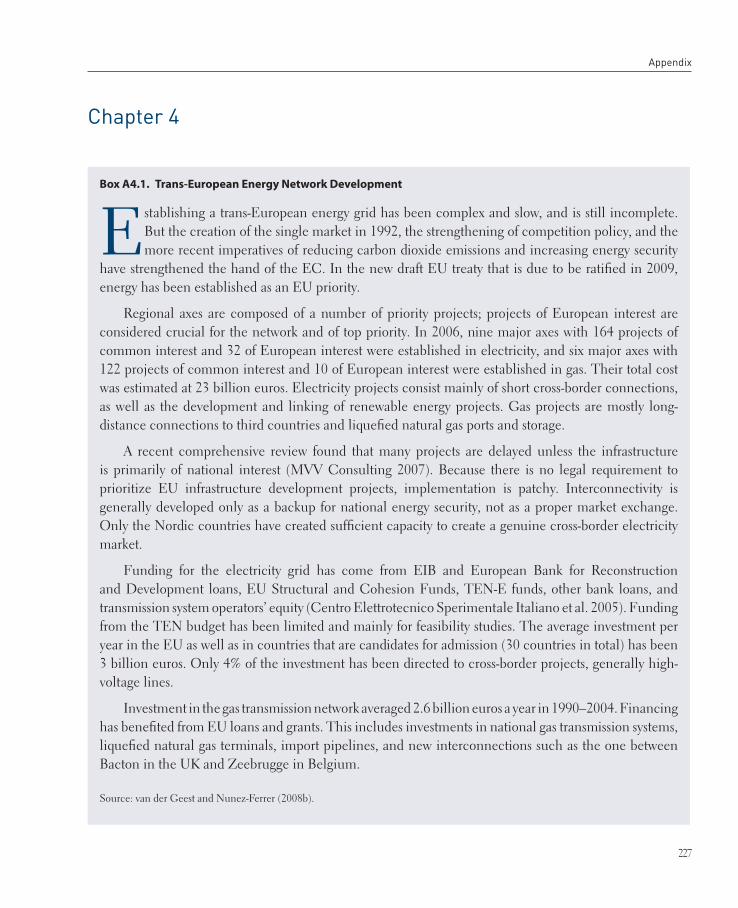
Appendix
227
Chapter 4
Box A4.1. Trans-European Energy Network Development
Establishing a trans-European energy grid has been complex and slow, and is still incomplete. But the creation of the single market in 1992, the strengthening of competition policy, and the more recent imperatives of reducing carbon dioxide emissions and increasing energy security
have strengthened the hand of the EC. In the new draft EU treaty that is due to be ratified in 2009, energy has been established as an EU priority.
Regional axes are composed of a number of priority projects; projects of European interest are considered crucial for the network and of top priority. In 2006, nine major axes with 164 projects of common interest and 32 of European interest were established in electricity, and six major axes with 122 projects of common interest and 10 of European interest were established in gas. Their total cost was estimated at 23 billion euros. Electricity projects consist mainly of short cross-border connections, as well as the development and linking of renewable energy projects. Gas projects are mostly long-distance connections to third countries and liquefied natural gas ports and storage.
A recent comprehensive review found that many projects are delayed unless the infrastructure is primarily of national interest (MVV Consulting 2007). Because there is no legal requirement to prioritize EU infrastructure development projects, implementation is patchy. Interconnectivity is generally developed only as a backup for national energy security, not as a proper market exchange. Only the Nordic countries have created sufficient capacity to create a genuine cross-border electricity market.
Funding for the electricity grid has come from EIB and European Bank for Reconstruction and Development loans, EU Structural and Cohesion Funds, TEN-E funds, other bank loans, and transmission system operators’ equity (Centro Elettrotecnico Sperimentale Italiano et al. 2005). Funding from the TEN budget has been limited and mainly for feasibility studies. The average investment per year in the EU as well as in countries that are candidates for admission (30 countries in total) has been 3 billion euros. Only 4% of the investment has been directed to cross-border projects, generally high-voltage lines.
Investment in the gas transmission network averaged 2.6 billion euros a year in 1990–2004. Financing has benefited from EU loans and grants. This includes investments in national gas transmission systems, liquefied natural gas terminals, import pipelines, and new interconnections such as the one between Bacton in the UK and Zeebrugge in Belgium.
Source: van der Geest and Nunez-Ferrer (2008b).

228
Infrastructure for a Seamless Asia
Box A4.2. Mekong River Commission (MRC)
In 2000, PRC, Lao PDR, Myanmar, and Thailand signed an agreement on commercial navigation for the stretch of water between Simao (PRC) and Luang Prabang (Lao PDR). In
2001, MRC produced a hydropower development strategy that calls for the preservation of water resources and the environment.
MRC members seek to ensure reasonable and equitable use of the Mekong River system by involving national Mekong committees in developing procedures for water use. MRC supports a joint basinwide planning process and is also involved in fisheries management, promotion of safe navigation, irrigated agriculture, watershed management, environment monitoring, flood management, and exploring hydropower options.
MRC is funded by national governments and aid agencies. Formal consultation with the aid community is carried out through an annual Consultative Group meeting. MRC is composed of three permanent bodies: the Council (composed of one minister from each country), the Joint Committee (made up of one department head from each country), and the Secretariat (which provides technical and administrative services).

Appendix
229
Figure A4.1. GMS Institutional Arrangements
ADB = Asian Development Bank; GMS = Greater Mekong Subregion.Source: ADB (2008d).
GMS Summit
ADB
Government
Committee, National
Coordinator
GMS Senior Officials’
Meeting
Sectoral Working
Groups and Forums
GMS
Ministerial Meeting
National Coordinating
Figure A4.2. Institutional Framework of the GMS CBTA
CBTA = Cross-Border Transport Agreement; GMS = Greater Mekong Subregion.Source: ADB (2008d).
GMS Ministers
Joint Committee
Senior Officials of the NationalTransport Facilitation Committees
(NTFCs)
Subcommittees on:
Transport Customs HealthInspection
Immigration

230
Infrastructure for a Seamless Asia
Figure A4.3. CAREC’s Institutional Framework
CAREC = Central Asia Regional Economic Cooperation; HIV/AIDS = human immunodeficiency virus/acquired immunodeficiency syndrome.Source: CAREC (2006).
Knowledge/CapacityBuilding
RegionalInfrastructure
Networks
Trade,Investment, and
BusinessDevelopment
Ministerial Conference
Strategic Management andPriorities Committee
CAREC Unit
Senior Officials’ Meeting
National Focal Points Multilateral Institutions
First Tier: Priority Core Sectors
Transport SectorCoordinationg
Committee
Energy SectorCoordinationg
Committee
CustomsCooperationCommittee
Trade PolicyCoordinationg
Committee
Second Tier: Special Projects
CARECInstitute
HIV/AIDSProgram
Avian FluRegional
Coordination
DisasterManagement
Program/Environment
BusinessDevelopment
Forum
EconomicCorridors/Business
EnterpriseLinkages
RegionalPublicGoods
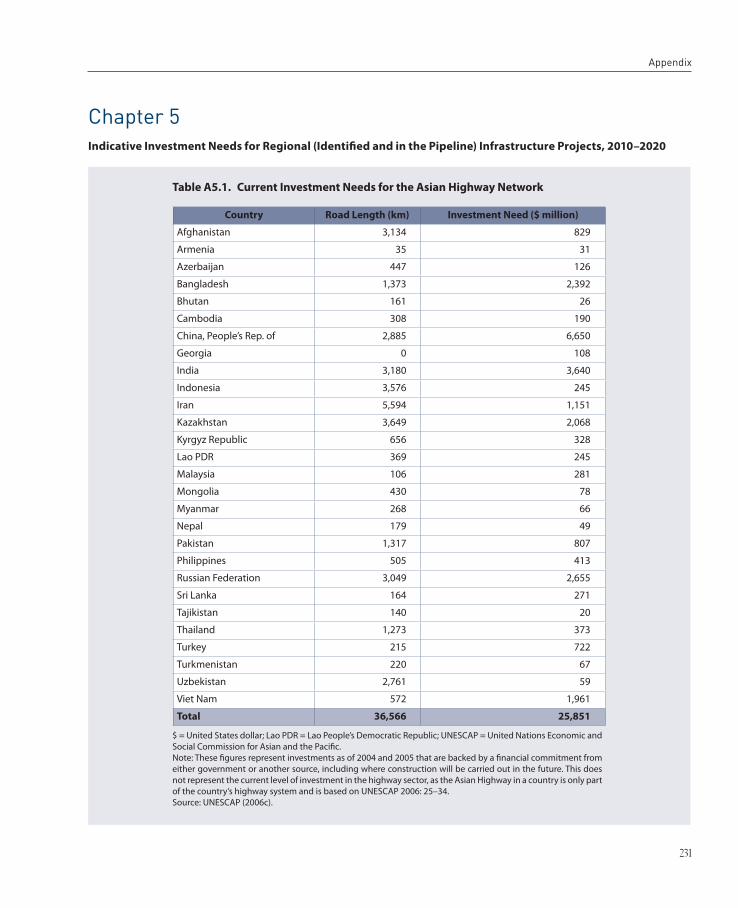
Appendix
231
Chapter 5 Indicative Investment Needs for Regional (Identified and in the Pipeline) Infrastructure Projects, 2010–2020
Table A5.1. Current Investment Needs for the Asian Highway Network
$ = United States dollar; Lao PDR = Lao People’s Democratic Republic; UNESCAP = United Nations Economic and Social Commission for Asian and the Pacific.Note: These figures represent investments as of 2004 and 2005 that are backed by a financial commitment from either government or another source, including where construction will be carried out in the future. This does not represent the current level of investment in the highway sector, as the Asian Highway in a country is only part of the country’s highway system and is based on UNESCAP 2006: 25–34.Source: UNESCAP (2006c).
Country Road Length (km) Investment Need ($ million)
Afghanistan 3,134 829
Armenia 35 31
Azerbaijan 447 126
Bangladesh 1,373 2,392
Bhutan 161 26
Cambodia 308 190
China, People’s Rep. of 2,885 6,650
Georgia 0 108
India 3,180 3,640
Indonesia 3,576 245
Iran 5,594 1,151
Kazakhstan 3,649 2,068
Kyrgyz Republic 656 328
Lao PDR 369 245
Malaysia 106 281
Mongolia 430 78
Myanmar 268 66
Nepal 179 49
Pakistan 1,317 807
Philippines 505 413
Russian Federation 3,049 2,655
Sri Lanka 164 271
Tajikistan 140 20
Thailand 1,273 373
Turkey 215 722
Turkmenistan 220 67
Uzbekistan 2,761 59
Viet Nam 572 1,961
Total 36,566 25,851

232
Infrastructure for a Seamless Asia
Table A5.2. Unmet Investment Needs for Asian Highway Identified Projects
ProjectsRoad Length
(km)
Investment Need
($ million)
Afghanistan 1,317 331
Kabul-Surubi 68 30
Kabul-Bamiyan 140 40
Kandahar-Gereshk 114 76
Heart-Andkhoy 550 80
Polekhumri-Hayratan 265 29
Balkh-Andkhoy 180 36
Bridge over the Ammour River – 40
Armenia 276 116
Vaik-Gorhayq 75 30
Goris-Agarak (Islamic Republic of Iran border) 140 56
Bavra-Gumri 10 5
Border of Azerbaijan-Agarak-Meghri-Azerbaijan border 51 25
Azerbaijan 355 160
Kazakh-border of Georgia 38 20
Nakchivan-Sadarak-border of Turkey 92 46
Goradiz-Gazi Mammed 185 74
Ring Road connected AH5 and AH8 around Baku 40 20
Bangladesh 771 413
Daukandi-Chittagong (upgrading four lanes) 246 191
Chittagong-Cox’s Bazar-Ramu-Gundam 186 144
Beldanga-Panchagarh 77 9
Dasuria-Paksey-Kushtia 38 4
Jhenaidah-Jessore 45 5
Bhutan
Puentsholing-Thimpu (upgrading to doublelanes) 179 60

Appendix
233
ProjectsRoad Length
(km)
Investment Need
($ million)
Cambodia 980 714
National Road Junction to Banlung (Rattanak Kiri) 125 44
Banlung (Rattanak Kiri)-Oyadav-border with Viet Nam 78 27
Battambang-Palin-border with Thailand 113 40
Preak Kdam-Thnal Keng 16 6
Snoul to Sen Monorom (Mondulkiri)-Lumphat ( Rattanakiri) 335 117
National Road (NR) 7 Junction at Pratheat to Chhlong 57 20
Neak Leoung Mekong River Bridge 3 200
Siem Reap-Stung Treng 253 260
China, People’s Rep. of 1,443 1,430
Jinghong-Mohan 343 1,160
Jinghong-Daluo 60 60
Kashi-Honqiraf 360 70
Lhaza-Zhangmu 680 140
Georgia 623 2,462
Poti-Tbilisi-Red Bridge 397 2,300
Poti-Batumi-Sarpi 87 123
Mtskheta-Kazbergi-Larsi 139 39
India 52 11
Shillong-Dwaki 7 6
India-India/Nepal border 10 1
Siliguri-Fulbari Mod-border with Bangladesh 16 2
Madurai-Dhanushkodi 19 2
Indonesia 572 29
Improvement and upgrading of various sections 160 14
Improvement and upgrading of various sections 412 15

234
Infrastructure for a Seamless Asia
ProjectsRoad Length
(km)
Investment Need
($ million)
Iran 927 1,224
Bazargan-Tabriz Freeway 280 250
Qazvin-Saveh Freeway 153 135
Khorramad-Andimeshk 159 200
Sirjan-Bandar Abbas 332 290
Quesm Bridge in the Persian Gulf 3 349
Lao PDR 316 63
Oudomaxay-Muangkhua-Tai Chang 202 40
Phiafai-Attapeu 114 23
Mongolia 3,120 454
Ulaanbaishint-Ulgii-Khovd-Bulgan-Yarant 785 114
Western link: Ulaanbaatar-Hovd 1,291 188
Eastern link: Baganuur-Ondorhaan-Choibalsan-Sumber-border with PRC 1,044 152
Myanmar 674 82
Myawadi (border with Thailand)-Kawkareik 40 19
Monyawa-Kalay/Kalewa 184 40
Kyaing Tong-Takaw-Loilem-Taunggyi 450 23
Nepal 328 135
New Koshi bridge at Chatara and widening of bridges 170 31
Naubise-Thankot (tunnel)-Kathmandu-Kodari upgrading 48 24
Kathmandu-Birgunj 110 80

Appendix
235
ProjectsRoad Length
(km)
Investment Need
($ million)
Pakistan 2,076 776
Improvement of Sibi-Sariab 160 68
Lakpass Tunnel – 9
Improvement of the Dalbandin-Naishki section 167 34
Dualization of Hassanbdal-Abbodtabad-Mansehra 90 51
Hub-Uthal 80 27
Improvement of Kuchlac-Zhob 306 60
Gwadar-Turban-Hoshab-Awaran-Khozdar 650 271
Hyderabad-Mirpurkhas-Umarkot-Khokhropar 222 50
Sehwan-Dadu-Ratodero 199 103
National Highway N70 202 103
Philippines 213 135
Tuguegarao City Bypass 8 5
Santiago City Bypass 3 2
San Jose City Bypass 7 8
Tiaong Bypass 3 2
Candelaria Bypass 9 5
Sariaya Bypass 8 5
Daraga Diversion Road 15 9
Sipocot-Putiao Diversion Road 58 36
Palo Bypass 4 2
Cebu North Coastral Road 9 6
Tagum City Bypass 13 8
Panabo City Bypass 10 6
Davao City Coastral Road 10 6
Cotabato City Bypass 12 7
Digos City Bypass 6 4
Koronodal City Bypass 10 6
General Santos City Bypass 14 9

236
Infrastructure for a Seamless Asia
$ = United States dollar; AH = Asian Highway; DWT = deadweight tonnage; km = kilometer; Lao PDR = Lao People’s Democratic Republic; m = meter; PRC = People’s Republic of China; TEU = twenty-foot equivalent unit; UNESCAP = United Nations Economic and Social Commission for Asia and the Pacific.– data not available.Note: These figures represent investments needs in priority projects as of 2004 and 2005 that are not backed by any financial commitment from either government or another source, including where construction will be carried out in the future. This does not represent the current level of investment in the highway sector, as the Asian Highway in a country is only part of the country’s highway system and is based on UNESCAP 2006: 25–34.Source: UNESCAP (2006c).
ProjectsRoad Length
(km)
Investment Need
($ million)
Russian Federation 1,983 1,250
Moscow-Khabarivsk-Vladivostok 1,400 950
Moscow-Tambov-Volgograd-Astrakhan-Mahachkala 390 300
Border of Ukraine-Kursk-Voronezh-Saratov-border with Kazakhstan – –
Bridge over the Kigach River in Astrakhan-Atrau road section (bridge length is 393m) 3 11
Yekaterinburg-Tumen-Ishim-Omsk 140 60
Sri Lanka 144 916
Talaimannar-Medawachchiya 112 36
Land bridge connecting Sri Lanka and India 32 880
Viet Nam 565 3,024
Hanoi-Hai Phong Expressway (four to six lanes) 100 410
Bien Hoa-Vung Tau Expressway (four to six lanes) 90 600
Da Nang-Quang Ngai (four lanes) 140 700
Sai Gon-Long Thanh-Dau Day (four to six lanes) 55 350
Ha Noi-Lao Cai Wxpressway 290 600
Vinh-Cau Treo rehabilitation 85 44
Ha Noi Ring Road 65 600
Vang Phong Transshipment Hubport(two terminals, 700m, 500,000 TEU/year) – 200
Rehabilitation of the Soai Rap Assess Channel in Ho Chi Minh City (for ships of 30,000 DWT assessable) 30 120
Total 25,587 17,425
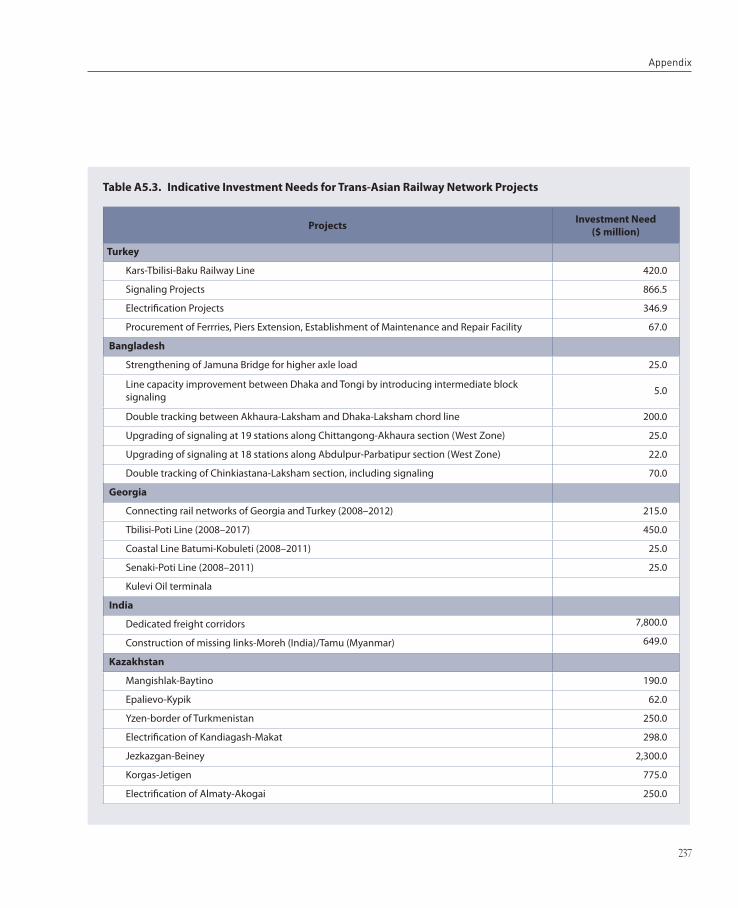
Appendix
237
Table A5.3. Indicative Investment Needs for Trans-Asian Railway Network Projects
ProjectsInvestment Need
($ million)
Turkey
Kars-Tbilisi-Baku Railway Line 420.0
Signaling Projects 866.5
Electrification Projects 346.9
Procurement of Ferrries, Piers Extension, Establishment of Maintenance and Repair Facility 67.0
Bangladesh
Strengthening of Jamuna Bridge for higher axle load 25.0
Line capacity improvement between Dhaka and Tongi by introducing intermediate block signaling 5.0
Double tracking between Akhaura-Laksham and Dhaka-Laksham chord line 200.0
Upgrading of signaling at 19 stations along Chittangong-Akhaura section (West Zone) 25.0
Upgrading of signaling at 18 stations along Abdulpur-Parbatipur section (West Zone) 22.0
Double tracking of Chinkiastana-Laksham section, including signaling 70.0
Georgia
Connecting rail networks of Georgia and Turkey (2008–2012) 215.0
Tbilisi-Poti Line (2008–2017) 450.0
Coastal Line Batumi-Kobuleti (2008–2011) 25.0
Senaki-Poti Line (2008–2011) 25.0
Kulevi Oil terminala
India
Dedicated freight corridors 7,800.0
Construction of missing links-Moreh (India)/Tamu (Myanmar) 649.0
Kazakhstan
Mangishlak-Baytino 190.0
Epalievo-Kypik 62.0
Yzen-border of Turkmenistan 250.0
Electrification of Kandiagash-Makat 298.0
Jezkazgan-Beiney 2,300.0
Korgas-Jetigen 775.0
Electrification of Almaty-Akogai 250.0
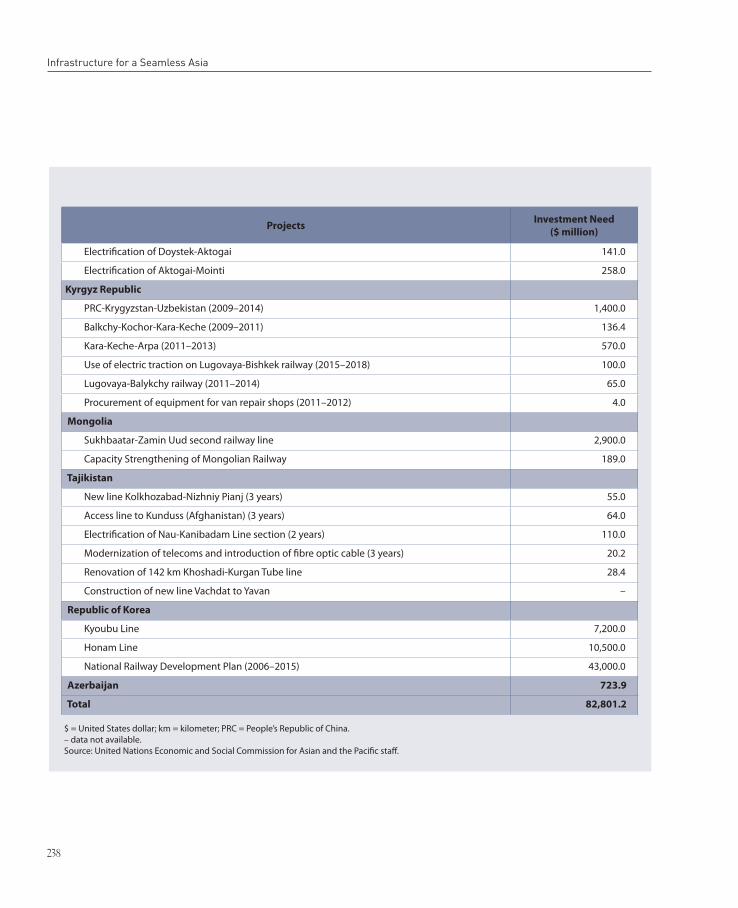
238
Infrastructure for a Seamless Asia
$ = United States dollar; km = kilometer; PRC = People’s Republic of China.– data not available.Source: United Nations Economic and Social Commission for Asian and the Pacific staff.
ProjectsInvestment Need
($ million)
Electrification of Doystek-Aktogai 141.0
Electrification of Aktogai-Mointi 258.0
Kyrgyz Republic
PRC-Krygyzstan-Uzbekistan (2009–2014) 1,400.0
Balkchy-Kochor-Kara-Keche (2009–2011) 136.4
Kara-Keche-Arpa (2011–2013) 570.0
Use of electric traction on Lugovaya-Bishkek railway (2015–2018) 100.0
Lugovaya-Balykchy railway (2011–2014) 65.0
Procurement of equipment for van repair shops (2011–2012) 4.0
Mongolia
Sukhbaatar-Zamin Uud second railway line 2,900.0
Capacity Strengthening of Mongolian Railway 189.0
Tajikistan
New line Kolkhozabad-Nizhniy Pianj (3 years) 55.0
Access line to Kunduss (Afghanistan) (3 years) 64.0
Electrification of Nau-Kanibadam Line section (2 years) 110.0
Modernization of telecoms and introduction of fibre optic cable (3 years) 20.2
Renovation of 142 km Khoshadi-Kurgan Tube line 28.4
Construction of new line Vachdat to Yavan –
Republic of Korea
Kyoubu Line 7,200.0
Honam Line 10,500.0
National Railway Development Plan (2006–2015) 43,000.0
Azerbaijan 723.9
Total 82,801.2

Appendix
239
Table A5.4. Energy Projects Linking East and Southeast-Central-South Asia
$ = United States dollar; PRC = People’s Republic of China.Sources: China Post (2007), Aftab Maken (2008), Subhash Vohra (2008), Vinish Kathuria (2006), and Bhattacharya and Kojima (2008).
Projects Investment Need ($ million)
Central Asia-China Natural Gas (Turkmenistan-PRC Gas Pipeline) 2,200
Turkmenistan-Afghanistan-Pakistan-India (TAPI) Gas Pipeline Project 7,600
Iran-Pakistan-India (IPI) Natural Gas Pipeline 7,000
Myanmar-Bangladesh-India (MBI) Gas Pipeline 1,000
Myanmar-India Hydro Power Project 5,175
Total 22,975
Table A5.5. Indicative Investment Needs for GMS Transport and Energy Projects
ProjectsInvestment Need
($ million)
Implementation
Period
Transport Projects
Viet Nam
Kunming-Haiphong Transport Corridor-Noi Bai-Lao Cai Hway 1,216.0 2008–2011
GMS Southern Coastal Road Corridor II 140.0 2012–2016
GMS East-West Corridor 140.0 2012–2015
Ha Noi-Lang Son Expressway 300.0 2011–2014
GMS Ha Long-Mong Cai Highway 1,000.0 2012–2015
Dau Giay-Lien Khuong Expressway 600.0 2011–2015
Van Phong Deep Sea Port 200.0 2010–2013Second GMS Northern Transport Network Improvement: Luangprabang-Thanh Hoa 95.0 2008–2012
Lao PDR
Second GMS Northern Transport Network Improvement: Luangprabang-Thanh Hoa 40.0 2009–2013
GMS East-West Corridor 23.0 2012–2015
Route14A: Junction Route 16-Lao PDR/Cambodian border 33.0 –
Route16A: Junction Route 16 Junction Route 11 34.0 –
Cambodia
Rehabilitation of the Railway 73.0 2008–2012

240
Infrastructure for a Seamless Asia
$ = United States dollar; GMS = Greater Mekong Subregion; kV = kilovolt; Lao PDR = Lao People’s Democratic Republic; MW = megawatt; PRC = People’s Republic of China. – data not available.Sources: ADB (2008a, 2008d).
ProjectsInvestment Need
($ million)
Implementation
Period
Thailand
Highway Expansion Project 230.0 2009–2013
PRC
Western Yunnan Roads Development II 250.0 2009–2013
Mengzhi-Hekou railway line 1,450.0 2010–2014Lao PDR and Myanmar: bridge over Mekong between Xieng Kok and Kyaing Lap including access road 34.0 –
Subtotal for Transport Projects 5,858.0
Energy Projects
GMS Countries
Subregional Strategy for Cooperation in Renewable Energy 1.2 2009
Developing the Regional Transmission and Regulatory Authority 1.0 2010–2012Lao PDR, Thailand: GMS Nabong-Udon Thani Power Transmission and Interconnection 110.0 2010–2012
Lao PDR, Viet Nam: GMS 500 kV Lao PDR-Viet Nam Interconnection (Ban Sok-Pleiku) 270.0 2010–2012
Lao PDR: GMS Northern Power Transmission 53.5 2009–2011
Viet Nam-PRC (Yunnan) 500kV Power Interconnection 400.0 2010–2013Cambodia: Transmisson Line-220kV link between Kampot and Shihanoukville 52.4 2009–2010
Lao PDR-Cambodia-Viet Nam Power Interconnection: A Study 1.3 2009–2011
Lao PDR
Lao PDR, Thailand: Nam Ngum 3,440 MW Hydropower Project 600.0 2009–2011
Lao PDR, Thailand: Nam Ngiep 1,261 MW Hydropower Project 380.0 2010–2012Lao PDR, Thailand: Xe Pian-Xenamnoy 390 MW Hydropower Project 400.0 2009–2012
PRC, Lao PDR, Thailand
PRC Thailand Power Transmission through Lao PDR 70.0 2009–2013
Lao PDR, Viet Nam
Nam Mo-Ban Mai Interconnection Project 14.4 2010–2013
Nam kong 1 (Lao PDR) 100 MW Hydropower Project 250.0 2009–2012
Subtotal for Energy Projects 2,603.8

Appendix
241
Table A5.6. Other Energy Projects in Southeast Asia
$ = United States dollar; ASEAN = Association of Southeast Asian Nations; BIMP-EAGA = Brunei Darussalam-Indonesia-Malaysia-Philippines East ASEAN Area; HPP = hydropower plant; Lao PDR = Lao People’s Democratic Republic; PRC = People’s Republic of China; PTL = power transmission line. Note: Except for Trans-ASEAN gas pipeline estimates, the rest of the projects were based on Bhattacharya, A. and Kojima, S., “Impact of Cross Border Energy Infrastructure Investment on Regional Environment, Society and Climate Change,” background paper for Flagship Study, 31 October 2008 wherein the source of energy projects is ASEAN Centre for Energy (2008) and the investment costs have been estimated using the data provided in the Annex-1 of Von Hippel (2001).Sources: ASEAN Center for Energy (2005), and Bhattacharya and Kojima (2008).
Projects Investment Need ($ million)
Thailand-Cambodia Transmission PTL 7.0
Peninsular Malaysia-Sumatra 143.0
Batam (Indonesia) Singapore PTL Project 177.0
Malaysia-Brunei Darussalam PTL Project 18.4
Malaysia-West Kalimantan PTL 18.4
Thailand-Lao PDR PTL 124.8
Thailand-Myanmar PTL 91.2
Lao PDR-Viet Nam PTL Project 117.6
Viet Nam-Cambodia PTL 7.2
Lao PDR-Thailand; Nam Theun 2 HPP 2,477.6
Lao PDR-Thailand; Nam Ngum HPP 1,400.5
Lao PDR-Thailand; Xe Pian HPP 887.9
Lao PDR-Thailand; Xe Khaman 1 1,065.8
Myanmar-Thailand; Tasang HPP 8,200.0
PRC-Thailand; Jinghong HPP 3,416.6
PRC-Thailand; Nuozhadu HPP 12,527.8
Cambodia-Viet Nam; Sambor CPEC HPP 1,059.0
BIMP-EAGA Renewable Energy Investment Fund 100.0
Trans-ASEAN Gas Pipeline 7,000.0
Total 38,839.80

242
Infrastructure for a Seamless Asia
Table A5.7. CAREC Transport, Trade Facilitation, and Energy Projects
Projects Investment Need
($ million)
Implementation
Period
Transport and Trade Facilitation Projects
Afghanistan
Leman-Armalick Road 30.0 2009–2010
Kazakhstan
Astana-Karaganda Road Rehabilitation 1,000.0 2009–2012
Almaty-Kapchagay Road Rehabilitation 580.0 2009–2011
Aktau-Beyneu Road Rehabilitation 550.0 2009–2012
Rehabilitation of Western Europe-Western PRC Transit Corridor 6,561.0 2009–2012
Electrification of Almaty-Aktogay Railway Section 243.0 2009–2011
Electrification of Dostyk-Aktogay Railway Section 134.0 2009–2011
Electrification of Aktogay-Mointy Railway Section 250.0 2009–2011
Expansion of Shymkent, Semey, and Kokchetau Airports 163.0 2009–2011
Kyrgyz Republic
Bishkek-Torugart Road Rehabilitation 300.0 2009–2014
CAREC Regional Road Corridor Improvement (Sary Tash-Karamik) 39.5 2009–2012
Electrification of Bishkek-Balykchy Railway 100.0 2015–2017
Track Rehabilitation Project (Chaldovar-Balykchy) 65.0 2011–2014
Equipment Purchase for Wagon Repair/Maintenance Facility 4.0 2011–2012
Electrification of Bishkek-Balykchy Railway 100.0 2015–2017
Track Rehabilitation Project (Chaldovar-Balykchy) 65.0 2011–2014
Equipment Purchase for Wagon Repair/Maintenance Facility 4.0 2011–2012
Rehabilitation of Osh Airport 40.0 2011–2012
Kyrgyz Air Traffic Control Capacity Enhancement 4.5 2009–2013
Mongolia
Western Regional Road 200.0 2008–2011
Ulaanbaatar-Russian Border Road Rehabilitation 120.0 2010–2013
Improvement of Olgiy and Hovd Airports 25.0 2009–2010
New International Airport in Ulaanbaatar 280.0 2010–2015
Establishment of Altanbulag Free Trade Zone 90.0 2010–2011
Improvement of Tsaganuur Free Trade Zone 30.0 2010–2011
Establishment of Zamyn-Uud Free Trade Zone 100.0 by 2015

Appendix
243
Projects Investment Need
($ million)
Implementation
Period
Tajikistan
Dushanbe-Tursunzade-Uzbek Border Road 100.0 2010–2012
Uzbekistan
CAREC Regional Road Improvement 173.5 2009–2011
Regional Railway 50.0 2011–2015
Acquisition of New Locomotives 25.0 2009–2010
Electrification of Kashi-Tashguzar Baisun-Kumgurgan Section 180.0 2011–2014
Electrification of Samarkand-Navoi and Samarkand-Kashi Sections 185.0 2011–2014
Electrification of Navoi-Bukhara and Bukhara-Kashi Sections 195.0 2011–2014
Electrification of Navoi-Uchkuduk Section 180.0 2011–2014
Azerbaijan
Acquisition of High Capacity Ferries and Ro/Ros 69.0 2010–2013
CAREC countries
Enhancements of IT Systems at Customs 5.0 2011
Border Post Improvements and Joint Border Processing 200.0 2009–2017
Trade and Industrial Logistic Centers with Information Exchange System 150.0 2011–2014
CAREC Transport Corridor 1b 6,700.0 from 2009
Caucasus Corridor (Armenia-Georgia Regional Transport Project) 323.0 –
CAREC Transport Corridor 2 1,800.0 2009–2012
Subtotal (Transport and Trade Facilitation) 21,413.5
Energy Projects
Afghanistan
Transmission and distribution rehabilitation in Afghanistan to enable the country to absorb the imported power from Iran, Turkmenistan, Uzbekistan, and Tajikistan and distribute it to load centers.
784.6 *
Azerbaijan
Rehabilitation of the T&D system in the gas sector as well as gas flaring reduction. 336.5 *
Study for improving the economics of BTC oil pipeline and BTE. 0.1 *
Construction of a set of 330 kV, 220 kV, and 110 kV transmission lines and substations to improve interconnection of the Azeri power system with those of the Russian Federation, Georgia, and Iran to enable larger power flows among these systems.
107.1 *

244
Infrastructure for a Seamless Asia
Projects Investment Need
($ million)
Implementation
Period
Kazakhstan
Completion of the oil pipeline section from Kenkiyak to Kumkol, to enable the full intended level of exports of Kazakh oil to the PRC. 453.7 *
Capacity expansion of CPC oil pipeline to Novorossiysk from 28 to 67 million tons/year including Kazakh oil of 50 million tons/year. 1,286.3 *
Kazakhstan Caspian Transportation System (KCTS) to export oil from Tengiz, Kashagan, and Karachaganank field westwards. 1,015.4 *
Caspian Littoral Gas Pipeline 1000 km long running along the existing Central Asia Center IV pipeline from Turkmenistan to the Russian Federation via Uzbekistan and Kazakhstan.
461.5 *
Construction of the second North-South 500 kV power transmission line (1,115 km long) in Kazakhstan to enable 600 MW of power to move from north to south Kazakhstan.
160.2 *
A project on the border river (Khorgos River) involving the construction of a series of dykes with flood control and irrigation benefits and with a cascade of small HPPs totaling 21 MW. All benefits to be shared equally between Kazakh and Chinese sides.
9.7 *
Construction of a 300 MW Moinak HPP on Charyn River in South Kazakhstan by a Kazakh-Chinese Joint Venture with a credit of $200 million provided by the PRC. Scheduled for completion in 2009 and output will reduce power deficit in South Kazakhstan.
143.1 *
Kyrgyz Republic
Transmission and distribution Rehabilitation in the power sector. 115.4 *Kyrgyz Link to CASAREM line: Rehabilitation of 140 km of 220 kV line between Alai S/S and Aigul Tash S/S, construction of a new 207 km long 220 kV line between Alai and Datka where a new 500/220 kV substation would be constructed.
38.5 *
Construction of 400 km long 500 kV transmission line from Kemin (northern border) to Datka. 175.4 *
Construction of Kambarata II HPP (360 MW) (1,100 GWh), along with associated 500 kV transmission line. 129.3 *
Construction of Kambarata I HPP (1,900 MW storage) (5,100 GWh) with associated 500 kV transmission links to Kemin in Kyrgyzstan. 895.4 *
Transmission and distribution Rehabilitation in the Natural Gas Sector. 23.1 *
Mongolia
Distribution Rehabilitation and Power System loss reduction in Mongolia. 15.9 *
Tajikistan
Loss reduction in power and gas sectors in Tajikistan Capital. 167.1 *
Rehabilitation of Nurek HPP and its switch yard, Kairakum HPP, Golovnaya HPP, and Varzob Cascade HPPs to increase capacities by 550 MW (270-300 GWh) in Tajikistan.
184.6 *

Appendix
245
$ = United States dollar; BTC = Baku-Tbilisi-Ceyhan; BTE = Baku-Tbilisi-Erzurum; CAREC = Central Asia Regional Economic Cooperation; CASAREM = Central Asia and South Asia Regional Electricity Market; CPC = Caspian Pipeline Consortium; GWh = gigawatt-hour, HPP = hydropower plant; IT = information technology; km = kilometer; kW = kilowatt; MW = megawatt; PRC = People’s Republic of China; S/S = substation; T&D = transmission and distribution; TPP = thermal power project/thermal power plant.– data not available.* Figures presented are the result of recalculations to reflect 2009–2020. Note: For the energy projects, except the last three projects (CASAREM, Regional Power Transmission Interconnection Project, and NEP), the computation of total estimated investment need is classified into short term (2008–2009), medium term (2010–2014), and long-term (2015–2027) or spanning the 2008–2027 duration. CAREC programs include Afghanistan and two provinces of the PRC (Xinjiang Uygur Autonomous Region and Inner Mongolia). These two countries were originally under the subregion of East Asia according to ADB’s classification.Sources: ADB staff, Bhattacharyay (2008), and CAREC (2008c).
Projects Investment Need
($ million)
Implementation
Period
Construction of Sangtuda I HPP (670 MW) (2,700 GWh). 323.1 *
Sangtuda II HPP (220 MW) (930 GWh). 92.3 *
Tajikistan Rogun Storage hydro (3,600 MW) (13,000 GWh). Incremental capital cost for completing the project. 1,130.8 *
Tajikistan North-South 500 kV transmission line (350 km long) and associated substations. Power transfer capacity from 600 to 800 MW. 129.7 *
Tajikistan: 220 kV double circuit transmission line from the Nurek area to Afghanistan border (about 110 miles) to enable 300 MW of export to Afghanistan.
15.2 *
CASAREM transmission line (750 km long, 450 kV HVDC line) from Sangtuda I HPP area in Tajikistan to Peshawar in Pakistan via Afghanistan. 242.8 *
Yavan HPP on Zarafshan river (150 MW) (540 GWh) including 60 km of associated 220 kV transmission lines. 120.2 *
Development of a captive coal mine at Fon Yagnob and construction of a coal fired power plant (1,000 MW) (6,000 GWh) in Tajikistan. 738.5 *
Uzbekistan
Construction of 220 km of 500 kV transmission line from Syrdarya TPP to Sogdiana Sub Station. 31.3 *
Construction of 217 km of 500 kV transmission line from Sogdiana S/S to Talimardjan TPP. 43.9 *
Construction of a 190 km long 500 kV line along with associated substation expansions from Surhan 500 kV substation to Guzar 500 kV substation. 50.3 *
Pipeline reinforcements in Uzbekistan to augment the transport capacity of (a) Bukhara-Ural gas pipeline, (b) Central Asia Center gas pipeline to the Russia Federation, and (c) expansion of compressor station No.5 at Ghazli.
98.8 *
Central Asia-South Asia Regional Electricity Market (CASAREM) 962.0 –
Regional Power Transmission Interconnection Project 109.5 –
Northeast Power System (NEP) Afghanistan 270.0 –
Subtotal (Energy) 10,861.3
Grand Total 32,274.8

246
Infrastructure for a Seamless Asia
Table A5.8. Transport Logistics and Energy Projects in South Asia
$ = United States dollar; ICT = information and communication technology; REG = Regional, RETA = Regional Technical Assistance; SASEC = South Asia Subregional Economic Cooperation.Sources: ADB staff, Bhattacharya and Kojima (2008), and Bhattacharyay (2008).
Projects Investment Need($ million)
Transport Logistics Projects 292.5
ICT: SASEC Information Highway Project (Bangladesh, Bhutan, India, and Nepal) 24.0
RETA-6435 REG: SASEC Transport Logistics and Trade Facilitation (formerly Subregional Transport Connectivity and SASEC Multimodal Transport and Trade Facilitation):
Sub-regional Transport Logistics and Trade Facilitation Project (Bangladesh) 23.0
Sub-regional Transport Logistics and Trade Facilitation Project (Nepal) 58.0
Sub-regional Transport Logistics and Trade Facilitation Project (Bhutan) 48.0
Sub-regional Transport Logistics and Trade Facilitation Project (India) 50.0
Improving Connectivity and Destination Infrastructure for Subregional Tourism Development 89.5
Energy Projects 6,845.6
Green Power Development (Bhutan) 234.5
West Seti Hydroelectric Project 1,700.0
Bhutan-India Hydropower Plant Projects 3,744.1
Bangladesh-India Power Project (Tata Group Proposal) 1,025.0
India-Sri Lanka Grid Connection 133.0
Bangladesh-Bhutan-Nepal-India Multilateral Power Line Interconnection 9.0
Total 7,138.1

Appendix
247
Table A5.9. Description of High-Priority GMS Energy and Transport Projects
Projects Brief Description
Transport Projects
1. GMS: Kunming-Hai Phong Transport Corridor-Noi Bai-Lao Cai Highway
The project will construct a 244 km long, access-controlled highway starting at Noi Bai in a suburb of Hanoi and ending at Lao Cai on the border with the PRC in northwest Viet Nam, forming an integral section of the GMS Eastern Corridor identified in the GMS Transport Sector Strategy (2006–2015).It will provide an efficient, safe, and reliable high-standard transport link between the PRC’s Yunnan Province and Hanoi, Hai Phong port, and Cai Lan port in northern Viet Nam, thus helping to enhance cross-border trade and access to seaports by the more interior areas of the GMS.Estimated cost: $1,216 million
2. Second GMS Northern Transport Network Improvement
The project involves upgrading around 200 km of Route 217 in Thanh Hoa Province in Viet Nam and around 140 km of sections of Routes 6, 6A, and 6B in Houaphanh Province in the Lao PDR, which are part of the GMS Northeastern Transport Corridor. It will also include a total of about 200 km of rural access roads linking the corridor to the hinterlands in the Lao PDR and Viet Nam.Estimated cost: $135 million
3. Rehabilitation of the Railway in Cambodia
The project involves physical rehabilitation of the railway in Cambodia, which is among the national railway links that have to be rehabilitated and upgraded to complete the Singapore-Kunming Railway Link (SKRL). The rehabilitated Cambodian railway line will connect to the railway in Thailand at the border in Poipet and run through Sisophon, through Phnom Penh, to the port at Sihanoukville.It also includes the restructuring of the railway organization, inclusive of establishing a PPP to operate it.Estimated cost: $73 million
4. Ha Long-Mong Cai Expressway
The project will construct an expressway in northern Viet Nam between Ha Long and Mong Cai on the border with Guangxi Zhuang Autonomous Region in the PRC.The expressway is part of the GMS Eastern Corridor and will be linked to the planned Fangcheng–Dongxing Expressway in the Guangxi Zhuang Autonomous Region, and will thus promote efficient cross-border movement of goods and people in the area.Estimated cost: $1,000 million
5. GMS Hanoi-Lang Son Expressway
The project will construct an expressway from Ha Noi to the Vietnamese province of Lang Son at the border with Guangxi Zhuang Autonomous Region in the PRC.In addition to being part of the GMS Eastern Corridor, the expressway is also part of the PRC-Viet Nam “‘two corridors-one economic belt” initiative, which aims to further enhance trade and investment flows between the two countries.Estimated cost: $900 million

248
Infrastructure for a Seamless Asia
$ = United States dollar; GMS = Greater Mekong Subregion; km = kilometer; kV = kilovolt; Lao PDR = Lao People’s Democratic Republic; MW = megawatt; PPP = public-private partnership; PRC = People’s Republic of China.Source: ADB staff, Bhattacharyay (2008).
Projects Brief Description
Energy Projects
6. GMS Northern Power Transmission
The project will develop/strengthen 115 kV transmission lines across the northern provinces of Louangnamtha, Phongsali, Oudomxai, Xaignabouri, and Vientiane in the Lao PDR, and includes three new substations and low/medium voltage distribution facilities for rural electrification.Expected project benefits include (i) providing power to rural areas in the northern region of the Lao PDR with no access to the grid, thus improving livelihoods; (ii) boosting infrastructure supportive of economic growth in these areas; (iii) improving reliability of power supply; and (iv) strengthening power interconnection with Thailand. Estimated cost: $53.5 million
7. GMS Nabong-Udon Thani Power Transmission and Interconnection
The project will construct 27 km of 500 kV transmission line from Na Bong substation in the Lao PDR to the border with Thailand to evacuate power to Thailand from four hydropower projects in the Lao PDR, with a total capacity of 1,500 MW. Expected project benefits include (i) providing revenues to the Lao PDR government; (ii) leveling the playing field for private investors; and (iii) enabling power trade, which will lower tariffs, reduce investment costs, and lead to more secure power supply.Estimated cost: $110 million
8. Lao PDR-Viet Nam Power Interconnection (Ban Sok-Pleiku)
The project will construct a 500 kV transmission line from Ban Sok (Lao PDR) to Pleiku (Viet Nam) to export power from six hydropower plants in the Lao PDR (Dak Emeule, Sekong 3A/3B, Sekong 4, Sekong 5, Xe Ka Man 1, and Nam Kong 1) to Viet Nam. Expected project benefits include (i) increasing power export capacity from the Lao PDR to Viet Nam; (ii) generating revenues for the Lao PDR’s development projects; and (iii) ensuring stable, low-cost power in Viet Nam. Estimated cost: $270 million
9. GMS Nam Ngiep 1 Hydropower Project
The project will construct the Nam Ngiep 1 Hydropower Plant, with a capacity of 260 MW (for export to Thailand) plus 20 MW for the use by the Lao PDR under a PPP arrangement. It includes the construction of 230 kV transmission lines to connect the plant to the Na Bong substation and related 115 kV lines to connect the power station. Expected benefits include (i) generating revenues for the Lao PDR’s environmental conservation and poverty reduction initiatives (livelihood, rural infrastructure, water, health, and education), and (ii) realizing economic benefits from power trade. Estimated cost: $380 million
10. GMS Nam Ngum 3 Hydropower Project
The project will develop, construct, and operate a 440 MW hydropower plant under a BOT arrangement.It includes the construction of a 250 kV line to Na Bong substation, and a 200 kV line from Na Bong to the grid at Pakpeng. Expected benefits include (i) generating foreign exchange and boosting domestic power supply for the Lao PDR while meeting Thailand’s power needs, and (ii) providing support for the Lao PDR’s development and poverty reduction undertakings. Estimated cost: $600 million

Appendix
249
Table A5.10. Description of High-Priority CAREC Transport and Energy Projects
Projects Brief Description
Transport Projects
1. CAREC Transport Corridor 1b
The corridor in Kazakhstan runs from Korgas at the border with the PRC to Zhaisan at the Russian Federation border via Almaty and Shymkent. Rehabilitation of this segment, together with the planned improvement of the border crossing at Korgas and the ongoing development of the high-tech logistics centers in Almaty and Aktobe, as well as the Khorgas Global Logistics Center in Xinjiang, PRC, will facilitate trade between Europe and East Asia.This corridor is underpinned by road investments made in the PRC, Kyrgyz Republic, and Tajikistan. In this sense, the corridor is an integral part and flagship transaction under CAREC. Further, the corridor paves the way and justifies the development of the North-South Corridor, which runs into Uzbekistan, Turkmenistan, Afghanistan, and Pakistan. Each of these corridors will be backed by work at the national level on rural access roads.The output of the investment program will be (i) around 480 km of constructed highway sections in Zhambyl Oblast, and (ii) an improved road operation and maintenance system. The highway is the main route between the western PRC, Central Asian countries, and the Russian Federation. The investment program will help the government accelerate the completion of the entire corridor. The investment program is split into several projects, and comprises reconstruction of the existing roads and construction of new roads. Project 1 will have two major components: (i) a road development component, targeting construction of 125 km of highway sections between Taraz and Korday in Zhambyl Oblast; and (ii) a road operation and maintenance component.Estimated investment need: $6,700 million
2. Caucasus Corridor: Armenia-Georgia Regional Transport Project
Armenia and Georgia, because of their geographical location and relative isolation, rely on smooth and efficient transport links to neighboring countries, particularly through the major road corridors. The proposed regional transport project will address the weakest segments of the important North-South Corridor, which runs from the ports in Georgia in the north, through Armenia, to Iran in the south. Because of the significant increases in traffic in recent years, the current North-South Road Corridor requires upgrading and rehabilitation in order to cope with future traffic effectively. It is estimated that Armenia will receive 80% of the project benefits and Georgia 20%. Project scope will include (i) road connectivity and safety improvement, (ii) cross border infrastructure and facilities improvement, (iii) capacity development, and (iv) project supervision and management.Estimated investment need: $323 million
3. CAREC Transport Corridor 2
The improvement of the railway line from Baku, Azerbaijan, to Beyuk Kesik at the Georgia border along CAREC Corridor 2 is a Program priority project scheduled for implementation in 2009–2012. The corridor carries a significant volume of transit cargo of oil and oil products from Kazakhstan and Turkmenistan to European markets. These, together with the ongoing improvement of the CAREC Corridor 2 road segment and border crossing at Beyuk Kesik, will increase the transport capacity of the corridor.Estimated investment need: $1,800 million

250
Infrastructure for a Seamless Asia
Projects Brief Description
4. Western Regional Road Corridor Development Project-Mongolia
Under the proposed Western Regional Road Corridor Development Project, a 748.4 km road corridor will be developed through the western region of Mongolia connecting Yarant at the PRC border to Ulaanbaishint at the Russian Federation border via Hovd and Olgiy, the aimag (province) centers. Making up a portion of Asian Highway 4 and a component of the larger UNESCAP-designated Asian Highway Network, the road corridor will link Mongolia with both the PRC and the Russian Federation, facilitating the flow of goods and passengers among the three countries. The proposed road corridor will be developed in two phases. Under phase I, a 431.2 km road from the PRC border to Hovd aimag center will be developed. Phase II will develop a road from Hovd aimag center to the Russian Federation border. The project supports Mongolia’s priority development plan of building roads for the Asian Highway under the national development strategy, which is based on the MDGs. As part of the Asian Highway Network, the project road will serve as an important route for domestic and international traffic. The proposed road corridor will also facilitate sustainable economic growth in the two most western aimags of Mongolia (Hovd and Bayan-Olgiy), which had a poverty rate of 38.7% in 2006 compared with the national average of 32.2% and Ulaanbaatar ‘s 20.4%. The proposed road corridor will strengthen Mongolia’s transport links to the PRC and the Russian Federation as well as other countries in the region.Estimated investment need: $220 million
Energy Projects
5. Central Asia-South Asia Regional Electricity Market (CASAREM)
This project is the most important regional cooperation investment for the Central Asian region today. The objective of the proposed project is to develop the regional electricity trade between Central Asian and South Asian countries, given that significant potential for exports of hydropower, and to a lesser extent thermal power, exists in the Kyrgyz Republic and Tajikistan. Meanwhile, Afghanistan and Pakistan are in electric power deficit and are thus large potential importers. There are potentially huge economic gains from the export of surplus power from Central Asia to two energy-deficient countries of South Asia—Afghanistan and Pakistan. Establishing this crucial link between the energy networks of Central and South Asia would also facilitate the development of the large hydropower potential in two Central Asian countries—the Kyrgyz Republic and Tajikistan. The impact of this flagship project on growth and poverty reduction in all four participating economies will be significant.The project will put in place initial interconnection infrastructure. The facilities will involve (i) a high voltage direct current (HVDC) transmission system between Tajikistan and Pakistan via Afghanistan to include 750 km of 500 kV DC overhead line, an alternating current (AC) to a direct current (DC) converter station in Tajikistan, and DC/AC converter stations in Afghanistan and Pakistan; and (ii) an AC transmission link between the Kyrgyz Republic and Tajikistan to supply Kyrgyz electricity to South Asia via Tajikistan. The scope of the proposed project includes developing the associated institutional and legal framework to enable such electricity trade.Estimated investment need: $962 million

Appendix
251
$ = United States dollar; CAREC = Central Asia Regional Economic Cooperation; GWh = gigawatt-hour; km = kilometer; kVDC = kilovolt direct current; MDG = United Nations’ Millennium Development Goals; MW = megawatt; PRC = People’s Republic of China; UNESCAP = United Nations Economic and Social Commission for Asia and the Pacific.Sources: Bhattacharyay (2008) and ADB staff.
Projects Brief Description
6. Regional Power Transmission Interconnection Project
The project will interconnect the power grids in Afghanistan and Tajikistan. Its scope will cover the construction of a 220 kV double-circuit transmission line that will link the hydropower stations located on the Vakhsh River in Tajikistan to the border town of Sherkan Bandar; then to Kunduz, Baglan, and Pul-e-Khumri in Afghanistan. This line will be linked ultimately to Afghanistan’s major electricity demand center, Kabul, through the Afghan 220 kV corridor currently under construction, linking Pul-e-Khumri to Kabul.The project will also include upgrading and new investments in Tajikistan that will help reduce the winter power deficit by (i) increasing the available level of power generation, and (ii) decreasing the level of technical losses in south Tajikistan. Both measures will aim to export 300 MW to Afghanistan and to generate an additional 320 GWh annually in Tajikistan.The project is in line with the governments’ strategies and policies. In Afghanistan, the policy is to provide reliable power supply to all Afghans. In Tajikistan, the policy is to maximize the use of its hydropower assets. Estimated investment need: $109.5 million
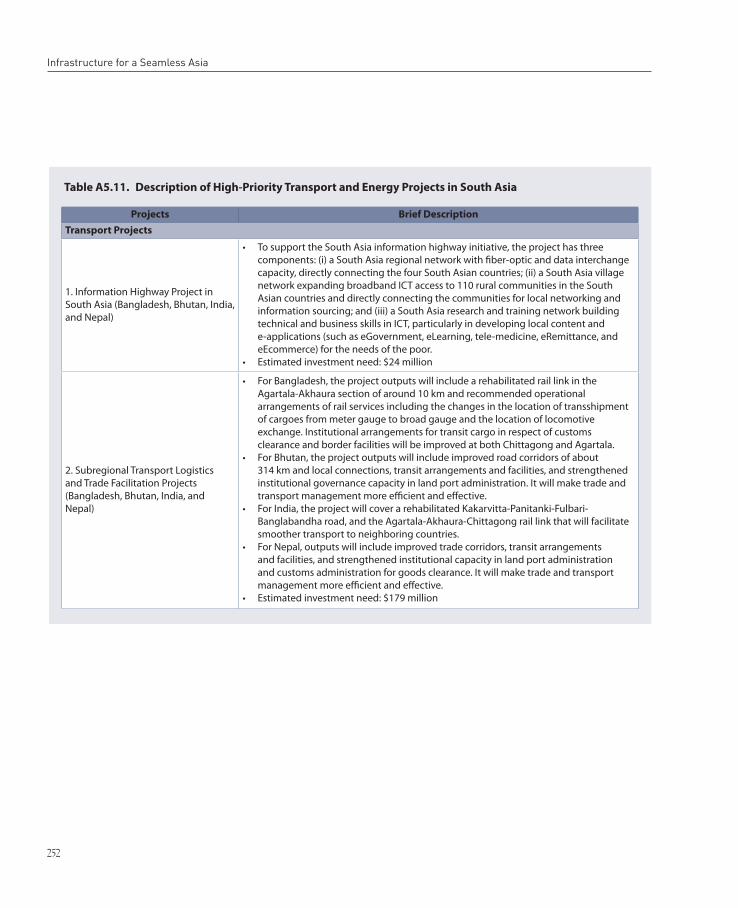
252
Infrastructure for a Seamless Asia
Table A5.11. Description of High-Priority Transport and Energy Projects in South Asia
Projects Brief Description
Transport Projects
1. Information Highway Project in South Asia (Bangladesh, Bhutan, India, and Nepal)
To support the South Asia information highway initiative, the project has three components: (i) a South Asia regional network with fiber-optic and data interchange capacity, directly connecting the four South Asian countries; (ii) a South Asia village network expanding broadband ICT access to 110 rural communities in the South Asian countries and directly connecting the communities for local networking and information sourcing; and (iii) a South Asia research and training network building technical and business skills in ICT, particularly in developing local content and e-applications (such as eGovernment, eLearning, tele-medicine, eRemittance, and eEcommerce) for the needs of the poor.Estimated investment need: $24 million
2. Subregional Transport Logistics and Trade Facilitation Projects (Bangladesh, Bhutan, India, and Nepal)
For Bangladesh, the project outputs will include a rehabilitated rail link in the Agartala-Akhaura section of around 10 km and recommended operational arrangements of rail services including the changes in the location of transshipment of cargoes from meter gauge to broad gauge and the location of locomotive exchange. Institutional arrangements for transit cargo in respect of customs clearance and border facilities will be improved at both Chittagong and Agartala. For Bhutan, the project outputs will include improved road corridors of about 314 km and local connections, transit arrangements and facilities, and strengthened institutional governance capacity in land port administration. It will make trade and transport management more efficient and effective. For India, the project will cover a rehabilitated Kakarvitta-Panitanki-Fulbari- Banglabandha road, and the Agartala-Akhaura-Chittagong rail link that will facilitate smoother transport to neighboring countries.For Nepal, outputs will include improved trade corridors, transit arrangements and facilities, and strengthened institutional capacity in land port administration and customs administration for goods clearance. It will make trade and transport management more efficient and effective. Estimated investment need: $179 million

Appendix
253
Projects Brief Description
3. Improving Connectivity and Destination Infrastructure for Subregional Tourism Development (Bangladesh, Bhutan, India, Nepal, and Sri Lanka)
For Bangladesh, the project will promote a new tourism circuit connecting Bagdogra, the subregional hub in India, with a heritage-focused corridor in the western regions of Bangladesh, which is connected to Kolkata via the border point at Benapole. The scope includes (i) improvement of four key cultural heritage sites along the heritage highway through conservation of heritage structures and environmental services, and (ii) support for capacity building of sector agencies and fostering community engagement in tourism and heritage site management. For Bhutan, the project intends to reinstate a circuit that links with India’s West Bengal and Assam in the southwest and southeast border points. The circuit forms part of the Great Himalayan Trail that extends the full length of the Himalaya range through Nepal, India, and Bhutan, linking established trekking areas with remote valleys in between. The scope involves (i) nature- and culture-based tourism destination development in central and eastern Bhutan, including small-scale facilities such as parking, toilets, trail improvements, interpretative signs, and waste management systems in selected sites and trails; (ii) development of a domestic airport in Trashigang in east Bhutan; and (iii) capacity building of relevant public agencies and communities in management of tourism infrastructure and natural and cultural heritage sites.For India, the project will focus on Sikkim state, which has a good road connection to Bagdogra, a regional hub, and an airport site with potential links to North Bangladesh, East Nepal, Bhutan, and other northeastern Indian states. Sikkim is part of the subregional Buddhist circuit and the Great Himalayan Trail. The project for the Sikkim state of India involves (i) access and on-site infrastructure and visitor facility improvements to the well-known Buddhist monastery of Rumtek; (ii) nature-based tourism destination infrastructure and facilities including trail development, signage, sanitation improvements, other tourist facilities, and a subregional training institute to be specialized in ecotourism and mountaineering; and (iii) related capacity building activities for public sector institutions and communities in tourism and heritage management.For Nepal, the project will develop the Nepal portion of the “Footsteps of the Lord Buddha Circuit.” It will include (i) upgrading of the nearest airport to Lumbini (Bhairawaha airport) to enable direct access by visitors from the region and western markets to Lumbini; (ii) Lumbini site improvements (e.g., water, sanitation, and road improvements; construction of a visitor center; and landscaping work around the visitor center); and (iii) a capacity building program to strengthen sector agencies and to foster involvement of communities in tourism and heritage site management.Estimated investment need: $89.5 million

254
Infrastructure for a Seamless Asia
$ = United States dollar; ICT = information and communication technology; km = kilometer; kV = kilovolt; MW = megawatt; PPP = public-private partnership; PRC = People’s Republic of China.Sources: ADB staff and Bhattacharyay (2008).
Projects Brief Description
Energy Projects
4. Green Power Development (Bhutan)
The Dagachhu hydropower development project will be a 114 MW run-of-river operation with minimal adverse environmental and social impacts. Generated power will be sold to India through the existing grid connected to India. The rural electrification system will be extended to provide a clean and reliable power supply to rural areas, mainly in seven districts of Bhutan. It will electrify 8,767 domestic households and facilities in the remote central and eastern regions. In addition to the grid extension, 119 solar photovoltaic systems, using an emerging energy-efficient technology, will be installed to support electrification in isolated off-grid rural areas, especially in schools, health clinics, monasteries, and other community facilities.Estimated investment need: $234.45 million
5. West Seti Hydroelectric Project (Nepal)
The project will (i) facilitate generation of 750 MW of electricity, (ii) ensure that social and environmental impacts have been properly identified and impacts mitigated (iii) support sufficient allocation and proper channeling of project revenues to poverty reduction initiatives, (iv) improve quality of life, and (v) promote capacity building for implementation of hydropower projects.The project will build a 195 meter high storage type dam for generation of 750 MW of hydroelectricity. The project will also build 132.5 km of 400 kV double circuit transmission line from the project switchyard to the Nepal-India border at Mahendranagar in Kailali District. Another 98 km of transmission line will be built by the Power Grid Corporation of India in Uttar Pradesh within India to link it to the Indian grid.The project will utilize Nepal’s natural resources and will provide construction opportunities for the PRC and power exports to India. It will be developed through a PPP to leverage private capital and maximize the impacts of the government investment.Estimated investment need: $45 million

Appendix
255
Table A5.12. Additional Transport and Energy Projects (Identified and in the Pipeline) Without Available Investment Estimates
ASEAN = Association of Southeast Asian Nations; GMS = Greater Mekong Subregion.– data not available.Source: Bhattacharyay (2008).
Region/SubregionNumber of Projects
Transport Energy Total
Asia-Wide
Trans-Asian Railway 40 – 40
East/Southeast-Central-South Links 4 1 5
Southeast Asia
GMS 24 6 30
ASEAN 2 1 3
East Asia – 6 6
Central Asia – 8 8
South Asia 2 1 3
Total 72 23 95
Table A5.13. Trans-Asia Railway Projects Without Available Investment Estimates
Countries and Railway Projects
Bangladesh
Construction of missing link from Dohazari to Gundum (border with Myanmar)Georgia
Establishment of container block trains Poti-Tbiliis Baku (2008–2011)Tbiliisi airport linePoti Station
Mongolia
Zamin Uud Intermodal TerminalGobi Region Railway NetworkEastern Region Railway Network
Sri Lanka
Northern lineCoast lineConnecting line

256
Infrastructure for a Seamless Asia
Source: United Nations Economic and Social Commission for Asia and the Pacific staff.
Countries and Railway Projects
Iran
Construction of Sangan-Herat rail line (link to Afghanistan)
Construction of Qazvin-Rasht-Astara (link to Azerbaijan and on to the Russian Federation)
Construction of Arak-Kermanshah-Khosravi (construction)
Construction of high-speed line Tehran-Qom-Esfahan
Construction of Gorgan-Bereket-Gyzylgaya (Turkmenistan)-Uzen (Kazakhstan) (link to Turkmenistan and Kazakhstan)
Construction of Khoramshahr-Bazra line (connection to port)
Construction of Esfahan-Shiraz
Construction of Fahraj-Port of Chabahar line section (connection to port)
Double-tracking of Miyaneh-Bostanabad-Tabriz line (capacity enhancement of east-west corridor)
Electrification of Tehran-Mashhad route
Electrification of Tabriz-Azershahr route
Electrification of Tehran-Qom-Esfahan
Renewal Projects: South railways
Renewal Projects: Tehran-Mashhad
Renewal Projects: North Railways
Upgrading: Switch welding on Tehran-Mashad line
Upgrading: axle-load increase
Upgrading: Strengthening of bridges against earthquake
Capacity Enhancement: Bafq-Bandar Abbas (double-tracking of Bafq-Bandar Abbas)
Capacity Enhancement: Bandar Emam-Ahwaz
Capacity Enhancement: Sarkahs-Kashmar (3rd Motohari-Fariman-Kashmar)
Capacity Enhancement: Kashmar-Razi (3rdline Garmsar-Bahram)
Capacity Enhancement: Kashmar-Bandar Abbas
Signaling and telecom: Bafq-Bandar Abbas
Signaling and telecom: Tehran-Mashhad
Signaling and telecom: Badrood-Meybod
Signaling and telecom: Ardakan-Chadormalu
Signaling and telecom: Bafq-Zarand
Development of freight yards: Signaling of link to Sarakhs
Development of freight yards: Enhancement of bogie-changing facilities at Sarakhs

Appendix
257
Table A5.14. East and Southeast-Central-South Asia Transport Projects Without Available Investment Estimates
GMS = Greater Mekong Subregion; PRC = People’s Republic of China.Sources: ADB staff and Bhattarchayay (2008).
Table A5.15. ASEAN Projects Without Available Investment Estimates
ASEAN = Association of Southeast Asian Nations.Source: ASEAN (2009).
Countries Involved Projects
PRC, Nepal PRC-Nepal 2nd Friendship Bridge
GMS countries Mekong Industrial Corridor
India, Afghanistan Afghanistan Road (implemented by India)
India, Myanmar, Thailand, Viet Nam India-Myanmar-Thailand-Viet Nam Railway Cooperation: Delhi-Hanoi Railway Link
Cambodia, Viet Nam Lower Se San 1 (Cambodia) 90 MW Hydropower Project 2009–2012
ASEAN Power Grid
ASEAN Highway Network
Singapore-Kunming Rail Link

258
Infrastructure for a Seamless Asia
Table A5.16. List of GMS Projects Without Available Investment Estimates and Target Schedules
GMS = Greater Mekong Subregion; Lao PDR = Lao People’s Democratic Republic; MW = megawatt; PRC = People’s Republic of China.Sources: ADB (2008a, 2008d).
Projects Target Schedule
Transport
PRC
Nanning-Kunming Railway Capacity Expansion 2009–2016Dali-Lijang Road Upgrading 2008–2010Baise-Debao-Lonbang (Viet Nam border) Expressway 2009–2012Yuxi-Mohan Railway Line 2010–2014Guangtong-Chuxiong-Dali Railway Capacity Enhancement Project 2010–2014Chengdu-Kunming Railway Double Tracking 2009–2011Guilin International Airport Expansion 2010–2014Nanning International Airport Improvement 2009–2012
Viet Nam
Da Nang-Quang Ngai Expressway 2010–2013Noi Bai-Halong-Mong Cai Expressway 2010–2014Ha Noi-Ho Chi Minh City Express Railway 2010–2020Ha Noi-Langson Railway (standard gauge) 2011–2015Noi Bai International Airport Expansion 2010–2014Da Nang Port Upgrading Phase 2 2009–2011Floating Port on Hamluong River 2009–2012
Lao PDR, Thailand
Thanaleng-Nong Khai Railway Extension 2009–2010Than Hoa-Vinh Expressway 2010–2012Thanaleng-Vientiane Railway 2008–2010PRC border (Lao Cai)-Ha Noi-Haiphong Railway (standard gauge) 2011–2015
Thailand
Chiang Saen Kok/Mekong Rivers 2008–2010Cambodia
Kratie Domestic Airport Improvement 2008–2011Preha Vihear Domestic Airport Improvement 2008–2011Mondulkiri Domestic Airport Improvement 2008–2011Channel Navigation and Port Improvements on the Mekong, Access to port at Siem Reap, and Development of Intermodoal Terminal at Khone Falls 2008–2012
Energy
Cambodia
Cambodia, Viet Nam Lower Se San 1 (Cambodia) 90 MW Hydropower Project 2009–2012Lao PDR
Lao PDR, Thailand Nam Theun 1,523 MW Hydropower Project 2010–2013Lao PDR, Viet Nam Xe Kong 4,400 MW Hydropower Project 2009–2012Lao PDR, Viet Nam Xe Kong 5,250 MW Hydropower Project 2010–2013Lao PDR, Viet Nam Nam Mo 105 MW Hydropower Project 2010–2013Lao PDR, Thailand Thenu-Hinbuon Expansion 210 MW Hydropower Project 2011–2014

Appendix
259
Table A5.18. CAREC Energy Projects Without Available Investment Estimates
CAREC = Central Asia Regional Economic Cooperation; MW = megawatt; PRC = People’s Republic of China.Source: CAREC (2008d).
Projects
Gas: Feasibility study for gas pipeline from Kazakhstan to PRC
Kazakhstan/PRC gas pipeline
Rehabilitation and upgrade of the gas transmission system
Modernizing Central Asia Center III gas pipeline
Electricity: Distribution Rehabilitation and Power System loss reduction
Interconnection of the three major grids in Mongolia
Feasibility Study for the construction of three 3,600 MW coal fired thermal power plants
Gas pipeline from Uzbekistan to PRC
Table A5.19. Regional Transport Projects in South Asia Without Available Investment Estimates
Source: Bhattarchayay (2008).
Projects
India-Nepal Railway
India-Sri-Lanka Bridge
India-Sri Lanka Thermal Power Project
Table A5.17. East Asia’s Regional Energy (Power Grid Interconnection) Project Without Available Investment Estimates
DPRK = Democratic People’s Republic of Korea; PRC = People’s Republic of China; RFE = Russian Far East; ROK = Republic of Korea.Source: Bhattacharyay (2008).
Countries Involved Projects
PRC, Mongolia East Siberia-North PRC-Ulan Bator-Mongolia
Russian Federation, PRC, ROK RFE-North PRC-Kovtyka-Chachum-Bohai Bay, Korea
Russian Federation, Japan, ROK RFE-Japan-Yakutsk-Chanchum-Korea
Russian Federation, PRC, ROK RFE-NE PRC-South Korea
Russian Federation, DPRK, ROK RFE-DPRK-ROK
Russian Federation, ROK, PRC RFE-PRC-ROK

References
and
Bibliography

References and Bibliography
263
Acharya, S. 2007. Flow Structure in Nepal and the Benefit to the Poor. Economics Bulletin 15(17): 1–14.
Asian Development Bank (ADB). 2004. Responding to the Priorities of the Poor: A Pacific Strategy for the Asian Development Bank, 2005–2009. Manila: ADB.
______. 2005a. Arrive Alive; ASEAN Commits to Cutting Road Deaths: Association of Southeast Asian Nation’s Regional Road Safety Strategy and Action Plan. Manila: ADB.
______. 2005b. Central Asia Regional Cooperation Strategy and Program Update 2006–2008: Development Through Cooperation. Manila: ADB.
______. 2005c. GMS Flagship Initiative: East-West Economic Corridor. Manila: ADB.
______. 2005d. GMS Transport Sector Strategy Study – Recommendations on Strategic Objectives and Directions for the Sector. ADB TA6915 REG Report. Prepared for the 9th Meeting of Subregional Transport Forum, Beijing, 1 June.
______. 2006a. Balancing Energy and Environment for Sustainable Development in the Greater Mekong Subregion. Presentation prepared for the 1st Planning and Consultation Workshop on the GMS Energy Strategy, Bangkok, 31 July.
______. 2006b. Central Asia: Increasing Gains from Trade through Regional Cooperation in Trade Policy, Transport and Customs Transit. Manila: ADB.
______. 2006c. Connecting Central Asia: A Road Map for Regional Cooperation. Manila: ADB.
______. 2006d. Greater Mekong Subregion: Regional Cooperation Strategy and Program Update. Manila: ADB.
______. 2006e. South Asia (2006–2008) Regional Cooperation Strategy and Program. Manila: ADB.
______. 2006f. Regional Cooperation and Integration Strategy. Manila: ADB.
______. 2006g. Sustaining Growth through Infrastructure Investment. Speech prepared by C. Lawrence Greenwood for the Asia Pacific Infrastructure Congress, Hong Kong, China, 5 September.
______. 2007a. ADB Annual Report 2007. Manila: ADB.______. 2007b. ADB’s Infrastructure Operations – Responding to Client
Needs. Manila: ADB.______. 2007c. Assessing Infrastructure Requirements for Developing Asia:
2006–2015. Internal study report. Manila: ADB. April.______. 2007d. Developing the Greater Mekong Subregion Energy
Strategy. Available: http://www.adb.org/Projects/GMS-Energy-Strategy/default.asp.
______. 2007e. Kingdom of Cambodia and Socialist Republic of Viet Nam: Greater Mekong Subregion: Phnom Penh to Ho Chi Minh City Highway Project. Completion Report. Manila: ADB. December.

264
Infrastructure for a Seamless Asia
______. 2007f. Lao People’s Democratic Republic and the Socialist Republic of Viet Nam: Greater Mekong Subregion: East-West Transport Corridor Project. Completion Report. Manila: ADB. September.
______. 2007g. Midterm Review of the GMS Strategic Framework 2002–2012. Draft report prepared for RETA 6171—Reviewing the Poverty Impact of Regional Economic Integration in the Greater Mekong Subregion. Manila: ADB.
______. 2007h. Pacific 2007–2010 Regional Operations Business Plan. Manila: ADB.
______. 2007i. Technical Assistance for Preparing the South Asia Subregional Economic Cooperation Transport Logistics and Trade Facilitation Project. Manila: ADB.
______. 2008a. Building a Sustainable Energy Future: The Greater Mekong Subregion. Discussion Draft for the Final Regional Workshop, Bangkok, 5–6 June.
______. 2008b. Emerging Asian Regionalism: A Partnership for Shared Prosperity. Manila: ADB.
______. 2008c. Emerging East Asia—A Regional Economic Update. Asian Economic Monitor (November): 3–45.
______. 2008d. Greater Mekong Subregion, 2009–2011 Regional Cooperation Operations Business Plan. Manila: ADB. September.
______. 2008e. Green Transport, Resource Optimization in the Road Sector in PRC, Main Report: Analysis and Policy Recommendations. Technical Assistance Consultant’s Report (draft) for ADB. Manila: ADB.
______. 2008f. Key Indicators for Asia and the Pacific 2008: Special Chapter on Comparing Poverty across Countries: The Role of Purchasing Power. Manila: ADB.
______. 2008g. Regional Projects in ADF: Impacts and Funding Issues. Paper prepared for Asian Development Fund Donors’ Third Meeting, Manila, 13–14March.
______. 2008h. South Asia 2009–2010, Regional Cooperation Business Plan. Manila: ADB.
______. 2008i .Vientiane Plan of Actions for GMS Development 2008–2012. Manila: ADB.
______. 2008j. Asian Infrastructure Financing Initiative. Board information paper. Manila: ADB. August.
______. 2008k. Asian Development Outlook 2008. Manila: ADB.______. 2009. Asian Development Outlook 2009: Rebalancing Asia’s
Growth. Manila: ADB. March 2009.Asian Development Bank Institute (ADBI). 2009. Demand for Infrastructure
Financing in Asia 2010–2020. ADBI Internal Report (prepared by Centennial Group Holdings, LLC, Washington DC). Tokyo: ADBI.
Asian Development Bank, Japan Bank for International Cooperation, and World Bank (ADB-JBIC-WB). 2005. Connecting East Asia: A New Framework for Infrastructure. Washington, DC: World Bank.

References and Bibliography
265
Asian Development Bank and United Nations Conference on Trade and Development (ADB-UNCTAD). 2008. Quantification of Benefits from Economic Cooperation in South Asia. New Delhi: Macmillan.
Aftab, M. 2008. TAPI Gas lines finalised. Khilafah.com. 26 April. Available: ttp://www.khilafah.com/index.php/news-watch/archive/2616-tapi-gas-pipeline-finalised.
Alburo, F. A. 2008. Constraints to supporting cross-border infrastructure projects for sub-regional cooperation: Legal, Legislative and Institutional Frameworks. Background paper prepared for the study Infrastructure and Regional Cooperation. Tokyo: ADBI.
Aldo, B. 2001. Private Infrastructure in East Asia – Lessons Learned in the Aftermath of the Crisis. World Bank Technical Paper No. 501 (April). Washington, DC: World Bank.
Amiti, B., and B. S. Javorcik. 2008. Trade Costs and Location of Foreign Firms in China. Journal of Development Economics 85: 129–149.
Anderson, J. E., and E. van Wincoop. 2004. Trade Costs. Journal of Economic Literature 42: 691–751.
Ang, J. B. 2007. Determinants of Foreign Direct Investment in Malaysia. Journal of Policy Modeling 30: 185–189.
Asia Pacific Energy Research Center (APERC). 2006. APEC Energy Demand and Supply Outlook 2006: Projections to 2030 Economy Review. Tokyo: Institute of Energy Economics.
Asia Regional Integration Center (ARIC). 2009. Subregional Economic Cooperation in South and Central Asia. Website information page. Available: http://aric.adb.org/background/I&S_SECSCA_SubregionalEconomicCooperationinSouthandCentralAsia.htm.
Arndt, S. W. 2001. Globalization of production and the value-added chain. The North American Journal of Economics and Finance November: 217–218.
Arnold, J. 2006. Best Practice in Management of International Trade Corridors. World Bank Transport Papers TP-1. Washington, DC: International Bank for Reconstruction and Development/World Bank.
______. 2009. The Role of Transport Infrastructure, Logistics, and Trade Facilitation in Asian Trade. In Pan-Asian Integration: Linking East and South Asia, edited by J. Francois, P. Rana, and G. Wignaraja. Basingstoke, UK: Palgrave Macmillan.
Aschauer, D. A. 1989. Is Public Expenditure Productive? Journal of Monetary Economics 23: 177–200.
Association of Southeast Asian Nations (ASEAN). 2009. Fact Sheet. Available: http://www.aseansec.org/19166.htm.
ASEAN Center for Energy. 2005. ASEAN Plan of Action for Energy Cooperation (APAEC) 2004–2009. Available: http://www.aseanenergy.org/ace/work_programme.htm.
Athukorala, P.-C. 2008. Recent Trends in Asian Trade and Implications for Infrastructure Development. Background paper prepared for the study Infrastructure and Regional Cooperation. Tokyo: ADBI.

266
Infrastructure for a Seamless Asia
Babinard, J., and P. Roberts. 2006. Maternal and Child Mortality Development Goals: What Can the Transport Sector Do? World Bank Transport Papers TP-12. Washington, DC: International Bank for Reconstruction and Development/World Bank.
Banomyong, R. 2007. Logistics Development Study of the Greater Mekong Subregion North South Economic Corridor. Study outcome report. Manila: ADB. Available: http://www.adb.org/GMS/Publications/NSEC-logistics-final.pdf.
Barnes, D., and H. Binswanger. 1986. Rural Electrification and Agricultural Development. Economic and Political Weekly 21(1): 26–34.
Barrios, E. B. 2008. Infrastructure and Rural Development: Household Perceptions on Rural Development. Progress in Planning 70: 1–44.
Barro, R., and X. Sala-i-Martin. 2005. Growth Theory, 2nd edition. Cambridge, MA: MIT Press.
Bauer, A., R. Hasan, R. Magsombol, and G. Wan. 2008. The World Bank’s New Poverty Data: Implications for the Asian Development Bank. ADB Sustainable Development Working Paper Series No. 2. Manila: ADB.
Bay of Bengal Initiative for Multi-Sectoral Technical and Economic Cooperation (BIMSTEC). 2009. About BIMSTEC. Available: http://www.bimstec.org/about_bimstec.html.
Berthelon, M., and C. Freund. 2004. On the Conservation of Distance in International Trade. World Bank Policy Research Paper 3293. Washington, DC: World Bank.
Bhattacharya, A., and S. Kojima. 2008. Impact of Cross Border Energy Infrastructure Investment on Regional Environment, Society and Climate Change. Background paper prepared for the study Infrastructure and Regional Cooperation. Tokyo: ADBI.
Bhattacharyay, B. N. 2008. Demand for Regional Infrastructure in Asia and the Pacific: 2008–2020. Background paper prepared for the study Infrastructure and Regional Cooperation. Tokyo: ADBI.
______. 2009a. The Role of Infrastructure Development in ASEAN Economic Integration. ADBI Working Paper No. 138. Tokyo: ADBI.
______. 2009b (forthcoming). Infrastructure Connectivity for East Asia’s Economic Integration. In Economics of East Asian Economic Integration, edited by M. Fujita et al. New York: Routledge.
Bhattacharyay, B. N., and P. De. 2009 (forthcoming). RegionalCooperation in Infrastructure Development in Asia: Role of Institutions and Policies. Background paper prepared for the study Infrastructure and Regional Cooperation. Tokyo: ADBI.
Bhattacharyay, B. N., and R. Krueger. 2009 (forthcoming). Modes of Asian Financial Integration: Financing Asia’s Infrastructure. Background paper for the study Infrastructure and Regional Cooperation. Tokyo: ADBI.
Bhattacharyay, B. N., and M. Rahman. 2009. Trade Effect of Social Infrastructures in Asia. Background paper prepared for the study Infrastructure and Regional Cooperation. Tokyo: ADBI.

References and Bibliography
267
Binswanger, H. P, S. R Khandkur, and M. R. Rosenzweig. 1989. How Infrastructure and Financial Institutions Affect Agriculture Output and Investment in India. Policy Planning and Research Working Paper No. 163. Washington, DC: World Bank.
Brenneman, A., and M. Kerf. 2002. Infrastructure and Poverty Linkages: A Literature Review. Mimeo. Washington, DC: World Bank.
Brixi, H. P., and A. Schick, eds. 2002. Government at Risk: Contingent Liabilities and Fiscal Risk. Washington, DC: World Bank.
Brooks, D. H. 2005. Competition Policy, International Trade, and Foreign Direct Investment. In Competition Policy and Development in Asia, edited by D. H. Brooks and S. Evenett. London: Palgrave Macmillan.
______. 2008. Asia’s Infrastructure, Trade Costs and Regional Cooperation. Paper presented at the Latin America/Caribbean-Asia/Pacific Economics and Business Association (LAEBA). 2008 Conference on Trade Costs and Regional Cooperation, Lima, 17 June.
Brooks, D. H., and D. Hummels, eds. 2009. Infrastructure’s Role in Lowering Asia’s Trade Costs: Building for Trade. Cheltenham, UK: Edward Elgar Publishing.
Brunei Indonesia Malaysia Philippines–East ASEAN Growth Area (BIMP-EAGA). 2009a. MOUs between the Governments of BIMP-EAGA Establishing and Promoting Efficient and Intergrated Sea Linkages. Available: http://www.bimp-eaga.org/documents.php?p=0.
______. 2009b. MOUs between the Governments Of BIMP-EAGA on Cross-Border Movement of Commercial Buses and Coaches. Available: http://www.bimp-eaga.org/documents.php?p=0.
BusinessDictionary.com. Definition of bankable project. Available: http://www.businessdictionary.com/definition/bankable.html
Calderon, C. A., and L. Serven. 2004. The Effects of Infrastructure Development on Growth and Income Distribution. World Bank Policy Research Working Paper No. WPS 3400. Washington, DC: World Bank.
Carruthers, R., and J. N. Bajpai. 2003. Trends in Trade and Logistics: an East Asian Perspective. World Bank Working Paper No.2. Washington, DC: World Bank.
Centennial Group. 2006. Regional Economic Cooperation and Integration: Lessons of Experience from Europe and the Americas. Internal Report prepared by Centennial Group Holdings, LLC. Washington, DC.
Central Asia Regional Economic Cooperation (CAREC). 2006. CAREC: Comprehensive Action Plan. Paper presented at the 5th Ministerial Conference, Urunqi Xuar, People’s Republic of China (PRC). 18–20 October.
______. 2008a. CAREC Transport and Trade Facilitation Strategy Action Plan: Preliminary Draft Report for the Senior Officials’ Meeting on CAREC. Baku, Azerbaijan, 24–25 April.

268
Infrastructure for a Seamless Asia
______. 2008b. Implementation Action Plan for the Transport and Trade Facilitation Strategy. Prepared report for consideration at the 7th Ministerial Conference on CAREC. Baku, Azerbaijan, 19–21 November.
______. 2008c. Strategy for Regional Cooperation in the Energy Sector of CAREC Countries. Prepared report for the 7th Ministerial Conference on CAREC. Baku, Azerbaijan, 19 November.
______. 2009. CAREC Energy. Information page website. Available: http://www.adb.org/Carec/energy.asp.
Centro Elettrotecnico Sperimentale Italiano (CESI spa), Instituto de Investigación Tecnológica (IIT), Mercados Energeticos (ME), RAMBØLL A/S. 2005. TEN-Energy Invest, Report for the Directorate General for Transport, European Commission. Contract No. TREN/04/ADM/S07.38533/ETU/B2-CESI, October 2005.
Chalamwong, Y., and O. Komkrit. 2008. Towards the Best Institutional Structures and Policies for Mitigating Negative Socioeconomic Impact of Cross-Border Infrastructure Projects. Background paper prepared for the study Infrastructure and Regional Cooperation. Tokyo: ADBI.
Chatterjee, S., T. Duncan, C. Narayanasuwami, and. B. Prakash. 2004. Scaling Up Poverty Reduction Potential of Infrastructure Projects—Lessons from the Asia-Pacific Region. ADB Poverty and Social Development Paper No.10. Manila: ADB.
China Business Review. 2009. China Market Intelligence: China Tackles Economic Crisis with Fiscal Stimulus, Consumption Plans. March. Available: http://www.chinabusinessreview.com/public/0903/cmi.html.
China Daily. 2008. Govt. sets $300 for railway construction. 25 October. Available: http://www.chinadaily.com.cn/china/2008-10/25/content_7140739.htm.
China Post. 2007. China National Petroleum Subsidiaries to Pay Billions for Central Asia Gas Pipeline. 30 December. Available: http://www.chinapost.com.tw/china/business/2007/12/30/137003/China-National.htm.
Clark, X., D. Dollar, and A. Micco. 2004. Port Efficiency, Maritime Transport Costs, and Bilateral Trade. Journal of Development Economics 75(2): 417–450.
Consensus Economics Inc. Various years. Financial Structure Database. Available: http://www.consensuseconomics.com/recent_data.htm.
Datt, G., and M. Ravallion. 1998. Why Have Some Indian States Done Better Than Others at Reducing Rural Poverty. Economica 65(1): 17–38.
De, P. 2008. Empirical Estimates of Trade Costs for Asia. In Infrastructure and Trade in Asia, edited by D. H. Brooks and J. Menon. Cheltenham, UK: Edward Elgar Publishing.
References and Bibliography
269
______. 2009a. Empirical Estimates of Transport Costs: Options for Enhancing Asia’s Trade. In Infrastructure’s Role in Lowering Asia’s Trade Costs: Building for Trade, edited by D. H. Brooks and D. Hummels. Cheltenham, UK: Edward Elgar Publishing.
______. 2009b. Trade Transportation Costs in South Asia: An Empirical Investigation. In Infrastructure’s Role in Lowering Asia’s Trade Costs: Building for Trade, edited by D. H. Brooks and D. Hummels. Cheltenham, UK: Edward Elgar Publishing.
______. 2009c. Inclusive Growth and Trade Facilitation: Insights from South Asia. ARTNeT Policy Brief # 16, Bangkok: United Nations Economic and Social Commission for Asia and the Pacific (UNESCAP).
De, P., and B. Ghosh. 2005. Effects of Infrastructure on Regional Income in the Era of Globalization: New Evidence from South Asia. Asia – Pacific Development Journal, 12(1): 81–107. Bangkok: UNESCAP.
De, P., M. Samudran, and S. Mohalkar. 2008. Trends in National and Regional Investors Financing Cross-Border Infrastructure Projects in Asia. Background paper prepared for the study Infrastructure and Regional Cooperation. Tokyo: ADBI.
Demurger, S. 2001. Infrastructure Development and Economic Growth: An Explanation for Regional Disparities in China? Journal of Comparative Economics 29: 95–117.
Economic Research Institute for ASEAN and East Asia (ERIA). 2007. International Infrastructure Development in East Asia: Towards Balanced Regional Development and Integration. ERIA Project 2007, No. 2. Chiba: Institute of Developing Economies–Japan External Trade Organization (IDE-JETRO).
Economic Research Service and United States Department of Agriculture (USDA). 1999. Financial Woes Threaten Infrastructure Investment in APEC Region (Special Article). Agricultural Outlook 19(October). Available: http://www.ers.usda.gov/publications/agoutlook/oct1999/ao265i.pdf
Economides, N. 1998. The Economics of Networks: Interview with John Irons of the Mining Company. March. Available: http://www.stern.nyu.edu/networks/part3.html.
Edmonds, C., and M. Fujimura. 2008. Road Infrastructure and Regional Economic Integration: Evidence from the Mekong. In Infrastructure and Trade in Asia, edited by D. H. Brooks and J. Menon. Cheltenham, UK: Edward Elgar Publishing.
Elhance, A. P., and T. R. Lakshamanan. 1988. Infrastructure-Production System Dynamics in National and Regional Systems: An Economic Study of the Indian Economy. Regional Science and Urban Economics 18: 511–531.
Esfahani, H. S., and M. T. Ramirez. 2003. Institutions, Infrastructure and Economic Growth. Journal of Development Economics 70: 443–477.

270
Infrastructure for a Seamless Asia
Estache, A. 2005. What Do We Know About Sub-Saharan Africa’s Infrastructure and the Impact of its 1990s Reforms? Draft. 15 June. Washington, DC: World Bank.
Estache, A., and M. Fay. 2007. Current Debates on Infrastructure Policy. World Bank Policy Research Working Paper No. 4410. Washington, DC: World Bank.
eTen Brochure. 2009. Introducing eTen. Available: http://ec.europa.eu/information_society/activities/eten/library/about/brochure/index_en.htm#introducing.
European Investment Bank (EIB). 2007. Statistical Report Vol. III. Available: www.eib.org/report.
Fan, S., L. Zhang, and X. Zhang. 2004. Investment, Reforms, and Poverty in Rural China. Economic Development and Cultural Change 52(2): 395–421.
Fay, M., and T. Yepes. 2003. Investing in Infrastructure—What is Needed from 2000 to 2010? World Bank Policy Research Working Paper 3102. Washington, DC: World Bank.
Fink, C., A. Matoo, and H. C. Neagu. 2002. Assessing the Impact of Telecommunication Costs on International Trade. World Bank Policy Research Paper 2552. Washington, DC: World Bank.
Fontana, M., and P. Wobst. 2001. A Gendered 1993–94 Social Accounting Matrix for Bangladesh. TMD Discussion papers 74. Manila: International Food Policy Research Institute.
Ford, B. 2008. Challenge for Asia in Infrastructure Needs. Asia Today International Magazine. Available: http://www.efic.gov.au/attachments/db/efi/169.pdf.
Francois, J. F., and M. Manchin. 2007. Institutions, Infrastructure and Trade. World Bank Policy Research Working Paper No. 4152. Washington, DC: World Bank.
Francois, J., M. Manchin, and A. Pelkmans-Balaoing. 2009. Regional Integration in Asia: The Role of Infrastructure. In Pan-Asian Integration: Linking East and South Asia, edited by J. F. Francois, G. Wignaraja, and P. Rana. Hants, UK: Palgrave Macmillan.
Francois, J. F., and G. Wignaraja. 2008. Economic Implications of Asian Integration. Global Economy Journal 8(3): 1–45.
Fujimura, M., and R. Adhikari. 2008. Critical Evaluation of Cross-Border Infrastructure Projects in Asia. Background paper prepared for the study Infrastructure and Regional Cooperation. Tokyo: ADBI.
Fung K. C., A. Garcia-Herrero, and F. Ng. 2008. Foreign Direct Investment in Cross-Border Infrastructure Projects. Background paper prepared for the study Infrastructure and Regional Cooperation. Tokyo: ADBI.
Geethanjali, N. 2007. Infrastructure Challenges in South Asia: The Role of Public-Private Partnerships. ADBI Discussion Paper No. 80. Tokyo: ADBI.
References and Bibliography
271
Gilbert, J., and N. Banik. 2008. Socioeconomic Impacts of Cross-Border Transport Infrastructure Development in South Asia. Background paper prepared for the study Infrastructure and Regional Cooperation. Tokyo: ADBI.
Glewwe, P., M. Gragnolati, and H. Zaman. 2002. Who Gained from Vietnam’s Boom in the 1990s? Economic Development and Cultural Change 50(4): 773–792.
Government of India. 2009. Additional Government Measures for Stimulating the Economy. India: Press Information of India. Available: http://pib.nic.in/release/release.asp?relid=46360.
Guild, R. 2008. Establishment of the Pacific Aviation Safety Office: Regional Cooperation through Intergovernmental Finance and Institutional Development. Presentation prepared for the Inception Workshop of the Study Infrastructure and Regional Cooperation, Tokyo, 18–20 February.
Ha, D. 2008. Prospects and Challenges of the Pan-Asian Transport Networks: Asian Highway and Trans-Asian Railway. Presentation at the Inception Workshop of the study Infrastructure and Regional Cooperation, Tokyo, 18–20 February.
Harris, S. 2004. Public Private Partnerships: Delivering Better Infrastructure Services. Paper presented to a conference at the Inter-American Development Bank, Washington DC. 20 February.
Hausman, W. H., H. L. Lee, and U. Subramanian. 2005. Global Logistics Indicators, Supply Chain Metrics, and Bilateral Trade Patterns. World Bank Policy Research Working Paper No. WPS 3773. Washington, DC: World Bank. Available: http://www-wds.worldbank.org/servlet/WDSContentServer/WDSP/IB/2005/11/17/000016406_20051117161830/Rendered/PDF/wps3773.pdf.
Haveman, J., A. Ardelean, and C. Thornberg. 2009. Trade Infrastructure and Trade Costs: A Study of Select Asian Ports. In Infrastructure’s Role in Lowering Asia’s Trade Costs: Building for Trade, edited by D. H. Brooks and D. Hummels. Cheltenham, UK, and Northampton, MA: Edward Elgar Publishing.
Hertel, T. W., ed. 1997. Global Trade Analysis: Modeling and Applications. Cambridge and New York: Cambridge University Press. Available: https://www.gtap.agecon.purdue.edu/.
Hulten, C. 1996. Infrastructure Capital and Economic Growth: How Well You Use it May be More Important than How Much You Have. National Bureau of Economic Research (NBER) Working Paper No. 5847. Cambridge, MA: NBER.
Hummels, D. 2001. Time as a Trade Barrier. GTAP Working Papers 1152. Indianapolis, IN: Purdue University.
______. 2007. Transportation Costs and International Trade in the Second Era of Globalization. Journal of Economic Perspectives 21(3): 131–154. New York: American Economic Association.

272
Infrastructure for a Seamless Asia
______. 2009. Trends in Asian Trade: Implications for Transport Infrastructure and Trade Costs. In Infrastructure’s Role in Lowering Asia’s Trade Costs: Building for Trade, edited by D. H. Brooks and D. Hummels. Cheltenham, UK: Edward Elgar Publishing.
Hummels, D., V. Lugovsky, and A. Skiba. 2007. The Trade Reducing Effects of Market Power in International Shipping. NBER Working Paper No. 12914. Cambridge, MA: NBER.
Hummels, D., and A. Skiba. 2004. Shipping the Good Apples Out: An Empirical Confirmation of the Alchian-Allen Conjecture. Journal of Political Economy 112: 1384–1402.
Hurlin, C. 2006. Network Effects of the Productivity of Infrastructure in Developing Countries. Policy Research Working Paper 3808. Washington, DC: World Bank.
Inter-American Development Bank (IDB). 2000. Un Nuevo Impulso a la Integracion de la Infrastructure Regional en America del Sud. Washington, DC: IDB.
______. 2006. Building a New Continent: A Regional Approach to Strengthening South American Infrastructure, Initiative for the Integration of Regional Infrastructure in South America (IIRSA). Washington, DC: IDB.
______. 2007. IDB Annual Report 2007. Washington, DC: IDB. Available: http://www.iadb.org/EXR/AR2007/.
International Energy Agency (IEA). 2003. 2003 Insights. In World Energy Investment Outlook. Paris: IEA. Available: http://www.iea.org/textbase/nppdf/free/2003/weio.pdf.
______. 2004. Executive Summary. In World Energy Outlook 2004. Paris: IEA. Available: http://www.iea.org/Textbase/npsum/WEO2004SUM.pdf.
______. 2006. World Energy Outlook 2006. Paris: IEA.______. 2007. World Energy Outlook 2007. Paris: IEA.Iimi, A., and J. W. Smith. 2007. What is Missing Between Agricultural
Growth and Infrastructure Development? Cases of Coffee and Dairy in Africa. World Bank Policy Research Paper No. 4411. Washington, DC: World Bank.
Indonesia-Malaysia-Thailand Growth Triangle (IMT-GT). 2009. Overview of the IMT-GT Subregion. Available: http://www.adb.org/IMT-GT/about.asp.
Initiative for the Integration of Regional Infrastructure in South America (IIRSA). 2007. Annex 10: Indicative Territorial Planning. Technical Executive Groups-GTEs, Results and Project Portfolio (in Spanish). Montevideo: IIRSA.
Integriertes Ressourcen Management (IRM). 2008. Economics of Energy Integration: Application of MESSAGE Model in the GMS. Draft Final Report. Vienna: IRM.
International Monetary Fund (IMF). 2006. World Economic Outlook Update. New York: IMF. Available: http://www.imf.org/external/pubs/ft/weo/2008/update/03/pdf/1108.pdf.

References and Bibliography
273
______. 2008a. IMF Statistical Databases—Online Browsers and Documentation. Available: http://www.imfstatistics.org/dot/.
______. 2008b. IMF World Economic Outlook Databases, October 2008—Online Publications. Available: http://www.imf.org/external/pubs/ft/weo/2008/02/weodata/weoselagr.aspx.
Ishida, M. 2007. Evaluating the Effectiveness of GMS Economic Corridors: Why is There More Focus on the Bangkok-Hanoi Road than the East-West Corridor? Discussion Paper No. 123 (October). Chiba, Japan: IDE-JETRO.
Ishimori, K. 2003. The Impact of Road Development on the Health of Pregnant and Parturient Women. Results from collaborative research project. Japan Bank for International Cooperation and United Nations Population Fund. July–October.
Ito, K., L. Zhidong, and R. Komiyama. 2005. Asian Energy Outlook to 2020: Trends, Patterns and Imperatives of Regional Cooperation. Discussion Paper No. RIS-DP#93/2005. Research and Information System for Developing Countries (RIS): New Delhi.
Jacks, D. S., C. M. Meissner, and D. Novy. 2008. Trade Costs, 1870–2000. American Economic Review 98(2): 529–534.
Jahan. S., and R. McCleery. 2005. Making Infrastructure Work for the Poor. New York: United Nations Development Programme.
Japan Bank for International Cooperation (JBIC). 2000. JBIC Annual Report Year 2000. Tokyo: JBIC. Available: http://www.jbic.go.jp/en/about/business/year/2000/index.html.
______. 2005. JBIC Annual Report Year 2005. Tokyo: JBIC. Available: http://www.jbic.go.jp/en/about/business/year/2005/index.html.
______. 2008. JBIC Annual Report Year 2008. Tokyo: JBIC. Available: http://www.jbic.go.jp/en/about/business/year/2008/index.html.
Japan International Cooperation Agency (JICA). 2007. Japan International Cooperation Agency Annual Report 2007. Tokyo: JICA.
Kathuria, V. 2006. Promise of Transborder Gas Pipelines. The Hindu. 8 May. Available: http://www.hindu.com/biz/2006/05/08/stories/2006050800341600.htm.
Kawai, M. 2005. East Asian Economic Regionalism: Progress and Challenges. Journal of Asian Economics 16: 29–55.
Kawai, M., and G. Wignaraja. 2008. EAFTA or CEPEA Which Way Forward? ASEAN Economic Bulletin 25(2): 113–139.
Kimura, F. 2008. Transactions in Production/Distribution Networks and Demand for Logistic Infrastructure. Background paper for the study Infrastructure and Regional Cooperation. Tokyo: ADBI.
Kimura, F., Y. Takahashi, and K. Hayakawa. 2007. Fragmentation and Parts and Components Trade: Comparison between East Asia and Europe. North American Journal of Economic and Finance 18(1): 23–40.
Koptis, E., and E. Cropper. 2003. Traffic Fatalities and Economic Growth. World Bank Policy Research Working Paper No. 3035. Washington DC: World Bank.

274
Infrastructure for a Seamless Asia
Krugman, P. R. 1993. First Nature, Second Nature, and Metropolitan Location. Journal of Regional Science 33: 129–144.
______. 2008. Trade and Geography—Economies of Scale, Differentiated Products and Transport Costs. Science background on the Sveriges Riksbank Prize in Economics Science in Memory of Alfred Nobel 2008. Stockholm: Prize Committee of the Royal Swedish Academy of Science.
Kudo, T. 2007. Border Industry in Myanmar: Turning the Periphery into the Center of Growth. Institute of Developing Economies (IDE) Discussion Paper No. 122. Chiba, Japan: IDE-JETRO.
Kulkarni, V., D. Barnes, and S. Parodi. 2007. Rural Electrification and School Attendance in Nicaragua and Peru. Draft paper for The World Bank. Washington, DC: World Bank.
Kumar, N., and P. De. 2008. East Asian Infrastructure Development in a Comparative Global Perspective: An Analysis of RIS Infrastructure Index. RIS Discussion Paper No. 135. New Delhi: RIS.
Kuroda, H., M. Kawai, and, R. Nangia. 2008. Infrastructure and Regional Cooperation. In Rethinking Infrastructure for Development, edited by F. Bourguignon and B. Pleskovic. Washington, DC: World Bank.
Kuroiwa, I. 2008. Cross-Border Production Networks in Southeast Asia: Applications of the International Input-Output Analysis. In Production Networks and Industrial Clusters: Integrating Economies in Southeast Asia, edited by I. Kuroiwa and T.M. Heng. Singapore: Institute of Southeast Asian Studies (ISEAS).
Kwon, E. 2005. Infrastructure, Growth and Poverty Reduction in Indonesia: A Cross-Sectional Analysis. Paper presented at ADBI Workshop on Transport Infrastructure and Poverty Reduction, Manila, 18–22 July.
Levy, H. 2004. Rural Roads and Poverty Alleviation in Morocco. Presentation at the Scaling up Poverty Reduction: A Global Learning Process Conference, Shanghai, 25–27 May.
Limao, N., and A. J. Venables. 2001. Infrastructure, Geographical Disadvantage, Transport Costs and Trade. World Bank Economic Review 15: 451–479.
Linn, J. F. and O. Pidufala. 2008. The Experience with Regional Economic Cooperation Organizations: Lessons for Central Asia. Wolfensohn Center for Development Working Paper 4. Washington, DC: Brookings Institution.
Luanglatbandit, R. 2006. Development Impacts of the East West Economic Corridor (EWEC) on Savannakhet Province of the Lao PDR. Paper prepared for the GMS Senior Officials Meeting cum GMS Summit Task Force Meeting, Vientiane, Lao PDR, 9–10 November.
Ma, L., and J. Zhang. 2009. Infrastructure Development in a Fast Growing Economy—The People’s Republic of China. In Infrastructure’s Role in Lowering Asia’s Trade Costs: Building for Trade, edited by D. H. Brooks and D. Hummels. Cheltenham, UK: Edward Elgar Publishing.

References and Bibliography
275
Mekong River Commission (MRC). 2009. Visions and Mission. Available: http://www.mrcmekong.org/about_mrc.htm.
Menon, J., and P. Warr. 2008. Roads and Poverty: A General Equilibrium Analysis for Lao PDR. In Infrastructure and Trade in Asia, edited by D. H. Brooks and J. Menon. Cheltenham, UK: Edward Elgar Publishing.
Ministry of Strategy and Finance, Republic of Korea. 2009. FAQs on the Korean Economy. January. Available: http://english.mofe.go.kr/interaction/faqs.php.
MVV Consulting. 2007. Implementation of TEN-E projects (2004–2006), Evaluation and Analysis. Final Report Volume I. November. Available: http://ec.europa.eu/energy/infrastructure/studies/doc/2007_11_ten_e_evaluation.pdf.
Naranpanawa, R. 2005. Trade Liberalization and Poverty in a Computable General Equilibrium (CGE) Model: The Sri Lankan Case. Unpublished PhD dissertation 2005. Brisbane: Griffith University.
Nordas, H. K., and R. Piermartini. 2004. Infrastructure and Trade. World Trade Organization Staff Working Paper ERSD-2004-04. Washington, DC: World Bank.
Nordic Investment Bank (NIB). 2007. Annual Report 2007: Enhancing Competitiveness and the Environment. Helsinki: NIB. Available: http://www.nib.int/filebank/181-AR06-p1-11.pdf.
Nunez-Ferrer, J. 2007a. The EU Budget: The UK Rebate and the CAP—Phasing Them Both Out? Centre for European Policy Studies (CEPS) Task Force Report. Brussels: CEPS. Available: www.ceps.eu.
______. 2007b. EU Budget and Policy Reforms in Order to Promote Economic Growth. ITPS Working Paper R2007: 015. Ostersund, Sweden: Swedish Institute for Growth Policy Studies. Available: http://www.itps.se/Archive/Documents/Swedish/Publikationer/Rapporter/Arbetsrapporter%20(R)/R2007/R2007_015_webb.pdf.
Organisation for Economic Cooperation and Development/International Transport Forum (OECD/ITF). 2008. The Wider Economic Benefits of Transport: Macro-, Meso, and Micro Transport Planning and Investment Tools Summary and Conclusions from Round Table. Discussion Paper No.2008-6 (January). Boston: Joint Transport Research Centre.
Overseas Economic Cooperation Fund (OECF). 1998. Regional Cooperation in Central Asia: Focusing on Infrastructure Development study. OECF Research Papers No.27. Tokyo: OECF.
Pacific Island Forum (PIF) Secretariat. 2007. The Pacific Plan for Strengthening Regional Cooperation and Integration. Available: http://www.forumsec.org.fj/UserFiles/File/Pacific_Plan_Nov_2007_version.pdf.
______. 2009. About Us. Available: http://www.forumsec.org.fj/pages.cfm/about-us/

276
Infrastructure for a Seamless Asia
Pandit, V., and R. Srinivasaraghavan. 2008. A Fresh Wind for Offshoring Infrastructure Management. The McKinsey Quarterly (October). Available: http://www.mckinseyquarterly.com/A_fresh_wind_for_offshoring_infrastructure_management_2217.
Parpiev, Z., and J. Sodikov. 2008. The Effect of Road Upgrading to Overland Trade in Asian Highway Network. Eurasian Journal of Business and Economics 1(2): 85–101.
Patunru, A., N. Nurridzki, and Rivayani. 2009. Port Competitiveness: A Case Study of Semarang and Surabaya, Indonesia. In Infrastructure’s Role in Lowering Asia’s Trade Costs: Building for Trade, edited by D. H. Brooks and D. Hummels. Cheltenham, UK: Edward Elgar Publishing.
Phyrum, K., V. Sothy, and K. S. Horn. 2007. Social and Economic Impacts of GMS Southern Economic Corridor on Cambodia. Mekong Institute Research Working Paper Series No.1 (October). Khon Kaen, Thailand: Mekong Institute.
Pickard, M. 2002. PPP: Plan Puebla Panama, or Private Plans for Profit? A Primer on the Development Plan that Would Turn the Region from Southern Mexico to Panama into a Giant Export Zone. Special to CorpWatch. 19 September. Available: http://www.corpwatch.org/article.php?id=3953.
Powell, B., and A. Clark. 2009. Gasoline Ending Biggest Rally in Decade as Driving Season Opens. Bloomberg News. Available: http://www.bloomberg.com/apps/news?pid=email_en&sid=a3rxVC6U4CeY.
Pradhan, B., and S. Amarendra. 2006. The Impact of Trade Liberalization on Household Welfare and Poverty in India. Working Paper 2006–01. Manila: Poverty and Economic Policy Network.
Rattanatay, L. 2007. Development Impacts of the East West Economic Corridor (EWEC) on Savannakhet Province of the Lao PDR. Manila: ADB.
Research and Information System for Developing Countries (RIS). 2008. South Asia Development and Cooperation Report 2008. New Delhi: Oxford University Press.
Rickards, D. 2008. Global Infrastructure—A Growth Story. In Infrastructure Finance: Trends and Techniques, edited by H. A. Davis. London: Euromoney Books.
Rimmer, P. J., and H. Dick. 2008. Appropriate Economic Space for Transnational Infrastructure Projects: Gateways, Multimodal Corridors and Special Economic Zones. Background paper prepared for the study Infrastructure and Regional Cooperation. Tokyo: ADBI.
Roland-Holst, D. 2008. Regional Infrastructure Projects Involving West Asia: General Equilibrium Assessments for Kazakhstan and PRC. Background paper prepared for the study Infrastructure and Regional Cooperation. Tokyo: ADBI.
References and Bibliography
277
Rosenthal, S. S., and W. C. Strange. 2004. Evidence on the Nature and Sources of Agglomeration Economies. In Handbook of Urban And Regional Economics, edited by J.V. Henderson and J. F. Thisse. Amsterdam: Elsevier.
Sahoo, S., and K. K. Sexena. 1999. Infrastructure and Economic Development: Some Empirical Evidence. Indian Economic Journal 47(2): 54–66.
Sandler, T. 2004. Demand and Institutions for Regional Public Goods. In Regional Public Goods: From Theory to Practice, edited by F. B. Esteveadeordal and T. R. Nguyen. Washington, DC: IDB.
Sharma, S. 2009. Deepening South Asian Economic Integration in an Era of Crisis. Presentation at the High-Level Conference on Financial Crisis, Global Economic Governance and Development: Responses of Asia and the Global South, New Delhi, 6–7 February.
Sheel, A. 2008. Financing Infrastructure: Issues and Challenges. Keynote Speech the Technical Seminar of the study Infrastructure and Regional Cooperation, New Delhi, 12–14 June.
Singh, J., and M. Mitra. 2006. Reviewing the Poverty Impact of Regional Economic Integration in the Greater Mekong Sub-Region. Regional Synthesis Report for ADB. Manila: ADB.
Smith, D., A. Gordon, K. Meadows, and K. Zwick. 2001. Livelihood Diversification in Uganda: Patterns and Determinants of Change Across Two Rural Districts. Food Policy 26: 421–435.
Stone, S. 2008. Asia’s Infrastructure Challenges: Issues of Institutional Capacity. ADBI Working Paper No. 126. Tokyo: ADBI.
Stone, S., and A. Strutt. 2009. Transport Infrastructure and Trade Facilitation in the Greater Mekong Subregion. ADBI Working Paper No. 130. Tokyo: ABDI.
Stone, S., A. Strutt, and T. Hertel. 2008. Assessing Socioeconomic Impacts of Transport Infrastructure Projects in the Greater Mekong Subregion. Background paper prepared for the study Infrastructure and Regional Cooperation. Tokyo: ADBI.
Straub, S. 2008. Infrastructure and Growth in Developing Countries: Recent Advances and Research Challenges. World Bank Policy Research Working Paper No. 4460. Washington, DC: World Bank.
Straub, S., C. Vellutini, and M. Walters. 2008. Infrastructure and Economic Growth in East Asia. World Bank Policy Research Working Paper No. 4589. Washington, DC: World Bank.
Summers, L. 2006. Reflections on Global Account Imbalances and Emerging Market Reserve Accumulation. Presented at L. K. Jha Memorial Lecture, Reserve Bank of India, Mumbai, India. 24 March.
Tanzi, V. 2005a. Building Regional Infrastructure in Latin America. Working Paper Special Initiative on Trade and Integration (SITI) No. 10 IDB and Institute for the Integration of Latin-America and the Caribbean (INTAL). April.
278
Infrastructure for a Seamless Asia
______. 2005b. The Production and Financing of Regional Public Goods. IDB Occasional Paper SITI (June).
______. 2007. Infrastructure Financing: A Review of Selected Issues. Mimeo. Corporacion Andina de Fomento (CAF).
______. 2008. Analysis and Review of Experiences of Latin America and the European Union with Transnational Infrastructure Projects: Lessons for Asia. Background paper prepared for the study Infrastructure and Regional Cooperation. Tokyo: ADBI.
Tanzi, V., and H. Davoodi. 1998. Corruption, Public Investment and Growth. In The Welfare State, Public Investment and Growth, edited by H. Shibatu and T. Ihori. Tokyo: Springer-Verlag.
Teruel, R. G., and Y. Kuroda. 2005. Public Infrastructure and Productivity Growth in Philippine Agriculture, 1974–2000. Journal of Asian Economics 16(3): 555–576.
Tham, S. Y., E. Devadason, and L. W. Heng. 2009. Infrastructure and Trade Costs in Malaysia: The Importance of FDI and Exports. In Infrastructure’s Role in Lowering Asia’s Trade Costs: Building for Trade, edited by D. H. Brooks and D. Hummels. Cheltenham, UK: Edward Elgar Publishing.
United Nations (UN). 2008. World Population Prospects Database (2008 Revision). New York: UN. Available: http://esa.un.org/unpp/.
United Nations Conference on Trade and Development (UNCTAD). 2008. Review of Maritime Transport. Geneva: UNCTAD.
United Nations Economic and Social Commission for Asia and the Pacific (UNESCAP). 2006a. Enhancing Regional Cooperation in Infrastructure Development Including That Related to Disaster Management. New York: UN.
______. 2006b. Technical Cooperation Yearbook. Bangkok: UN.______. 2006c. Priority Investment Needs for the Development of the Asian
Highway Network. New York: UN.______. 2007a. Review of Developments in Transport in Asia and the Pacific
2007. New York: UN. Available: http://www.unescap.org/ttdw/review/files/Review2007_specialissue.pdf.
______. 2007b. Trade Facilitation in Selected Landlocked Countries in Asia. Studies in Trade and Investment No. 58, Trade and Investment Division (TID) UNESCAP Reference No. ST/ESCAP/2437. 18 June.
______. 2007c. Transport and Tourism Issues (Item 6a of the provisional agenda), Organization and Format of A Forum of Asian Ministers of Transport, Bangkok, 12–14 September. Available: http://www.unescap.org/EDC/English/Committee/CMG/CMG4-I/CMG4-I_5E.pdf.

References and Bibliography
279
______. 2008a. Review of Progress in the Implementation of the Almaty Program of Action in the UNESCAP and UNECE Regions: Turning Landlocked Challenges to Land-linked Opportunities. Presented in the Regional Preparatory Expert Group Meeting of Euro-Asian Landlocked Developing and Transit Countries for the Mid-Term Review of the Almaty Programme of Action, Bangkok, 22–23 April.
______. 2008b. Regional Shipping and Port Development—Forecast 2007 Update. New York: UN. Available: http://www.unescap.org/ttdw/Publications/TIS_pubs/pub_2484/pub_2484_fulltext.pdf.
______. 2008c. Economic Cooperation and Regional Integration in the Greater Mekong Subregion. Working Paper 02/08. Bangkok: UNESCAP.
______. 2008d. Theme Topic for the Sixty-Fourth Session: Energy Security and Sustainable Development in Asia and the Pacific (Item 6 of the provisional agenda). Energy Security and Sustainable Development in Asia and the Pacific. Bangkok: UNESCAP. Available: http://www.unescap.org/EDC/English/Commissions/E64/E64_34E.pdf.
______. 2009a. About the Asian Highway. Available: http://www.unescap.org/ttdw/index.asp?MenuName=AsianHighway.
______. 2009b. Trans-Asian Railway: The Three-Stage Development. Available: http://www.unescap.org/ttdw/common/TIS/TAR/tar_home.asp.
______. 2009c. Forum of Asian Ministers of Transport. Available: http://www.unescap.org/ttdw/FAMT/FAMT.asp.
UNESCAP/ADB/United Nations Development Program (UNDP). 2007. The Millennium Development Goals: Progress in Asia and the Pacific 2007. Asia-Pacific Millenium Development Goals (MDG) Study Series October. Bangkok: UNESCAP.
UNESCAP/Asian Institute of Transport Development (AITD). 2007. Toward an Asian Integrated Transport Network. New York: UN. Available: http://www.unohrlls.org/UserFiles/File/LLDC%20Documents/MTR/Toward%20integrated%20highway.pdf.
van der Geest, W., and J. Nunez-Ferrer. 2008a. Appropriate Financial Instruments for Public Private Partnerships to Boost Cross-Border Infrastructure Projects-EU Experience. Background paper prepared for the study Infrastructure and Regional Cooperation. Tokyo: ADBI.
______. 2008b. Managing Multinational Infrastructure: An Analysis of European Union Institutional Structures and Best Practices. Background paper prepared for the study Infrastructure and Regional Cooperation. Tokyo: ADBI.
Venables, A. J. 2006. Shifts in Economic Geography and Their Causes. Federal Reserve Bank of Kansas City. Economic Review, Fourth Quarter. Available: http://www.kc.frb.org/PUBLICAT/ECONREV/PDF/4q06vena.pdf.

280
Infrastructure for a Seamless Asia
______. 2007. Rethinking Economic Growth in a Globalizing World: An Economic Geography Lens. Background paper for Growth Commission UK. March.
Vittas, D. and M. Skully. 1991. Overview of Contractual Savings Institutions, Volume 1. Policy Research Working Paper No. 605. Washington, DC: World Bank.
______. 2008b. Managing Multinational Infrastructure: An Analysis of EU Institutional Structures and Best Practices. Background paper prepared for the study Infrastructure and Regional Cooperation. Tokyo: ADBI.
Vohra, S. 2008. US Concerns Over Iran-Pakistan-India Gas Pipeline. Payvand’s Iran News. 18 June. Available: http://www.payvand.com/news/08/jun/1158.html.
Von Hippel, D. F., and P. Hayes. 2001. Estimated Costs and Benefits of Power Grid Interconnections in North East Asia. San Francisco: Nautilus Institute.
Wang, H., and G. Chen. 2008. Assessment of the Regulatory Frameworks, Policies and Institutions of Cross-Border Infrastructure Projects in Developing Asia. Background paper prepared for the study Infrastructure and Regional Cooperation. Tokyo: ADBI.
Warr, P. 2005. Road Development and Poverty Reduction: The Case of Lao PDR. ADBI Discussion Paper No. 25. Tokyo: ADBI.
Weiss, J. 2003. Infrastructure Investment for Poverty Reduction: A Survey of Key Issues. ADBI Research Policy Brief No. 5. Tokyo: ADBI.
______. 2008. A Framework for Considering Infrastructure for Regional Cooperation. In Infrastructure and Trade in Asia, edited by D. H. Brooks and J. Menon. Cheltenham, UK: Edward Elgar Publishing.
William, J. E., D. Park, S. Jha, J. Jongwanich, A. Terada-Hagiwara, and L. Sumulong. 2008. The US Financial Crisis, Global Financial Turmoil, and Developing Asia: Is the Era of High Growth at an End? ADB Economics Working Paper Series No. 139. Manila: ADB.
Willoughby, C. 2004. How Important is Infrastructure for Achieving Pro-Poor Growth? Paper sponsored by Department for International Development, UK.
Winters, L. A. 2002. Trade Liberalization and Poverty: What are the Links? World Economy 25(9): 1339–1376.
World Bank. 1994. Infrastructure for Development. In World Development Report 1994. Washington, DC: World Bank.
______. 2005. Estimation of Infrastructure Investment Needs in the South Asia Region. Washington, DC: World Bank.
______. 2007a. World Development Indicators CD-ROM 2007. Washington, DC: World Bank.
______. 2007b. The Logistics Performance Index and Its Indicators. In Connecting to Compete: Trade Logistics in the Global Economy. Washington, DC: World Bank.

References and Bibliography
281
______. 2007c. Potential and Prospects for Regional Energy Trade In the South Asia Region. Sustainable Development Department, South Asia Region Formal Report 334/08. Washington, DC: World Bank.
______. 2008a. Potential and Prospects for Regional Energy Trade in the South Asia Region. Formal Report 334/08, Energy Sector Management Assistance Program and South Asia Regional Cooperation Program. Washington, DC: World Bank.
______. 2008b. World Development Indicators CD-ROM 2008. Washington, DC: World Bank.
______. 2009a. Doing Business 2009 Database. Available: http://www.doingbusiness.org.
______. 2009b. Selected World Development Indicators. In World Development Report 2009 Reshaping Economic Geography. Washington, DC: World Bank.
World Economic Forum (WEF). 2001. The Global Competitiveness Report 2001–2002. Geneva: WEF.
______. 2006. The Global Competitiveness Report 2006–2007. Geneva: WEF.
______. 2007. The Global Competitiveness Report 2007–2008. Geneva: WEF.
______. 2008. The Global Competitiveness Report 2008–2009. Geneva: WEF. Available: http://www.weforum.org/pdf/GCR08/GCR08.pdf.
World Health Organization (WHO). 2004. Meeting the MDG Drinking Water and Sanitation Target: A Mid-Term Assessment of Progress. New York: WHO and UN Children’s Fund.
World Resources Institute (WRI). 2009. Energy and Resources Database. Available: http://earthtrends.wri.org/searchable_db/index.php?theme=6.
Zhai, F. 2008. Armington Meets Melitz: Introducing Firm Heterogeneity in a Global CGE Model of Trade. Journal of Economic Integration 23(3, September): 575–604.
______. 2009. Quantifying the Benefits of Regional Infrastructure Investment in Asia. Background paper prepared for the study Infrastructure and Regional Cooperation. Tokyo: ADBI.
Zhang, Z. X. 2008a. Institutional and Policy Frameworks for Sustainable Cross-Border Infrastructure Projects in Asia. Background paper prepared for the study Infrastructure and Regional Cooperation. Tokyo: ADBI.
______. 2008b. Asian Energy and Environmental Policy: Promoting Growth While Preserving the Environment. Energy Policy 36: 3905–3924.
Ziyadov, T. 2008. Azerbaijan. Central Asia-Caucasus Institute. Available: http://www.silkroadstudies.org/new/docs/publications/GCA/GCAPUB-10.pdf.