
Detection of infrared fluorescence of carbon dioxide in R ...

Technology, Computing, and SimulationSection Editor: Jeffrey M. Feldman
Infrared Measurement of Carbon Dioxide in the HumanBreath: “Breathe-Through” Devices from Tyndall to thePresent Day
Michael B. Jaffe, PhD The ability to measure carbon dioxide (CO2) in the breath of a patient orcapnometry, is one of the fundamental technological advances of modern medi-cine. I will chronicle the evolution and commercialization of mainstream capnom-etry based upon infrared measurement of CO2 in the breath using information fromthe historical record and personal interviews with many of the developers.(Anesth Analg 2008;107:890–904)
The ability to measure carbon dioxide (CO2) in thebreath of a patient is one of the fundamental techno-logical advances of modern medicine. The partialpressure of CO2 in arterial blood indicates the balancebetween CO2 production and elimination and pro-vides invaluable insights into metabolism and cardio-pulmonary pathophysiology. Measurement of CO2 inarterial blood is difficult, whereas monitoring CO2 inthe breath provides a convenient, continuous andnoninvasive estimate or trend of arterial CO2. Theclinical motivations for measuring CO2 in the breath ofa patient are myriad. For patients dependent uponmechanical ventilatory support, exhaled CO2 monitor-ing insures the integrity of the airway, helps to guideventilator settings and has dramatically enhanced thesafety of this life-sustaining therapy. CO2 monitoringalso allows us to monitor the severity of pulmonarydisease and the adequacy of the circulation. Measur-ing both oxygen consumption and CO2 production isuseful to evaluate the metabolism of both critically illpatients and elite athletes.
The CO2 molecule’s asymmetric and polyatomicnature causes it to strongly absorb light in the infrared(IR) part of the spectrum. The concentration of CO2 ina gas sample can therefore be measured by shiningIR light on the sample, and comparing the intensity oflight that passes through the sample with the originallight intensity.a The light intensity is reduced as it
passes through the sample in proportion to the con-centration of CO2 present. Translating this theoreticalknowledge into the inexpensive, reliable clinical capnom-eters used daily throughout the world has required almosttwo centuries and countless human-years of work.
Not only is it convenient that CO2 strongly absorbslight in a specific portion of the IR range, the technol-ogy for creating and transmitting the light through acontained gas sample and detecting the transmitted IRlight has enabled real-time respiratory gas monitoring.The “essentials” of nearly all IR gas analyzers are (a) asourceb of IR radiation with an emission spectrum thatincludes the absorption bands of the gases to bemeasured; (b) a sample cell fitted with windows“possessing” suitable transmission properties; (c) anoptical or gas filter to limit the wavelength rangemeasured by the detector; (d) a means, either physicalin the form of a rotating chopper disk or electroniccircuit, to modulate the IR radiation from the source;and (e) a detector, based on either a thermal orphotonic mechanism,c to convert the IR radiation intoan electrical signal. All of these essentials are generallyinexpensive and readily available in modern times butthat has not always been the case. Integrating theseessential aspects for gas measurement into the functionalmonitors we use today has not been a trivial task.
This review presents the history of the IR analysisof exhaled CO2 measurement. Although the earlyhistory is a matter of public record, the more recenthistory is based, in part, on the author’s experience atNovametrix, where he has worked as a scientist since1994.
Accepted for publication April 17, 2008.Conflict of Interest: Dr. Jaffe is employed by Respironics, Inc.Address correspondence and reprint request to Michael B. Jaffe,
PhD, Respironics-Novametrix, LLC., 5 Technology Drive, Walling-ford CT 06492. Address e-mail to [email protected].
Copyright © 2008 International Anesthesia Research SocietyDOI: 10.1213/ane.0b013e31817ee3b3
aIn a number of devices, the intensity of light that is transmittedis compared at two wavelengths, one at which CO2 strongly absorbsand another at which CO2 does not absorb.
bThe most commonly used type of IR source acts as a blackbodyradiator which when heated to moderate temperatures radiates IRenergy.
cThe solid-state devices usually used to detect IR radationinclude lead salt photoconductors (e.g. lead selenide) andthermopiles.
Special Article
Vol. 107, No. 3, September 2008890

Early IR CO2 AnalyzersOne of the earliest IR measurements of CO2 in the
expired human breath was reported by John Tyn-dall.1,2 Tyndall (1820–1893) constructed the first ratiospectrophotometer, which he used to measure theabsorption of gases and vapors such as water vapor,“carbonic acid” (now known as CO2), ozone, andhydrocarbons.3 (Fig. 1). He observed the large differ-ences in the abilities of “perfectly colorless and invis-ible gases and vapors” to absorb and transmit radiantheat and as such played a pivotal role in elucidatingthe physics underlying global warming.5 He reportedin his famous Rede Lecture “On Radiation” at Cam-bridge University perhaps the earliest IR quantitativemeasurement of CO2 in the human breath.d In thesection of the lecture titled “Influence of vibratoryperiod and molecular form-physical analysis of thehuman breath,” he notes:
The presence of the minutest quantity of carbonicacide may be detected by its action on the rays fromthe carbonic oxide flame. Carrying, for example, thedried human breath into a tube four feet long, theabsorption there effected by the carbonic acid ofthe breath amounts to 50% of the entire radiation.Radiant heat may indeed be employed as a means ofdetermining practically the amount of carbonic acidexpired from the lungs . . . . . The absorption producedby the breath, freed from its moisture, but retaining itscarbonic acid, was first determined. Carbonic acid,
artificially prepared, was then mixed with dry air insuch proportions that the action of the mixture uponthe rays of heat was the same as that of the driedbreath. The percentage of the former being knownimmediately gave that of the latter. The same breath,analyzed chemically by Dr. Frankland, and physicallyby Mr. Barrett, gave the following results:
Percentage of Carbonic Acid in the Human Breath
Chemical Analysis Physical Analysis
4.66 4.56
5.33 5.22
It is thus proved that in the quantity of etherealmotion which it is competent to take up, we have apractical measure of the carbonic acid of the breath,and hence of the combustion going on in the humanlungs.1
These measurements were made to demonstratethe sensitivity of different molecules to absorb IRradiation depending upon the radiation source. Sincehuman breath had a significantly higher percentage ofCO2 than the atmosphere, it provided an easy sourceof the gas. Also of interest is the statement of theparadigm dominant in the 1860s of human metabo-lism by Tyndall that the CO2 in the lung is a result ofthe “combustion” (i.e., oxidation) within that organ. Itwas not until a few years later in the 1870s when it wasshown that metabolism occurs in peripheral tissuesand that the blood serves to transport the respiratorygases between the tissues and the lung.f
In the intervening years between Tyndall’s workand the later work of Pfund, Luft, and others, methodsto determine CO2 concentration in the breath based on
jjLeslie’s cube (named after Sir John Leslie who experimentedwith radiant heat in 1804) consists of a cubical vessel with differentsides - one of highly polished metal, another painted black, and theother two consisting of a dull metal (copper). He showed thatradiation was greatest from the black side and negligible from thepolished side.
dNote that the relationship between emission and absorptionspectra was elucidated in the work of Kirchhoff and Bunsen(Kirchhoff G, Bunsen R. Chemical Analysis by Observation ofSpectra Annalen der Physik und der Chemie (Poggendorff) (1860),110:161–189.) it was not until later improvements in instrumentationallowed quantification and visualization of the absorption spectra ofCO2.
eCarbonic acid-Carbon dioxide (CO2).; Carbonic oxide-Carbonmonoxide (CO).; Olefiant Gas- Ethylene (C2H2).6
fEduard Pfluger (1829–1910) and colleagues helped establish thiswith a series of publications between 1866 and 1878 including “onthe origin and rationale of the oxidative processes in the animalorganism.” (Garrison, FH. An Introduction to the History of Medi-cine, W.B. Saunders Company, Philadelphia, 1914 (763 pages)).
Figure 1. Tyndall’s experimental apparatus,shown here consisted of a long tube that he filledwith various gases. To contain the gas, the tubewas capped with rock salt crystal which is trans-parent to heat radiation. To create the incidentlight, a Leslie cubejj was heated and emitted radia-tion that traversed the tube and interacted with thegas before entering one cone of a detector called adifferential thermopile. Radiation from a secondLeslie cube passed through a screen and enteredthe other cone. A galvanometer measured thevoltage difference between the cones. The intensityof the two sources of radiation entering the twocones could be compared by measuring the deflec-tion of the galvanometer. The difference in theintensity of light detected indicated the absorptivepower (concentration) of the gas in the tube(adapted from Tyndall4).
Vol. 107, No. 3, September 2008 © 2008 International Anesthesia Research Society 891
chemical absorptiong using substances such as potas-sium hydroxide were refined and widely used.7,8
Additionally, physical methods other than IR ap-proaches for CO2 measurement were developed in-cluding ones based on thermoconductivity.9
In 1939, August Herman Pfund (1879–1949) devel-oped a respiratory gas analyzer that was used at JohnsHopkins Hospital in Baltimore to measure carbonmonoxide and CO2.10,11 Pfund described this thermalmethod of CO2 measurement as “mak(ing) possiblecontinuous analysis without disturbing the mixture,”in contrast to chemical methods that destroy thematerial under test.10 The detector cell was filled witha mixture of 3% CO2 and 97% dry air. A gas samplewas passed into an absorption cell and, if no CO2 waspresent in the sample, the radiation would be ab-sorbed in the detector cell and the increase in tempera-ture would be measured by the thermopile. Thepresence of CO2 in the absorption cell would causeless radiation to be absorbed in the detector cell andtherefore a smaller increase in temperature.
Working at about the same time as Pfund, KarlFriedrich Luft (1909–1999) developed IR technologythat used a balanced condenser microphone detectorconsisting of sealed cells containing pure CO2 sepa-rated by a diaphragm. This kind of detector, nowknown as the Luft cell, can be traced to the photo-acoustic effect first observed by Bell12 and demon-strated at the Paris Exposition in 1880. This storybegins in 1937 when Luft joined BASF, which origi-nally stood for Badische Anilin-und Soda-Fabrik (Ba-den Aniline and Soda Factory). At BASF, he wasconfronted with a measurement problem.13 Plasticfabrication resulted in a highly explosive mixture ofbutane and air. A method to measure low concentra-tions of butane was desired to make this process safer.It was observed that butane has strong absorption inthe IR band, but that known photometric methods ofthe time failed since they were too strongly affected byinterfering gases in the mixture such as CO2 and watervapor. Luft postulated that the gas itself could be a“radiation receiver” that would have the necessaryselectivity required to differentiate the gases in themixture. He collaborated with Lehrer who had justsuccessfully developed a recording IR spectrophotom-eter which led to development of a device usinggas-filled detectors (Fig. 2).h The superiority of thenew device over existing electrochemical devices con-vinced even the factory chemists who were skepticalabout using a device based on physical principles. Thisdevice, known as the URAS (Ultrarot Absorptions-Schreiber-IR absorption writer), consisted of a powersupply, optics and amplifiers, which were packaged inelectrical switching boxes bolted together. Despite
gThe reduction of the gas volume was measured and indicatedthe quantity of the gas absorbed.
hIn 1943 Luft published his often-referenced paper on the devicein Zeitschrift fur Technische Physik14 and he and Lehrer wereawarded a patent (filed in 1938) on the technology.15
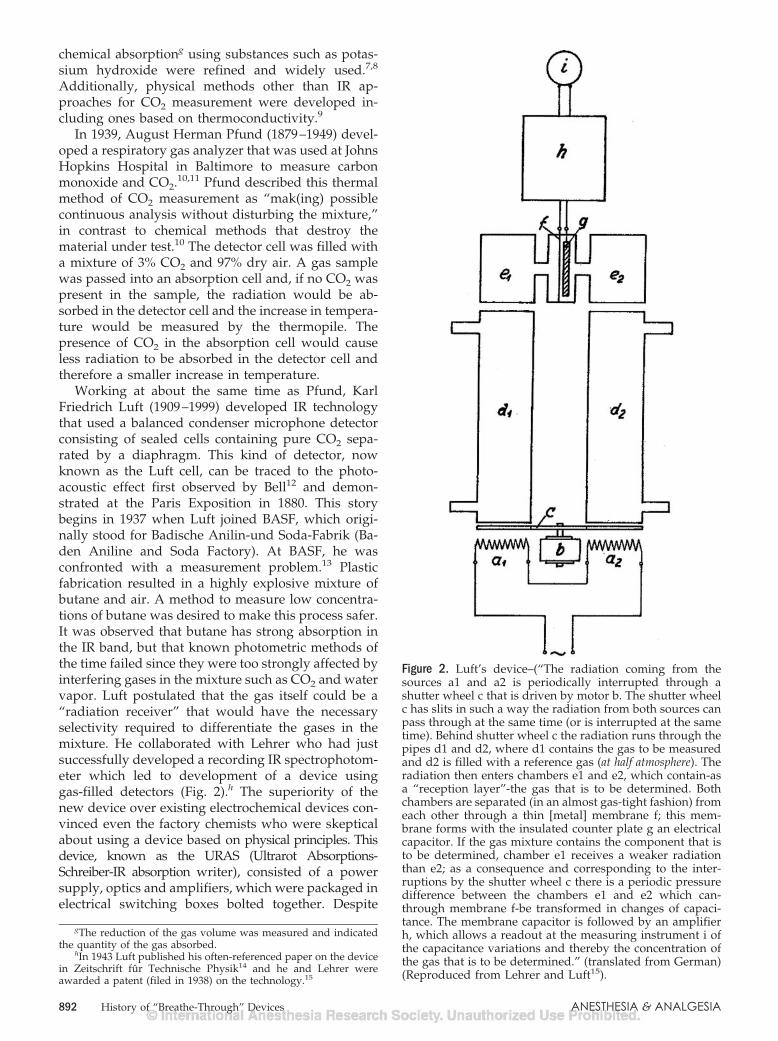
Figure 2. Luft’s device–(“The radiation coming from thesources a1 and a2 is periodically interrupted through ashutter wheel c that is driven by motor b. The shutter wheelc has slits in such a way the radiation from both sources canpass through at the same time (or is interrupted at the sametime). Behind shutter wheel c the radiation runs through thepipes d1 and d2, where d1 contains the gas to be measuredand d2 is filled with a reference gas (at half atmosphere). Theradiation then enters chambers e1 and e2, which contain-asa “reception layer”-the gas that is to be determined. Bothchambers are separated (in an almost gas-tight fashion) fromeach other through a thin [metal] membrane f; this mem-brane forms with the insulated counter plate g an electricalcapacitor. If the gas mixture contains the component that isto be determined, chamber e1 receives a weaker radiationthan e2; as a consequence and corresponding to the inter-ruptions by the shutter wheel c there is a periodic pressuredifference between the chambers e1 and e2 which can-through membrane f-be transformed in changes of capaci-tance. The membrane capacitor is followed by an amplifierh, which allows a readout at the measuring instrument i ofthe capacitance variations and thereby the concentration ofthe gas that is to be determined.” (translated from German)(Reproduced from Lehrer and Luft15).
892 History of “Breathe-Through” Devices ANESTHESIA & ANALGESIA

using common components, the war effort limited thesupply of parts. To further complicate matters, themanufacture of these detector cells was considered tobe a very tedious and delicate process. Despite all ofthe problems, BASF was able to manufacture severalhundred devices for use in manufacturing in I.G.Farbenindustrie chemical factories, although a num-ber of these devices were destroyed during air bom-bardments.13 These devices were deemed sufficientlyvaluable that many were confiscated by the Alliedpowers after the war.
At the same time as Luft, Veingerov (1938),16 at theState Optical Institute of Leningrad under A.A.Lyebyedyev (1893–1969), designed a series of early gasanalyzers based on the detection of pressure fluctua-tions relating to the varying IR absorption in the gassample. He referred to these analyzers as ‘optico-accoustic’ gas analyzers.
Commercial Medical IR CO2 AnalyzersAs pulmonary physiology and metabolism became
better understood in the 1900s, a convenient methodfor measuring CO2 in the breath and avoiding theneed for direct arterial measurement was sought.The ability to measure CO2 by IR absorption waswell established, but early devices were too largeand impractical for clinical use. Advancements inboth mainstream and sidestream clinical deviceswere enabled by technology developments. The sizeof these devices was reduced to allow their inclu-sion in clinical monitors and the known technologi-cal and related ease of use weaknesses of the earlydevices were solved. The story behind the develop-ment of these early devices and several of theoriginal equipment manufacturer (OEM) main-stream CO2 devices is told based primarily uponinterviews with key contributors to each of thesedevices. The story behind some of the CO2 sensorsfrom Hartmann and Braun, Liston-Becker/Beckman,Cascadia/Novametrix/Respironics, Hewlett-Packard,and Siemens-Elema will be discussed. Other deviceswill also be mentioned.
Hartmann and Braun/GodartAt the end of 1952, Hartmann and Braun acquired
the trademark and license to manufacture and distrib-ute the URAS device from BASF.13 The Luft detector isshown in Figure 2 and is described as in the originalGerman patent. Representative systems using the Luftdetector included the Hartmann and Braun URASseries of instruments and Godart capnographsi17 (Fig.3), a modification of the URAS4.18 These systems werewidely used for CO2 measurement in clinical settingsin the 1960s and 1970s.
Liston-Becker/Beckman InstrumentsThe story of the development and commercializa-
tion of breathe-through IR CO2 devices would not becomplete without a discussion of the contributions ofMax Liston, who had worked with Prof. Pfund atJohns Hopkins during the Second World War. Prof.Pfund had conceived of and had patents on both theLuft type detector-pneumatic type using thermo-couples and negative typej using gas filters.11 Al-though Liston was aware of the concept of the Lufttype detector, it was not until after the war that hebecame aware of Luft’s work.
I was at the army chemical research center inBethesda-we were working on some IR applicationsfor target detection-they took me around and showedme—these instruments—they did not know what theywere—I immediately recognized them as positive typeinfrared analyzers—that is how I became aware ofLuft devices. What I saw was quite primitive-twoboxes source with mechanical chopper-windows wererock salt and were attached with Apiezonk
wax.—quite a few built during the war in the syn-thetic rubber industry—chopper rate very slow—like4 Hz.19l
Max describes how he got into the gas analyzerbusiness.
“Dr. [James] Elamm and Dr. George Saxton [workingout of Drinker Laboratory, Harvard Medical School],two of the doctors that I worked with on the Oximeter
iPreviously termed IR CO2 meters or analyzers from the 1950sand into the early 1970s, it appears that the term “capnograph” wasderived from the Godart Capnograph.
jNegative filtering typically uses the difference in absorptionbetween 100 percent of gas A in one chamber and the “unknown”sample gas mixture containing gas A in another chamber.
kLow melting point wax.lAt a data sampling rate of 4 Hz it is difficult to resolve
breath-to-breath changes.mThis story from Dr. Elam’s perspective (1918–1995) has been
told as well20 and discusses how these devices helped Dr. Elam andcolleagues discover a problem with canisters of the day, identifythree characteristics of CO2 absorption with respect to these canis-ters, report on the property of channeling21 in soda lime and howthey modified the canisters to minimize this effect.
Figure 3. The first CO2 analyzer (Godart Capnograph medi-cal CO2 analyzer) in the Central Military Hospital, Utrecht,The Netherlands (1962). On top is the one channel Omnias-criptor,. Photo: Lt. Klunder (Photo used with permissionfrom Prof. Bob Smalhout).
Vol. 107, No. 3, September 2008 © 2008 International Anesthesia Research Society 893

during the war, and some of the other doctors (e.g.,Dr. Whittenbergern) had been down in Atlantic City ata convention, [and during a dinner] got into anargument. All of them had experienced [shock and]some cardiac arrests on the operating table. Thesewere anesthesiologists. They thought it was due toCO2 [carbon dioxide] accumulation. So they [drove upto Connecticut to my home] and got me out of bed attwo o’clock in the morning and in my weakenedcondition at that time, talked me into building a CO2
analyzer for them so they could resolve this concern.That’s how I happened to get into the gas analyzerbusiness. I had just left Perkin-Elmer at the time so Iwas looking for something to do . . . . The first CO2
analyzer was sent to Dr. Drinker’s lab under Dr.Whittenberger at Harvard University.19
In 1950, Morris Folb and Max Liston formed theListon-Folb company in Stamford (Springdale), Con-necticut. The company later became the Liston-Beckercompany with the financial backing of Dick Beckerand Albert Austin. The first prototype device (precur-sor to the Model 16) was a breath-through arrange-ment. Max recounts:
We took 3/4“ copper tubing and smashed it down themiddle to give us (a) flat (area for the) windows [about1/10” between windows] and that plugged directlyinto the face mask of the subject. Originally we usedthin quartz windows but later I got in contact withUnion Carbide which were making sapphire for pho-nograph needles, and they occasionally they wouldget a bouleo which was large enough for a window-and I had arrangement with them so I got their fullproduction-I had a monopoly of their sapphire forquite a few years and Union Carbide were the onlyones making it in the early 1950s (Max Liston, 2004).
The light source was incandescent, micro type wire,potted in ceramic which ran at a fairly low tempera-ture, and mechanically chopped at 60 Hz with a Luftdetector. This prototype introduced in about 1951 was“received with quite little interest” and was soldprimarily to universities for research such as Harvard.Max describes one setback:
Dr Stowp published on an infrared unit that he haddeveloped22 and said it was no good because of whathe called the Stow effect23 if you put the sensor in aNitrous oxide background you got a different readingthan you got if you put it in a nitrogen/air back-ground. Pressure broadening–Thought he discovereda new phenomena-that hurt our sales because at thattime nitrous oxide was used for induction at very highlevels-80%. However, it did not affect the Luftdetector-particularly the way we were charging thembecause our resolution was so high the so called Stoweffect was negligible Dr Elam finally published apaper refuting Stow and that brought the business
back. Elams [classic] four papers were with ourinstruments.24 –27
The only improvement of the Model 16 over thefirst design was that it was smaller. The Liston-BeckerGas Analyzer and it successor designs (Model 28, 30)consisted of a “pickup” unit (the portion containingthe IR bench) and “control” unit. The pick-up unit,located near the patient’s head, was sealed and couldbe pressurized with air to prevent ambient gases fromentering the pick-up unit, therefore making it safe foruse with “explosive” anesthetic gas mixtures.29
While the early devices included breath-throughsystems (Figs. 4 and 5), catheter sampling (i.e., side-stream) (Fig. 6) became more prevalent.q Liston de-scribed how the use of his CO2 analyzer helped toimprove the management of patients’ ventilation oniron lungs and thereby reduced mortality:
The objection to the breath-through system that wehad was the instrument was so large that it obscuredthe anesthesists view of the face that they reliedon-color, facial reactions during the surgery-so theyobjected to that-as far as the surgical application goes.Catheter sampling came as the result of the work ofAffeldtr and Farr at Rancho Los Amigos in Downey,California. They were working on the polio situation-the mask not suitable-so we developed the catheterapproach for them which became the preferredmethod of sampling (Fig. 7).30 In the-mid 1950, theynJames Whittenberger chaired of the Department of Physiology
at Harvard School of Public Health from 1948 to 1980.oA single-crystal ingot produced by synthetic means.pRichard W. Stow, Ph.D. Associate Professor of Physical Medi-
cine, OH State University, Columbus, OH; 1916–1995.
qDifferent sampling methods pictured in Figure 7.rJohn E. Affeldt, medical director 1957–1964, Rancho Los Amigos
Respiratory Center for Poliomyelitis, Hondo, CA.
Figure 4. Schema of pick-up box of rapid infrared carbondioxide analyzer. Gas flowing through sampling tube trans-verse one infrared path, causing pressure difference be-tween carbon dioxide filled detector and reference cells(Reproduced from Elam et al.24, with permission).
894 History of “Breathe-Through” Devices ANESTHESIA & ANALGESIA

published a very favorable report which noted that thetime on Drinker respirators31 dropped in half afterusing that [device] to adjust their respirators-the fatal-ity rate dropped by 30% on polio subjects-equipped all7 of the polio foundation bulbar polio centers with theModel 16 (Fig. 8) (Max Liston, 2004).
The next big break we got was that the polio foundationdecided to equip all their polio centers with our ana-lyzer, and that was quite successful. In fact, their curerate doubled after they started. What they had beendoing with these Drinker-type, what the press called,“Iron Lungs” is adjusting them for normal tidal volumesfor their weight. When they’re paralyzed, their metabo-lism is way down, so they were blowing all of thesepatients into alkalosis. When they got the analyzer, theycould control the carbon dioxide and keep it to normal
levels.s Their success rate with patients and time in theIron Lungs dropped in half and the death rate droppedin half. So that was a very successful program.19
In 1955, the financial backers of the company,Albert Austin and Dick Becker agreed to sell Liston-Becker Company to Beckman Instruments. The Liston-Becker Model 16 was renamed the LB-1 (Fig. 9).
It is interesting to note that the LB-1 was originallyintended for use in operating rooms where ether andcyclopropane were commonly used anesthetics. As asafety precaution, it also included a pressure actuatedswitch that disabled power to the pick-up unit if thepressure decreased precipitously. The LB-1 was alsosold with a separate sample pump, which was in-tended to permit its use outside the operating room.t
Its successor, the LB-2 (and LB-3u), included techno-logical improvements that replaced the vacuum tubeswith solid-state circuitry.
Liston and his friend Miles Lowell of Edwards,having recently sold his company to American Hos-pital Supply [in 1966], were interested in pursuingother ventures and formed Liston-Edwards Corpora-tion with the purpose of providing an IR analyzer tothe pollution monitoring field. In the mid 1970s,Liston-Edwards decided to make a medical gas ana-lyzer, marketing OEM versions of a CO2 analyzer andanesthetic agent analyzer. In 1980, Liston-Edwardshad one flagship customer, Electronics for Medicine,v
sAffeldt et al notes “Because of the relationship between alveolarventilation and alveolar carbon dioxide . . ., the alveolar carbonconcentration is the best means of determining the ventilatory statusof the patient. It eliminates the need of estimating the requiredminute volume and thus allows accurate adjustment of the respira-tory pressures and rates.33
tAllen Norton, 2003, personal communication.uLB-3 510(k) #K782138, cleared 01/31/1979.vMarquette later acquired Electronics for Medicine in 1995;
Marquette itself was later acquired by General Electric.
Figure 5. Different early breathe-through connections on CO2analyzer to patient. (a) Liston-Becker CO2 meter in expira-tory gas stream and Stephen-Slater nonrebreathing valve(Reproduced from Ref. 28, with permission from Philadel-phia, Lippincott). They note the carbon dioxide meter mustbe as close to the patient and respiratory valve as possible, tominimize dead space (Reproduced from Eckenhoff et al.,32
with permission). (b) Partial rebreathing system (Repro-duced from Elam and Brown,27 with permission).
Figure 6. Fractional sampling with the rapid infrared CO2analyzer. The sample is pumped from the airway throughthe catheter and analyzer. The CO2 in each chamber of thedetector absorbs specific portions of the infrared spectrum,heating each chamber equally if no CO2 is present in thesample. When CO2 is present in the sample, the chambersare heated unequally, causing displacement of the dia-phragm. The degree of displacement is detected electricallyand recorded (Reproduced from Collier et al.,34 withpermission).
Vol. 107, No. 3, September 2008 © 2008 International Anesthesia Research Society 895

and provided an early sidestream CO2 module for acardiac monitor. Liston Scientific continued until re-cently with Max at the helm to make gas monitoringdevices for environmental applications.w
Hewlett-Packard CorporationThe story of the development of the Hewlett-
Packard’s (HP) mainstream CO2 gas sensor is part ofthe overall story of HP’s entrance into medical devices. It isalso a story of adapting technology developed for
wListon Scientific, Irvine, CA was acquired by CA AnalyticalInstruments (CAI), Orange, CA.
Figure 7. Sampling methods of infrared alveo-lar CO2 analysis (Reproduced from Collier etal.,34 with permission).
Figure 8. Rapid infrared CO2 analyzer arranged as a portableunit. Upper left, catheter and pick-up unit; table top, ampli-fier and recorder; lower left, pump and flowmeter; lower,high pressure tanks for calibration mixtures (Reproducedfrom Collier et al.,34 with permission).
Figure 9. Beckman LB-1 Sensor Head with detector assemblyremoved. Chopper visible in center of photo (Photo courtesyof Max Liston).
896 History of “Breathe-Through” Devices ANESTHESIA & ANALGESIA
automotive applications to medical applications. Thisstory is presented as told by both of its projectmanagers (Jacob Wong), who led its development atHP Laboratories (Palo Alto, CA) and brought it to thenewly established medical division in Waltham, and(Rodney Solomon) who took the product from proto-type to a manufacturable product.
Jacob Wong started working in about 1967 at HPLabs, which was established in 1966 as the company’scentral research facility. At HP Labs’ inception, itsprimary areas of research included solid-state physics,physical electronics, electronics, and medical andchemical electronics instruments. In the early 1970s,there was a greater recognition of the problem of airpollution from automobiles and HP Labs received alarge contract from General Motors to design anexhaust gas analyzer to measure carbon monoxide,CO2, methane, hydrocarbons, and nitric oxide. Whenthe device was demonstrated, the sensor worked wellbut only if it was cooled with liquid nitrogen whichturned out to be a big problem.
We were saved by one of the lawyers at HP-he lookedthrough the contract and observed that the contractnever said it had to operate at ambient temperature-somebody forgot to specify that—so if it operated atliquid nitrogen temperatures we would still beOK—so obviously General Motors was not veryhappy—nobody was very happy—but the fact of thematter is that we went away and spent their moneyand learned a lot. It was right after that we were askedby Mr. Hewlett since we spent all this money is thereanything we can use from that technology (JacobWong, 2005).
From the remnants of an automotive program, theidea of a medical CO2 sensor was born. The group atHP Labs had the theoretical understanding of IRabsorption of all the gases and Jacob Wong was askedto spearhead a program to develop a medical CO2
sensor. When the development of the medical CO2
sensor started, HP had already developed its well-known eight wavelength ear oximeter.35
HP had recently entered the medical field with thepurchase in 1961 of Sanborn Company, Waltham,Massachusetts. Bill Hewlett’s vision for Sanborn wasto be the foundation of the HP medical division.Sanborn had an electrocardiograph and HP was goingto refine the technology. The medical division ideawas solidified with Lew Plattx as the engineeringmanager and Dean Mortony as the divisional man-ager. It was the late 1960s and 70s and HP took risksthus paving the way for monitoring devices that arenow considered commonplace.
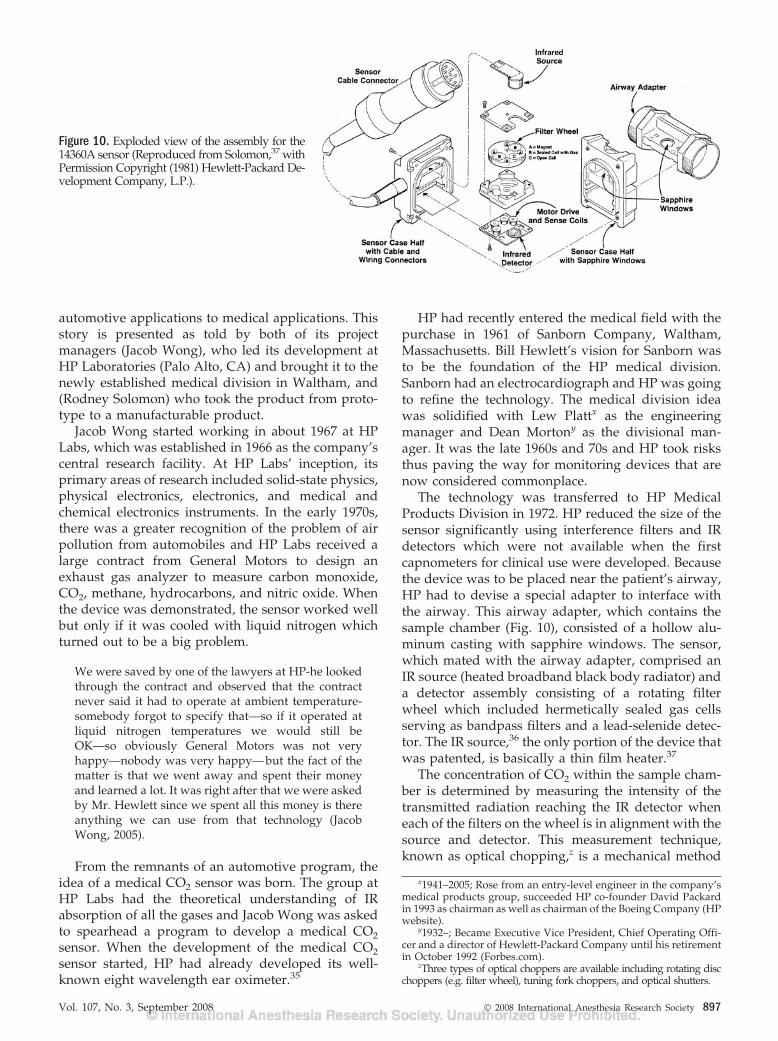
The technology was transferred to HP MedicalProducts Division in 1972. HP reduced the size of thesensor significantly using interference filters and IRdetectors which were not available when the firstcapnometers for clinical use were developed. Becausethe device was to be placed near the patient’s airway,HP had to devise a special adapter to interface withthe airway. This airway adapter, which contains thesample chamber (Fig. 10), consisted of a hollow alu-minum casting with sapphire windows. The sensor,which mated with the airway adapter, comprised anIR source (heated broadband black body radiator) anda detector assembly consisting of a rotating filterwheel which included hermetically sealed gas cellsserving as bandpass filters and a lead-selenide detec-tor. The IR source,36 the only portion of the device thatwas patented, is basically a thin film heater.37
The concentration of CO2 within the sample cham-ber is determined by measuring the intensity of thetransmitted radiation reaching the IR detector wheneach of the filters on the wheel is in alignment with thesource and detector. This measurement technique,known as optical chopping,z is a mechanical method
x1941–2005; Rose from an entry-level engineer in the company’smedical products group, succeeded HP co-founder David Packardin 1993 as chairman as well as chairman of the Boeing Company (HPwebsite).
y1932–; Became Executive Vice President, Chief Operating Offi-cer and a director of Hewlett-Packard Company until his retirementin October 1992 (Forbes.com).
zThree types of optical choppers are available including rotating discchoppers (e.g. filter wheel), tuning fork choppers, and optical shutters.
Figure 10. Exploded view of the assembly for the14360A sensor (Reproduced from Solomon,37 withPermission Copyright (1981) Hewlett-Packard De-velopment Company, L.P.).
Vol. 107, No. 3, September 2008 © 2008 International Anesthesia Research Society 897

of periodically interrupting a light beam which iseffective for eliminating electronic ”drift“ in the detec-tor and the system electronics. The filter wheel drivenby a motor drive rotates at sufficiently high angularvelocity permitting 40 measurements per secondthrough each filter wheel element. The filter wheelincludes three separate elements through which IRradiation passes of which one is an opening in thefilter wheel and the other two are sealed gas cells, areference gas sample containing a known concentra-tion of CO2 and a cell with only nitrogen (Fig. 10).
The device was connected via a cable to one of theearliest microprocessor-based instruments. Motorolahad just introduced the 6800 microprocessor (1975)and HP was given the opportunity to use this micro-processor. Jacob notes
We were all fighting for it-Waltham medical divisionfought for it and we won that right because of LewPlatt. We got the 2nd prototype system from Motorolaand it was used to develop the capnometer (JacobWong, 2005).
They designed the 6800 microprocessor into the47210A Capnometer. The first microprocessor systemas a development system was quite clumsy at the timeand used five separate boards: I/O board, RAM/ROMboards, central processing unit and power supplyboards.
Jacob left HP in 1978 and returned to the WestCoast to work at Hughes Aircraft’s Santa BarbaraResearch Center. Rod Solomon then served as projectmanager for the capnometer. Rod notes that theyspent a few years tuning the basic concept, but that thefoundation laid by HP labs during Jacob’s tenure wassubstantial. The primary focus of the last two years of
the development cycle was to reduce sources of errorand variability in the design so it could be more easilymanufactured. The problems worked on included cellfilling, which was required so they could get an exact filterfor CO2 rather than using a narrow band optical filter.Most current NDIR CO2 sensor designs use bandpass,lowpass and/or high pass optical filters of the typeknown as interference filters.aa
Other problems included getting the wheel to rotateevenly in order to remove output signal jitter, tem-perature control and overall robustness of the sensor,particularly the filter wheel, in the clinical environ-ment. The filter wheel being dropped was consideredprimarily a manufacturing cost issue. Figure 6 fromthe HP Journal paper37 showed two of the four rubberbumpers placed in corners of transducer housing toact as shock absorbers. It was noted that this alludes towhat Dr. Smalhout39,40 stated ”gravity is twice asstrong in the hospital than anywhere else and im-plored us to do the best we could to make it rugged.”
The HP Journal article37 on this device provides anextraordinary amount of disclosure on processes anddesign of a medical device. Rodney notes that “wewere encouraged to write articles for the journal-it’shard to believe in today’s environment this wouldnever happen. This article is basically a treatise onhow to build a competitive device.”
This device38 remains one of the most successful ofits type with perhaps 50,000 of these transducersmanufactured and sold. It served as the “gold stan-dard” for medical CO2 sensors for more than a decadesince its introduction in the early 1980s.
aaInterference filters consist of multiple thin layers of dielectricmaterials with different refractive indices.
Figure 11. CO2 Analyzer 930 with Servo Ven-tilator 900 (Reproduced from Ref. 41, withPermission Copyright (1981) MAQUET Criti-cal Care AB.).
898 History of “Breathe-Through” Devices ANESTHESIA & ANALGESIA

Siemens-Elema ABThe story of the development of the Siemens-Elema
AB mainstream CO2 sensor41–43 (Fig. 11) and itsassociated Model 930 CO2 analyzer, the first commer-cial volumetric capnograph, is presented as told byRolf Castor, a scientist who was closely tied to theproject (Castor Rolf, 2004/5). In the early 1970s, RolfCastor started working in the medical industry, afterreceiving an MSc in applied Physics (Lund University)and a short stint at Ericsson, he joined the Elema-Schonander company, famous for the Mingographelectrocardiogram inkjet recorder and the implantablepacemaker. He worked in a group of four headed bySven-Gunnar Olsson, the father of the Servoventila-tor.44 Olsson asked Rolf if he believed they could makea small, fast CO2 analyzer since, to Mr. Olsson, noth-ing was impossible. With no company library at hisdisposal, he consulted available IR textbooks of theday45–48 at the local university. At this early stage inthe product development, Rolf notes there was an“old” guy, Gabriel Tchang, in the company sittingnearby him who was developing a colorimeter forblood hemoglobin.49 Although this product was con-sidered outside of the Elema business area, he had acontract with the company and Rolf was asked ifGabriel could be of some help. So, Mr. Gabriel Tchangentered the scene with valuable knowledge in analyz-ing instruments and a long experience in analogelectronics.
Rolf notes that no acceptable off-the-shelf motorswere available at that time and, as small size was veryimportant, they developed a kind of “tuning fork”chopperbb which resulted in an inconvenient longchopper design which determined the length of thehousing (Fig. 11). The first transducer prototype andan electronic box with an analog meter was developedand powered from the Servoventilator. This handbuilt prototype was used clinically for some time andis now in the museum at Lund University.
The device, intended for use with the 900 Servoven-tilator (SV) series of ventilators, assumed that inhaledair had a low and stable CO2 level that could be usedfor reference and that timing and respiratory phaseinformation was known from the “mother” SV900device. The reference signal (i.e., considered a fixedvoltage) and the continuous signal were used to createa linear signal and the output was available both as a“continuous signal as well as the peak and endexpiratory values.”50cc The result was that CO2 con-centration could be displayed as a function of time aswell as the instantaneous peak and end expiratory
values. The device was marketed as the “CA 130”dd
but was never a commercial success.Sven-Gunnar, working with Prof. Bjorn Jonsson
and Dr. Lars Nordstrom at the Lund University hos-pital, continued further system development whichresulted in the Model 930 module. This module wasintegrated with the SV series of ventilators and re-ported CO2 minute elimination, the effective andineffective tidal volumes, and effective ventilation andtidal elimination. Rolf notes that this project was aninteresting task for the analog engineer given that“everything had to be solved with the now matureopamp technology,” because microprocessors werenot yet available.
In about 1976, Siemens-Elema began shipping CA930 units for sale. With the analog recorder outputsprovided from the rear of the unit and the values onthe panel display, Rolf notes it was considered anideal tool for researchers. Together with the SV, theCA 930 created a methodological platform for researchand an everyday tool for the clinician that was widelyused in Europe. Although few reached the UnitedStates’ “everyday clinic,” researchers throughout theworld found a versatile tool.
Cascadia Technology Corporation/Respironics-Novametrix, LLC
The story of the development of the Respironics-Novametrix mainstream CO2 sensor is presented astold by Les Mace and Dan Knodle who (along withtwo others) co-founded Cascadia Technology Corpo-ration which developed the original Capnostat main-stream CO2 sensor. This author (and many others) havecontinued the development at Novametrix, Inc (andnow Respironics-Novametrix, LLC) since joining thecompany in 1994.
In the late 1970s Les was at Physio-Control (Red-mond, WA) and was invited to join a startup in theSeattle area by Ralph Astengo formerly the founder ofATL. Les notes that
We stumbled across a technology for respiratorymonitoring for sleep apnea based on acoustic styletechnology that did not work well but we were veryinterested in the market and began looking for themost direct method to measure breathing and whatwe came up with was an inexpensive way to measureexhaled CO2 (Les Mace, 2005).
That was the beginning of Trimed, which wasorganized in 1981 for the “development, manufacture,and marketing of monitoring instruments for themedical field.” At Trimed they developed a qualita-tive CO2 detector based on non-dispersive IR (NDIR)technology consisting of a simple incandescent lightbulb as a source, a lead selinide (PbSe) detector, andCO2 bandpass filter. The sensor was non-ratiometric,not chopped and had a tendency to drift. Because the
bbThe tuning fork choppers are fixed frequency electromechani-cally driven light choppers. Vanes attached to moving tines of a forkmodulate a light beam.
ccRolf notes for those that have closely studied the schematicmay notice that there is possibility to disconnect the device and useit external power supply without ventilator for spontaneouslybreathing patients. ddCO2 Monitor 130 510(k) K802459 cleared 10/23/1980.
Vol. 107, No. 3, September 2008 © 2008 International Anesthesia Research Society 899

primary interest was in the measurement of respira-tion rate, quantitative measurements were not impor-tant and it was introduced in an infant respirationmonitor.ee A quantitative sidestream analyzer with arotating chopper wheel and the associated disposableswere also developed and cleared for marketing. Thisincluded the Model 126 sample line,ff with extendedlife, using for the first time NAFION® in a braidedshield so it could be easily manipulated.gg After 3years of funding their new start up, Trimed’s parentcompany, Integrated Circuits Inc., a hybrid circuitmanufacturer (including thermal print heads), pulledthe plug and gave the division 4 months to find abuyer.51,52 Trimed’s assets were finally sold to aMidwest-based company, Biochem International (nowknown as BCI). The founders of TriMed found them-selves unemployed, but they still believed in thetechnology and subsequently put together a team at anew company called Cascadia Technology Corpora-tion in order to build a quantitative system that was atrue ratiometric, chopped and stable NDIR system.Further research led to the development of the pulsedthermal broadband IR source still being used today inRespironics-Novametrix capnometers.
In 1985, Cascadia Technology Corp was founded byLarry Labuda as VP of Production, Dan Knodle as VPof Research, Bob Lamson as Chief Executive Officerand Les Mace as Chief Operations Officer. Les noteshe was the first and only full-time employee for abouta year. Once Cascadia Technology was started, thefounders realized that they needed to build an IRsource with sufficient IR energy and very low thermalmass that could also be pulsed on/off at rates of up to100 Hz. This quickly led them to the use of lowthermal mass, thick film technology similar to thatfound in thermal print heads.
The pulsed thermal IR source technology was aresult of some early work the founders did using thickfilm technology while at ICI. Trimed engineers hadoriginally attempted to develop a stable and robust IRemitter (to replace the incandescent light bulb), butquickly realized this was not an easy task. Les notes:
There was a lot of chemistry going on-we had to pulsethis thing in a bipolar fashion so that we did notget migration of the ionic components of thechemistry-we worked heavily with the thick filmmanufacturer to optimize the ink chemistry for thisparticular application. It was not optimal for a normalthick film application where you wanted long termthermal stability. We were overstressing this thing-heating it up to 600°C�700°C-which was much be-yond what most people said we could do (Les Mace,2005).
A number of sources and ideas have appeared sincethis device was developed, all with their pros andcons, but the pulsed thermal source turned out to beone of the optimum devices. It could be made veryinexpensively, is very robust and could be pulsed in abi-or unipolar fashion at relatively low power levelswith sufficient IR output.53 As did other manufactur-ers of mainstream devices, Cascadia’s founders spentthe early days of Cascadia (and later as employees ofNovametrix) refining the IR source to make it easier tomanufacture, more shock insensitive and with higheroptical output. Les notes:
We initially thought to develop a sidestream CO2
sensor and someone said if you could develop a lowpower source without any mechanical moving parts-why aren’t you doing mainstream-the more I lookedat mainstream the more I found this was a niche thatneeded a better solution and which had considerableapplication advantages over sidestream (Les Mace,2005).
Other mainstream CO2 sensor solutions at the timeincluded Siemens-Elema (Solna, Sweden), which useda mechanical tuning fork chopper, and HP (Waltham,MA), which used a rotating wheel. Each of thesedevices had their own respective problems, includingaccuracy and durability. While at Trimed, thefounders looked very closely at the HP Journal article(describing their mainstream sensor) and subse-quently met Jacob Wong (see HP section); this ledthem to thinking there was an opportunity for im-proving the mainstream application. Les notes:
The HP sensor, although very good, did have anAchilles heel-it was subject to damage and breakage ifyou dropped it. Our goal was to develop a solid statesensor that was “bullet proof,” and we were eventu-ally successful at accomplishing this task. This gave usa huge market advantage over other fragile sensorslike HP (Les Mace, 2005).
When Les was at Trimed he met clinicians from St.Joseph’s Hospital in Bellingham WA, Phil Nuzzo andIvan Bustamante. Phil, a licensed respiratory carepractitioner, had previous experience as a user ofListon-Becker, Beckman and other devices and hadpreviously written papers on capnography.54,55 Philnotes that his interest in capnography started in theearly 1970s during his tenure at University of South-ern California County hospital with the developmentof a neonatal sidestream capnometer. Working withCavitron (Santa Ana, CA), a sidestream bench with anadjustable sampling rate between 0 cc/min to 300cc/min was developed. Humidity proved to be aproblem since the sampling system was prone towater accumulation, so a method of dehumidicationwas sought. They bought unsheathed tubes of a fragilewater permeable membrane (NAFION) from Dupontwhich they wrapped in a three foot coil and thisproved to be effective. Given the uniqueness and
eeModel 511, 510(k) # K833397, cleared 11/28/83.ffOne of the first to build oral and nasal sampling cannulas with
NAFION.ggTri-Med Model 126 Sample Line w/extended life NAFION
510(k) # K850746 – later assembled by PermaPure.
900 History of “Breathe-Through” Devices ANESTHESIA & ANALGESIA

scarcity of the device, the capnograph was used pri-marily in a spot-checking manner and for applicationssuch as ventilator management and asthma screening.Great care had to be taken with using the devicesavailable. For example, due to the long warm-up timeand vibration sensitivity of the Beckman LB-1 head,the head was placed on a piece of foam for increasedstability, and on a large and portable cart, withcalibration gases and large batteries to keep poweralways applied. Phil moved north to Washington statein 1979. A few years later after the founders startedCascadia, Phil, then a product manager at Novame-trix, called Les to see what progress was being madeon their CO2 sensor (Fig. 12). As Les recounts:
Mike Polson, Novametrix’s director of engineering atthe time, paid us a visit and peaked under our skirts.Two weeks later Bill Lacourciere, president of No-vametrix, came out and the rest is history. It only took15 years . . . a lot of Edisonian experimentation, it stillhas a lot of promise . . . and remains very well suitedfor medical capnography (Les Mace, 2005).
In 1987, Cascadia licensed their technology to No-vametrix Medical Systems and in 1989 they were pur-chased by Novametrix (now Respironics-Novametrix,LLC). A number of the staff remained on in Redmond,WA as a sensor development group for Novametrixuntil the facility was eventually closed in 2001.
Additional innovations to the sensor included in-creased performance and accuracy under conditionsof optical window contamination by the use of acoaxial optical design56 (Fig. 13). The next generationCapnostat mainstream CO2 sensor continues todaywith the introduction of the Capnostat 5 mainstreamCO2 sensor, a sensor that leverages on the latestdevelopments in micro-electronics to create a fullfunctional capnometer within the sensor housing.
Others CompaniesThe stories of two additional companies are of
interest both from the technological perspective aswell the inter-relationships between them and thecompanies previously highlighted.
Square One,hh a design firm founded in late 1987 byJim Braig and Dan Goldberger, developed a main-stream device smaller than the HP device as they werenot happy with the capabilities of existing solid statedevices and also wanted to develop sources withlonger IR wavelengths to be able identify and quantifyanesthetics. Jim Braig, a veteran in the gas analysisbusiness, also spent some time before this ventureworking with Max Liston57 and also for Nellcor. Jimwent to work at Nellcor for the sole purpose ofbuilding their second generation technology, theN-1000 multi-gas monitor.58 Jim notes “It gave Nellcorthe second technology to let it go public-they weretold at the time that oximetry wasn’t enough-it gotthem public and their second technology.” SquareOne developed a mainstream solid state non-modulated technology for Critikon59 that was notmanufactured.
Pryon’s development of a mainstream device wasdescribed by Dan Knodle. Pryonii had developed amainstream device based upon the HP capnometerthat used a chopper wheel on the detector with sealedcells. They reduced the size of the chopper wheel in aneffort to make it less sensitive to shock. However, theywere still using an incandescent lamp as a source. Ifthe device was dropped, the filament would move andthe device would be out of calibration. In the mean-time, Dan was pursuing an electrochemical sensorwith his firm Evergreen Sensor Technology Corpora-tion. Unfortunately, this project ran out of funds sothey started looking for consulting work. About thesame time, a company that they had previously vis-ited, Pryon, called and asked if Evergreen SensorTechnology Corporation would be interested in work-ing with them. Pryon sought to develop a solid statesource to replace the incandescent lamp. Dan notesthat to make a thick film resistor work under theconditions they had was an extreme challenge giventhat the power supply had a “wide power distribu-tion.” Dan Knodle and Tom Clary developed thesource with sufficient IR light output at the lowestcurrent input level, yet still able to plug into thehighest power opportunity and still work. They alsobuilt the manufacturing facility that could make thesource60 for Pryon (later sold to Pryon). In 1994, Pryonbegan manufacturing the SC-300 CO2 Monitor, astand-alone instrument that incorporates both main-stream and sidestream CO2 monitoring modalities.Pryon designed and manufactured a stand-alone in-strument, the N-6000 UltraCap, for Nellcor PuritanBennett incorporating Nellcor Puritan Bennett’soximetry and Pryon’s mainstream CO2 monitoringcapability.61
hhSquare One which was sold to OSI Systems later became partof Dolphin Medical.
iiincorporated in April 1988, co-founded by Daniel F. Carstenand Robert H. Ricciardelli who was also a principal in the startup ofBiochem International; On July 10, 1996, the Protocol completed theacquisition of Pryon Corporation.61
Figure 12. Original prototype Capnostat CO2 sensor andairway adapter (Image courtesy of Respironics, Inc., Mur-rysville, PA.).
Vol. 107, No. 3, September 2008 © 2008 International Anesthesia Research Society 901

The reader should also be aware of the contribu-tions of other companies with a long history in gasmeasurement including Andros which introduced in1994 the Model 4210 On-Airway Carbon Dioxidesensor,62 Draeger (Germany) with the on-airway Cap-nolog D sensor,63 Nihon Kohden (Japan) which hasoffered both qualitative and quantitative mainstreamdevices,64 Instrumentarium (Finland),65 and otherswhich have not published widely or in the Englishlanguage. Companies in the former Soviet Unionmanufactured a number of analyzers for continuousCO2 monitoring in humans including the GUF-2 pho-toelectric gas analyzer, GUKh-2 chemical gas analyzerand GUM series of IR analyzers.66 The GUM-2 andGUM-3 CO2 analyzers were manufactured by theSmolensk Measuring Instrument Plant and de-signed by “Medfizpribor” Special Technical DesignOffice (SKTB). In addition, the G-1 gasograph wasprovided so that CO2 and volume data could becombined.
Modern IR DevicesBoth mainstream (nondiverting) and sidestream
(diverting) gas measurement technologies have foundclinical applications for monitoring both intubatedand nonintubated subjects. The vast majority of instru-ments (both mainstream and sidestream) in clinicaluse rely on IR-based technologies. However, in thepast, other sidestream technologies have been usedand include mass spectrometry, photoacoustic andRaman spectroscopy. Of these, only mass spectrom-eters found relatively wide clinical use. The magneticsector with fixed detectors and the quadrupole massspectrometers have been the predominant types.These instruments have been used either as a dedi-cated instrument providing continuous monitoring ofsingle patients or as a shared instrument (multiplexed)providing discontinuous monitoring of several pa-tients in sequence. In particular, the most well-knownmanufacturer of such devices for clinical use wasPerkin-Elmer.
Figure 13. Cross-section of solid-state main-stream device employed in Capnostat II frompatent (Reproduced Mace et al.56) showingsource 134, mirror 140, beam splitter 286, detec-tors 270/272 and filters 302/304.
Table 1. Representative Commercial Mainstream Infrared CO2 Analyzers Used Clinically (from 1950s Through Present)*
Manufacturer (location) Model Features of interest1950s, 1960s, and 1970s
Liston-Becker (Springdale, CT) 16 Total sampling (i.e. mainstream) using 7/8 inch tubingwith 90% response time of 50 msec
1980sHewlett-Packard (Waltham, MA) M14360A† Mainstream, solid state source, chopper wheel on
detectorSiemens-Elema (Solna, Sweden) Model 930‡ Mainstream integrated with 900 series ventilatorsCascadia Technology Corp.§
(Redmond, WA)Capnostat® Mainstream, all solid-state design with thick film
source1990s
Andros Analyzers (Berkeley, CA) Breathwatch� Model 4210 Mainstream design with IR lamp sourceNovametrix Medical Systems
(Wallingford, CT)Capnostat® II, III Mainstream, smaller versions of previous generations
Pryon Corp� (MenomoneeFalls, WI) SC-300 Mainstream, all solid state design2000s
Respironics-Novametrix(Wallingford, CT)
Capnostat® 5 Mainstream, all signal processing in on-airway sensorhead
* Table adapted from Gravenstein et al.67
† Several other models marketed as well including the 47210A and 78345A.‡ Also marketed the PCO2 cartridge and Model 130.§ Acquired by Novametrix Medical Systems, Inc.� Acquired by Protocol Systems and Protocol acquired by Welch-Allyn.Model name may list either the monitor name or sensor name (if mainstream), also ordering within decades approximate to year of product introduction, sources include Medical Electronics,various years, medical literature and company product literature. Trademarks are property of their respective owners.
902 History of “Breathe-Through” Devices ANESTHESIA & ANALGESIA

Today, IR-based capnometers are finding their wayinto a wide range of platforms including multiparam-eter monitors used throughout the hospital, criticalcare and transport ventilators, anesthesia machinesand defibrillators with monitoring capabilities. Theymay be found integrated into bedside units, andhand-held units often in conjunction with pulse oxim-etry as well as stand-alone units. A greater number ofclinical organizations, including those in anesthesia,critical care, respiratory care and emergency medicine,are either mandating or strongly recommending theuse of capnography. Volumetric capnography (thecombination of capnography and volume) is alsofinding greater application both in ventilated andnonventilated patients.
Currently marketed mainstream capnometers arebased upon either solid-state electronically pulsedsources and solid-state detectors (e.g., Respironics,Draeger, Nihon Kohden) or filter-wheels with solid-state detectors (Phase-In). Most sidestream devicesuse solid-state sources which are either electronicpulsed or mechanically chopped and solid-state detec-tors, with the exception of a hermetically sealed gassource excited by a high voltage radio frequencyelectromagnetic field (Oridion) and dispersive IR(multi-gas) spectrometer (LumaSense Technologies,formerly Andros). Many of the anesthesia machinesuse multi-gas benches (either of their own design orfrom an OEM).
CONCLUSIONSThe history of IR CO2 gas measurement technology
has been presented from the viewpoint of a number ofthe original developers (Table 1). It has more than acentury of development, but measuring CO2 in therespiratory gas can now be accomplished using cost-effective, reliable devices. This technology has becomean integral part of patient care worldwide and isfundamental to patient safety. Future technologicalimprovements in gas measurements promise greatersensor robustness, and the ability to monitor multiplegases and extract information from these measure-ments to support both diagnosis and therapy.
ACKNOWLEDGMENTSThe contributions to this article of following people who
have served in various key roles in the development of thistechnology are acknowledged: Jim Braig of Optiscan (formerlyof Square One); Rolf Castor (retired) formerly of Siemens-Elema; Dan Knodle (formerly of Cascadia Technology Cor-poration and Evergreen Sensor Technology Corporation);Max Liston (retired) of Liston Scientific (formerly of Liston-Becker and Beckman Instruments); Les Mace (retired) formerly ofNovametrix Medical Systems; Phil Nuzzo of Respironics,Inc., Rodney Solomon of Philips Medical; and Jacob Y. Wong,PhD, of Airware, Inc. (formerly of Hewlett-Packard).
This article is dedicated to the memory of Allen Norton,PhD, who passed away in the Fall of 2004. I have been proud
to know Allen, a former colleague of mine at BeckmanInstruments, Inc. and Sensormedics, Inc. for nearly the past25 yr and to call him my friend.
REFERENCES
1. Tyndall J. On radiation. The “Rede” lecture delivered in the Senate-House before the University of Cambridge on Tuesday, May 16, 1865.London: Longman, Green, Longman, Roberts & Green. 62 p
2. Tyndall J. Fragments of science for unscientific people – a seriesof detached essays, lectures and reviews. New York: D. Appleton andCompany, 1874
3. Tyndall J. On the transmission of heat of different qualitiesthrough gases of different kinds. Proc R Inst G B 1859;3:155–8
4. Tyndall J. Heat-a mode of motion. 6th ed. New York: D.Appleton and Company, 1890
5. Burchfield JA. John Tyndall-a biographical sketch. In JohnTyndall, essays on a natural philosopher. Dublin, Ireland: RoyalDublin Society, 1981
6. Eklund J. The incompleat chymist: being an essay on theeighteenth-century chemist in his laboratory, with a dictionaryof obsolete chemical terms of the period. Smithsonian studies inhistory and technology, number 33. Washington, DC: Smithso-nian Institute Press, 1975
7. Haldane JS. Methods of air analysis. London: Griffin, 19128. Haldane JS, Priestley JG. Respiration. 2nd ed. London: Oxford,
19359. Daynes HA. Gas analysis by measurement of thermal conduc-
tivity. Cambridge, UK: University Press, 193310. Pfund AH. Apparatus for detecting and measuring hetero-
atomic gases. US Patent 2,212,2111. August 20, 194011. Pfund AH, Gemmill CL. An infrared absorption method for the
quantitative analysis of respiratory and other gases. Bull JohnsHopkins Hosp 1940;67:61–5
12. Bell AG. Upon the production of sound by radiant energy. Am JSci 1880;20:305–24
13. Luft KF, Schaefer W, Wiegleb G. 50 Jahre NDIR-Gasanalyse (50years NDIR gas analysis). Tm Technisches Messen 1993;60:363–71
14. Luft K. Uber eine neue Methode der registrierenden Gasanalysemit Hilfe der Absorption ultraroter Strahlen ohne spektraleZerlegung. Ztschrf Techn Phys 1943;24:97–104
15. Lehrer E, Luft K. Verfahren zur Bestimmung von Bestandteilenin Stoffgemischen mittels Strahlungsabsorption. Patentschrift(Process for determining the components of mixtures throughradiation absorption) Nr. 730,478. Ausgegeben am 14 January1943
16. Veingerov ML. Eine Methode der Gasanalyse beruhend aufdem optisch-akustischen Tyndall-Rontgeneffekt. Dokl AkadNauk SSSR 1938;19:687–8
17. Blackburn JP, Williams TR. Evaluation of the Datex CD-101 andGodart Capnograph Mark II infra-red carbon dioxide analysers.Br J Anaesth 1980;52:551–5
18. Cormack R, Powell JN. Improving the performance of theinfra-red carbon dioxide meter. Br J Anaesth 1972;44:131–41
19. Max D. Liston, interviews by David C. Brock and Gerald E.Gallwas at Irvine, California and Fullerton, California, 19 Feb-ruary 2002 and 22 January 2003 Philadelphia: Chemical Heri-tage Foundation, Oral History Transcript #0252
20. Sands RP, Bacon DR. An inventive mind: the career of James O.Elam, M.D. (1918–1995). Anesthesiology 1998;88:1107–12
21. Elam JO. Channeling and over packing in carbon dioxideabsorbers. Anesthesiology 1958;19:403–4
22. Stow RW. An infrared analyzer for carbon dioxide and itsapplication to certain problems in respiratory physiology.Ph.D.Thesis. Minneapolis: University of Minnesota, 1952
23. Stow RW. A systematic error in infrared analysis for carbondioxide in respiratory gas analysis. Fed Proc 1952;11:155
24. Elam JA, Brown EL, Ten Pas RH. Carbon dioxide homeostasisduring anesthesia. I. Instrumentation. Anesthesiology 1955;16:876–85
25. Elam JA, Brown EL. Carbon dioxide homeostasis during anes-thesia. II. Total sampling for determination of dead space,alveolar ventilation, and carbon dioxide output. Anesthesiology1955;16:886–902
26. Elam JA, Brown EL. Carbon dioxide homeostasis during anes-thesia. III. Ventilation and carbon dioxide elimination. Anesthe-siology 1956;17:116–28
Vol. 107, No. 3, September 2008 © 2008 International Anesthesia Research Society 903

27. Elam JA, Brown EL. Carbon dioxide homeostasis during anes-thesia. IV. An evaluation of the partial rebreathing system.Anesthesiology 1956;17:129–34
28. Stephen CR, Slater HM. Nonresisting, nonrebreathing valve.Anesthesiology 1948;9:550
29. Siebecker KL, Mendenhall JT, Emanuel DA. Carbon dioxide inanesthetic atmospheres as measured by the Liston-Becker (infra-red absorption) gas analyzer. J Thorac Surg 1954;27:468–76
30. Crane MG, Affeldt JE, Austin E, Bower AG. Alveolar carbondioxide levels in acute poliomyelitis. J Appl Physiol 1956;9:11–8
31. Drinker F, Shaw LA. An apparatus for the prolonged adminis-tration of artificial ventilation. J Clin Invest 1929;7:229–47
32. Eckenhoff JE, Helrich M, Hege MJ. A method for studyingrespiratory functions in awake or anesthetized patients. Anes-thesiology 1956;17:66–72
33. Affeldt JE, Collier CR, Crane MG, Farr AF. Ventilatory aspectsof poliomyelitis. Curr Res Anesth Analg 1955;34:41–53
34. Collier CR, Affeldt, JE, Farr AF. Continuous rapid infrared CO2
analysis; fractional sampling and accuracy in determining al-veolar CO2. J Lab Clin Med 1955;45:526–39
35. Hayes TJ, Merrick EB. Continuous, non-invasive measurementsof blood oxygen levels. Hewlett Packard J 1976;28:2–10
36. Bridgham JA. Infrared Radiation Source. US Patent 3,875,413.Issued April 1, 1975
37. Solomon RJ. A reliable, accurate CO2 analyzer for medical use.Hewlett Packard J 1981;32:3–21
38. Kinsella SM. Assessment of the Hewlett-Packard HP47210Acapnometer. Br J Anaesth 1985;57:919–23
39. Smallhout B. Capnografie. Thesis, University of Utrecht, TheNetherlands: A. Oosthoek Publ. Co., 1967
40. Smalhout B, Kalenda Z. An Atlas of Capnography. 2nd ed. TheNetherlands: Kerckebosche Zeist, 1981:163p
41. CO2 Analyzer 930-operating manual. 2nd ed. Solna, Sweden:Siemens-Elema AB Ventilator Division, S-17195, 1981
42. Fletcher R, Werner O, Nordstrom L, Jonson B. Sources of errorand their correction in the measurement of carbon dioxideelimination using the Siemens-Elema CO2 Analyzer. Br J An-aesth 1983;55:177–85
43. Olsson SG, Fletcher R, Jonson B, Nordstom L, Prakash O.Clinical studies of gas exchange during ventilatory support–amethod using the Siemens-Elema CO2 analyzer. Br J Anaesth1980;52:491–9
44. Ingelstedt S, Jonson B, Nordstrom L, Olsson SG. A servo-controlled ventilator measuring expired minute volume, airwayflow and pressure. Acta Anaesthesiol Scand Suppl 1972;47:7–27
45. Herzberg G. Atomic Spectra and Atomic Structure. 2nd ed. NewYork: Dover Publications, 1944
46. Kruse PW. Elements of infrared technology. New York: JohnWiley & Sons Inc, 1962
47. Wolfe William F. The Infrared Handbook. Michigan: Environ-mental Research Institute of Michigan for the Office of NavalResearch Dept. of Navy, 1978
48. Burch DE, Gryvnak DA, Williams D. Total absorptance ofcarbon dioxide in the infrared. Appl Opt 1962;1:759–65
49. Tchang, Gabriel. Photometer for determining the oxygen con-tent of blood. US Patent 3,802,776, Issued April 9, 1974
50. Olsson SG, Castor R, Tchang, G. Arrangement for drift compen-sation in a gas analyzer US Patent 4,067,320, Issued January 10,1978
51. “Integrated Circuits to cease operations in medical products.”Wall Street J, November 28, 1984
52. Jalenan W. Facing losses, ICI pulls the plug on strugglingTri-Med. Seattle Business J 1984
53. Knodle D, Graham PK, Labuda LL. Infrared source. US Patent5,369,277. 1994
54. Nuzzo PF. Capnography in infants and children. Pediatr Nurs1978;30–8
55. Nuzzo PF, Anton WR. Practical applications of capnography.Respir Ther 1986;12–17
56. Mace LE, Labuda LL, Apperson GR, Cooke WA, Sams JO.Infrared radiation detector units and methods of assemblingtransducers in which said units are incorporated. US Patent5,793,044. 1998
57. Braig JR, Liston MD. Infrared gas analyzer using count quadra-ture sampling. US Patent 4,586,026. Issued April 29, 1986
58. Corenman JE, Braig JR, Goldberger DS, Rojas EP, Stone JH.Multichannel gas analyzer and method of use. US Patent4,817,013. 1989
59. Yelderman M, Goldberger DS, Braig JR. Optically stabilizedinfrared energy detector. US Patent 5,081,998. 1992
60. Knodle DW, Clary TR. Nondispersive infrared radiation source.US Patent 5,602,398. 1997
61. Joint Proxy Statement of Protocol Systems Inc., and PryonCorporation, 1996
62. Drucker S, Goder A, Khalili D, Williams K, Christensen K, MajorE. Respiratory gas analyzer. US Patent 5,464,982. 1995
63. Zander R, Mertzlufft F. [Checking the precision of capnometers]Anasthesiol Intensivmed Notfallmed Schmerzther 1992;27:42–50
64. Yamamori S, Hosaka H, Ono K, Ito M, Inoue M, Sugiura M.Capnometer. US Patent 5,728,585. 1998
65. Tammisto T. Historic perspective of CO2 monitoring in Scandi-navia. J Clin Monit 1990;7:91–2
66. Abdrakhmanov MI. Current state of medical gas analysis in-struments and prospects for development. Biomed Eng1970;4:1–5 (Translated from Meditsinskaya Tekhnika, No. 1, pp.3–8, January–February, 1970)
67. Gravenstein JS, Jaffe MB, Paulus DA (eds). Capnography:clinical aspects. Cambridge, UK: Cambridge University Press,2004:441
904 History of “Breathe-Through” Devices ANESTHESIA & ANALGESIA


![Dynamic Image Prediction Using Principal Component and ... · teer breath hold, beam tracking, tracking with fiducial or infrared markers etc [2]. Long-term breath. -hold tech- ...](https://static.fdocuments.us/doc/165x107/5eb7d3c1cc13dd14e9599e65/dynamic-image-prediction-using-principal-component-and-teer-breath-hold-beam.jpg)


