
INFRARED-BRIGHT GALAXIES IN THE MILLENNIUM SIMULATION AND CMB CONTAMINATION DANIEL CHRIS OPOLOT DR....
11
INFRARED-BRIGHT GALAXIES IN THE MILLENNIUM SIMULATION AND CMB CONTAMINATION DANIEL CHRIS OPOLOT DR. CATHERINE CRESS UWC
-
Upload
kelley-mcbride -
Category
Documents
-
view
220 -
download
0
Transcript of INFRARED-BRIGHT GALAXIES IN THE MILLENNIUM SIMULATION AND CMB CONTAMINATION DANIEL CHRIS OPOLOT DR....
INFRARED-BRIGHT GALAXIES IN THE MILLENNIUM SIMULATION AND CMB CONTAMINATION
DANIEL CHRIS OPOLOT
DR. CATHERINE CRESS
UWC

Aims and objectives
To use supercomputer simulations to model the distribution of infrared (IR) emitting galaxies using the correlation between star-formation rate and IR luminosity
Apply the result to high resolution surveys (Atacama Cosmology Telescope) to correct for contamination by IR sources on CMB observations:
SZ cluster surveys

Infrared-bright galaxies
Contain a lot of dust Star forming galaxies Optical photons from
young stars are absorbed by dust, reradiated at
longer wavelength (IR) IR wavelength is btn 1-
1000μm, far-IR btn 40-1000 μm
Up to 90% of radiation from star forming galaxies
is far-IR
http://www.paulandliz.org/SpitzerTelescope
Optical, 24 micrometers, and a multi-wavelength, 24 (blue), 70 (green), and
160 (red) microns images of Andromeda galaxy (M31).

Cosmic microwave background (CMB) & science from clusters
The CMB has been travelling toward us for over 10 billion
years. Looking out in the sky, we are looking back in time;
observing the CMB the way it was at the time of last
scattering.
http://map.gsfc.nasa.gov/resources/
The growth of high-mass clusters frominitial Gaussian fluctuations depends strongly on the cosmologicalParameters.
• Bahcall and Fan, 1998, PNAS, 95
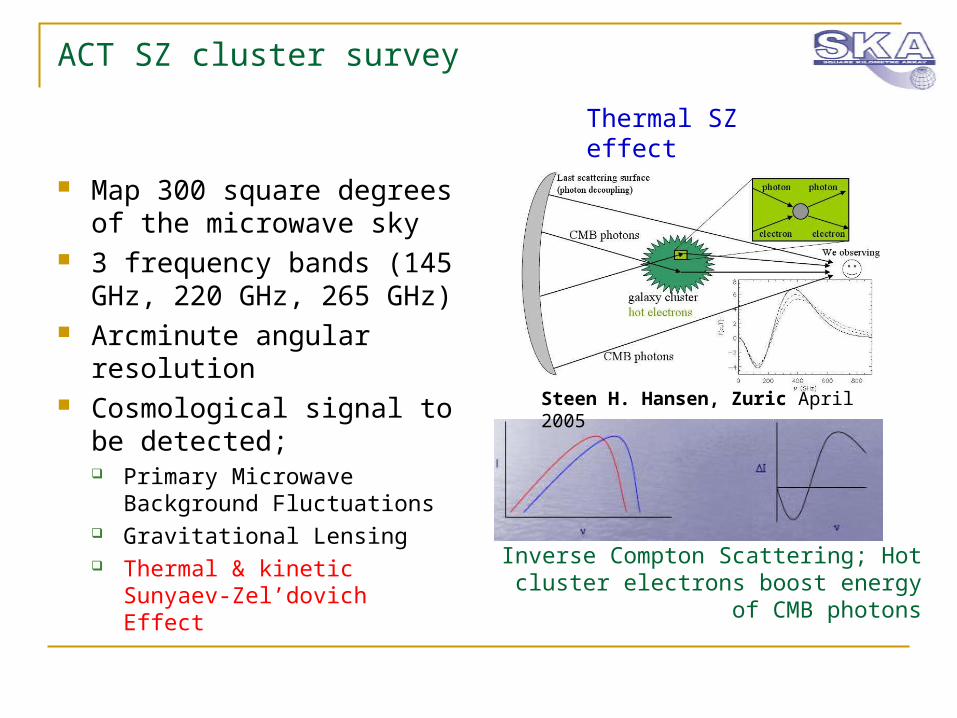
ACT SZ cluster survey
Map 300 square degrees of the microwave sky
3 frequency bands (145 GHz, 220 GHz, 265 GHz)
Arcminute angular resolution
Cosmological signal to be detected; Primary Microwave
Background Fluctuations Gravitational Lensing Thermal & kinetic Sunyaev-
Zel’dovich Effect
Inverse Compton Scattering; Hot cluster electrons boost energy of
CMB photons
Thermal SZ effect
Steen H. Hansen, Zuric April 2005

SZ cluster survey
Thermal SZ Effect redshift independent, proportional to neT (cluster mass), probes cluster pressure
We observe signals from clusters of a given mass & redshift bin
Where
And
i jM z
ij dMdz
dNdzdMN
zMdM
dnz
dzd
dVzzM
dMdz
dN,,
Number of clusters for a commoving volume element dV/(dzdΩ) for a solid angle dΩ on sky
zMdM
dn, Number density of objects between M
and M+dM at z. This is what we compute for in the simulation box (millennium simulation).

SZ cluster survey
The main foreground contaminants at these frequencies are the infrared (far-infrared; dusty) point sources.
Galaxies in rich clusters have low sfr – low IR fluxes/Lum We compute the total contribution to IR of dusty galaxies within
the clusters, and the potential of the whole cluster being a contaminant.
The flux limits are typically,
2
'1104.0
KmJyS
2'
'1103.0
KmJyS
At about 220 GHz
At 350 GHz
SZ contaminants
The aim here is to model clusters with mass, M>Mcut (min. mass of a cluster that can be detected by the survey)=2x10¹⁴ Msun, within the survey redshift range, that are capable of contributing to the SZ signal.
Methodology; Total the sfr Compute the bolometric IR Lum Compute the monochromatic (350 GHz in this case) Lum using the
SED templates Compute the corresponding fluxes (redshift is known-luminosity dist.) Use the flux cuts to sort out the contaminants Construct the number density of the contaminants Model with redshift and subtract their effect/contribution
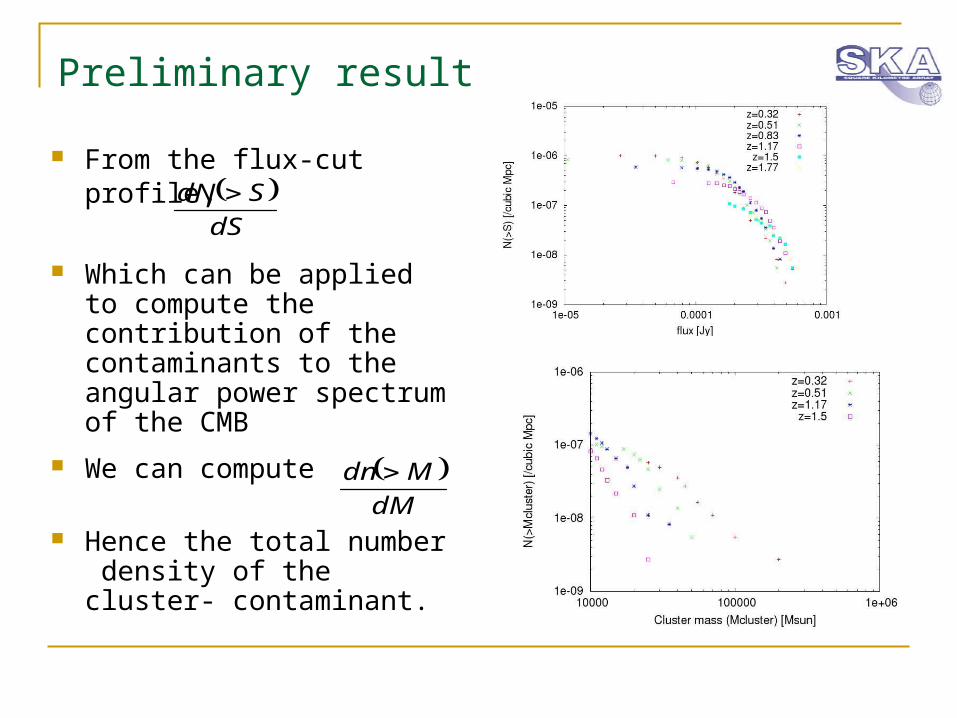
Preliminary result
From the flux-cut profile,
Which can be applied to compute the contribution of the contaminants to the angular power spectrum of the CMB
dS
SdN
We can compute
Hence the total number density of the cluster- contaminant.
dM
Mdn

Preliminary result
The total number density of clusters with flux cut of S(350GHz)≥0.25mJy
Peaks at around z=1.0
If kSZ effect is considered – many clusters will be 100% contaminated
Thermal SZ will have contamination mostly at high z.

Conclusion
Though the main contribution to infrared fluxes from clusters is the galaxy components, which are known to have suppressed star formation (low IR Lum), their total contribution in the cluster cannot be neglected.
The number density of the contaminants increases with z and drops off after z~1. This is because there are few clusters at high z that satisfy the mass limit even if the sfr in clusters increases with z.
Thermal SZ cluster surveys are more affected by cluster contaminants, as redshift increases. Most significant at z >0.8


![PowerPoint Presentation · Tanzania WATERFORD KAMI-ILABA UWC Eswatini UWC . uWC E]NISHING HIGH scã00L IN' Wc E IN THE . uWC FOR WORLD PEACE.& uWC U'UWC IMAÇINE FINISHING SCHOOL](https://static.fdocuments.us/doc/165x107/5fa9c919cbc95373cb1f03db/powerpoint-presentation-tanzania-waterford-kami-ilaba-uwc-eswatini-uwc-uwc-enishing.jpg)